Article

Surface CO2 Exchange Dynamics across a Climatic Gradient in McKenzie Valley: Effect of Landforms, Climate and Permafrost

1
Natalia Startsev. Canadian Forest Service, Northern Forestry Centre, 5320 122 Street, Edmonton, AB T6H 3S5, Canada
2
Biometeorology and Soil Physics Group, University of British Columbia, Vancouver, BC V6T 1Z4, Canada
*
Author to whom correspondence should be addressed.
Forests 2016, 7(11), 279; https://doi.org/10.3390/f7110279
Submission received: 26 July 2016 / Revised: 3 November 2016 / Accepted: 5 November 2016 / Published: 15 November 2016
(This article belongs to the Special Issue Nutrient Cycling and Plant Nutrition in Forest Ecosystems)

Abstract

:
Northern regions are experiencing considerable climate change affecting the state of permafrost, peat accumulation rates, and the large pool of carbon (C) stored in soil, thereby emphasizing the importance of monitoring surface C fluxes in different landform sites along a climate gradient. We studied surface net C exchange (NCE) and ecosystem respiration (ER) across different landforms (upland, peat plateau, collapse scar) in mid-boreal to high subarctic ecoregions in the Mackenzie Valley of northwestern Canada for three years. NCE and ER were measured using automatic CO2 chambers (ADC, Bioscientific LTD., Herts, England), and soil respiration (SR) was measured with solid state infrared CO2 sensors (Carbocaps, Vaisala, Vantaa, Finland) using the concentration gradient technique. Both NCE and ER were primarily controlled by soil temperature in the upper horizons. In upland forest locations, ER varied from 583 to 214 g C·m−2·year−1 from mid-boreal to high subarctic zones, respectively. For the bog and peat plateau areas, ER was less than half that at the upland locations. Of SR, nearly 75% was generated in the upper 5 cm layer composed of live bryophytes and actively decomposing fibric material. Our results suggest that for the upland and bog locations, ER significantly exceeded NCE. Bryophyte NCE was greatest in continuously waterlogged collapsed areas and was negligible in other locations. Overall, upland forest sites were sources of CO2 (from 64 g·C·m−2·year−1 in the high subarctic to 588 g C·m−2·year−1 in mid-boreal zone); collapsed areas were sinks of C, especially in high subarctic (from 27 g·C·m−2 year−1 in mid-boreal to 86 g·C·m−2·year−1 in high subarctic) and peat plateaus were minor sources (from 153 g·C·m−2·year−1 in mid-boreal to 6 g·C·m−2·year−1 in high subarctic). The results are important in understanding how different landforms are responding to climate change and would be useful in modeling the effect of future climate change on the soil C balance in the northern regions.

1. Introduction

Northern regions have experienced considerable climate change during the last few decades, affecting the substantial pool of soil carbon stored in the permafrost [1,2,3]. Regions exposed to these changes are in many respects fragile and may undergo significant ecological alterations including permafrost thawing, potential release of fossil methane, and decomposition of previously frozen peat. More than one third of the planetary soil organic C is stored in the permafrost area [4,5], therefore assessing and forecasting of the carbon (C) storage dynamics in this pool has a major impact on the understanding of global C balance. Particular interest in this case lies in the monitoring of the changes in the surface CO2 flux, and climate-driven changes in the permafrost status and peat accumulation rates. These changes are sensitive to local landforms and soil microclimate variations.
Effects that warming, and lengthening of the growing season, have on the C pool in the northern areas are multifaceted. On one hand, increases in temperature, depth of active soil layer, and length of growing season increase the rate of C loss from the soil; on the other hand, the same factors, aided by potential CO2 fertilization effects, can increase the assimilation rate of the plants and hence biomass production [6]. A large amount of C stored in the soil in northern regions is evidence that assimilation rates continuously exceed of ecosystem respiration. The primary reason for this positive net C exchange (NCE) is lower decomposition rates of soil organic C due to low soil temperatures, soil waterlogging, and permafrost. The increase in mean annual air temperature affected soil temperatures, increasing the depth of the active layer, and escalating organic matter decomposition and thus ecosystem respiration, thereby shifting the NCE balance from carbon accumulation to degradation of stored carbon [7]. The implications of this shift include a release of vast amounts of carbon to the atmosphere in response to a comparatively minor increase in mean annual soil temperature [1,8].
Soil microbial activity response to changes in soil temperature varies depending on the temperature range. In the frozen soil layers at the temperature well below zero and with biological activity nearly non-existent [5,9], an increase of a few degrees Celsius would not change the carbon balance significantly as long as the soil stays frozen. However, in soil layers above freezing point, similar increase in soil temperature would cause an exponential increase in decomposition and ecosystem respiration [7,10]. The most appreciable effect of the climate change on the carbon balance can be expected in the areas of the zonal boundaries where relatively small changes in the soil temperature signify the difference between the frozen and thawed state influencing soil water regime, permafrost degradation, and ground subsidence, thereby resulting in a nearly instantaneous rise in CO2 production.
Thawing of the permafrost follows a complex pattern of more intricate localized conditions than ecoclimatic gradient [11]. Areas affected by the permafrost frequently have a mosaic of landforms with locations of distinctly different soil moisture and temperature regimes in close proximity. Some of the most common landforms in the permafrost-affected areas include forested uplands, lichen-dominated peat plateaus, and collapse features of different origins. They differ in vegetation, allocation of C storage, soil types, hydrological regime, and consequently in the C balance. The effect of the landform and depth of the saturated soil layer on CO2 fluxes is not fully understood and existing studies offer conflicting information. For example, Waddington and Roulet [12] suggested that CO2 fluxes from the collapsed areas exceeded those from peat plateaus, while Mitsch and Gosselink [13] showed an opposite relationship.
Uplands generally have better drainage, mineral horizons are present within the active layer, and most of the CO2 assimilation is performed by the tree crowns, while shaded ground covering the bryophyte layer plays only a minor role in total ecosystem assimilation [14]. Organic layers are frequently coarse mor to moder, and although comparatively thick, contain a limited and relatively constant amount of C [15]. This suggests that these areas are historically C neutral, neither sinks nor sources of CO2, but that the assimilation and respiration functions of the ecosystem are largely stratified: tree crowns responsible for the bulk of total assimilation, and decomposition taking place at the ground surface, making the soil surface a strong source of CO2 while the ecosystem as a whole remains carbon neutral [1]. Climate warming might increase or decrease total pools of stored carbon as higher temperatures would promote faster decomposition of soil C, greater tree growth rate would provide more litter fall and more carbon stored in standing biomass [3]. It is reasonable to expect that in either case, these ecosystems would reach another state of equilibrium with new, somewhat higher, decomposition rates of organic matter on the ground compensating for the greater assimilation rate of the crowns and undergrowth.
Peat plateaus landforms are composed of perennially frozen peat and appear to have developed under non-permafrost conditions which subsequently became elevated and permanently frozen [16]. These areas contain a large amount of carbon stored in the peat, indicating that historically they underwent a period of C accumulation [10]. However, measurements indicate that peat plateaus at present are either minor C sources or C neutral, or alternate between minor C sources and minor C sinks from year to year [17]. Most studies suggest that C balance of peat plateaus can be positive or negative varying from year to year [12,18]. This indicates that either warming has already shifted the NCE or that present peat plateaus have reached a stable stage of ecosystem development. Further warming is expected to increase respiration [5], and the depth of active layer thereby exposing stored C to degradation, or destabilization and collapse of the permafrost to create collapsed areas in place of peat plateaus [10,19].
Collapsed areas are also known as thermokarst form where permafrost thawed and ground surface subsided. These are soils composed of water-saturated peat with the water table close to the surface or above it, initially forming fast growing sphagnum communities [16]. Thermokarst features of the landform are predominantly sources of carbon emissions in the form of methane [12]. There are indications that high assimilation rates and low soil respiration due to waterlogging create conditions for net C sequestration [13]. Several studies suggested that collapsed areas are the greatest sinks of CO2 in northern regions due to active sphagnum growth under conditions of constant supply of water, sunlight, and warmer conditions, while at the same time producing the greatest amounts of methane [20,21,22,23]. Carbon accumulation in these areas is conditioned by the presence of the high water table, which depends on the presence of permafrost in the surrounding areas that prevents water from draining away from the collapsed areas [24]. Further permafrost thaw would cause drainage of collapsed areas thereby affecting conservation of soil organic matter and supporting sphagnum growth, thus converting them from sinks to major sources of CO2.
In Canada, the Mackenzie valley region in the northwest has undergone the most warming (1.7 °C) over the last century [25]. As a result, changes in the permafrost distribution have affected forest and peatland ecosystems in the Mackenzie valley region. It is uncertain how the above mentioned changes will affect the distribution, composition and C source/sink capacity of forests and peatlands, i.e., balance between organic matter production, heterotrophic mineralization, and greenhouse gases (GHG) emissions [2]. Limited data and understanding of how changing environmental conditions and permafrost thawing influences the C cycle of forests and peatlands over short timescales poses an even greater challenge to predict the changes in the C sink/source relationships and GHG dynamics under a changing climate. The goal is to advance and further develop C monitoring and assessment along diverse landscape (forest–peatland) and ecoregion (boreal–subarctic–arctic) gradients across the Mackenzie valley. This study was conducted with the following objectives: (1) To measure soil CO2 fluxes, including NCE, along a climatic gradient and across different landforms; (2) To assess effects of permafrost, temperature and solar radiation on NCE and soil CO2 production; and (3) To develop a statistical relationship to estimate ecosystem respiration (ER) along latitudinal gradient. Considering the difference in the soil surface carbon balance along the climatic gradient and between most common landforms, spanning from strong C sources to sinks, the task of evaluating and modeling of CO2 emissions and assimilation in changing climate requires an approach that would take all of these variables into account.

2. Methods

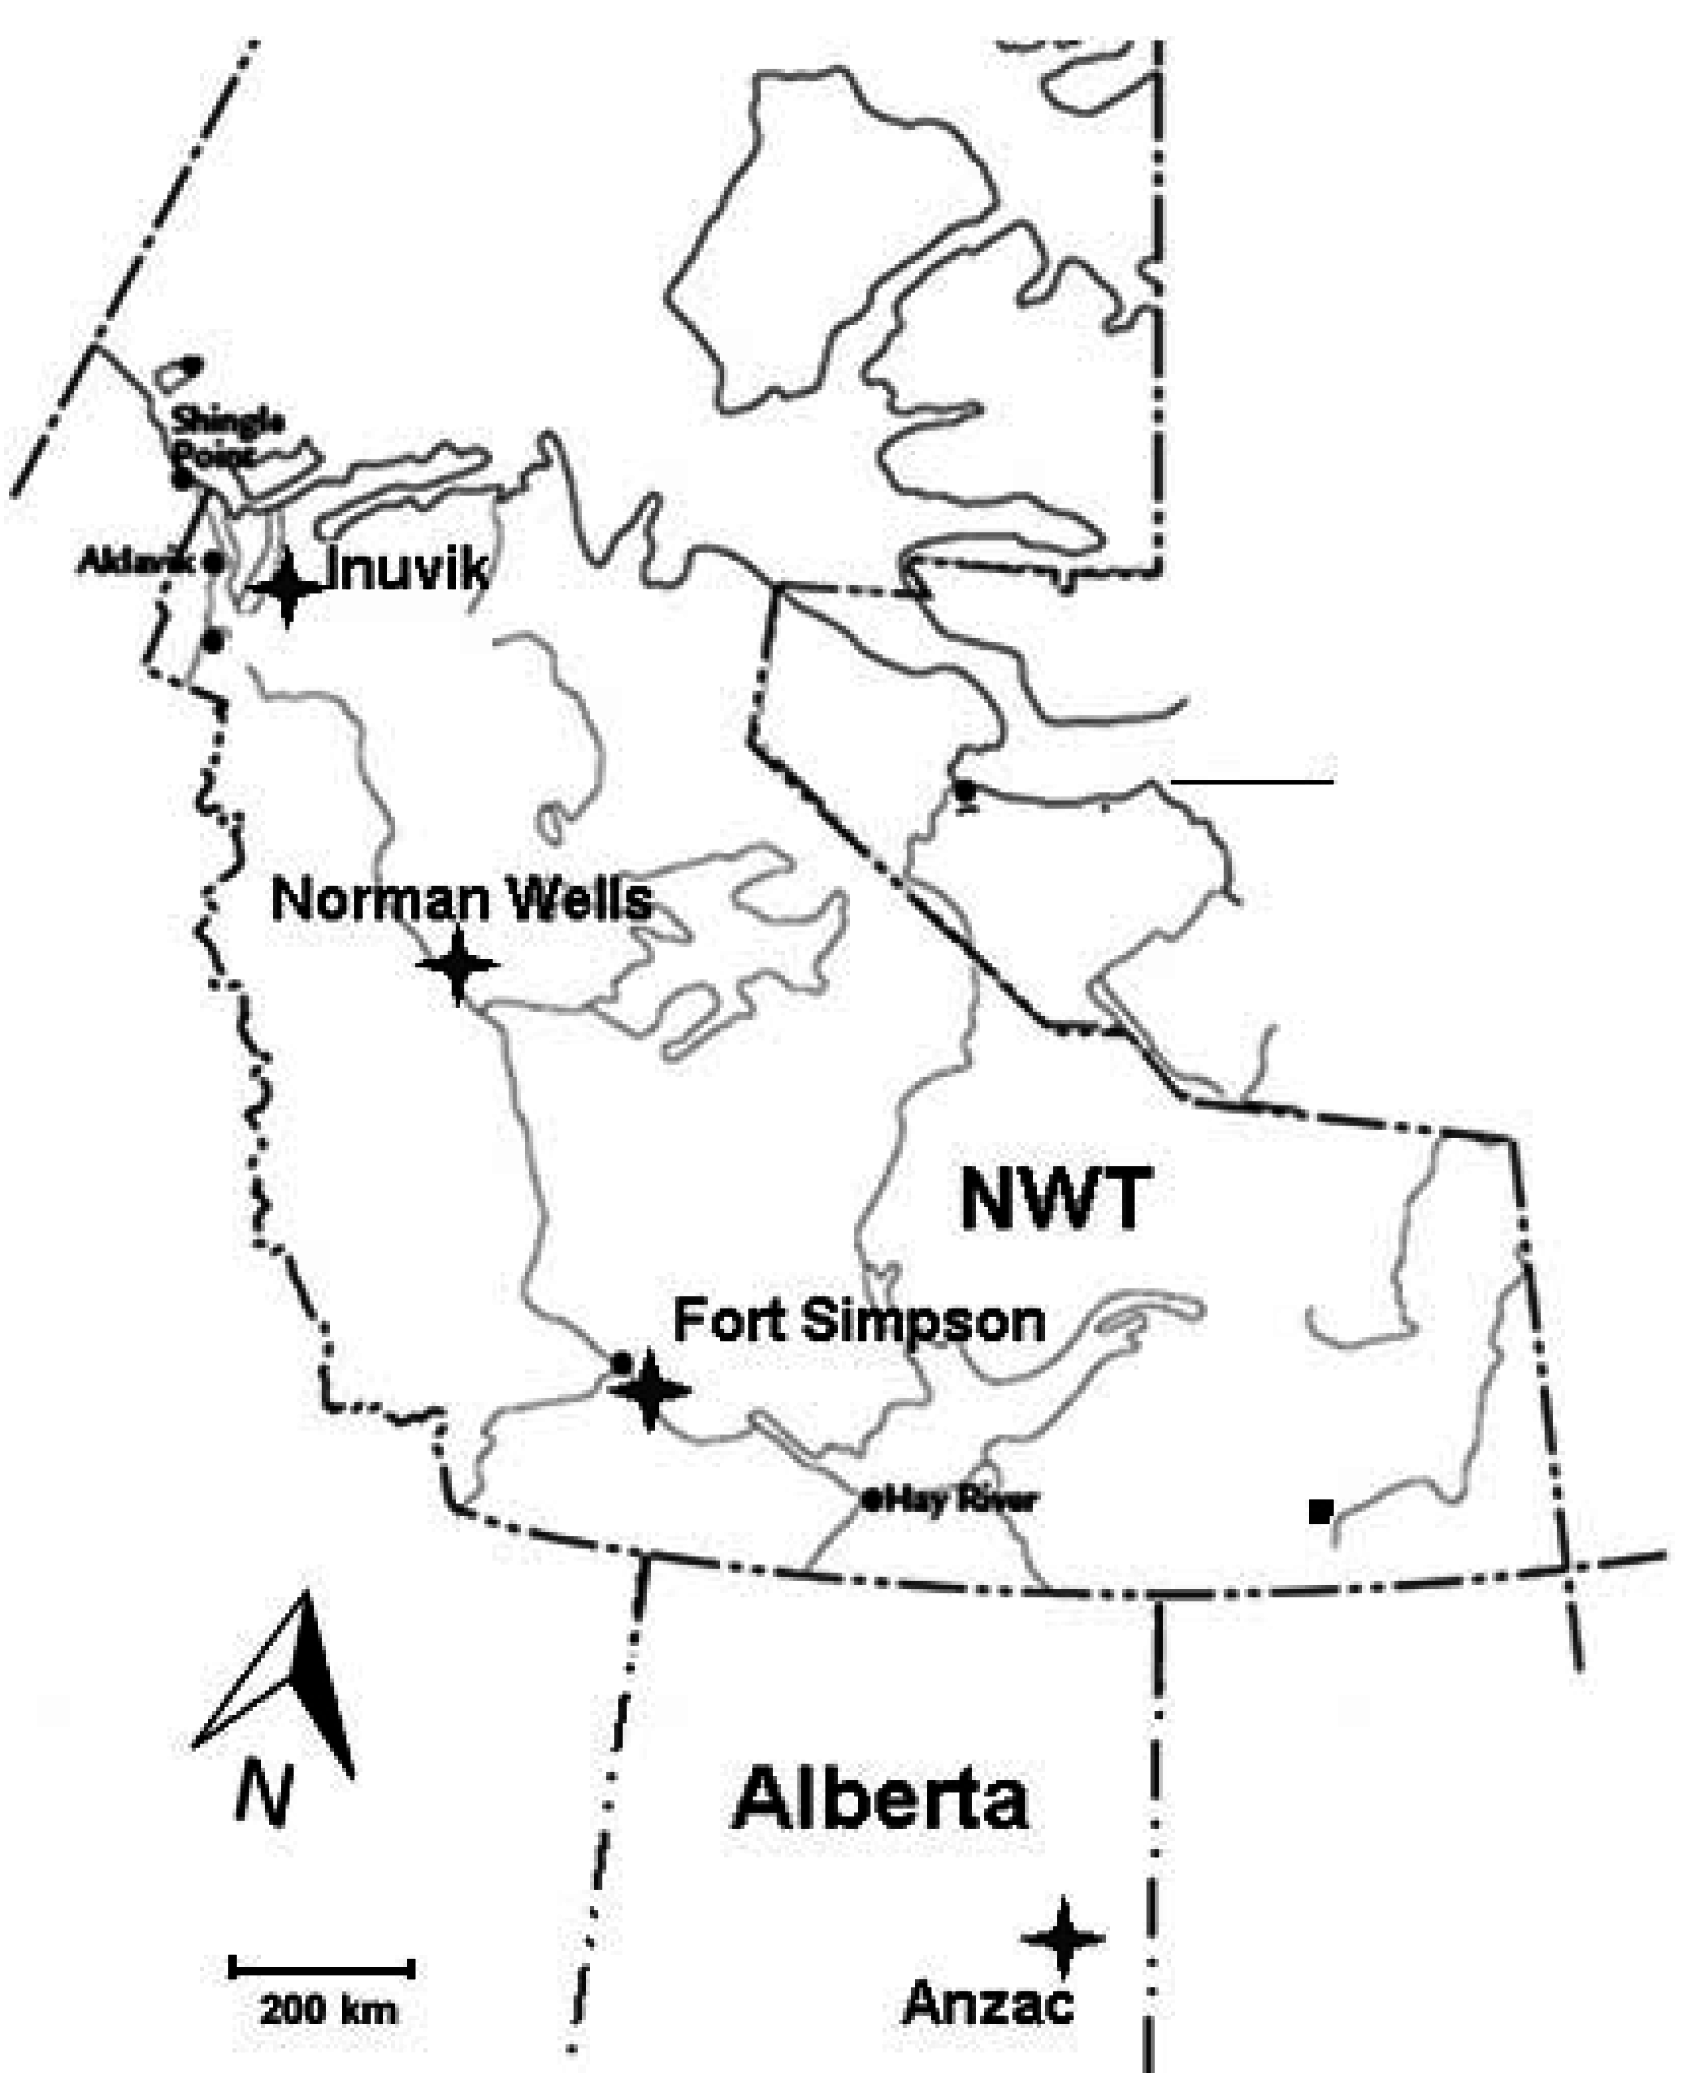
2.1. Site Description

The study was conducted at four locations along a north-south climatic gradient in the Mackenzie Valley, Western Canada (Figure 1), from mid boreal with isolated patches of permafrost near Anzac, northern Alberta (AZ), to boreal forest with sporadic discontinuous permafrost zone in the area near Fort Simpson (FS), low subarctic with extensive discontinuous permafrost in the proximity of Norman Wells (NW), and high subarctic with extensive continuous permafrost in the Inuvik (IN) area. The mean values of the main climatic parameters for the sites (Table 1) indicate mean annual temperature and growing degree days decreasing but mean annual snow pack and precipitation increasing with latitude. Each study site was chosen to include a gradient from upland to peatland conditions and to a collapsed scar (Figure 2). Individual study plots were located within the upland forest (UL), peat plateau (PP; in Anzac site, a lichen-populated peat bog was used as ecologically comparable substitute), and a collapse feature (CS; in Anzac site, collapse feature was represented by an internal lawn; in Fort Simpson and Norman Wells, collapse scars; and in Inuvik a polygonal trench). Internal lawns are characteristically less than 50 cm lower than the surrounding bog and contain dead stands of Picea mariana and a Sphagnum ground cover [16].

Study Plots Establishment

At each site and each landform location, a study plot was established to facilitate measurements and minimize site disturbance. Board walks were laid in a cross pattern for easy reach to permanent sampling points; 10 cm in diameter plastic tubes (10 cm in length) were driven into the soil to serve as permanent collars for CO2 measurements. In addition, 10 cm in diameter and 40 cm long plastic tubes were installed for the measurements of the water table.

2.2. Vegetation Description

In Anzac and Fort Simpson, uplands were characterized by a dense Picea mariana stand with a feathermoss understorey consisting primarily of Hylocomium splendens and Pleurozium schreberi. Peat plateaus had a sparse Picea mariana canopy with Ledum groenlandicum and Vaccinium vitis-idaea dominating the shrub layer, and a ground layer of lichen species, including Cladina mitis, C. rangiferina, and C. stellaris. The Norman Wells upland had a sparse Picea mariana canopy with Ledum groenlandicum, Arctostaphylos rubra, and Vaccinium uliginosum dominating the shrub layer, and a ground layer of primarily moss species, including Tomenthypnum nitens, Hylocomium splendens, and Aulacomnium palustre. The Inuvik upland plot was dominated by an open canopy of Picea mariana with a shrub layer of Vaccinium vitis-idaea and Ledum decumbens. Petasites sp. and Rubus chamaemorus were predominant in the herbaceous layer, while Cladina mitis, Sphagnum angustifolium, Peltigera spp. and Cladonia spp. comprised the ground layer.
Both Norman wells and Inuvik peat plateaus were treeless, with vegetation in Norman Wells dominated by a ground layer of Cladina mitis with patches of Sphagnum fuscum. The vascular vegetation consisted of a mix of Ledum decumbens with Vaccinium vitis-idaea, Andromeda polifolia, Myrica gale, and Vaccinium uliginosum in the shrub layer, and an herbaceous layer of scattered Carex sp. and Rubus chamaemorus. The Inuvik peat plateau was vegetated by Ledum decumbens, Andromeda polifolia, Betula glandulosa, and Vaccinium vitis-idaea dominating the shrub layer, a herbaceous layer of Rubus chamaemorus and Carex spp., and a ground layer comprised primarily of the lichen species Flavocetraria nivalis and Cladina mitis. Collapse scars were treeless at all sites, with vegetation dominated by a moss layer of Sphagnum sp. and S. fuscum with shrub cover including Chamaedaphne calyculata and Andromeda polifolia, and a herbaceous layer of Smilacina trifolia, Eriophorum sp. and Carex sp.

2.3. Soil Description

Soils at the study sites differed most notably with landforms and the presence of permafrost in the soil profile. Upland soils had comparatively better drainage and varied from moderately to imperfectly drained. The water table was within the upper 40 cm of the soil profile at the peat plateaus. Collapse features of the landforms did not have permafrost with the exception of the Inuvik site where the collapsed area was represented by a polygonal trough with ice-wedge at the depth of 50 cm. Upland soils were represented by Gleyed Dystric Brunisol in Anzac, Orthic Dystric Brunisol in Fort Simpson, Orthic Static Cryosol in Norman Wells, and Gleysolic Turbic Cryosol in Inuvik. Peat plateaus at all sites had a cover of Fibric organic cryosol except for Anzac where it was Typic Mesic Fibrosol developed in the absence of permafrost. The soil in collapse scars was classified as Hydric Fibrisol at all sites except Inuvik, where Mesic Organic Cryosol was found in the polygonal trench.

2.4. CO2 Flux Measurements

2.4.1. Intra-Site Spatial Variability of CO2 Fluxes

To determine spatial variability within a site, we measured NCE and ER using the PP system (EGM-4 portable CO2 Gas Analyzer, PP System Inc., Amesbury, MA, USA) at three different locations, namely upland, peat plateau, and collapse scars. At each study location, six permanent gas flux sampling collars were installed within easy reach of the boardwalk in such a way that they were not shaded by the boardwalk. In order to improve the representation of spatial variability in hummocky areas, both hummocks and hollows were included as sample points. The measurements began in the fall of 2007 and continued throughout the growing seasons of 2008 and 2009. Surface CO2 fluxes were measured using the PP system. Surface NCE and ER were measured using a clear and an opaque cover, respectively. The rate of assimilation of the soil cover vegetation was obtained from the difference between NCE and ER.
Spatially explicit measurements were taken during daytime, usually in the early afternoon, during the warmest part of the day when temperature-driven microbiological activity would have reached its maximum. In order to calculate daily flux values, a relationship was established between hourly fluxes and soil temperature (Table 2) and used to extrapolate flux values for all twenty-four hours of the day. To estimate net carbon exchange (NCE) at the soil surface, exponential regression (1):
NCE = ae(bT)
was used where NCE is the net carbon exchange (g·CO2·m−2·h−1) and T is the soil temperature at the 5-cm depth (°C), a is the reference NCE at zero °C, and coefficient b represents the temperature sensitivity. For the purpose of modeling the temperature effect on ER, an exponential regression (2):
ER = ae(bT)
was used where ER is the ecosystem respiration (g·CO2·m−2·h−1) and T is soil temperature at the 5-cm depth (°C), a is reference respiration at zero °C, and coefficient b represents the temperature sensitivity. Soil moisture has insignificant effect on the soil CO2 fluxes. Values of Q10, which is the relative increase in respiration for a 10 °C increase in temperature, were obtained as Equation (3):
Q10 = b(1 + 10 T−1)
Similarly, the effect of solar irradiation on the net assimilation rate (NAR) was evaluated using a log function (Equation (4)):
NAR = a′ln(Q) − b′
where NAR is surface CO2 net assimilation rate (g·CO2·m−2·h−1) and Q is PAR in µmol·photons·m−2·s−1, and a′ and b′ are the coefficients.

2.4.2. Temporal Variation in CO2 Fluxes

Surface NCE was also measured for extended periods of time (up to 45 days) with clear chambers using ACE automatic CO2 exchange systems (ADC BioScientific Ltd., Hertfordshire, UK). ACE units were equipped with a built-in photosynthetically active radiation (PAR) silicone photocell sensor and a soil temperature probe, and were powered by gel-cell batteries and solar panels. The ACE units were deployed simultaneously in upland, and peat plateau locations with one unit in each plot for comparison of local CO2 fluxes, surface temperatures, and illumination intensities between landform positions.
We also measured soil CO2 concentrations using Vaisala solid-state infrared CO2 sensors (Vaisala Oyj, Helsinki, Finland) at three depths (5, 20, and 40 cm) with Vaisala model GMP222 (measurement range 0–10,000 μmol·CO2·mol−1) at the 5 cm depth, and model GMP221 (measurement range 0–20,000 μmol·CO2·mol−1) at the 20 and 40 cm depths. The sensors were protected with Teflon socks and installed at different depths as explained in Jassal et al. [26], and connected to a data logger (Campbell Scientific CR1000) recording soil CO2 concentrations every two hours. Soil respiration was obtained with the gradient technique using Equation (5) (see below). To obtain diffusivity values, soil physical properties, such as bulk density and porosity, and variations in soil temperature and moisture content were also measured. The gradient approach allowed for the calculation of the contribution of different soil layers to the total surface flux.
Soil temperature and volumetric water content (θv) were measured continuously starting spring 2008 to fall 2010 using HOBO U12 units equipped with temperature sensors (Model TMC6-HD, Onset Computer Corp., Bourne, MA, USA) and soil moisture sensors (Watermark Sensor type WMSM, Delta-T Device Ltd., Cambridge, UK), respectively. The temperature sensors were installed at the 5, 25, and 50 cm depths while the moisture sensors were installed at the 5 cm depth. Soil temperature and moisture readings were also taken every two hours.

2.4.3. Calculating Soil CO2 Fluxes

CO2 flux was calculated from the Fick’s first law of diffusion (Equation (5)):
F = D s d C d z
where F is CO2 flux in μmol·m−1·s−1, Ds is diffusion coefficient in the soil (m2·s−1), C is soil CO2 concentration at the given depth and dC/dz is vertical gradient of CO2 concentrations in the soil between two measurement depths. The value of Ds was calculated as Ds = ζDa where ζ is soil gas tortuosity factor and Da is CO2 diffusivity in the air. The latter is calculated from the standard diffusivity value (Da0) at 20 °C (293.15 K) and 101.3 kPa using the following equation (Equation (6)):
D a = D a 0 ( T 293.15 ) 1.75 ( P 101.3 )
where T is temperature (K) and P is pressure (kPa). The value of Da0 is empirically given as 14.7 m2·s−1. We used the Millington-Quirk model [27] for calculation of tortuosity (ζ) as it was proven to provide the best correlation to the measured tortuosity [28] (see Equation (7)).
ζ = α 10 3 ϕ 2
where α is air-filled porosity and ϕ is total porosity. The calculated soil CO2 fluxes, using the gradient technique, for the uppermost soil layer (0–5 cm) were validated by plotting them against soil respiration values measured using the PP system on bare soil.

2.5. Statistical Analysis

Annual NCE and ER values were calculated for each site and landform position for the growing season (1 June to 30 September) of 2008, 2009, and 2010 by summing all daily values. As outlined in Section 2.4.1, collars were installed along three arms of the boardwalk, with two pseudo-replications on each arm. Arms were treated as replications. Re-measurements of the collars each month were initially treated as repeated measures. However, that did not permit for the account of variations in the temperature and light. The latest calculation treats re-measurements as replicated measurements using ANCOVA testing for month × temperature covariance. Barlett’s test was used to test homoscedasticity and Pearson’s chi-square test for normality for comparison of the groups by site and by plot. In case, the assimilation in the two plots variability ratio did not meet the criteria for homoscedasticity, the weighed variables method in analysis was employed. Comparison of temporal variations of NCE and ER between different sites and landform positions was conducted using analysis of Variance (ANOVA) with repeated measures coupled with Tukey’s Studentized Range Test in SAS (SAS Institute Inc., Cary, NC, USA, 2004) [29]. Interaction effects were elucidated using the pdiff option in SAS. To determine the significance of trends in NCE, ER, and assimilation rate and landforms variables, Pearson product-moment correlations were carried out in SAS. Significance was tested using p-value = 0.05.

3. Results

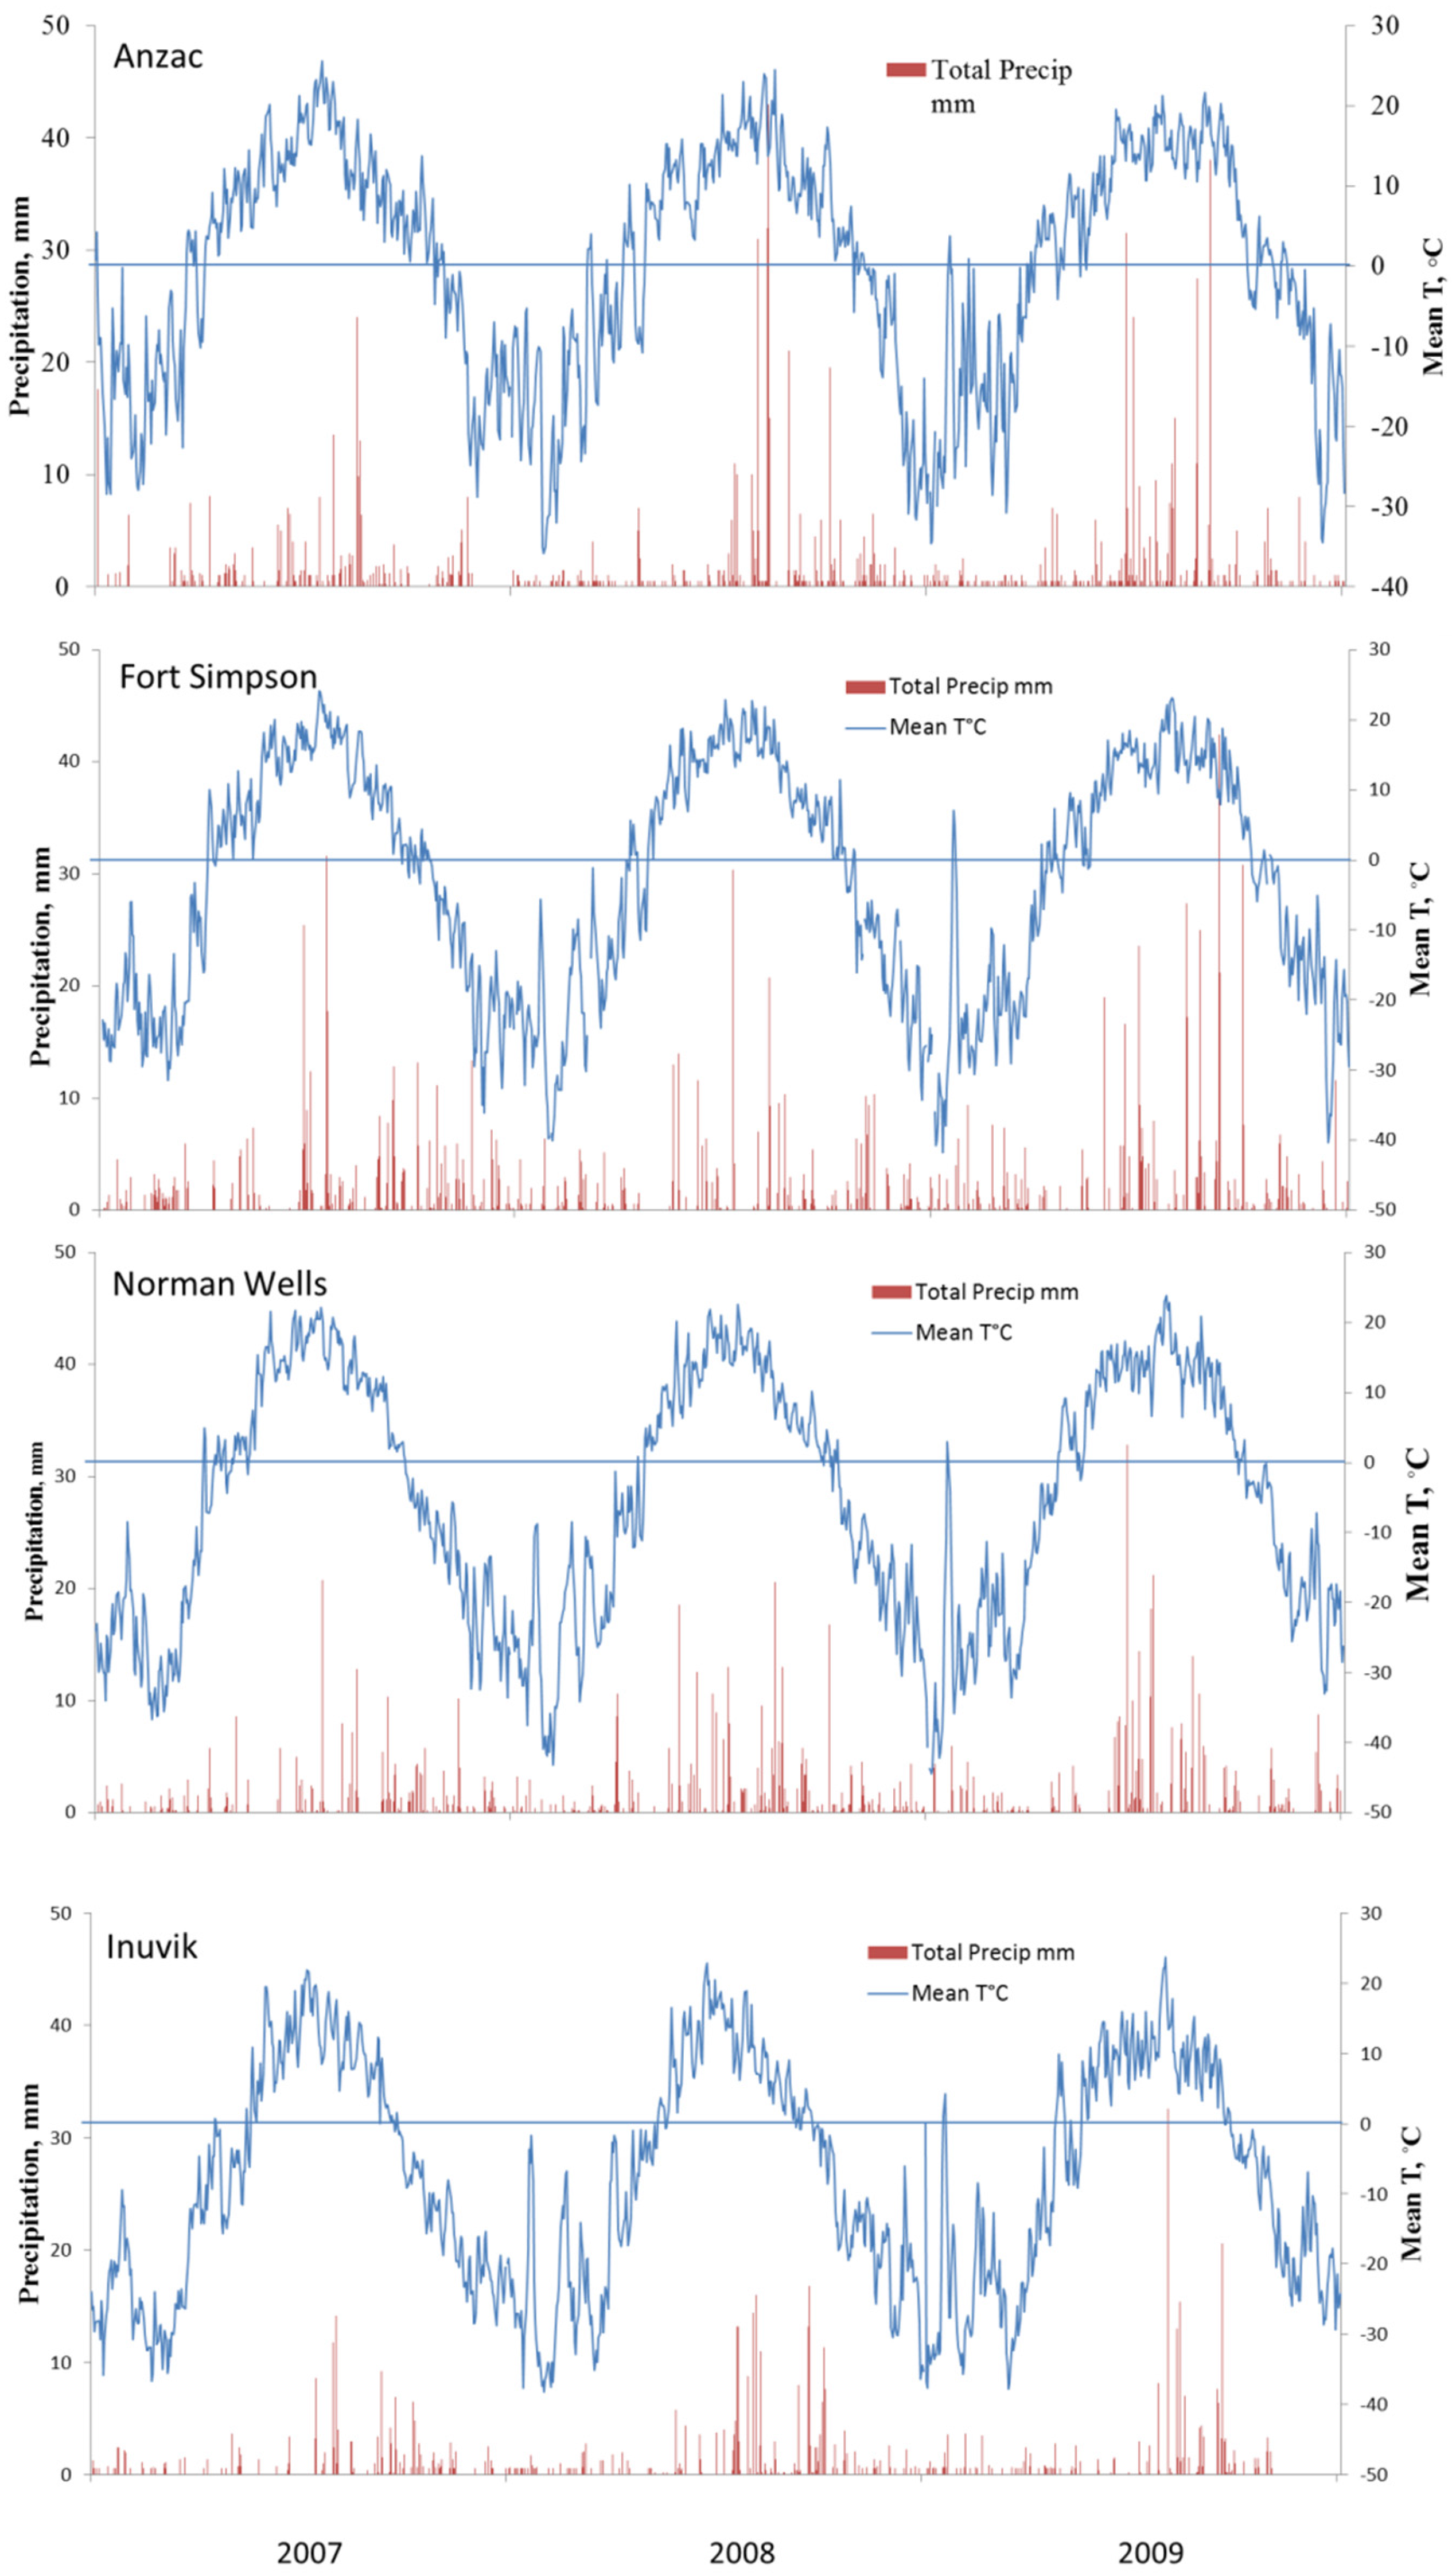
3.1. Weather Monitoring

During three years of the study, weather at all four sites was close to their climatic normals (Table 1). The temperature and precipitation at different sites are presented in Figure 3. Year 2007 was somewhat warmer at all sites except for Norman Wells where the annual temperature was the same as the long-term average. The annual mean temperature in 2007 in Anzac and Inuvik was warmer than their long-term means by 0.2 and 1.2 °C, respectively. 2008 was also somewhat warmer at all sites except Norman Wells. Year 2009 was slightly cooler at all sites except Inuvik where the mean annual temperature was about 1 °C higher than normal. Though the length of the warm (above freezing) season was significantly longer in the southern sites with mild winters, there were no significant differences in the mid-summer temperatures between the sites. Soil temperature generally followed air temperature with a maximum in July, though it did not warm up to the same degree in the north as in the south during shorter summers. Precipitation along the valley typically is between 300 to 400 mm, tapering off along the Mackenzie Delta to 220 mm at Inuvik. Individual daily rainfalls are typically light with few exceeding 5 mm; however, heavy rains can happen during summer months with rainfall occasionally exceeding 30 mm for sites in Fort Simpson and Newman Wells. After October, most of the precipitation falls as snow.

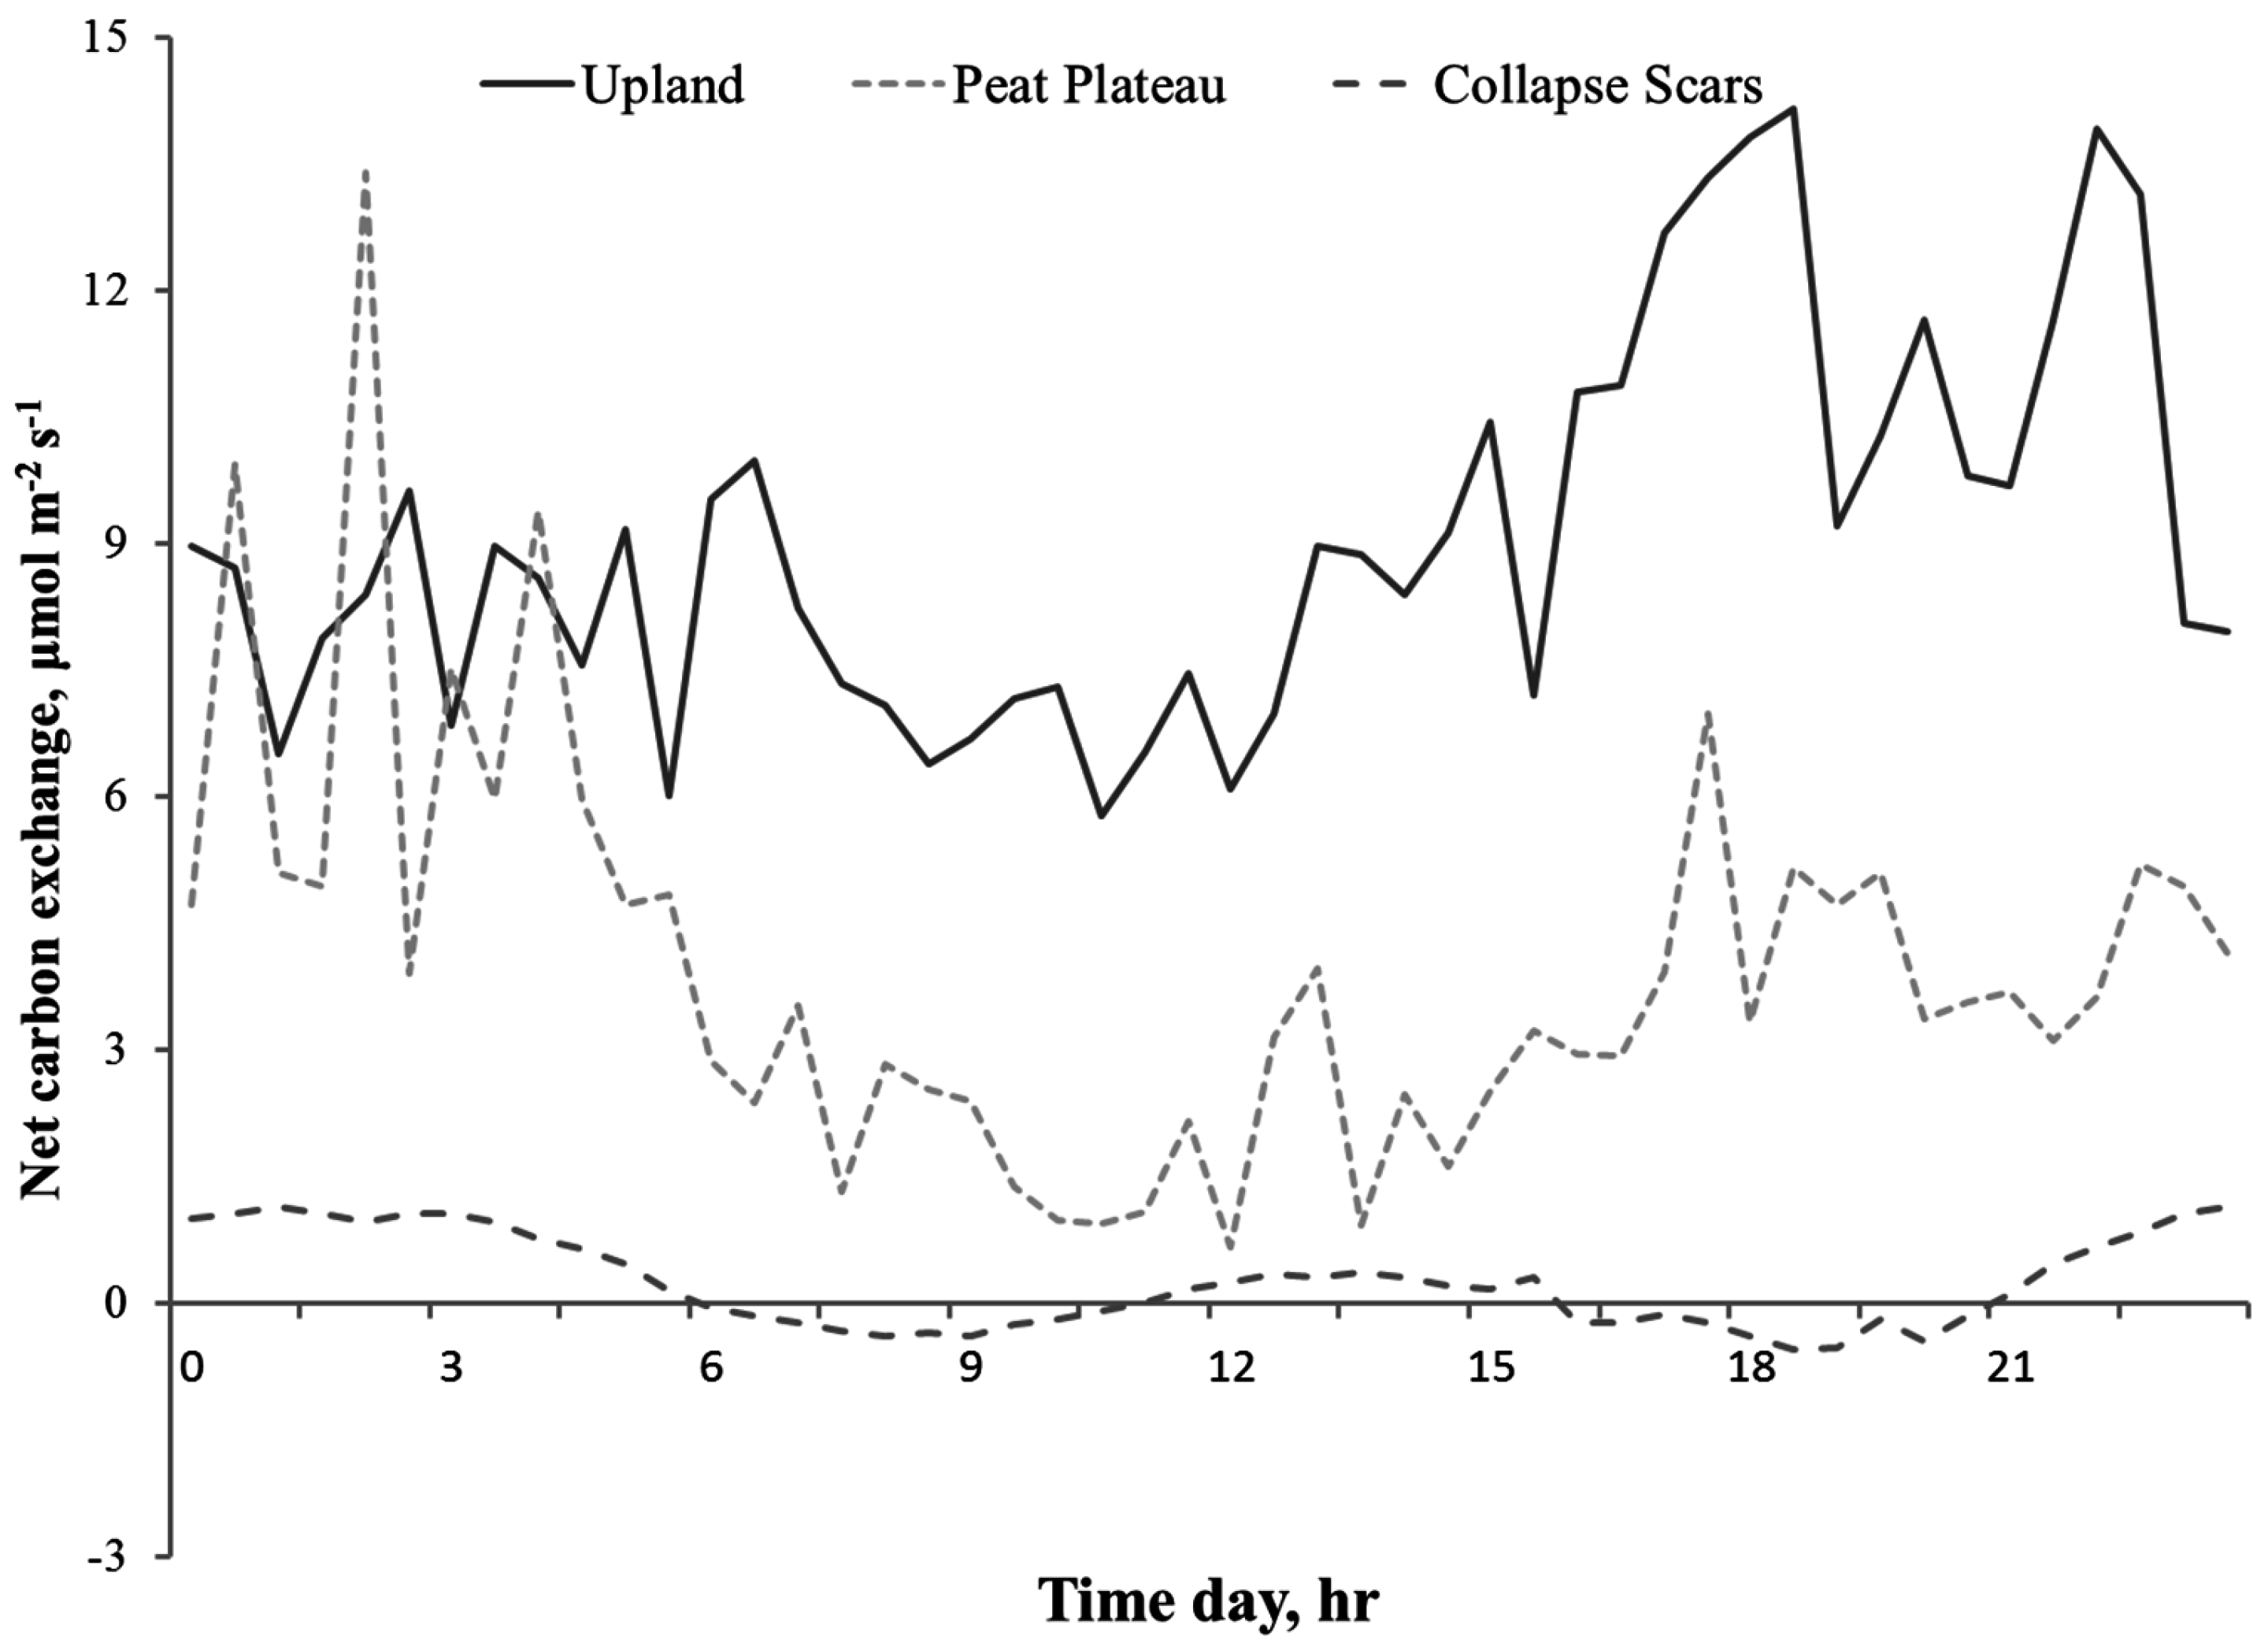
3.2. Diurnal Variations in NCE

Diurnal measurements of surface NCE indicated the surface was a source of CO2 with respiration dominating the gas exchange balance at most of the study sites. Hourly measurement of NCE corresponded closely to diurnal temperature variations. Figure 4 shows the distinct diurnal pattern in measured NCE in collapse scars, peat plateau, and upland areas at the Fort Simpson site with upland showing maximum (9.0 µmole·m−2·s−1) NCE followed by peat plateau (3.9 µmole·m−2·s−1) and collapse scars (0.3 µmole·m−2·s−1), also suggesting that photosynthetic activity of the ground cover bryophytes played a notable role only in collapsed areas. Both upland and tree-covered peat plateau areas had higher surface CO2 fluxes (emissions) during the daytime, but collapse scar exhibited a double-peak pattern with higher respiration during nighttime, which began to decrease with sunrise and reached negative values (becoming carbon sink) during morning hours. During mid-day when the temperature was at the peak, collapse scar NCE turned positive again followed by another period of negative NCE showing the prevalence of assimilation during late afternoon until sunset.

3.3. Statistical Model of Surface CO2 Fluxes against Temperature

Net carbon exchange (NCE) was primarily controlled by soil temperature at the 5 cm depth as the exponential model (Equation (1), NCE = ae(bT)) explained between 68% to 97% variation in observed fluxes for upland, peat plateau, and collapse scar sites along the latitudinal gradient (Table 2). Adding soil moisture factor into the model did not improve it any further. The model showed variation in coefficients a and b, and Q10 values, based on landform along the north-south gradient. At peat plateau and collapsed areas, the effect of temperature was less obvious (Table 3 and Table 4) where soil moisture would have a dominant control. There was also a good agreement between ER measurements and soil temperature at the 5 cm depth at different sites and landforms. The values of the parameters in Equation (2) (ER = ae(bT)) are presented in Table 3. The value of the a coefficient was higher for all the upland sites as compared to peat plateau. The ER-temperature and NCE temperature responses did not differ dramatically among landform units suggesting that ER was a major component of the NCE. The Q10 values estimated for different landform positions along the latitudinal gradient are also shown in Table 4. The response of ER to the temperature varied between ecoregions and landform positions with Q10 values being the greatest in the peat plateau of south most sites (5.6–11.5) followed by uplands (2.9–5.4) and collapsing scar (1.2–4.0), and decreasing with increases in latitude (Table 4). Furthermore, we also found that ER was negatively affected by water table and permafrost depths.

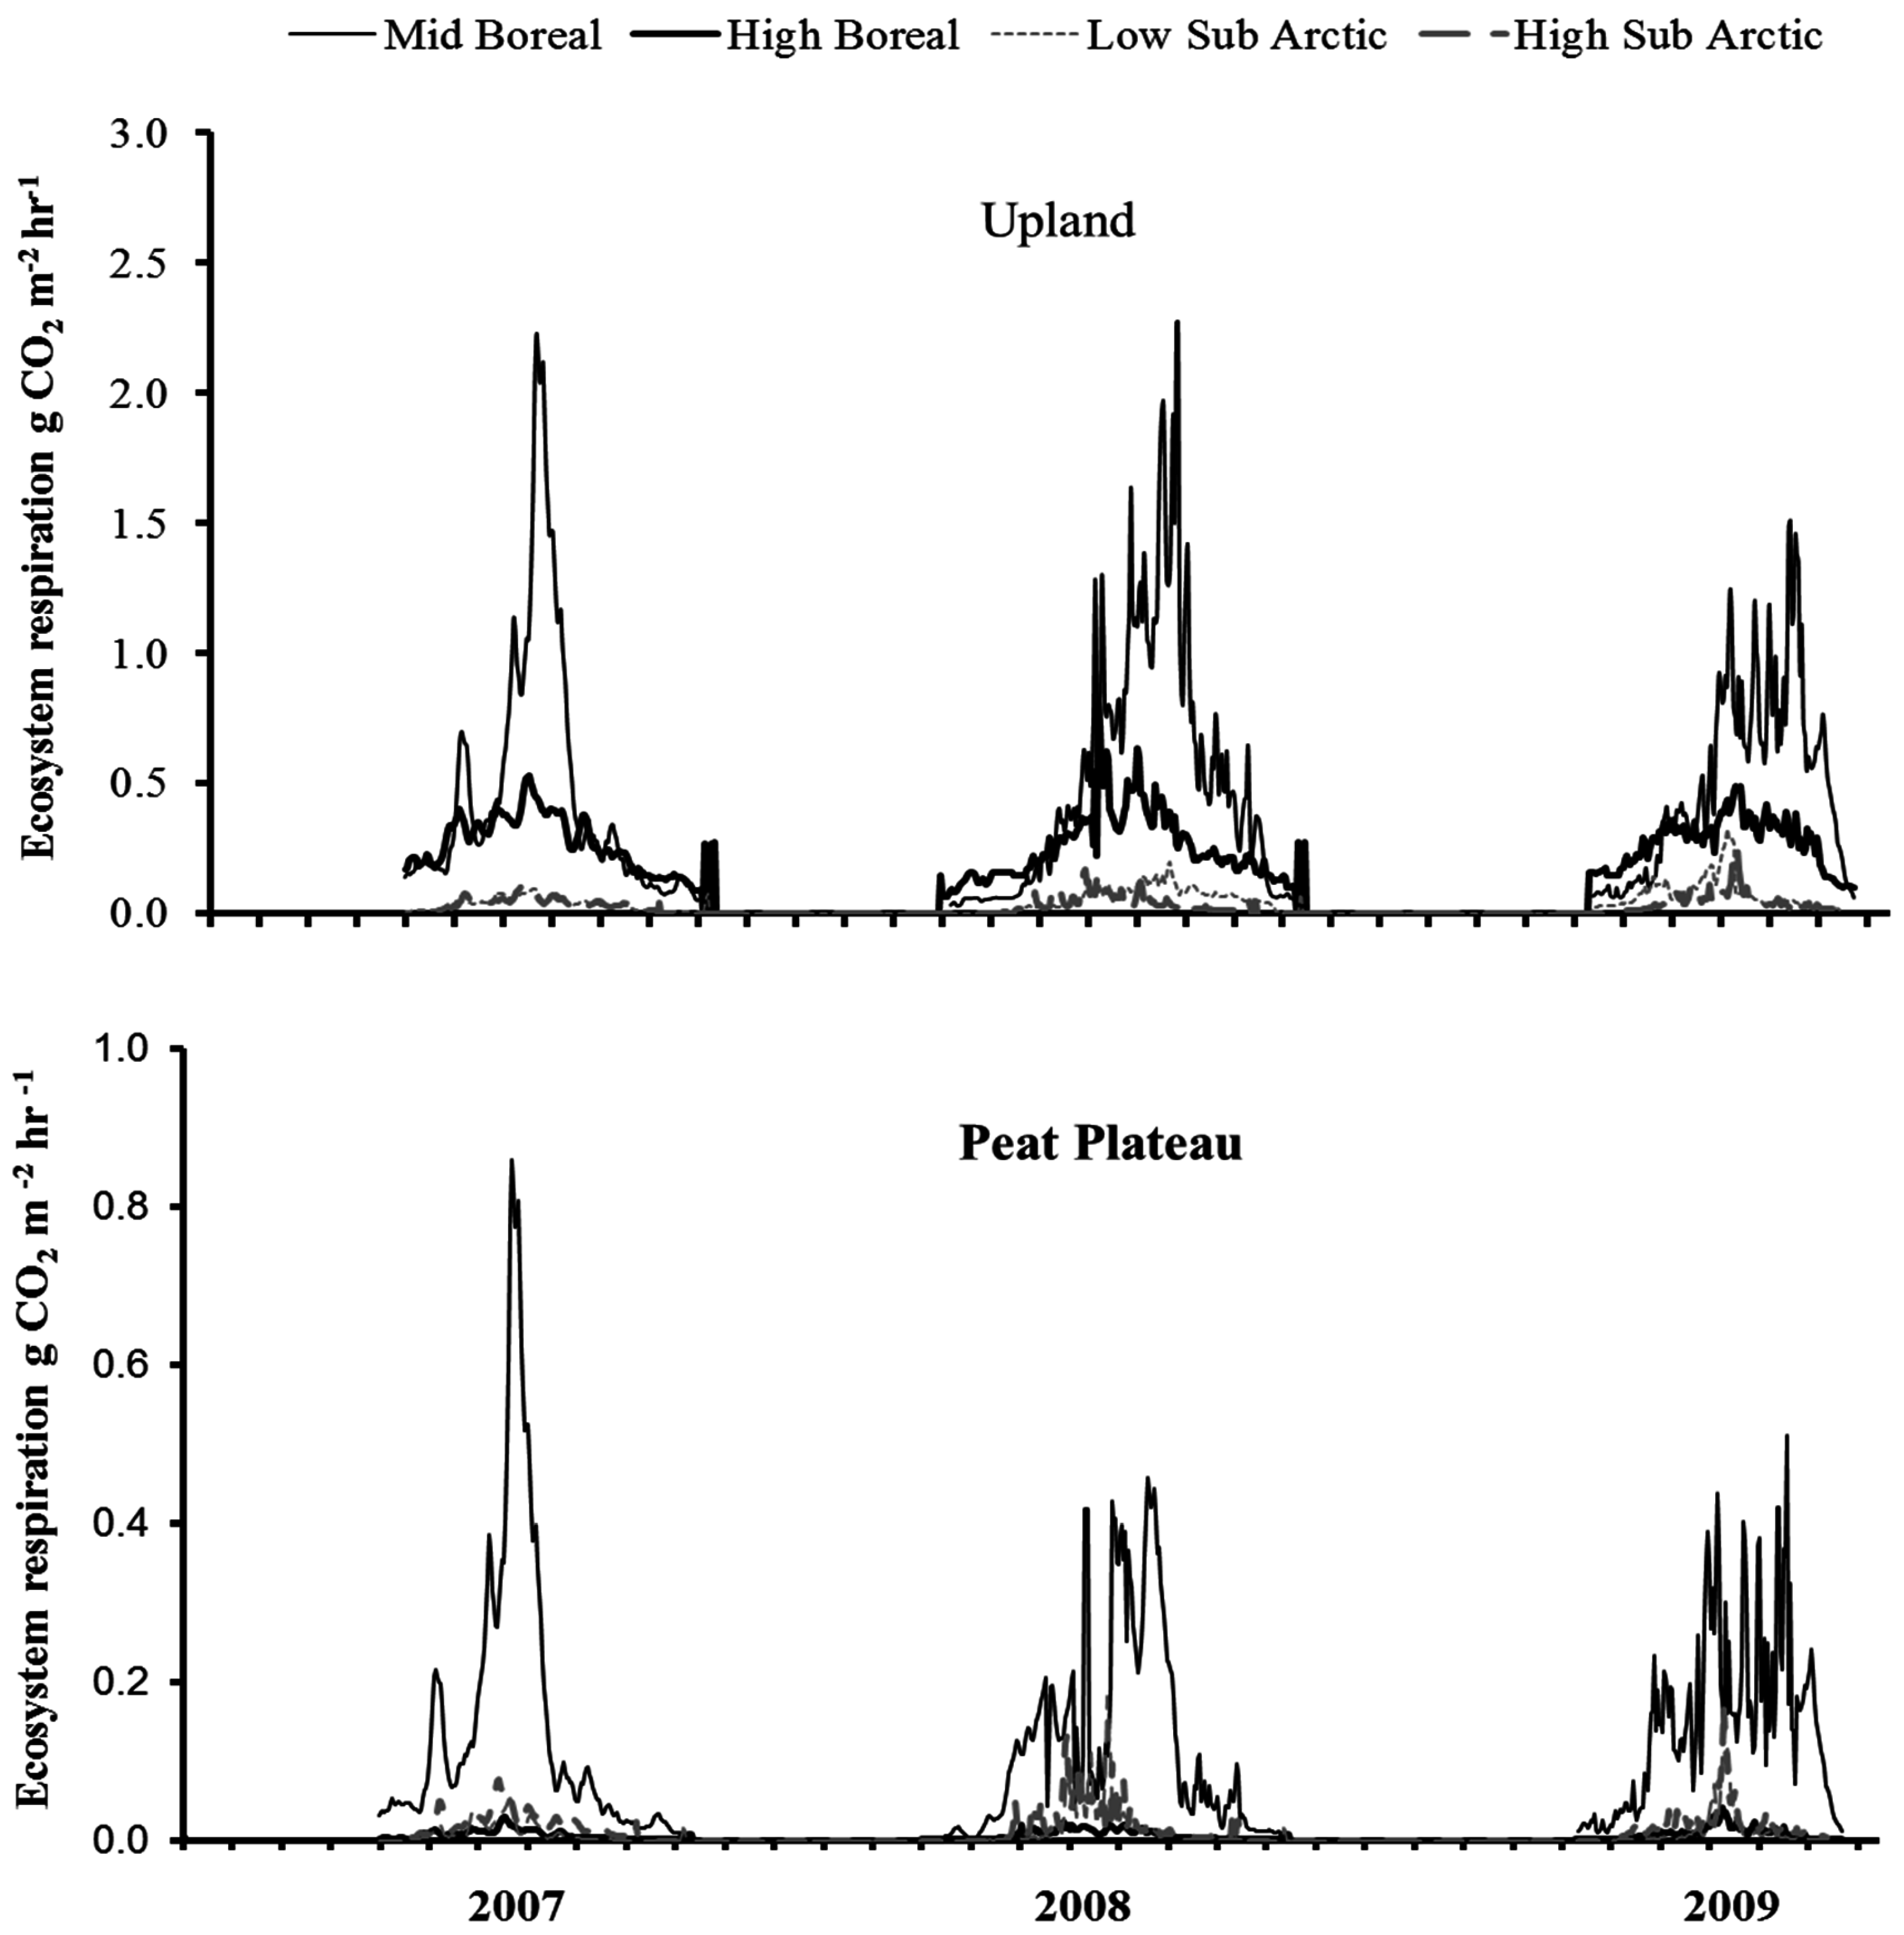
3.4. Time Series of NCE and ER

The temporal variations in surface NCE and ER are shown in Figure 5 and Figure 6, respectively, depicting most pronounced differences among sites. Surface NCE and ER followed a bell-shaped curve during the year closely corresponding to the seasonal variation in soil temperature. The peak NCE and ER values were observed during the summer months of July and August (Figure 5). The greatest amount of CO2 was released in the southernmost site; however, from mid-boreal to low-arctic, the rate of CO2 release from uplands dropped sharply due to a lower seasonal temperature in the north. A comparison of Figure 5 and Figure 6 show that in upland locations, ER was the major component of NCE, exceeding assimilation rate by ground cover vegetation three-fold. Therefore, the response of NCE to ecoclimatic factors was, to a large extent, dictated by the response of ER. NCE did not vary much between peat plateaus with extensive and continuous permafrost in low or high subarctic regions. Results show that total CO2 emissions were greatest in the upland location, least in the collapse scar with peat plateau occupying the intermediate position (Figure 5).
Calculated flux contributions from different soil layers using the CO2 gradient technique showed that in both peat plateau (PP) and upland (UL) areas, the greatest contribution (about 75%) of soil respiration (SR) originated in the upper 5 cm layer (Figure 7). Combined contribution of the lower horizons did not exceed 25% of the total flux. Both in upland and peat plateau, soil temperature was a strong driver of CO2 release in SR. In peat plateau, the lower layer (21 to 40 cm) contributed about only 5% of SR, which could be due to the presence of the water table. Peat plateau areas exhibited greater variability in the flux with a pronounced increase in the CO2 emissions after rain events, which can be attributed to increased decomposition [26] or displacement of soil-stored CO2 [30].

3.5. Effect of Light on Surface Assimilation Rate

The surface assimilation rate was calculated as the difference between measured hourly NCE and ER, and was correlated to the simultaneously measured PAR values. Surface assimilation was significantly correlated with PAR at different landforms along the climatic gradient (Table 5). Correlation obeyed logarithmic relationship and was most significant in the areas of unimpeded solar radiation. In collapsed scar areas, seasonal assimilation was consistently higher (Table 6) than in either uplands or peat plateaus by as much as three times due to the abundance of sphagnum. In peat plateaus, assimilation rate was highly variable due to the frequent drying out of the lichens, which dominated the ground vegetation. With less shading in the peat plateau as compared to uplands (forest areas), significantly higher assimilation was observed (Table 6). During dry days, the surface assimilation was not measurable, and when surface was moist, assimilation by lichens was comparatively low (less than 0.05 g·CO2·m−2·h−1) but increased logarithmically with illumination.

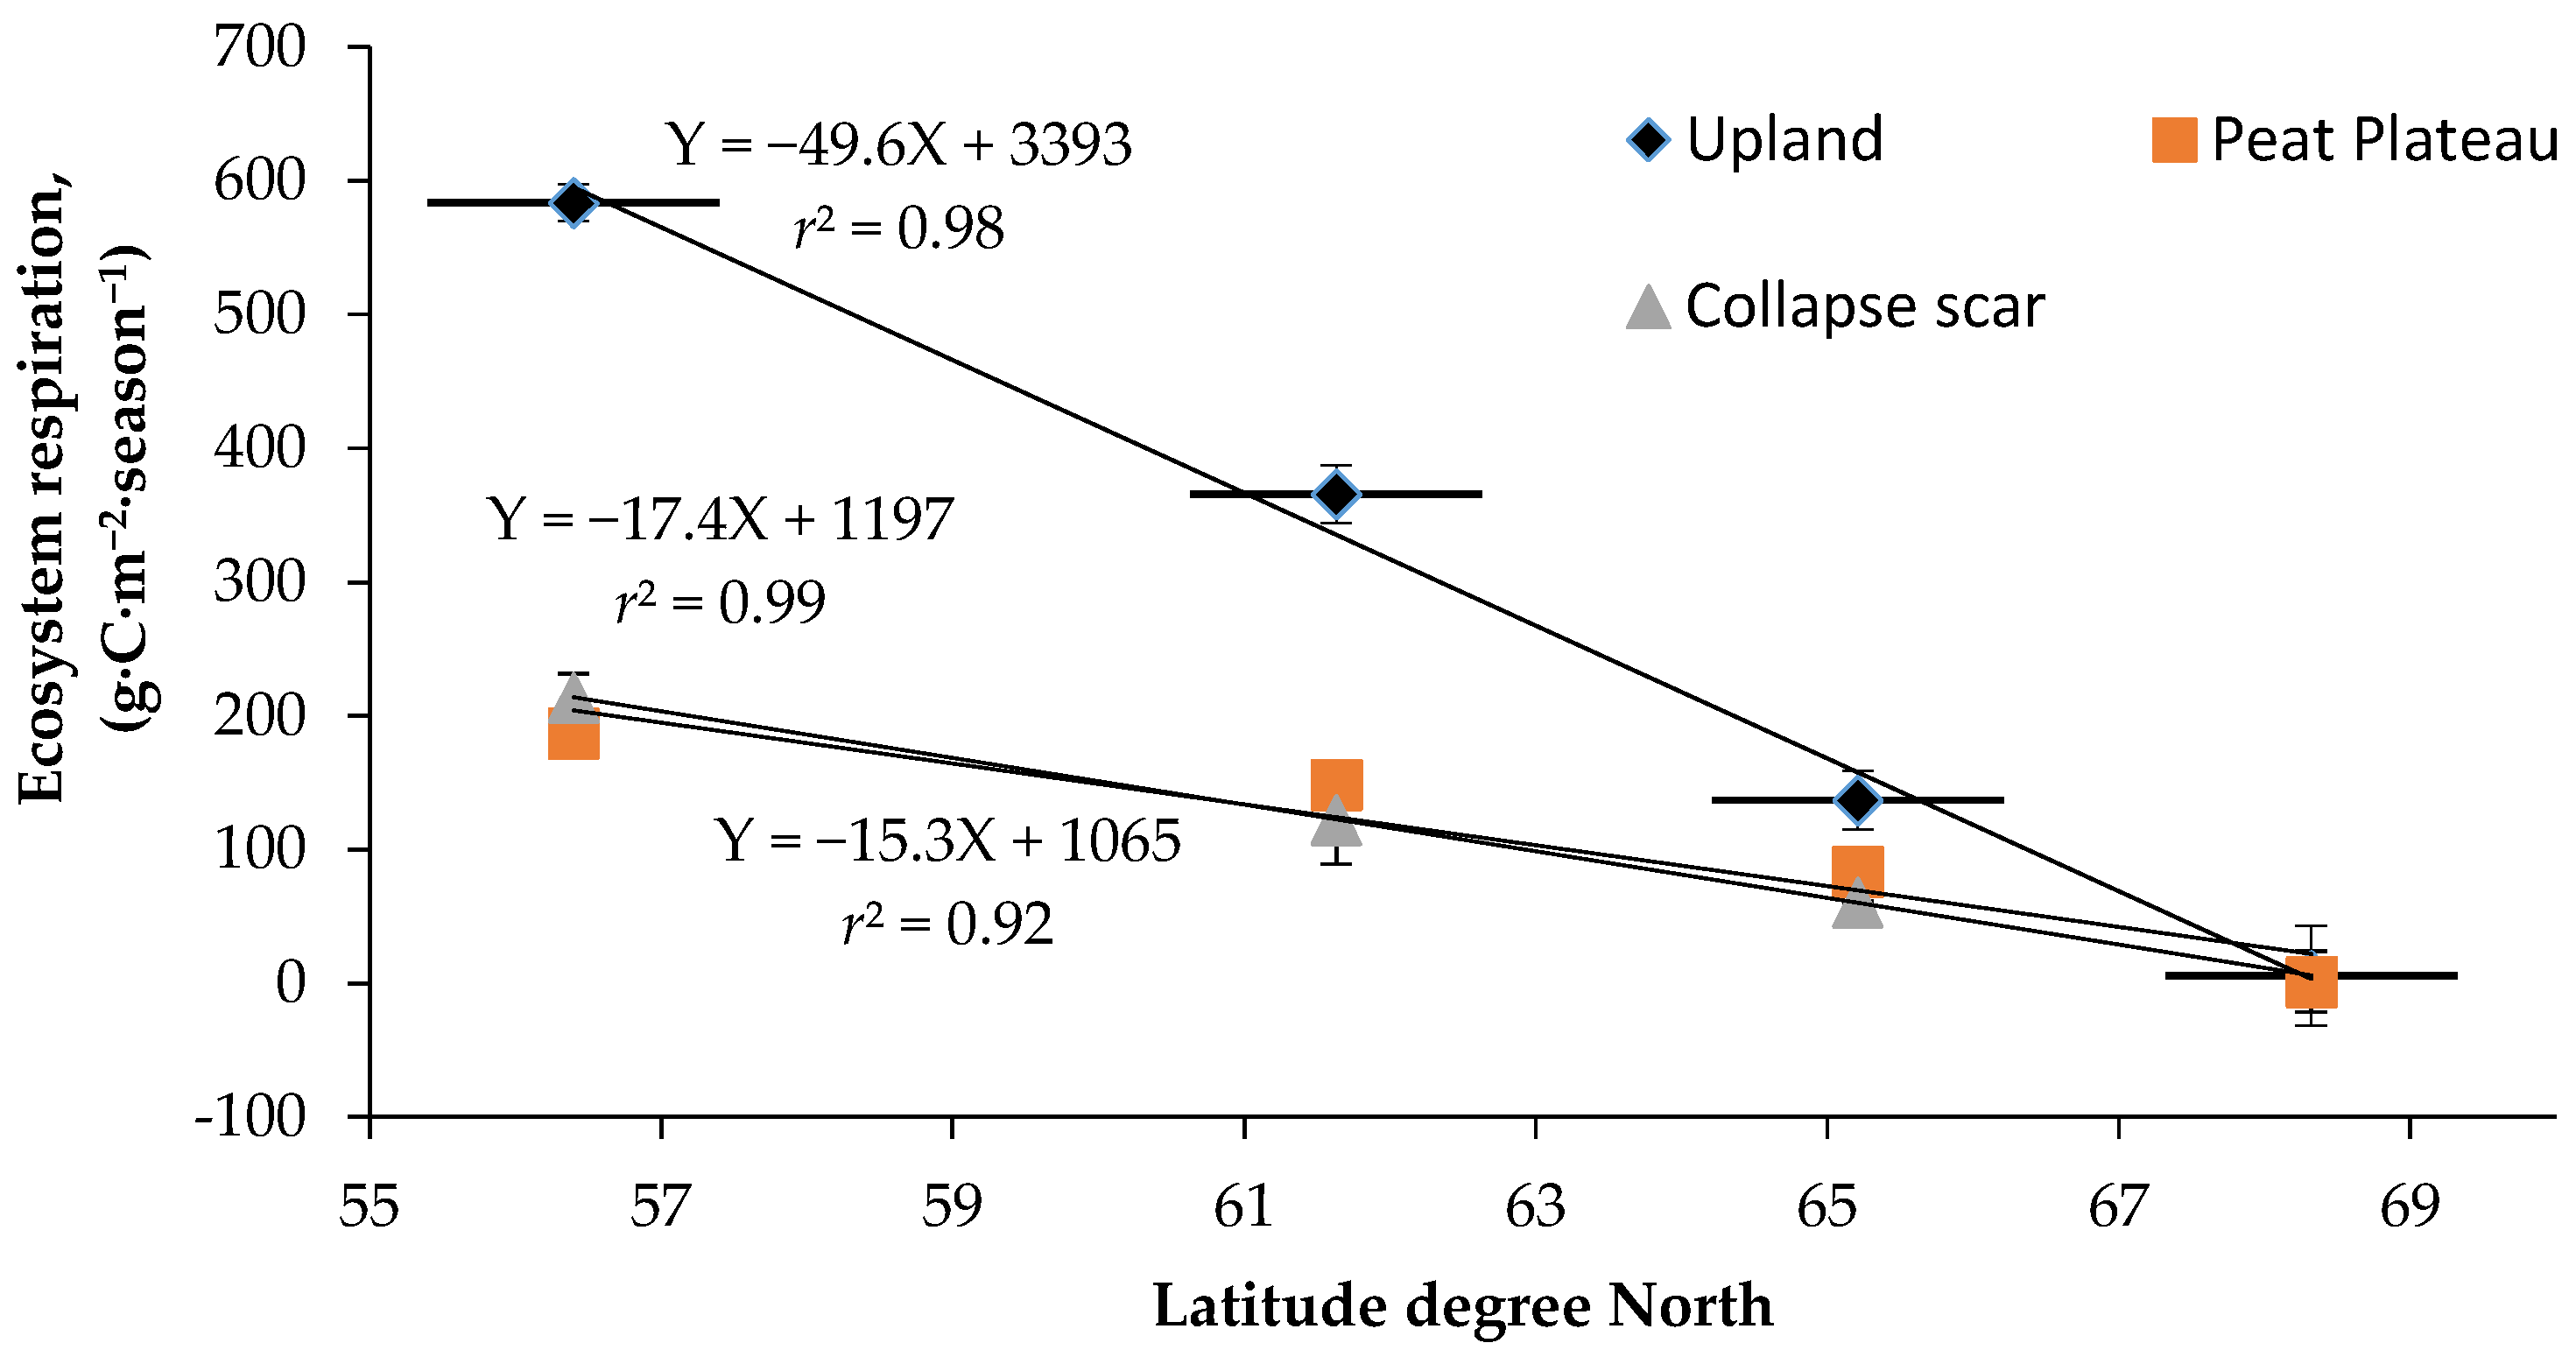
3.6. Annual ER and NCE

A comparison of seasonal NCE among different sites (Figure 8) showed that net carbon exchange at the surface was a significantly larger source at the upland sites (38 to 576 g·C·m−2·year−1) as compared to peat plateau (8 to 159 g·C·m−2·year−1) while collapse scars (−85 to −23 g·C·m−2·year−1) were C sinks at all locations along the transect. In general, annual NCE decreased with mean annual temperature, which decreased with increase in latitude, with high sub-arctic site showing a net assimilation integrated over upland, peat plateau, and collapse scar areas. The upland and peat plateau sites were, on average, net CO2 sources to the atmosphere, while the collapse scar sites were, on average, net CO2 sinks. The NCE measurements pertain only to the ground surface and short vegetation and do not include CO2 uptake by trees and large shrubs. ER varied along the latitudinal gradient, for upland sites from 6.0 to 538 g·C·m−2·year−1, for peat plateau from 2.0 g·C·m−2·year−1 to 187g·C·m−2·year−1, followed by collapse scars with 60 to 214 g·C·m−2·year−1 (Figure 9). Low soil temperature along with high water table at both upland and peat plateau sites in low and high subarctic regions resulted in lower ER. Since the water table was at the surface at all the collapse scar sites, ER was negligible. In mid and high-boreal zone, ER at the upland sites was two- to three-fold higher as compared to peat plateau sites with and without collapse scar.

4. Discussion

CO2 exchange from the surface of permafrost-affected areas is determined by a combination of several factors, including soil microclimate [31,32,33,34], landform features [2,35,36,37], water table depth [38], extent of permafrost [2,39,40], and vegetation type [41,42]. There are two important contributors to the CO2 flux: soil respiration and assimilation, and respiration of the ground cover vegetation. They vary differently in response to physiology and ecoclimate. NCE, assimilation rate and ER by surface vegetation were significantly affected by the local landform positions (i.e., uplands, peat plateau, and collapse scars), and different sites along latitude north–south gradient.

4.1. Spatial Variation in Net Carbon Exchange (NCE)

Net ecosystem exchange in a subarctic forest was lower than that of boreal forest due to extremely cold soils and high water table in the north. Bisbee [41] reported NCE to be 562 g·C·m−2·year−1 for southern sites while Wang et al. [43] reported it to be 226–413 g·C·m−2·year−1 for northern sites in the BOREAS study, which are similar to the NCE observed in the present study for mid- and high-boreal forest zones. In peat plateau, a presence of permafrost significantly decreased NCE from 160 g·C·m−2·year−1 to 20–50 g·C·m−2·year−1 among areas with sporadic and continuous permafrost. Similar NCE values were observed for a nutrient rich fen and sub-arctic palsa in Scandinavian peatlands [43,44]. However, it is not always possible to compare our seasonal NCE estimates with other studies, because of differences in climate, duration of the study period and variations in snow-cover period. Many studies have observed that spring conditions greatly influence seasonal and annual CO2 exchange, where earlier snow melts and/or warmer spring temperatures almost universally enhance accumulated CO2 uptake in high-boreal and subarctic regions [40,45,46]. Collapsed areas usually behaved as CO2 sinks due to high productivity of bryophytes and restricted respiration in flooded soils. The length of the thawed period was significantly shorter in the northern sites, limiting both decomposition and growth periods, but this effect was apparently compensated by the increase in bryophyte assimilation due to longer daylight conditions in subarctic regions. It is likely that the combination of these two factors was responsible for similar values of NCE in collapsed areas at different sites as total assimilation varying between 20 and 70 g·C·m−2·year−1. Our NCE estimates for collapse scar sites were in the range of values reported for low Arctic tundra sites [47,48,49] and also observed large inter-annual variability in NCE

4.2. Assimilation Rates across Different Landforms

Another important factor that determines ecosystem carbon exchange is photosynthetic activity (i.e., CO2 assimilation rate) of other ground cover vegetation [50]. Assimilation of CO2 by the bryophytes is affected by light intensity, moisture, temperature, and species composition. All these factors varied with ecozone and landform. Upland forests of the southern sites had greater shading than northern uplands and therefore had a limited assimilation rate of bryophyte layer, though the total length of the growing season was longer and the canopy provided some protection from drying. While assimilation rate of the ground cover vegetation was inhibited by shading, relatively good drainage of the upper soil layers, stable soil moisture levels, and abundant input of organic debris from tree crowns provided favorable conditions for high microbial respiration. Bryophyte layer of peat plateaus had a large proportion of lichens that are less effective in CO2 assimilation [51] but are prone to drying, especially in non-treed northern sites. Sphagnum present at peat plateau sites may have been moisture-limited because Sphagnum moss photosynthesis is highly sensitive to moisture [52,53]. Tuittila et al. [54] measured the optimum water table level for photosynthesis by S. angustifolium and observed decreased photosynthesis rate at lower water table levels in bogs. Most effective bryophyte assimilation took place in the collapsed areas due to unimpeded illumination, earliest warming in the spring, unlimited supply of soil moisture, and relatively effective photosynthesis of mosses [55].

4.3. Spatial Variation in Ecosystem Respiration (ER)

Variation in soil temperature at the 5-cm depth explained most of the variability in ER. Q10 values for ER observed in the study (Table 3 and Table 4) were within the range of values reported for boreal forest soils [56,57,58]. Many other studies on boreal forest stands [58,59] have shown that Ts (soil temperature) exerts a major influence on ER. Although, ER in uplands was primarily driven by soil temperature, high water table present in the collapse scar sites inhibited respiration [60]. Therefore the highest ER was observed in the southern-most location in the relatively dry upland soils. In the northern sites, it was limited by short frost-free periods, and frequently by water saturation in peat plateau and collapse scar sites [61]. Spatial variability in ER showed a strong relationship with latitudinal gradient which is a good proxy for the combined influence of radiation, length of growing season, temperature, precipitation, and vegetation cover (Figure 8). The different relationships for upland and peat plateau showed that the vegetation and climate were the most critical factors in regulating the spatial variability in ER with latitude [62,63]. As temperature, length of growing season and vegetation productivity decrease from south to north, ER decreases with latitude.

4.4. Quantitative Relationships between NCE and ER and Climate Variables

Soil temperature and moisture are important parameters in regulating surface CO2 fluxes in boreal ecosystems [60,64,65,66]. Various empirical models have been used to quantify the relationship between ER and temperature, e.g., simple linear by Bisbee, [41] and Wang et al. [43] exponential by Lavigne et al., [64] and Rayment and Jarvis, [65]. We found that NCE and ER were highly correlated to soil temperature with an exponential relationship for all the sites. Increasing temperature can increase surface CO2 fluxes through (a) activating dormant microbes and increasing microbial species richness, thus mineralization of C; (b) increasing root respiration by increasing photosynthates translocation from the aboveground part of the plant to roots; (c) accelerating gas exchange between ecosystems and the atmosphere [60]. However, the temperature sensitivity of NCE and ER is not constant, but tends to be modified by seasonal changes in soil moisture, root biomass, litter inputs, microbial populations, and other seasonally fluctuating conditions and processes [67]. Although temperature represented a significant control on the variability of the surface CO2 fluxes in this study, other studies have found that water table depth or timing of the snowmelt play a more important role in predicting the CO2 uptake capacity in many peatlands. For example, in a minerogenic peatland in Sweden, Peichl et al. [58] found that the growing season NCE was strongly correlated with pre-growing season Tair, (air temperature) and suggested that less root damage would occur during warmer winters and access to water by the vegetation would be easier. Similarly, in a mild maritime climate ombrotrophic bog, winter temperature would be a main control on the inter-annual variability in NEE [61].
Another important driver of ER is the nature and source of the decomposing material. Landform is closely associated with vegetation type. While upland locations at all sites had black spruce stands, collapsed areas had only ground cover vegetation, and peat plateaus had trees in boreal ecozones but no trees in subarctic sites. Accordingly, these locations varied in the amount of plant debris input and its quality. Startsev and Lieffers [68] showed that decomposing litter generally trapped in the bryophyte layer contributed to the total CO2 production, and provided bryophytes with a source of easily available nutrients and carbohydrates. In our study, the total amount of plant debris input was greater in the southern treed areas where trees were bigger and more productive, which was also an important factor in southern treed peat plateaus. In collapsed scar areas and northern subarctic treeless peat plateaus, the only source of decomposing organic matter was the annual production of ground vegetation and small shrubs, which provided considerably less decomposable material.
The type of ground vegetation could be another major variable to determine ER as upland sites were dominated by feathermoss in mid and high-boreal ecozones while peatland was dominated by the lichens. We found that Q10 values were highest at the peat plateau sites dominated by lichens. Bergeron et al. [62] also observed that Q10 was highest under lichen followed by sphagnum and lowest for feathermoss dominated understory vegetation. ER of bryophyte layer was also affected by temperature. The observed decrease in Q10 values from 5.4 and 5.5 to 2.2 and 1.2, upon thawing of peat plateau in low subarctic and high subarctic region respectively, were close to the range reported by previous studies [69,70].
Permafrost is another factor inhibiting respiration rates. ER was most active in the upper soil horizons (Figure 6). It appears that at upland and peat plateau sites, the depth of active layer was sufficient to support microbiological activity throughout the growing season, and therefore presence of permafrost had only a limited effect on ER. On the other hand, at collapse scar sites, accompanying factors such as length of time over which soil was frozen, the mean soil temperature throughout the year, and the presence of perched water table in the soil profile had a major impact on ER [38]. In collapse scar sites, lower ER could be attributed to slow decomposition rates of deep organic matter, low O2 availability in saturated soils, low temperature, and substrate recalcitrance [36,37,71]. Although winter surface CO2 fluxes were not measured in this study, Wang et al. [43] reported that in high-boreal forest, winter SR accounted for 5%–19% of the annual ER, which agrees well with the value reported in similar boreal forests [72] while Kim et al. [39] observed that wintertime soil CO2 efflux contributed 24% of the annual CO2 efflux in Alaska.

4.5. Implicatiuons of Changing Climate

Existing climatic records [73] indicate that climate change over the last five decades has increased mean annual air temperature at the study sites by 0.5–2 °C. Climatic change in is likely to affect NCE in several direct and indirect ways. Longer growing seasons, elevated CO2, and increased nutrients released from decomposing organic carbon may all stimulate plant growth [74] to increase C assimilation. Temperature-driven increases in soil respiration would likely be pronounced in the drained mid-boreal uplands where Q10 values are the largest. Higher respiration rates of drained upland soils combined with large input of organic debris from the tree crowns and limited assimilation of shaded bryophytes determined that uplands were consistent sources of CO2, especially in the southern sites [43]. Low productivity of bryophytes in peat plateaus, in association with limited soil respiration due to greater water-saturated layer and permafrost, resulted in peat plateaus being near-neutral or minor sources of CO2 with little difference across climatic gradient. Degradation of peat plateau to collapse scars will result in a dramatic change in hydrology and surface vegetation at the local level, and may result in a net increase in NCE, which would offset increase in ER depending on the extent of permafrost thawing. Accelerated collapsing of the peat plateau would subject soil to waterlogging, thereby decreasing aerobic respiration. Furthermore, with receding of permafrost, the connectivity of collapsing features would drain the landscape [75,76] resulting in increased active layer depth, thereby making the previously frozen organic matter available for decomposition. However, an increase in the rate of surface assimilation by bryophytes is to be expected in the expanding collapsed areas. With rising water table, the Sphagnum spp. found on hummocks tends to increase productivity [77]. However, lower water table and increase in mean annual air temperature would result in significant increase in surface CO2 emissions, while only minor increase in surface assimilation rates can be expected [61]. As to whether collapse scar sites in boreal and subarctic regions are an annual source or sink for CO2, we cannot know without estimating wintertime fluxes. Even small wintertime effluxes would offset growing season CO2 sinks. There is clearly a pressing need for future research in this area.

5. Conclusions

This study elucidated the changes in the surface CO2 exchange along the longitudinal gradient as influenced by the local landform and soil microclimate variations. Both ER and NCE decreased with latitude with the highest values observed at the upland and the lowest at peat plateau locations while collapse scar sites were C sinks. The strong relationship between ER and latitude can be used to estimate regional ER and the relationship can be refined with more data, especially wintertime measurements. Both NCE and ER were primarily controlled by soil temperature in the upper horizons along the climatic gradient. Environmental conditions and vegetation type determine the C source-sink relationship. With continuously waterlogged conditions at the collapsed scar sites, bryophyte NCE was highest, and was negligible at upland and peat plateau locations. On an average, upland forest sites and peat plateaus were respectively major and minor sources of CO2, collapsed scar sites were sinks of CO2.

Acknowledgments

This project was made possible with the generous support of the Government of Canada Program for International Polar Year, and Natural Resources Canada, Canadian Forest Service. Many thanks are also due to Steve Gooderham, Mike Gravel, Tom Lakusta and Paul Rivard, from the Forest Management Division, Government of the Northwest Territories. Without the valuable contributions of field and laboratory staff, this project would not have been possible and we would like to acknowledge the hard work of: Patrick Hurdle, Thierry Verem Sanders, Ruth Errington, and Catherine McNalty.

Author Contributions

J.S.B. conceived the idea and designed the experiments; N.S. performed the experiments; N.S. and J.S.B. analyzed the data; J.S.B., N.S. and R.S.J. wrote the paper.

Conflicts of Interest

The authors declare no conflict of interest. Funding agencies played no role in the design of the study; in the collection, analyses or interpretation of data; in the writing of the manuscript, or in the decision to publish the results.

References

  1. Abbott, B.W.; Jones, J.B.J.; Schuur, E.; Chapin, F.; Bowden, W.B.; Bret-Harte, M.S.; Epstein, H.E.; Flannigan, M.D.; Harms, T.K.; Hollingsworth, T.N.; et al. Biomass offsets little or none of permafrost carbon release from soils, streams, and wildfire: An expert assessment. Environ. Res. Lett. 2016, 11, 034014. [Google Scholar] [CrossRef]
  2. Schuur, E.G.; McGuire, A.D.; Schädel, C.; Grosse, G.; Harden, J.W.; Hayes, D.J.; Hugelius, G.; Koven, C.D.; Kuhry, P.; Lawrence, D.M.; et al. Climate change and the permafrost carbon feedback. Nature 2015, 520, 171–179. [Google Scholar] [CrossRef] [PubMed]
  3. Schuur, E.A.; Bockheim, G.J.; Canadell, J.G.; Euskirchen, E.; Field, C.B.; Goryachkin, S.V.; Hagemann, S.; Kuhry, P.; Lafleur, P.M.; Lee, H.; et al. Vulnerability of Permafrost Carbon to Climate Change: Implications for the Global Carbon Cycle. Bioscience 2008, 58, 701–714. [Google Scholar] [CrossRef]
  4. Hugelius, G.; Strauss, J.; Zubrzycki, S.; Harden, J.W.; Schuur, E.A.G.; Ping, C.-L.; Schirrmeister, L.; Grosse, G.; Michaelson, G.J.; Koven, C.D.; et al. Estimated stocks of circumpolar permafrost carbon with quantified uncertainty ranges and identified data gaps. Biogeosciences 2014, 11, 6573–6593. [Google Scholar] [CrossRef] [Green Version]
  5. Tarnocai, C.; Canadell, J.G.; Schuur, E.A.G.; Kuhry, P.; Mazhitova, G.; Zimov, S.A. Soil organic carbon pools in the northern circumpolar permafrost region. Glob. Biogeochem. Cycles 2009, 23. [Google Scholar] [CrossRef]
  6. Raich, J.W.; Schlesinger, W.H. The global carbon dioxide flux in soil respiration and its relationship to vegetation and climate. Tellus B 1992, 44, 81–99. [Google Scholar] [CrossRef]
  7. Zhuang, Q.; McGuire, A.D.; O’Neill, K.P.; Harden, J.W.; Romanovsky, V.E.; Yarie, J. Modeling soil thermal and carbon dynamics of a fire chronosequence in interior Alaska. J. Geophys. Res. 2003, 107. [Google Scholar] [CrossRef]
  8. Kurz, W.A.; Shaw, C.H.; Boisvenue, C.; Stinson, G.; Metsaranta, J.; Leckie, D.; Dyk, A.; Smyth, C.; Neilson, E.T. Carbon in Canada’s boreal forest—A synthesis. Environ. Rev. 2014, 21, 260–292. [Google Scholar] [CrossRef]
  9. Price, D.T.; Alfaro, R.I.; Brown, K.J.; Flannigan, M.D.; Fleming, R.A.; Hogg, E.H.; Girardin, M.P.; Lakusta, T.; Johnston, M.; McKenney, D.W.; et al. Anticipating the consequences of climate change for Canada’s boreal forest ecosystems. Environ. Rev. 2013, 21, 322–365. [Google Scholar] [CrossRef]
  10. Harden, J.W.; Koven, C.D.; Ping, C.L.; Hugelius, G.; McGuire, A.D.; Camill, P.; Jorgenson, T.; Kuhry, P.; Michaelson, G.J.; O’Donnell, J.A.; et al. Field information links permafrost carbon to physical vulnerabilities of thawing. Geophys. Res. Lett. 2012, 39, L15704. [Google Scholar] [CrossRef]
  11. Thie, J. Distribution and Thawing of Permafrost in the Southern Part of the Discontinuous Permafrost Zone in Manitoba. Arctic 1974, 27, 189–200. [Google Scholar] [CrossRef]
  12. Waddington, J.M.; Roulet, N.T. Carbon balance of a boreal patterned peatland. Glob. Chang. Biol. 2000, 6, 87–98. [Google Scholar] [CrossRef]
  13. Mitsch, W.J.; Gosselink, J.G. Wetlands, 4th ed.; John Wiley and Sons: Hoboken, NJ, USA, 2007; p. 582. [Google Scholar]
  14. Drewitt, G.B.; Black, T.A.; Nesic, Z.; Humphreys, E.R.; Jork, E.M.; Swanson, R.; Ethier, G.J.; Griffis, T.; Morgenstern, K. Measuring forest-floor CO2 fluxes in a Douglas-fir forest. Agric. For. Meteorol. 2002, 110, 299–317. [Google Scholar] [CrossRef]
  15. Green, R.N.; Trowbridge, R.L.; Klinka, K. Towards a taxonomic classification of humus forms. For. Sci. 1993, 39, 1–49. [Google Scholar]
  16. Halsey, L.A.; Vitt, D.H.; Zoltai, S.C. Disequilibrium response of permafrost in boreal continental western Canada to climate change. Clim. Chang 1995, 30, 57–73. [Google Scholar] [CrossRef]
  17. Moore, T.R.; Roulet, N.T.; Waddington, J.M. Uncertainty in Predicting the Effect of climatic Change on the Carbon Cycling of Canadian Peatlands. Clim. Chang. 1998, 40, 229–245. [Google Scholar] [CrossRef]
  18. Kayranli, B.; Scholz, M.; Mustafa, A.; Hedmark, A. Carbon storage and fluxes within freshwater wetlands: A critical review. Wetlands 2010, 30, 111–124. [Google Scholar] [CrossRef]
  19. Grosse, G.; Harden, J.; Turetsky, M.R.; McGuire, A.D.; Camill, P.; Tarnocai, C.; Frolking, S.; Schuur, E.A.G.; Jorgenson, T.; Marchenko, S.; et al. Vulnerability of high-latitude soil organic carbon in North America to disturbance. J. Geophys. Res. 2011, 116, G00K06. [Google Scholar] [CrossRef]
  20. Liblik, L.; Moore, T.R.; Bubier, J.L.; Robinson, S.D. Methane emissions from wetlands in the discontinuous permafrost zone: Fort Simpson, NWT, Canada. Glob. Biogeochem. Cycles 1997, 11, 485–494. [Google Scholar] [CrossRef]
  21. Turetsky, M.R.; Wieder, R.K.; Vitt, D.H. Boreal peatland C fluxes under varying permafrost regimes. Soil Biol. Biochem. 2002, 34, 907–912. [Google Scholar] [CrossRef]
  22. Prater, J.L.; Chanton, J.P.; Whiting, G.J. Variation in methane production pathways associated with permafrost decomposition in collapse scar bogs of Alberta, Canada. Glob. Biogeochem. Cycle 2007, 21, GB4004. [Google Scholar] [CrossRef]
  23. Flanagan, L.B.; Syed, K.H. Simulation of both photosynthesis and respiration in response to warmer and drier conditions in a boreal peatland ecosystem. Glob. Chang. Biol. 2011, 17, 2271–2872. [Google Scholar] [CrossRef]
  24. Elberling, B.; Michelsen, A.; Schädel, C.; Schuur, E.A.G.; Christiansen, H.H.; Berg, L.; Tamstorf, M.P.; Sigsgaard, C. Long-term CO2 production following permafrost thaw. Nat. Clim. Chang. 2013, 3, 890–894. [Google Scholar] [CrossRef]
  25. Skinner, W.; Maxwell, B. Climatic Patterns, Trends and Scenarios in the Arctic. In Proceedings of the Sixth Biennial AES/DIAND Meeting on Northern Climate & Mid-Study Workshop of the Mackenzie Basin Impact Study, Yellowknife, NT, Canada, 10–14 April 1994; pp. 125–137.
  26. Jassal, R.; Black, A.; Novak, M.; Morgenstern, K.; Nesic, Z.; Gaumont-Guay, D. Relationship between soil CO2 concentrations and forest-floor CO2 effluxes. Agric. For. Meteorol. 2005, 130, 176–192. [Google Scholar]
  27. Millington, R.J.; Quirk, J.M. Transport in Porous Media; Elsevier: Amsterdam, The Netherlands, 1960; pp. 97–106. [Google Scholar]
  28. Sallam, A.; Jury, W.A.; Letey, J. Measurement of gas diffusion coefficient under relatively low air-filled porosity. Soil Sci. Am. J. 1984, 48, 3–6. [Google Scholar] [CrossRef]
  29. SAS Institute Inc. The SAS System for Windows, 9th ed.; SAS Institute Inc.: Cary, NC, USA, 2004. [Google Scholar]
  30. Lee, X.; Wu, H.J.; Sigler, J.; Oishi, C.; Siccama, T. Rapid and transient response of soil respiration to rain. Glob. Chang. Biol. 2004, 10, 1017–1026. [Google Scholar] [CrossRef]
  31. Bond-Lamberty, B.; Thomson, A. Temperature-associated increases in the global soil respiration record. Nature 2010, 464, 597–582. [Google Scholar] [CrossRef] [PubMed]
  32. Bronson, D.R.; Gower, S.T.; Tanner, M.; Linder, M.; van Herk, I. Response of soil surface CO2 flux in a boreal forest to ecosystem warming. Glob. Chang. Biol. 2008, 14, 856–867. [Google Scholar] [CrossRef]
  33. Davidson, E.A.; Belk, E.; Boone, R.D. Soil water content and temperature as independent or confounded factors controlling soil respiration in a temperate mixed hardwood forest. Glob. Chang. Biol. 1998, 4, 217–227. [Google Scholar] [CrossRef]
  34. Davidson, E.A.; Jassens, I.A. Temperature sensitivity of soil carbon decomposition and feedback to climate change. Nature 2006, 440, 165–173. [Google Scholar] [CrossRef] [PubMed]
  35. Schuur, E.A.G.; Abbott, B.W.; Bowden, W.B.; Brovkin, V.; Camill, P.; Canadell, J.G.; Chanton, J.P.; Chapin, F.S., III; Christensen, T.R.; Ciais, P.; et al. Expert assessment of vulnerability of permafrost carbon to climate change. Clim. Chang. 2013, 119, 359–374. [Google Scholar] [CrossRef]
  36. Clymo, R.S. The limits to peat bog growth. Philos. Trans. Soc. R. Ser. B 1984, 3113, 605–654. [Google Scholar] [CrossRef]
  37. Wickland, K.P.; Striegl, R.G.; Neff, J.C.; Sachs, T. Effects of permafrost melting on CO2 and CH4 exchange of a poorly drained black spruce lowland. J. Geophys. Res. 2006, 111, G02011. [Google Scholar] [CrossRef]
  38. Strachan, I.B.; Pelletier, L.; Bonneville, M.-C. Interannual variability in water table depth controls net ecosystem carbon dioxide exchange in a boreal peatland. Biogeochemistry 2016, 127, 99–111. [Google Scholar] [CrossRef]
  39. Kim, Y.; Kim, S.D.; Enomoto, H.; Kushida, K.; Kondoh, M.; Uchida, M. Latitudinal distribution of soil CO2 efflux and temperature along the Dalton Highway, Alaska. Polar Sci. 2013, 7, 162–173. [Google Scholar] [CrossRef]
  40. Aurela, M.; Laurila, T.; Tuovinen, J.-P. The timing of snow melt controls the annual CO2 balance in a subarctic fen. Geophys. Res. Lett. 2004, 31, LI6119. [Google Scholar] [CrossRef]
  41. Bisbee, K.E.; Gower, S.T.; Norman, J.M.; Nordheim, E.V. Environmental controls on ground cover species composition and productivity in a boreal black spruce forest. Oecologia 2001, 129, 261–270. [Google Scholar] [CrossRef]
  42. Yuan, W.P.; Luo, Y.Q.; Richardson, A.D.; Oren, R.; Luyssaert, S.; Janssens, I.A.; Ceulemans, R.; Zhou, X.H.; Grunwald, T.; Aubinet, M.; et al. Latitudinal patterns of magnitude and interannual variability in net ecosystem exchange regulated by biological and environmental variables. Glob. Chang. Biol. 2009, 15, 2905–2920. [Google Scholar] [CrossRef]
  43. Wang, C.; Bond-Lamberty, B.; Gower, S.T. Carbon distribution of a well- and poorly-drained black spruce fire chronosequence. Glob. Chang. Biol. 2003, 9, 1–14. [Google Scholar] [CrossRef]
  44. Aurela, M.; Lohila, A.; Tuovinen, J.-P.; Hatakka, J.; Riutta, T.; Laurila, T. Carbon dioxide exchange on a northern boreal fen. Boreal Environ. Res. 2009, 14, 699–710. [Google Scholar]
  45. Griffis, T.J.; Rouse, W.R.; Waddington, J.M. Interannual variability of net ecosystem CO2 exchange at a subarctic fen. Glob. Biogeochem. Cycles 2000, 14, 1109–1121. [Google Scholar] [CrossRef]
  46. Lafleur, P.M.; Humphrey, E.R. Spring warming and carbon dioxide exchange over low Arctic tundra in central Canada. Glob. Chang. Biol. 2007, 14, 740–756. [Google Scholar] [CrossRef]
  47. Kwon, H.-J.; Oechel, W.C.; Zulueta, R.C.; Hastings, S.J. Effects of climate variability on carbon sequestration among adjacent wet sedge tundra and moist tussock tundra ecosystems. J. Geophys. Res. 2006, 111, G03014. [Google Scholar] [CrossRef]
  48. Groendahl, L.; Friborg, T.; Soegaard, H. Temperature and snowmelt controls on interannual variability in carbon dioxide exchange in the high Arctic. Theor. Appl. Climatol. 2007, 88, 111–125. [Google Scholar] [CrossRef]
  49. Humphreys, E.R.; Lafleur, P.M. Does earlier snowmelt lead to greater CO2 sequestration in two low Arctic tundra ecosystems? Geophys. Res. Lett. 2011, 38, L09703. [Google Scholar] [CrossRef]
  50. Tuba, Z.; Csintalan, Z.; Proctor, M.C.F. Photosynthetic Responses of a Moss, Tortula ruralis, ssp. ruralis, and the Lichens Cladonia convoluta and C. furcata to Water Deficit and Short Periods of Desiccation, and Their Ecophysiological Significance: A Baseline Study at Present-Day CO2 Concentration. New Phytol. 1996, 133, 353–361. [Google Scholar] [CrossRef]
  51. Lund, M.; Lafleur, P.M.; Roulet, N.T.; Lindroth, A.; Christensen, T.R.; Aurela, M.; Chojnicki, B.H.; Flanagan, L.B.; Humphreys, E.R.; Laurila, T.; et al. Variability in exchange of CO2 across 12 northern peatland and tundra sites. Glob. Chang. Biol. 2010, 16, 2436–2448. [Google Scholar] [CrossRef]
  52. McNeil, P.; Waddington, J.M. Moisture controls on Sphagnum growth and CO2 exchange on a cut-over bog. J. Appl. Ecol. 2003, 40, 354–367. [Google Scholar] [CrossRef]
  53. Tuittila, E.-S.; Vasander, H.; Luine, J. Sensitivity of C sequestration in reintroduced Sphagnum to water-level variation in a cutaway peatland. Restor. Ecol. 2004, 12, 483–493. [Google Scholar] [CrossRef]
  54. Moore, T.R.; Bubier, J.L.; Bledzki, L. Litter decomposition in temperate peatland ecosystems: The effect of substrate and site. Ecosystems 2007, 10, 949–963. [Google Scholar] [CrossRef]
  55. Euskirchen, E.S.; Edgar, C.W.; Turetsky, M.R.; Waldrop, M.P.; Harden, J.W. Differential response of carbon fluxes to climate in three peatland ecosystems that vary in the presence and stability of permafrost. J. Geophys. Res. Biogeosci. 2014, 119, 1576–1595. [Google Scholar] [CrossRef]
  56. Gaumont-Guay, D.; Black, T.A.; Barr, A.G.; Jassal, R.S.; Nesic, Z. Biophysical controls on rhizospheric and heterotrophic components of soil respiration in a boreal black spruce stand. Tree Physiol. 2008, 28, 161–171. [Google Scholar] [CrossRef] [PubMed]
  57. Gaumont-Guay, D.; Black, T.A.; Griffis, T.J.; Barr, A.G.; Jassal, R.S.; Nesic, Z. Interpreting the dependence of soil respiration on soil temperature and water content in a boreal aspen stand. Agric. For. Meteorol. 2006a, 140, 220–235. [Google Scholar] [CrossRef]
  58. Bergeron, O.; Margolis, H.A.; Coursolle, C. Forest floor carbon exchange of a boreal black spruce forest in eastern North America. Biogeosciences, 2009, 6, 1849–1864. [Google Scholar] [CrossRef]
  59. Tang, J.W.; Dennis, D.B.; Qi, Y.; Xu, L.K. Assessing soil CO2 efflux using continuous measurement of CO2 profiles in soils with small solid-state sensors. Agric. For. Meteo 2003, 118, 207–220. [Google Scholar] [CrossRef]
  60. Gaumont-Guay, D.; Black, T.A.; Griffis, T.J.; Barr, A.G.; Jassal, R.A.; Nesic, Z. Influence of temperature and drought on seasonal and interannual variations of soil, bole and ecosystem respiration in a boreal aspen stand. Agr. Forest Meteorol. 2006, 140, 203–219. [Google Scholar] [CrossRef]
  61. Helfter, C.; Campbell, C.; Dinsmore, K.J.; Drewer, J.; Coyle, M.; Anderson, M.; Skiba, U.; Nemitz, E.; Billett, M.F.; Sutton, M.A. Drivers of long-term variability in CO2 net ecosystem exchange in a temperate peatland. Biogeosciences 2015, 12, 1799–1811. [Google Scholar] [CrossRef]
  62. Raich, J.W.; Potter, C.S.; Bhagawati, D. Interannual variability in global soil respiration, 1980–94. Glob. Chang. Biol. 2002, 8, 800–812. [Google Scholar] [CrossRef]
  63. Rodeghiero, M.; Cescatti, A. Main determinants of forest soil respiration along an elevation/temperature gradient in the Italian Alps. Glob. Chang. Biol. 2005, 11, 1024–1041. [Google Scholar] [CrossRef]
  64. Lavigne, M.B.; Ryan, M.G.; Anderson, D.E.; Baldocchi, D.D.; Crill, P.M.; Fitzjarrald, D.R.; Goulden, M.L.; Gower, S.T.; Massheder, J.M.; McCaughey, J.H.; et al. Comparing nocturnal eddy covariance measurements to estimates of ecosystem respiration made by scaling chamber measurements at six coniferous boreal sites. J. Geophys. Res. 1997, 102, 28977–28985. [Google Scholar] [CrossRef]
  65. Rayment, M.B.; Jarvis, P.G. Temporal and spatial variation of soil CO2 efflux in a Canadian boreal forest. Soil Biol. Biochem. 2000, 32, 35–45. [Google Scholar] [CrossRef]
  66. Xu, M.; Qi, Y. Soil-surface CO2 efflux and its spatial and temporal variations in a young ponderosa pine plantation in northern California. Glob. Chang. Biol. 2001, 7, 667–677. [Google Scholar] [CrossRef]
  67. Peichl, M.; Öquist, M.; Löfvenius, M.O.; Ilstedt, U.; Sagerfors, J.; Grelle, A.; Lindroth, A.; Nilsson, M.B. A 12-year record reveals pre-growing season temperature and water table level threshold effects on the net carbon dioxide exchange in a boreal fen. Environ. Res. Lett. 2014, 9, 055006. [Google Scholar] [CrossRef]
  68. Startsev, N.A.; Lieffers, V.J. Emission of nitrogen gas, nitrous oxide, and carbon dioxide on rehydration of dry feathermosses. Soil Sci. Soc. Am. J. 2007, 71, 214–218. [Google Scholar] [CrossRef]
  69. Bubier, J.L.; Crill, P.M.; Moore, T.R.; Savage, K.; Varner, R.K. Seasonal patterns and controls on net ecosystem CO2 exchange in a boreal peatland complex. Glob. Biogeochem. Cycles 1998, 12, 703–714. [Google Scholar] [CrossRef]
  70. Lu, X.; Fan, J.; Yan, Y.; Wang, X. Responses of Soil CO2 Fluxes to Short-Term Experimental Warming in Alpine Steppe Ecosystem, Northern Tibet. PLoS ONE 2013, 8. [Google Scholar] [CrossRef] [PubMed]
  71. Yavitt, J.B.; Lang, G.E.; Wieder, R.K. Control of carbon mineralization to CH4 and CO2 in anaerobic, Sphagnum- derived peat from Big Run Bog. West Virginia. Biogeochemisty 1987, 4, 141–157. [Google Scholar] [CrossRef]
  72. Winston, G.C.; Sundquist, E.T.; Stephens, B.B.; Trumbore, S.E. Winter CO2 fluxes in a boreal forest. J. Geophys. Res. 1997, 102, 795–804. [Google Scholar] [CrossRef]
  73. Environment and Climate Change Canada. Adjusted and Homogenized Canadian Climate Data (AHCCD). Available online: http://www.ec.gc.ca/dccha-ahccd/ (accessed on 14 November 2016).
  74. Sistla, S.A.; Moore, J.C.; Simpson, R.T.; Gough, L.; Shaver, G.R.; Schimel, J.P. Long-term warming restructures Arctic tundra without changing net soil carbon storage. Nature 2013, 497, 615–618. [Google Scholar] [CrossRef] [PubMed]
  75. Quinton, W.L.; Hayashi, M.; Chasmer, L.E. Permafrost-thaw-induced land-cover change in the Canadian subarctic: Implications for water resources. Hydrol. Process. 2013, 25, 152–158. [Google Scholar] [CrossRef]
  76. Baltzer, J.L.; Veness, T.; Chasmer, L.E.; Sniderhan, A.E.; Quinton, W.L. Forests on thawing permafrost: Fragmentation, edge effects, and net forest loss. Glob. Chang. Biol. 2014, 20, 824–834. [Google Scholar] [CrossRef] [PubMed]
  77. Bridgham, S.D.; Pastor, J.; Dewey, B.; Weltzin, J.F.; Updegraff, K. Rapid carbon response of peatlands to climate change. Ecology 2008, 89, 3041–3048. [Google Scholar] [CrossRef]
Figure 1. Map of the site locations.
Forests 07 00279 g001
Figure 2. Schematic of the site landform features and key fluxes of CO2. The arrows only represent the major fluxes not their magnitude at any point in time.
Forests 07 00279 g002
Figure 3. Seasonal patterns of soil temperature (Ts) and precipitation (Ppt) during the three year period at Anzac (AB), Fort Simpson (NWT), Norman Wells (NWT) and Inuvik (NWT).
Forests 07 00279 g003
Figure 4. Role of landform on diurnal variation in NCE in upland, peat plateau, and collapse scar on 25 June 2009, at Fort Simpson (NWT) Canada.
Forests 07 00279 g004
Figure 5. Temporal variation in net carbon exchange (NCE) for different landforms at sites within different ecoregions.
Forests 07 00279 g005
Figure 6. Temporal variation in ecosystem respiration (ER) at upland and peat plateau landforms at sites within different ecoregions.
Forests 07 00279 g006
Figure 7. Comparative contribution of different soil layers to soil CO2 efflux in uplands (top panel) and peat plateau (bottom panel) during 2008 at Fort Simpson (NWT) Canada.
Forests 07 00279 g007
Figure 8. Seasonal net carbon exchange (NCE) for different sites and landform positions. MATT (°C) is mean annual air temperature.
Forests 07 00279 g008
Figure 9. Cumulative seasonal surface fluxes for different landforms at sites along the latitudinal gradient.
Forests 07 00279 g009
Table 1. Locations, ecozone permafrost status, and climatic description of the study sites.
Latitude (°)Longitude (°)EcozonePermafrost statusMean Annual Air Temperature (°C)Growing Degree Days above 0 °C, (Days)Mean Annual Snow Pack, (cm)Mean Annual Precipitation, (mm)
Anzac (AZ)56.40−111.03Mid-borealIsolated patches (0%–10%)1.49225132464
Fort Simpson (FS)61.63−121.40High-borealSporadic discontinuous (10%–50%)−2.17206454361
Norman Wells (NW)65.21−127.01Low SubarcticExtensive discontinuous (50%–90%)−4.89181748318
Inuvik (IN)68.32−133.43High SubarcticContinuous (90%–100%)−6.9129560259
Table 2. Parameter values to estimate the effect of soil temperature T (°C) at the 5-cm depth on net carbon exchange (NCE) (g·CO2·m−2·h−1) using equation NCE = ae(bT) and coefficient of determination for landforms across different ecoregions (sites).
SiteLocationa (g·CO2·m−2·h−1)b (°C−1)R2
Mid-borealUpland0.1280.170.91
Peat Plateau0.0180.280.75
Collapse scar0.0720.080.79
High-borealUpland0.1510.090.84
Peat Plateau0.0480.110.91
Collapse scar0.0120.150.82
Low SubarcticUpland0.0350.150.82
Peat Plateau0.0340.110.76
Collapse scar0.0470.110.68
High SubarcticUpland0.0230.160.97
Peat Plateau0.0100.270.87
Collapse scar0.0110.3560.82
Table 3. Parameter values to estimate the effect of soil temperature T (°C) at the 5-cm depth on surface respiration (g·CO2·m−2·h−1) using equation ER = ae(bT) and coefficient of determination for landforms across different ecoregions (sites).
SiteLocationa (g·CO2·m−2·h−1)b (°C−1)R2
Mid-borealUpland0.0610.2510.68
Peat Plateau0.0100.3390.83
High-borealUpland0.1460.0800.63
Peat Plateau0.0010.2160.91
Low SubarcticUpland0.0080.2080.65
Peat Plateau0.0010.5190.58
High SubarcticUpland0.0100.1830.56
Peat Plateau0.0020.2990.46
Table 4. Q10 values for surface respiration in upland (UL), peat plateau (PP) and collapse scars (CS) across different ecoregions (sites).
SiteUplandsPeat PlateauCollapse Scar
Mid-boreal5.3811.493.97
High-boreal3.4111.363.28
Low Subarctic3.165.452.18
High Subarctic2.865.531.22
Table 5. Parameter values to estimate the effect of light on surface assimilation (g·CO2·m−2·h−1) using Equation: F′(CO2) = a’ × ln(Q)−b′ and coefficient of determination for landforms across different ecoregions (sites).
SiteLocationA′b′R2
Mid borealUpland0.410.150.57
Peat Plateau0.450.170.76
Collapse Scar1.270.260.81
High borealUpland0.210.070.71
Peat Plateau0.201.140.55
Collapse Scar0.170.530.67
Low SubarcticUpland0.180.930.69
Peat Plateau0.110.610.93
Collapse Scar0.150.750.74
High SubarcticUpland0.160.640.66
Peat Plateau0.020.030.71
Collapse Scar0.380.120.87
Table 6. Cumulative seasonal (1 June to 30 September 2009) net assimilation rate at different landform positions (in g·C·m−2·season−1).
SiteUplandPeat PlateauCollapse Scar
Low boreal82.6 ± 4.01 Aa139.2 ± 12.4 Ba211.3 ± 9.68 Ca
High boreal62.0 ± 6.58 Ab92.0 ± 8.92 Bb198.0 ± 5.24 Ca
Low Subarctic56.7 ± 3.74 Ac63.3 ± 7.69 Ac127.4 ± 3.92 Cb
High Subarctic38.12 ± 4.62 Ad54.6 ± 8.16 Bc86.5 ± 6.15 Cc
Capital letter represent the p < 0.05 between land form and lower case letter shows the p < 0.05 between sites.

