Article

Carbon and Nitrogen Pools and Fluxes in Adjacent Mature Norway Spruce and European Beech Forests

1
Czech Geological Survey, Klárov 3, 118 21 Prague, Czech Republic
2
Global Change Research Institute, AS CR, Bělidla 986/4a, 60300 Brno, Czech Republic
3
Department of Physical Geography, Faculty of Science, Charles University, Albertov 6, 128 43 Prague, Czech Republic
4
Department of Ecosystem Biology, Faculty of Science, University of South Bohemia, Branišovská 31, 37005 České Budějovice, Czech Republic
*
Author to whom correspondence should be addressed.
Forests 2016, 7(11), 282; https://doi.org/10.3390/f7110282
Submission received: 19 September 2016 / Revised: 31 October 2016 / Accepted: 8 November 2016 / Published: 17 November 2016

Abstract

:
We compared two adjacent mature forest ecosystem types (spruce vs. beech) to unravel the fate of assimilated carbon (C) and the cycling of organic and inorganic nitrogen (N) without the risk of the confounding influences of climatic and site differences when comparing different sites. The stock of C in biomass was higher (258 t·ha−1) in the older (150 years) beech stand compared to the younger (80 years) planted spruce stand (192 t·ha−1), whereas N biomass pools were comparable (1450 kg·ha−1). Significantly higher C and N soil pools were measured in the beech stand, both in forest floor and mineral soil. Cumulative annual CO2 soil efflux was similar among stands, i.e., 9.87 t·ha−1·year−1 of C in the spruce stand and 9.01 t·ha−1·year−1 in the beech stand. Soil temperature explained 78% (Q10 = 3.7) and 72% (Q10 = 4.2) of variability in CO2 soil efflux in the spruce and beech stand, respectively. However, the rather tight N cycle in the spruce stand prevented inorganic N losses, whereas losses were higher in the beech stand and were dominated by nitrate in the mineral soil. Our results highlighted the long-term consequences of forest management on C and N cycling.

1. Introduction

Temperate forests are one of the most important features within the European landscape. They play an important ecological role—providing ecosystem services (e.g., ensuring vital water resources, maintaining biodiversity, scavenging air pollutants)—as well as a social role, with forests being perceived as a “real” natural heritage. Forests are also relevant economic resources (timber production, tourism). Broadleaf forests of lowlands and mixed conifer-broadleaf forests of mid-altitude sites have always been influenced by human activities and therefore have been altered considerably [1,2,3]. The historical retreat of temperate forests, their considerable fragmentation, changes in woody species composition and soil degradation that resulted from over exploitation caused declines in ecosystem stability and biodiversity of temperate forests [4]. Especially in Central Europe, original forest stands dominated by Fagus sylvatica, Abies alba and Picea abies have been almost completely converted to even-aged Norway spruce monocultures. These changes significantly slow down soil formation [5] and alter understory vegetation composition [6].
The influence of tree species composition on the functioning of temperate forests has received increasing attention in recent years due to efforts to alter the even aged spruce monoculture management by introducing broadleaf tree species. Furthermore, spatial distributions of tree species are expected to change as a result of ongoing climate change [7]. In natural forests, expansion of European beech has been well documented in different parts of Europe [8,9,10], and expansion of Norway spruce towards higher altitude was detected in tree-line ecotones in Central Europe [11]. Both natural and human-induced changes in tree species distribution have major impacts on forests functioning.
Augusto and others [12] summarized the effects of evergreen gymnosperms (EG) and deciduous angiosperms (DA) on forest ecosystems, pointing out that EG species generally induce drier soil conditions. However, biomass and litter production were rather similar among tree species groups, and field evidence of higher accumulation of soil carbon stocks under DA species was lacking. Similarly, Vesterdal and others [13] have shown similar carbon (C) and nitrogen (N) soil stocks in spruce and beech stands, while higher forest floor C and N contents were measured in spruce compared to beech stands with the opposite trend in the mineral soil.
A significant fraction of the forest ecosystem C pool is stored in the soil [14]. Carbon allocation from photosynthesis to belowground net primary productivity (NPP) and aboveground NPP might determine the longterm fate of assimilated C as a large proportion of recalcitrant soil C originates from root decomposition [15] and decaying mycorrhizal tissues [16]. Furthermore, beech has deeper roots compared to spruce [17], suggesting different vertical allocation of belowground NPP in the soil profile.
Soil respiration (Fs) represents one of the major fluxes of C to the atmosphere [18] and equals about 55% of C fixed during photosynthesis [19]. It is important to identify environmental factors that control Fs and their effects on CO2 emission rates when potential impacts of environmental change, including community shifts and alteration of moisture/temperature regimes, are studied. Along with soil temperature, moisture, physical and chemical properties, soil respiration varies with vegetation types. Nonetheless, vegetation type seems to be less important in controlling soil respiration rates compared to abiotic factors [20]. Among temperate forest ecosystems, the effect of different tree species on soil respiration rates has often been found to be minimal [21,22,23,24].
Ecosystem productivity depends on various environmental factors, of which nutrient limitation plays an important role due to the stoichiometric constraints of elements in plant tissues [25]. In Europe, N inputs into forest ecosystems accelerated during the 20th century due to human industrial and agricultural activities [26,27]. Higher N availability of this (naturally) limiting nutrient has been demonstrated to be partly responsible for enhanced mountain forest productivity in recent years [28]. Nonetheless, inorganic N leaching has occurred from forested ecosystems across central Europe [29,30,31]; thus, the factors responsible for ecosystem N retention need to be determined in order to predict future ecosystem responses to global change.
In this paper, we provide an assessment of C and N pools and fluxes for adjacent mature European beech and managed Norway spruce forest ecosystems. We focus on (i) differences in C and N biomass and soil pools; (ii) C and N allocations in tree biomass; (iii) dynamics of soil respiration and (iv) input–output budgets of water, C and N. The similar site conditions and acidic deposition history of both stands provide an excellent opportunity to identify the specific role of tree species (intensively managed spruce vs. extensively managed beech) in the long-term regulation of C and N cycling in forest ecosystems.

2. Materials and Methods

2.1. Site Description

The study sites are situated near the Czech-German border in the Ore Mts. (50°35′25″ N, 13°15′11″ E for the spruce stand and 50°35′20″ N, 13°16′1″ E for the beech stand) at an elevation between 780 and 820 m a.s.l., close to the village of Načetín. The spruce stand consists of Norway spruce (Picea abies (L.) Karst.) monoculture planted in the early 1930s, and the beech stand consists of European beech (Fagus sylvatica L.) monoculture. The history of the forests can be briefly described as follows: based on maps of the Stabile cadaster from 1842, both sites were dominated by mixed beech-conifer (spruce/fir) forests. However, soon after this mapping (1850s), the current spruce stand was converted into spruce monoculture, which was first harvested in 1930s. Thus, the current spruce forest is a second generation plantation. Unlike the spruce stand, the beech stand continued as a mixed forest of dominantly beech and spruce (based on aerial photographs from 1953). During the 1970s and 1980s, however, mature spruce trees continuously died off due to air pollution (SO2 emissions causing acid rain), and the stand became pure beech monoculture. In the spruce stand, spruce trees survived the peak acid deposition as the plantation was relatively young. It is likely that before the 2nd World War, dense settlements in that area caused human exploitation of natural resources (timber harvest) and historical agricultural activities (forest pasture, litter raking, see [3]), which affected the surrounding landscape. After the war, German inhabitants were expelled from the former Czechoslovakia, and human activities largely ceased in this border region.
The distance between stands is approximately 1 km; annual precipitation averages 1012 mm (1992–2015), and annual temperature is 6.5 °C. Both stands are underlain by paragneiss bedrock. The dominant soil type is dystric cambisol. Soils at both sites were acidified by acid deposition during the 20th century, which resulted in low soil pH and low base saturation. More substantial soil acidification was documented in the spruce stand due to the higher acid deposition under the spruce canopy compared to the beech stand [32]. In 2003, the pH of the forest floor was 3.80 in the spruce stand and 4.34 in the beech stand, and soil base saturation was 19% and 70% in the spruce and beech stands, respectively. In the mineral soil (up to 40 cm), soil pH was 4.07 in the spruce and 4.23 in the beech stand, and base saturation was 2.8% in the spruce and 5.5% in the beech stand.

2.2. Deposition, Soil Solution Sampling and Analysis

Bulk deposition has been measured since 1992, and throughfall has been sampled since 1993 in the spruce stand and 2003 in the beech stand. Bulk collectors comprise two samplers, and throughfall collectors comprise nine samplers (for more details see [33]). In 2003, a stemflow collector was installed to analyse stemflow fluxes of one representative (based on DBH distribution) beech tree within the beech stand. All input fluxes of elements were measured and analyzed at a monthly time step.
In 2013, four plots (9 m2) within each stand were randomly established to monitor the soil solution chemical composition of the forest floor and mineral soil. At each plot, four to six suction Rhizon samplers were installed in the forest floor (L + F + H horizon), comprising 10 cm long, 2.5 mm diameter porous membranes attached to 50 mL syringes, which were used to apply suction and collect samples. Samples were collected by applying suction, and samples were bulked to provide one composite sample per plot. Within the centre of each plot, a porous suction lysimeter (Prenart) was placed at a depth of 30 cm in the mineral soil. The soil solution was collected by applying suction to a 2 L collecting bottle. The soil solution was sampled in the three-week interval during the snow/freeze free period (usually April–November). The soil solution could not be collected when the soil moisture was low.
Samples were stored at 4 °C, and they were analyzed for nitrate (NO3) and chloride (Cl) by high-performance liquid chromatography (Knauer 1000); ammonium (NH4+) was determined by indophenol blue colorimetry. DOC (dissolved organic carbon) was determined by a nondispersive infrared detector after sample conversion to CO2 by a combustion furnace. Analysis of dissolved nitrogen (DN) was based on sample combustion to NO and its reaction with O3 to produce an excited state of NO2*, which, when it decays to its ground state, emits light. The light is detected by a chemiluminiscence detector and is correlated to a specific amount of nitrogen. DON (dissolved organic nitrogen) was calculated as the difference between the DN and the sum of N-NO3 and N-NH4. DOC and DON samples were filtered (glass fiber Macherey-Nagel) before analysis in a Tekmar-Dohrman Apollo 9000 analyzer (Tekmar Dohrmann, OH, USA).

2.3. Water Budget

To assess water fluxes through the soil profiles, we used measurements of the chloride (Cl) mass budget (Cl input = Cl output). Chlorine compounds are highly soluble in water and mobile in soils, so transport of atmospherically derived Cl through terrestrial ecosystems is rapid and conservative if there is active hydrologic flow. Weathering and other internal sources of Cl are generally negligible compared to atmospheric deposition [34], and although some cycling of Cl has been observed in Swedish forest organic horizons [35], the effect of this on the full-profile or catchment input-output budgets appears limited [36]. The calculated water flux was then used to calculate solute fluxes through the soil profile. Canopy interception was defined as the difference between precipitation and throughfall water fluxes. Evaporation from soil and tree transpiration was defined as the difference between throughfall water fluxes and seepage of the 30 cm soil depth. Total evapo-transpiration (ET) thus comprised the total water vapour flux between the canopy and the atmosphere.

2.4. Soil Sampling, Analysis and Temperature and Moisture Measurements

Soils were quantitatively collected in 2003, based on four replicates within each stand. Soil masses were estimated by excavating 0.5 m2 pits following the method described in [37]. The forest floor was divided into L (litter) and FH (fermentation + humus) horizons. Mineral soil was sampled following the exact depth strata of 0–10 cm, 10–20 cm and 20–40 cm. Forest floor horizons were resampled in 2010 in the spruce stand. In the fine soil fraction (<5 mm for organic horizons and <2 mm in mineral soil), total C and N were simultaneously determined by a Carlo-Erba Fusion 1108 analyzer (Thermo, Torino, Italy).
In 2013, thermometers Pt1000 A class sensor (Environmental Measuring Systems, Brno, Czech Republic) and soil moisture probes Campbell Scientific CS650 (Campbell Scientific, UT, USA) were installed in three replicates in each stand into the boundary layer between the forest floor and mineral soil (to a depth of ca. 7 cm) to continuously monitor the soil temperature and moisture.

2.5. Biomass Measurements and Litterfall Collection

In the spruce stand, two surveys of tree biomass were conducted in 1994 (2500 m2) and 2013 (1000 m2). Diameter at breast high (DBH, in cm), tree height and number of tree individuals were measured. Furthermore, in 1994, eleven trees were cut at the spruce site, and different parts of tree biomass were measured to obtain site-specific biomass functions:
Stem (kg DW) = 0.3397 × (DBH)2 − 1.786 × (DBH) + 10.22 (R2 = 0.99)
Bark (kg DW) = 0.018 × (DBH)2 − 0.0947 × (DBH) + 0.5417 (R2 = 0.99)
Branches (kg DW) = 2.53 × (DBH) − 29.331 (R2 = 0.88)
Needles (kg DW) = 1.55 (DBH) − 16.08 (R2 = 0.87)
Estimation of root biomass was based on equation from [37]:
LN roots (kg DW) = −8.35 + 4.57 × LN(DBH) − 0.33 × LN(DBH)2 + 0.28 × LN(Age) (R2 = 0.97)
Annual aboveground net primary production (ANPP) of different biomass components was calculated for the period 1994 to 2013 from the above equations based on DBH growth measurement.
A biomass survey was conducted in the beech stand in 2013 only, and DBH, tree height and number of tree individuals were measured. Biomass increments for the last 20 years were calculated based on ring width series. The diameters were multiplied by a constant of 1.096 to account for bark thickness and water loss [38]. Total tree biomass was calculated according to changes in DBH measurements using models developed by [39].
Litterfall amount has been measured since 2013, based on 5 frame collectors (0.5 m2) placed randomly within each site. Litterfall was collected bimonthly and divided into needles/leaves, twigs and fruiting parts.
All biomass parts were sampled for total C and N contents. Samples were dried (60 °C), homogenized and analyzed using NCS Flash 2000 (Thermo Scientific, MA, USA). Data on N concentration in roots were obtained from Schulze (2000) [40].

2.6. CO2 Flux Measurements

In each plot within a stand, four soil collars (286.5 cm2) were inserted into the forest floor to a 5 cm depth (16 soil collars in each stand). Soil CO2 efflux (Fs) was measured monthly between 2013 and 2015 during the snow-free period (April–November) using a LiCor infrared gas analyzer LI-8100A (LiCor Biosciences, NE, USA) attached to a LiCor Survey Chamber (8100-103 20 cm survey chamber) (LiCor Biosciences, NE, USA). The chamber was placed on top of open, permanently installed collars for 30 s before measurements. The CO2 efflux was calculated on the basis of a linear increase in chamber CO2 concentration over time.
The relationship between soil temperature and soil respiration was modelled according to the van’t Hoff equation [41]:
Fs = αeβT (where Q10 = eβ10),
where Fs is the respiration rate measured in situ, α and β are fitted parameters, T is measured soil temperature and Q10 is the temperature sensitivity of respiration. The equation was fitted for each stand. Fs was calculated on an hourly basis using site-specific soil temperatures and summarised for the entire year to provide an annual CO2 efflux estimate.

2.7. Belowground C Allocation

Total soil CO2 efflux is the sum of heterotrophic and root respiration. The former is a product of above- and belowground litter production [42]. These authors proposed, based on a mass balance approach, that the difference between Fs and litterfall C can be used to estimate total belowground carbon allocation (TBCA). TBCA = soil respiration − aboveground litter + changes in root, soil and litter carbon stores [43]. Thus, TBCA comprises root production, root respiration, root exudates and plant-assimilated C used by mycorrhizae. The fraction of TBCA that is not used for root respiration is often termed BNPP (belowground net primary production). BNPP of the coarse root production was estimated according to the biomass functions, and BNPP of fine roots was estimated as 14% of NPP following [44]. Total autotrophic respiration (Rtotal) was calculated as 1.33 × (ANPP + BNPP) [45], and root autotrophic respiration (Rroot) was calculated as the difference between Rtotal and aboveground autotrophic respiration (Rabove). Rabove was calculated as 0.96 × ANPP [45]. BNPP of root exudates and myccorhizae (BNPPex/mycc) was calculated as the difference between TBCA and the sum of Rroot and BNPP of roots. As such, gross primary production (GPP) and net primary production (NPP) could be estimated as:
GPP = ANPP + TBCF + Rabove
NPP = GPP − Rtotal
Water use efficiency (WUE) was defined as GPP/ET following Tang et al. [46].

2.8. Statistical Analysis

We used one-way ANOVA to compare soil characteristics (soil mass, C and N pools, C and N concentrations, and C/N ratio), litterfall mass and C and N concentrations, soil solution chemistry and solute fluxes and soil respiration rates between stands. We tested whether data were normally distributed using the Shapiro-Wilk test. The Kruskal-Wallis comparison was used to compare average ranks if data distribution was non-normal. The effects of soil temperature and moisture on CO2 effluxes were modelled using exponential equations. The residuals (CO2 observed − CO2 measured) were related to soil moisture measurements to test whether the unexplained variation in CO2 effluxes could be attributed to soil moisture.

3. Results

3.1. Carbon and Nitrogen Stocks

3.1.1. Carbon and Nitrogen in Vegetation Biomass

In 2013, 540 individual spruce trees and 340 individual beech trees per hectare were present in the stands (Table 1). The age of the trees in the spruce stand was estimated as 80 years, and the age of the beech trees was approximately 150 years.
Spruce stand total C biomass was 192 t·ha−1, of which 69% was stored in the stem, 9% in branches, 6% in needles and 24% in roots. The total biomass C in the beech stand was 258 t·ha−1, 1.34× higher than in the spruce stand. The largest part of biomass C was stored in the stem (72%), with 15% in branches, 1% in leaves and 13% in roots (Table 2).
The total biomass N pool in the spruce stand was 1447 kg·ha−1, of which 26% was in the stem, 16% in branches, 19% in leaves and 39% in roots. In the beech stand, the total biomass N pool was 1454 kg·ha−1, of which 34% was in stem biomass, 37% in branches, 7% in leaves and 22% in roots (Table 2). Due to the higher C pool in beech biomass and rather similar biomass N pools, the total biomass C/N ratio was higher in the beech stand. The lowest C/N ratio (g/g) was measured in needles (40) and leaves (20), whereas the highest C/N ratio was measured in stem biomass (317 in the spruce and 374 in the beech stand).

3.1.2. Carbon and Nitrogen in Soil

The soil carbon concentration was significantly (p < 0.001) lower in deeper mineral soil (10–40 cm) in the spruce stand compared to the beech stand. A higher C concentration in the beech stand was measured in the L horizon (p = 0.034) compared to the spruce stand. No significant differences were observed in the mass of fine soil throughout the soil profile in both forests, but due to the higher %C in the beech stand, a higher C pool was measured in beech forest soil (199 t·ha−1) compared to spruce soil (114 t·ha−1). In both forests, 33% of soil carbon was present in LFH horizons (Table 3).
The soil nitrogen concentration was significantly higher in all horizons in the beech soil compared to spruce soil (p = 0.016 for the L horizon, p = 0.006 for the FH horizon, p = 0.01 for 0–10 cm and p < 0.001 for 10–40 cm). The total N pool accounted for 4460 kg·ha−1 in the spruce stand and 8550 kg·ha−1 in the beech stand. The nitrogen pool in the LFH horizon accounted for 34% of the total soil pool in the spruce stand and 37% in the beech stand. Lower soil C/N was measured in the beech stand, except for the mineral soil from 10 cm to 40 cm.

3.2. Carbon and Nitrogen Fluxes

3.2.1. Water, Carbon and Nitrogen Fluxes in Precipitation and Soil Leachate

The average site precipitation depth was 1092 mm·year−1 between 2013 and 2015. Interception was 331 mm·year−1 in the spruce forest and 194 mm·year−1 in the beech forest. Evaporation from soil and plant transpiration was higher in the beech stand (584 mm) compared to the spruce stand (450 mm). Thus, total evapotranspiration (ET, including interception) was comparable among stands.
Precipitation input of DOC in bulk deposition was 21 kg·ha−1·year−1 over the period 2013–2015. A significantly (p < 0.001) higher concentration of throughfall DOC was measured in the spruce forest compared to the beech forest, representing a flux of 80 kg·ha−1·year−1 in the spruce forest and 36 kg·ha−1·year−1 in the beech forest. In the beech stand, additional input of DOC via stemflow accounted for 11 kg·ha−1·year−1. Throughfall DOC flux was 1.7× higher in the spruce stand compared to the beech stand. Total nitrogen bulk deposition was 11.1 kg·ha−1·year−1, of which DON accounted for 14%, N-NH4 for 54% and N-NO3 for 32%. Only DON concentration in throughfall was significantly (p = 0.003) higher in the spruce stand compared to the beech stand. Inorganic N throughfall concentrations did not differ significantly between forests. Spruce throughfall total N flux was 17.6 kg·ha−1·year−1 and DON accounted for 23% of throughfall N flux. Beech total N throughfall flux was 16.3 kg·ha−1·year−1 and DON accounted for 9%. Beech stemflow of total N was 1.9 kg·ha−1·year−1. Total N flux in the soil surface of the beech forest was thus 18.2 kg·ha−1·year−1 over the period 2013–2015 (Table 4).
The calculated seepage flux of water under the forest floor was higher for the beech stand (443 ± 61 mm) compared to the spruce stand (336 ± 96 mm). Despite significantly (p < 0.001) higher DOC concentrations in the forest floor soil water in the spruce stand (53 ± 16 mg·L−1) compared to the beech stand (40 ± 7.6 mg·L−1), the resulting average annual fluxes of DOC were similar. Similar seepage fluxes of water in 30 cm and non-significant (p = 0.22) differences in DOC concentrations (7.1 ± 2.4 mg·L−1 in spruce and 5.4 ± 1.2 mg·L−1 in beech) resulted in comparable DOC leaching at the 30 cm depth (Table 5).
The concentration of DON in the spruce forest floor (1.64 ± 0.55 mg·L−1) was significantly (p < 0.001) higher compared to the beech forest floor (1.17 ± 0.25 mg·L−1). However, forest floor DON fluxes were comparable among stands. DON fluxes dominated the total N flux in the forest floor of both stands. No significant differences (p = 0.30) were measured in NO3 concentrations in forest floor soil solution among stands (0.97 ± 1.28 mg·L−1 in spruce and 0.88 ± 1.19 mg·L−1 in beech). Total N loss from the forest floor was similar (6.5 kg·ha−1·year−1) in both stands. In mineral soil, at a depth of 30 cm, DON concentration was similar in both stands (0.30 ± 0.25 mg·L−1 in spruce and 0.20 ± 0.10 mg·L−1 in beech). Although DON dominated total mineral soil N flux in the spruce stand, NO3 was the dominant form of N leaving the mineral soil in the beech stand. A large and significant difference (p < 0.001) in NO3 concentration was measured between stands (0.12 ± 0.12 mg·L−1 in spruce and 1.28 ± 1.40 mg·L−1 in beech). DOC/DON ratios were not statistically different between stands for either forest floor or mineral soil (Table 5).

3.2.2. Soil Respiration

Soil efflux (Fs) ranged between 0.95 and 7.3 g·m−2·day−1 of C in the spruce stand (average of 3.65 ± 1.67 g·m−2·day−1) and between 0.59 and 8.5 g·m−2·day−1 of C in the beech stand (average of 3.69 ± 1.87 g·m−2·day−1). Therefore, no significant differences (p = 0.81) in Fs were measured among stands. Strong seasonal variations in Fs were measured, revealing high temperature sensitivity. Soil temperature explained 78% of Fs variability in the spruce stand and 72% in the beech stand (Figure 1). Higher temperature sensitivity of Fs was documented in the beech forest (Q10 = 4.2) compared to the spruce stand (Q10 = 3.7). However, R10 and R0 were similar or slightly higher in the spruce stand (Table 6). Cumulative Fs was 9869 ± 598 kg·ha−1·year−1 of C in the spruce stand compared to 9091 ± 573 kg·ha−1·year−1 of C in the beech stand for the period 2013–2015.

3.2.3. Carbon Allocation and Partitioning in Forest Ecosystems

Carbon allocation of GPP into ANPP was slightly higher in the beech stand (31% of GPP) compared to the spruce stand (27%). However, in the beech stand, allocation to foliage biomass dominated over the woody biomass (Table 7). Litterfall production was higher in the beech stand and 68% of annual litterfall was comprised of leaves. In the spruce stand, lower litterfall production was measured compared to beech, and needlefall accounted for 78% of total litterfall flux (Table 8). Calculated TBCF was higher in the spruce stand compared to the beech stand and accounted for 48% of GPP in the spruce stand and 38% of GPP in the beech stand. Estimated BNPP of coarse roots (based on allometric equations) and BNPP of fine roots (14% of NPP, [44]) were used to estimate the total autotrophic respiration [45]. Similarly, assuming that above-ground autotrophic respiration can be estimated from ANPP [45], then aboveground respiration accounted for 26% of GPP in the spruce forest and for 30% GPP in the beech stand. Root respiration accounted for 28% of GPP in the spruce stand and for 30% GPP in the beech stand. Thus, total GPP allocated to autotrophic respiration was similar (53%) in both forests. Estimated NPP was higher in the spruce stand compared to the beech stand. Aboveground net primary production accounted for 57% of NPP in the spruce stand and for 68% in the beech stand. Estimated BNPP:TBCA was similar in both stands (0.42 in spruce and 0.39 in beech). The proportion of BNPP of fine roots of TBCA was 0.14 in spruce and 0.17 in beech. Similarly, BNPP of root exudates and mycorrhizae accounted for 13% and 16% of the respective TBCA values. WUE was higher in the spruce stand (2.6 g·C·kg−1 H2O) compared to the beech stand (2.2 g C·kg−1 H2O) (Table 7).

3.2.4. Nitrogen Fluxes

The annual requirement of N to sustain ANPP (Nreq above) was calculated as 60 kg·ha−1·year−1 for the spruce stand and 127 kg·ha−1·year−1 for the beech stand. Based on allometric equations, higher annual uptake of N to support coarse root growth (Nreq coarse roots) was calculated for the spruce compared to the beech stand. Fine root growth, estimated as 14% of NPP (McCormack et al., 2015), required 28 kg·ha−1·year−1 of N in the spruce and 23 kg·ha−1·year−1 of N in the beech stand (Table 9). Annual litterfall delivered on average 39 kg·ha−1·year−1 of N to the forest floor in the spruce stand and 56 kg·ha−1·year−1 of N in the beech stand (Table 8). Needlefall N consisted of 80% of total litterfall in the spruce stand, and leaf fall consisted of 73% of total litterfall in the beech stand. The average C/N ratio of litterfall was lower in spruce compared to beech (Table 8). Nitrogen requirements to build up foliage in the beech stand (116 kg·ha−1·year−1) were significantly higher than the annual litterfall N flux; thus, N translocated back to the tree (Ntrans) from foliage tissues accounted for 60 kg·ha−1·year−1. In the spruce stand, only 5.7 kg·ha−1·year−1 of N was translocated during senescence. Therefore, net N uptake was calculated as 71 kg·ha−1·year−1 for both forest ecosystem types. Litterfall and throughfall N fluxes provided 57 kg·ha−1·year−1 of N, which is 14 kg·ha−1·year−1 less than the annual N needs calculated for the spruce stand. On the other hand, a roughly balanced N cycle was calculated for the beech forest (Table 9).

4. Discussion

Both forest stands have been altered by different forest management strategies since the 1850s and by impacts of acid deposition during the 20th century. Former mixed forests were converted into pure spruce monocultures, with current second rotation of Norway spruce in the spruce stand. The beech stand was transformed by acid deposition to broadleaf monoculture during the 1970s and 1980s by induced selective conifer dieback. It is very likely that in the 1850s, similar site conditions prevailed at both stands. Since then, significantly higher soil C and N stocks have been measured in the beech forest compared to the spruce forest. While standing biomass was higher in the beech stand, due to the relatively high tree density combined with the high wood biomass of the 150 year old beech forest, the biomass N stocks were comparable among stands, resulting in a lower C/N ratio in the spruce stand compared to the beech stand.
Although estimated historical N inputs were higher in the spruce stand due to higher pollutant scavenging by spruce needles [47], current deposition fluxes of N are similar in both forests. On the contrary, DOC throughfall fluxes were higher in the spruce stand. Few differences were measured in the DOC soil solution fluxes in the soil profiles. Nitrogen fluxes were dominated by DON at both stands, with higher NO3 losses in the beech stand. Soil respiration dynamics were similar for both forest sites, with slightly higher Q10 in the beech stand compared to the spruce stand. As a result, annual soil respiration was similar at both sites. Higher litterfall C flux in the beech forest caused lower total belowground carbon allocation (TBCA) compared to the spruce stand. The estimated fraction of TBCA that accounted for belowground net primary productivity (BNPP) was similar in both forest ecosystems. Due to the lower TBCA, both gross primary productivity (GPP) and net primary productivity (NPP) were lower in the beech stand compared to the spruce stand. Due to the similar evapotranspiration (ET) in both stands, water use efficiency (WUE) was higher in the spruce stand compared to the beech stand. Higher N fluxes were measured in the beech stand compared to the spruce stand, together with higher susceptibility of inorganic N losses in the beech stand compared to the spruce stand.

4.1. Tree Species Effects on C Cycling

Annual litterfall was higher in the beech stand compared to the spruce stand. Spruce litterfall flux was comparable to other studies on temperate forests of similar age, whereas beech litterfall was higher at our investigated stand [48,49]. The relatively high measured litter flux in the beech stand was a result of high crown area and dimensions of beech trees in the plot. Litterfall is an important component of forest ecosystem NPP and nutrient cycling [50]; thus, it is highly important for forest management strategies to sequester C [51]. Our results suggest that old growth broadleaf forest could deliver a substantial amount of assimilated C to the forest floor compared with lower inputs in managed forests.
Surprisingly similar fluxes of the DOC from the forest floor were measured in the two forest stands. DOC flux represented 11% of annual litterfall flux in the spruce stand and 6% of annual litterfall flux in the beech stand. This can be interpreted as showing that spruce litter is an important source of soil solution DOC [52]. As for the forest floor, similar seepage fluxes of DOC were observed in the mineral soil. A significant reduction of DOC flux occurred from top soil to 40 cm depth, by roughly 80%. Whether it is absorbed in the mineral soil or respired needs further research. However, despite comparable fine soil pools in both forest floor and mineral soil, significantly higher C concentration in deeper mineral soil (20–40 cm) caused a significantly higher soil C pool in the beech stand compared to the spruce stand. As we did not observe significantly higher DOC flux from decaying litter in the beech stand compare to the spruce stand, we suggest that higher soil C pool under the beech forest was a result of long-term accumulation of recalcitrant SOM that originated from root and mycorrhizal decomposition [15,16]. Simultaneously, higher contents of oxalate-extractable Fe and Al were found in the beech mineral soil [53], suggesting higher sorption capacity in this stand, favouring C sequestration in the beech stand over the spruce stand. Contrary to previous paired studies (e.g., [13]), we did find a higher C stock in the forest floor of the beech stand compared to the spruce stand. In an earlier study, we documented partial loss of forest floor C in the spruce stand as a result of recovery from acidification [54]. In the early 1990s, forest floor C mass was 58 t·ha−1, comparable to the current beech stand, but it has since declined by 47%. We do not know whether a similar proportional decline occurred at the beech stand due to the lack of available historical data. We can only suggest that relatively high N availability at the beech stand (low soil C/N, some inorganic N leaching) may have stimulated greater stabilization into humus through a combination of chemical reactions and enzyme inhibition [55,56], thus preventing SOM loss from the forest floor after acidification retreat.
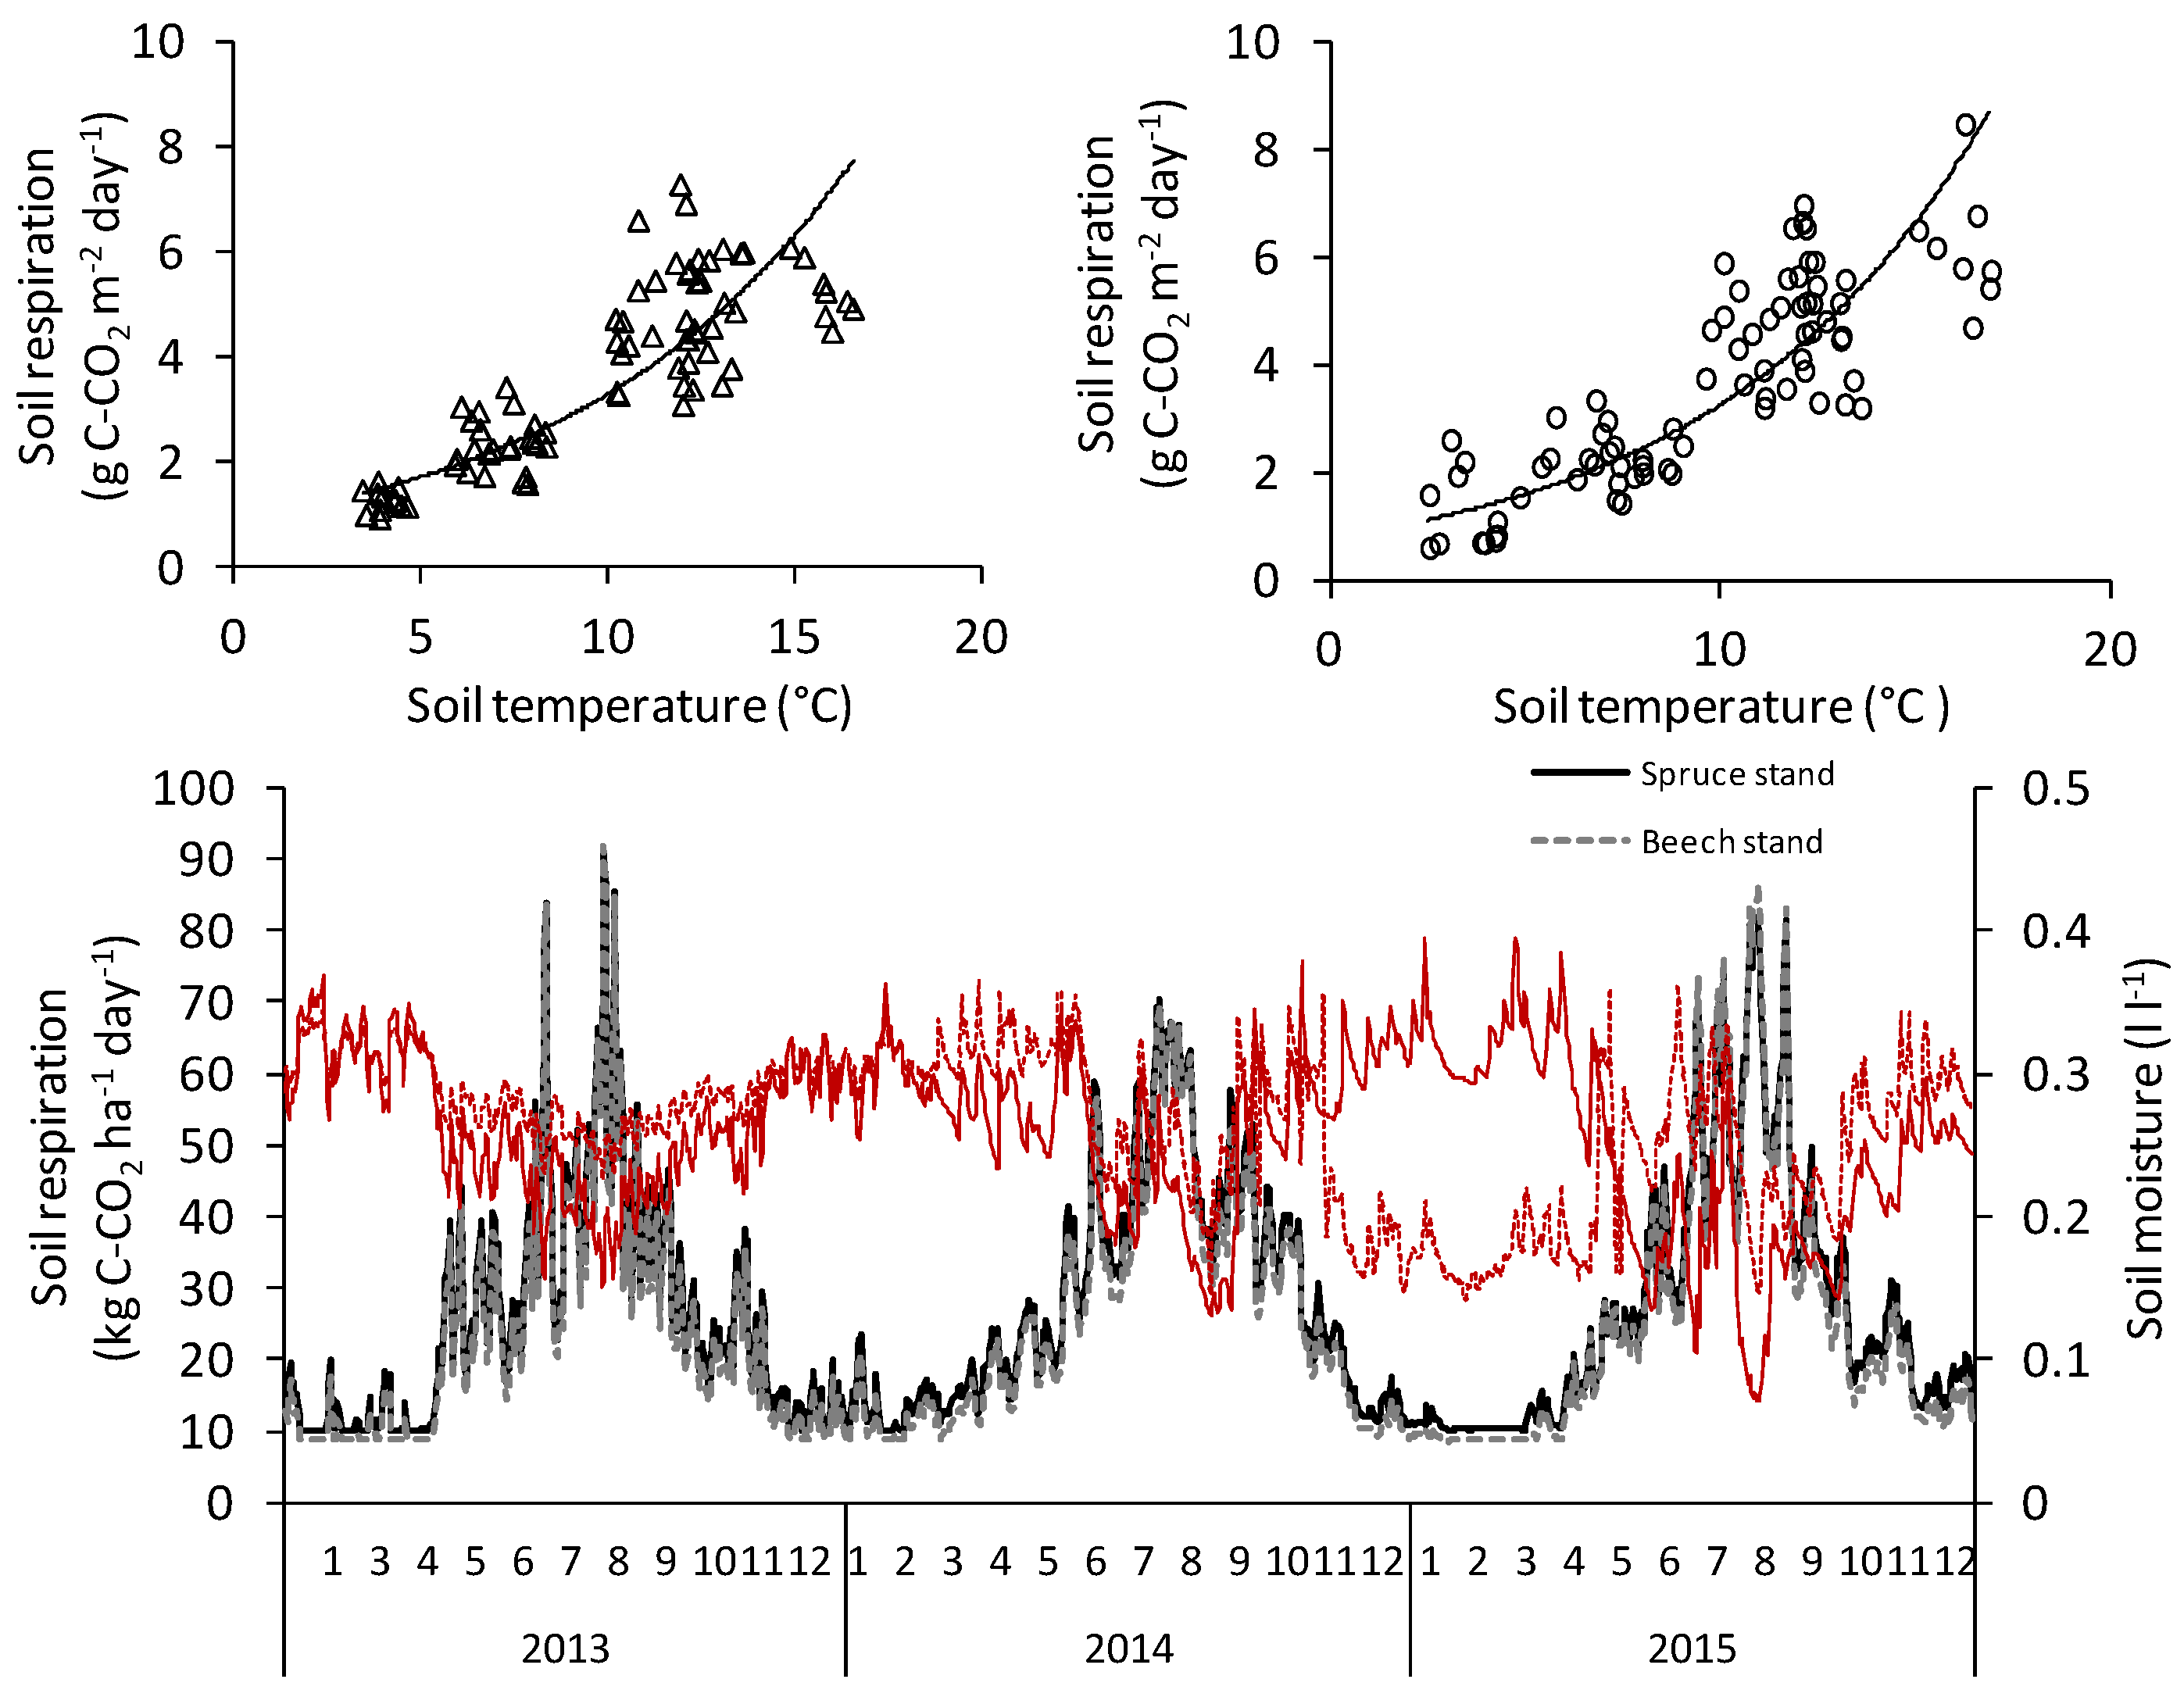
Soil temperature explained 78% and 72% of temporal variation in soil respiration in the spruce and beech stands, respectively. Soil moisture did not provide additional explanatory power in multiple regression analysis, suggesting low moisture stress in our mountainous forest ecosystems. Q10 was slightly higher in the beech stand (4.2) compared to the spruce stand (3.7), but both values were close to the Q10 values reported for other temperate ecosystems [23,41,57]. Based on our calculations, potential respiration at 0 °C was higher in the spruce (0.89 g·m−2·day−1 of C) than in the beech stand (0.78 g·m−2·day−1 of C) and similar at 10 °C. Thus, annual CO2 soil efflux was higher in the spruce stand compared to the beech stand, due to the calculated higher soil respiration in winter and spring periods.
One of the assumptions when calculating TBCA is that the total soil C pool is in a steady state. This assumption might be violated, given the significant decline of forest floor C in the spruce stand noted above [54]. It is difficult to predict whether the spruce soil is currently in a steady state; thus, further calculation might be biased by the annual net loss of C from soil. Moreover, comparison with published relationships between soil respiration and litterfall presented in [42,58] suggested higher soil CO2 efflux compared to annual C in litterfall in the spruce stand. The soil respiration rate of the beech stand is in line with similar published global measurements. Based on our data, 42% and 39% of TBCA goes to the BNPP in the spruce and beech stand, respectively. This is less than published results from the Rocky Mountains by McDowell and others [59], but within the range of BNPP:TBCA ratios (0.26–0.53) published by Litton and Giardina [60]. Based on our calculation, 27% and 34% of TBCA (spruce and beech, respectively) goes to the fine roots, mycorrhizal production and root exudates. Our estimates of fine root production and root respiration are based on literature review data [44,45] with the same partitioning of NPP applied to both stands. Thus, the presented results are more or less indicative. Nevertheless, our estimates are close to a published review by Nadelhoffer and Raich [61], who estimated that approx. 33% of TBCA goes to fine root production.
Calculated ANPP and BNPP were used to calculate autotrophic respiration of both belowground and aboveground components [45] to constrain GPP of both stands. Despite similar ANPP, lower BNPP at the beech stand caused lower GPP compared to the spruce stand. However, both GPP and NPP were lower in the old beech forest ecosystem compared to the younger spruce forest, suggesting continuous decline of both GPP and Rtotal in aging forests [62,63]. Similar evapotranspiration (ET) for both stands and lower GPP for the beech stand resulted in lower WUE for the beech stand compared to the spruce stand.

4.2. Tree Species Effects on N Cycling

In the spruce throughfall, higher DON and lower NH4 fluxes were measured compared to beech throughfall. Our results are in line with the study of Kopacek and others [64], showing the importance of the Norway spruce canopy in chemical N transformation of precipitation. On average, beech stemflow accounted for roughly 10% of total N input to the forest floor by precipitation. Despite similar current N throughfall fluxes, estimated historical N deposition to the spruce forest was higher compared with the beech stand [32], suggesting higher cumulative N deposition flux in the spruce plantation compared to the beech forest. Litterfall N flux was higher in the beech stand compared to the spruce stand; however, a lower C/N litterfall ratio was measured in the spruce litter (42) compared to beech litter (52). Combined precipitation and litterfall fluxes yielded higher N flux in the forest floor in the beech stand compared to the spruce stand. Dissolved losses of N from the forest floor accounted for 16% of annual N litterfall in both stands. Forest floor N losses were dominated by DON, with higher inorganic N leaching (mainly as NO3) in the beech stand compared to the spruce stand. Nevertheless, long-term measurements at the spruce stand revealed cessation of NO3 leaching following reduction of acid deposition [33]. Currently, N seepage losses in the 30 cm soil depth account for ca. 10% and 23% of precipitation inputs in the spruce and beech forests, respectively.
Annual forest requirements to build up canopy foliage accounted for 45 kg·ha−1·year−1 of N in the spruce stand and for 116 kg·ha−1·year−1 of N in the beech stand. Those values are, with respect to the beech stand, much higher than annual N recycling through aboveground litter production and precipitation deposition. Thus, retranslocation of N from senescing foliage is probably crucial for N retention in the beech stand. We may hypothesise that retranslocation of N before the onset of litterfall prevents the ecosystem from leaching higher amounts of this limiting nutrient, as enhanced SOM mineralization and nitrification in the period of low plant N demand can attribute to the mineral N losses from the ecosystem. Calculated Nuptake from soil was, due to N translocation, similar in both forest stands. Moreover, calculated potential N soil requirements were higher compared to N inputs via throughfall and litterfall in the spruce stand and comparable in the beech stand. This suggests more tightly constrained N cycling in the spruce stand compared to the beech stand. Higher susceptibility of the beech stand to inorganic N soil leaching could be due to this less constrained N cycling. However, high gross N mineralization and nitrification rates in old growth forests [65,66] can lead to N losses when availability of labile C declines. Thus, N leaching in an old growth beech stand can be a result of C limitation coupled with a higher N availability due to the higher total N return in litter [50].

5. Conclusions

Forest management activities and the history of acid deposition induced considerable changes in dominant tree species distribution in the study area. We compared second generation of Norway spruce plantation with extensively managed European beech forest in terms of C and N pools and fluxes. Significantly higher C and N soil pools were measured in the beech stand suggesting higher sorption capacity in this stand, favouring long-term C sequestration in the beech stand over the spruce stand. Soil respiration dynamics were similar for both forest sites, with slightly higher Q10 in the beech stand compared to the spruce stand. However, similar fluxes of soil water DOC were measured among both stands. Higher N fluxes were measured in the beech stand compared to the spruce stand, together with higher susceptibility of inorganic N losses in the beech stand compared to the spruce stand. Calculated whole ecosystem C and N budgets serve important input data for ecosystem models, which often aims to quantify long-term consequences of land use changes on landscape C and N retention.

Acknowledgments

This study was supported by the Czech Science Foundation grant No. 14-33311S.

Author Contributions

Filip Oulehle, Karolina Tahovská and Jiří Bárta conceived and designed the experiments; Michal Růžek and Oldřich Myška performed the experiments; Filip Oulehle and Michal Růžek analyzed the data; Filip Oulehle wrote the paper.

Conflicts of Interest

The authors declare no conflict of interest.

References

  1. Hermy, M.; Verheyen, K. Legacies of the past in the present-day forest biodiversity: A review of past land-use effects on forest plant species composition and diversity. Ecol. Res. 2007, 22, 361–371. [Google Scholar] [CrossRef]
  2. Kaplan, J.O.; Krumhardt, K.M.; Zimmermann, N. The prehistoric and preindustrial deforestation of Europe. Quat. Sci. Rev. 2009, 28, 3016–3034. [Google Scholar] [CrossRef]
  3. Hofmeister, J.; Oulehle, F.; Krám, P.; Hruška, J. Loss of nutrients due to litter raking compared to the effect of acidic deposition in two spruce stands, Czech Republic. Biogeochemistry 2008, 88, 139–151. [Google Scholar] [CrossRef]
  4. Spiecker, H. Silvicultural management in maintaining biodiversity and resistance of forests in Europe—Temperate zone. J. Environ. Manag. 2003, 67, 55–65. [Google Scholar] [CrossRef]
  5. Šamonil, P.; Vašíčková, I.; Daněk, P.; Janík, D.; Adam, D. Disturbances can control fine-scale pedodiversity in old-growth forests: Is the soil evolution theory disturbed as well? Biogeosciences 2014, 11, 5889–5905. [Google Scholar] [CrossRef]
  6. Augusto, L.; Dupouey, J.-L.; Ranger, J. Effects of tree species on understory vegetation and environmental conditions in temperate forests. Ann. For. Sci. 2003, 60, 823–831. [Google Scholar] [CrossRef]
  7. Boucher-Lalonde, V.; Morin, A.; Currie, D.J. How are tree species distributed in climatic space? A simple and general pattern. Glob. Ecol. Biogeogr. 2012, 21, 1157–1166. [Google Scholar] [CrossRef]
  8. Poljanec, A.; Ficko, A.; Boncina, A. Spatiotemporal dynamic of European beech (Fagus sylvatica L.) in Slovenia, 1970–2005. For. Ecol. Manag. 2010, 259, 2183–2190. [Google Scholar] [CrossRef]
  9. Magri, D. Patterns of post-glacial spread and the extent of glacial refugia of European beech (Fagus sylvatica). J. Biogeogr. 2008, 35, 450–463. [Google Scholar] [CrossRef]
  10. Janík, D.; Král, K.; Adam, D.; Hort, L.; Samonil, P.; Unar, P.; Vrska, T.; McMahon, S. Tree spatial patterns of Fagus sylvatica expansion over 37 years. For. Ecol. Manag. 2016, 375, 134–145. [Google Scholar] [CrossRef]
  11. Treml, V.; Ponocná, T.; Büntgen, U. Growth trends and temperature responses of treeline Norway spruce in the Czech-Polish Sudetes Mountains. Clim. Res. 2012, 55, 91–103. [Google Scholar] [CrossRef]
  12. Augusto, L.; De Schrijver, A.; Vesterdal, L.; Smolander, A.; Prescott, C.; Ranger, J. Influences of evergreen gymnosperm and deciduous angiosperm tree species on the functioning of temperate and boreal forests. Biol. Rev. 2015, 90, 444–466. [Google Scholar] [CrossRef] [PubMed]
  13. Vesterdal, L.; Schmidt, I.K.; Callesen, I.; Nilsson, L.O.; Gundersen, P. Carbon and nitrogen in forest floor and mineral soil under six common European tree species. For. Ecol. Manag. 2008, 255, 35–48. [Google Scholar] [CrossRef]
  14. De Vries, W.; Reinds, G.J.; Posch, M.; Sanz, M.J.; Krause, G.H.M.; Calatayud, V.; Renaud, J.P.; Dupouey, J.L.; Sterba, H.; Vel, E.M.; et al. Intensive Monitoring of Forest Ecosystems in Europe; Forest Intensive Monitoring Coordinating Institute: Geneva, Switzerland, 2003. [Google Scholar]
  15. Rasse, D.P.; Rumpel, C.; Dignac, M.-F. Is soil carbon mostly root carbon? Mechanisms for a specific stabilisation. Plant Soil 2005, 269, 341–356. [Google Scholar] [CrossRef]
  16. Godbold, D.L.; Hoosbeek, M.R.; Lukac, M.; Cotrufo, M.F.; Janssens, I.A.; Ceulemans, R.; Polle, A.; Velthorst, E.J.; Scarascia-Mugnozza, G.; De Angelis, P.; et al. Mycorrhizal Hyphal Turnover as a Dominant Process for Carbon Input into Soil Organic Matter. Plant Soil 2006, 281, 15–24. [Google Scholar] [CrossRef]
  17. Oostra, S.; Majdi, H.; Olsson, M. Impact of tree species on soil carbon stocks and soil acidity in southern Sweden. Scand. J. For. Res. 2006, 21, 364–371. [Google Scholar] [CrossRef]
  18. Raich, J.; Schlesinger, W. The global carbon-dioxide flux in soil respiration and its relationship to vegetation and climate. Explor. J. 1992, 44, 81–99. [Google Scholar]
  19. Janssens, I.A.; Lankreijer, H.; Matteucci, G.; Kowalski, A.S.; Buchmann, N.; Epron, D.; Pilegaard, K.; Kutsch, W.; Longdoz, B.; Grunwald, T.; et al. Productivity overshadows temperature in determining soil and ecosystem respiration across European forests. Glob. Chang. Biol. 2001, 7, 269–278. [Google Scholar] [CrossRef]
  20. Raich, J.W.; Tufekciogul, A. Vegetation and soil respiration: Correlations and controls. Biogeochemistry 2000, 48, 71–90. [Google Scholar] [CrossRef]
  21. Ladegaard-Pedersen, P.; Elberling, B.; Vesterdal, L. Soil carbon stocks, mineralization rates, and CO2 effluxes under 10 tree species on contrasting soil types. Can. J. For. Res. 2005, 35, 1277–1284. [Google Scholar] [CrossRef]
  22. Elberling, B.; Ladegaard-Pedersen, P. Subsurface CO2 Dynamics in Temperate Beech and Spruce Forest Stands. Biogeochemistry 2005, 75, 479–506. [Google Scholar] [CrossRef]
  23. Borken, W.; Xu, Y.-J.; Davidson, E.A.; Beese, F. Site and temporal variation of soil respiration in European beech, Norway spruce, and Scots pine forests. Glob. Chang. Biol. 2002, 8, 1205–1216. [Google Scholar] [CrossRef]
  24. Vesterdal, L.; Elberling, B.; Christiansen, J.R.; Callesen, I.; Schmidt, I.K. Soil respiration and rates of soil carbon turnover differ among six common European tree species. For. Ecol. Manag. 2012, 264, 185–196. [Google Scholar] [CrossRef]
  25. Körner, C. Paradigm shift in plant growth control. Opin. Plant Biol. 2015, 25, 107–114. [Google Scholar] [CrossRef] [PubMed]
  26. Kopáček, J.; Posch, M. Anthropogenic nitrogen emissions during the Holocene and their possible effects on remote ecosystems. Glob. Biogeochem. Cycles 2011, 25, GB2017. [Google Scholar] [CrossRef]
  27. Dise, N.B.; Wright, R.F. Nitrogen leaching from European forests in relation to nitrogen deposition. For. Ecol. Manag. 1995, 71, 153–162. [Google Scholar] [CrossRef]
  28. Kolář, T.; Čermák, P.; Oulehle, F.; Trnka, M.; Štěpánek, P.; Cudlín, P.; Hruška, J.; Büntgen, U.; Rybníček, M. Pollution control enhanced spruce growth in the “Black Triangle” near the Czech-Polish border. Sci. Total Environ. 2015, 538, 703–711. [Google Scholar] [CrossRef] [PubMed]
  29. Oulehle, F.; McDowell, W.H.; Aitkenhead-Peterson, J.A.; Krám, P.; Hruška, J.; Navrátil, T.; Buzek, F.; Fottová, D. Long-Term Trends in Stream Nitrate Concentrations and Losses Across Watersheds Undergoing Recovery from Acidification in the Czech Republic. Ecosystems 2008, 11, 410–425. [Google Scholar] [CrossRef]
  30. Gundersen, P.; Callesen, I.; de Vries, W. Nitrate leaching in forest ecosystems is controlled by forest floor C/N ratio. Environ. Pollut. 1998, 102, 403–407. [Google Scholar] [CrossRef]
  31. MacDonald, J.A.; Dise, N.B.; Matzner, E.; Armbruster, M.; Gundersen, P.; Forsius, M. Nitrogen input together with ecosystem nitrogen enrichment predict nitrate leaching from European forests. Glob. Chang. Biol. 2002, 8, 1028–1033. [Google Scholar] [CrossRef]
  32. Oulehle, F.; Hruška, J.; Hruska, J. Tree species (Picea abies and Fagus sylvatica) effects on soil water acidification and aluminium chemistry at sites subjected to long-term acidification in the Ore Mts., Czech Republic. J. Inorg. Biochem. 2005, 99, 1822–1829. [Google Scholar] [CrossRef] [PubMed]
  33. Oulehle, F.; Hofmeister, J.; Cudlin, P.; Hruska, J.; Cudlín, P.; Hruška, J. The effect of reduced atmospheric deposition on soil and soil solution chemistry at a site subjected to long-term acidification, Nacetin, Czech Republic. Sci. Total Environ. 2006, 370, 532–544. [Google Scholar] [CrossRef] [PubMed]
  34. Juang, F.H.T.; Johnson, N.M. Cycling of chlorine through a forested watershed in New England. J. Geophys. Res. 1967, 72, 5641–5647. [Google Scholar] [CrossRef]
  35. Oberg, G.; Sanden, P. Retention of chloride in soil and cycling of organic matter-bound chlorine. Hydrol. Process. 2005, 19, 2123–2136. [Google Scholar] [CrossRef]
  36. Svensson, T.; Lovett, G.M.; Likens, G.E. Is chloride a conservative ion in forest ecosystems? Biogeochemistry 2012, 107, 125–134. [Google Scholar] [CrossRef]
  37. Wirth, C.; Schumacher, J.; Schulze, E.-D. Generic biomass functions for Norway spruce in Central Europe-a meta-analysis approach toward prediction and uncertainty estimation. Tree Physiol. 2004, 24, 121–139. [Google Scholar] [CrossRef] [PubMed]
  38. Čada, V.; Šantrůčková, H.; Šantrůček, J.; Kubištová, L.; Seedre, M.; Svoboda, M. Complex Physiological Response of Norway Spruce to Atmospheric Pollution—Decreased Carbon Isotope Discrimination and Unchanged Tree Biomass Increment. Front. Plant Sci. 2016, 7, 805. [Google Scholar] [CrossRef] [PubMed]
  39. Wutzler, T.; Wirth, C.; Schumacher, J. Generic biomass functions for Common beech (Fagus sylvatica) in Central Europe: predictions and components of uncertainty. Can. J. For. Res. 2008, 38, 1661–1675. [Google Scholar] [CrossRef]
  40. Schulze, E.D. Carbon and Nitrogen Cycling in European Forest Ecosystems. Ecol. Stud. 2000, 142, 500. [Google Scholar]
  41. Davidson, E.A.; Janssens, I.A.; Luo, Y. On the variability of respiration in terrestrial ecosystems: Moving beyond Q10. Glob. Chang. Biol. 2006, 12, 154–164. [Google Scholar] [CrossRef]
  42. Raich, J.W.; Nadelhoffer, K.J. Belowground Carbon Allocation in Forest Ecosystems: Global Trends. Ecology 1989, 70, 1346–1354. [Google Scholar] [CrossRef]
  43. Ryan, M.G.; Law, B.E. Interpreting, measuring, and modeling soil respiration. Biogeochemistry 2005, 73, 3–27. [Google Scholar] [CrossRef]
  44. McCormack, M.L.; Dickie, I.A.; Eissenstat, D.M.; Fahey, T.J.; Fernandez, C.W.; Guo, D.; Helmisaari, H.-S.; Hobbie, E.A.; Iversen, C.M.; Jackson, R.B.; et al. Redefining fine roots improves understanding of below-ground contributions to terrestrial biosphere processes. New Phytol. 2015, 207, 505–518. [Google Scholar] [CrossRef] [PubMed]
  45. Litton, C.M.; Raich, J.W.; Ryan, M.G. Carbon allocation in forest ecosystems. Glob. Chang. Biol. 2007, 13, 2089–2109. [Google Scholar] [CrossRef]
  46. Tang, X.; Li, H.; Desai, A.R.; Nagy, Z.; Luo, J.; Kolb, T.E.; Olioso, A.; Xu, X.; Yao, L.; Kutsch, W.; et al. How is water-use efficiency of terrestrial ecosystems distributed and changing on Earth? Sci. Rep. 2014, 4, 7483. [Google Scholar] [CrossRef] [PubMed] [Green Version]
  47. Oulehle, F.; Kopáček, J.; Chuman, T.; Černohous, V.; Hůnová, I.; Hruška, J.; Krám, P.; Lachmanová, Z.; Navrátil, T.; Štěpánek, P.; et al. Predicting sulphur and nitrogen deposition using a simple statistical method. Atmos. Environ. 2016, 140, 456–468. [Google Scholar] [CrossRef]
  48. Hansen, K.; Vesterdal, L.; Schmidt, I.K.; Gundersen, P.; Sevel, L.; Bastrup-Birk, A.; Pedersen, L.B.; Bille-Hansen, J. Litterfall and nutrient return in five tree species in a common garden experiment. For. Ecol. Manag. 2009, 257, 2133–2144. [Google Scholar] [CrossRef]
  49. Augusto, L.; Ranger, J.; Binkley, D.; Rothe, A. Impact of several common tree species of European temperate forests on soil fertility. Ann. For. Sci. 2002, 59, 233–253. [Google Scholar] [CrossRef]
  50. Prescott, C.E. The influence of the forest canopy on nutrient cycling. Tree Physiol. 2002, 22, 1193–200. [Google Scholar] [CrossRef] [PubMed]
  51. Liu, Y.B.; Dulchavsky, S.; Henry, S.; Dulchavsky, D.; Gautam, S. Biolistic augmentation of impaired wound healing In steroid treated rats. J. Am. Coll. Surg. 2004, 199, S59. [Google Scholar] [CrossRef]
  52. Don, A.; Kalbitz, K. Amounts and degradability of dissolved organic carbon from foliar litter at different decomposition stages. Soil Biol. Biochem. 2005, 37, 2171–2179. [Google Scholar] [CrossRef]
  53. Navrátil, T.; Shanley, J.B.; Rohovec, J.; Oulehle, F.; Šimeček, M.; Houška, J.; Cudlín, P. Soil mercury distribution in adjacent coniferous and deciduous stands highly impacted by acid rain in the Ore Mountains, Czech Republic. Appl. Geochemistry 2016, 75, 63–75. [Google Scholar] [CrossRef]
  54. Oulehle, F.; Evans, C.D.; Hofmeister, J.; Krejci, R.; Tahovska, K.; Persson, T.; Cudlin, P.; Hruska, J. Major changes in forest carbon and nitrogen cycling caused by declining sulphur deposition. Glob. Chang. Biol. 2011, 17, 3115–3129. [Google Scholar] [CrossRef]
  55. Prescott, C.E. Litter decomposition: what controls it and how can we alter it to sequester more carbon in forest soils? Biogeochemistry 2010, 101, 133–149. [Google Scholar] [CrossRef]
  56. Fog, K. The effect of added nitrogen on the rate of decomposition of organic matter. Biol. Rev. 1988, 63, 433–462. [Google Scholar] [CrossRef]
  57. Janssens, I.A.; Pilegaard, K. Large seasonal changes in Q10 of soil respiration in a beech forest. Glob. Chang. Biol. 2003, 9, 911–918. [Google Scholar] [CrossRef]
  58. Davidson, E.A.; Savage, K.; Bolstad, P.; Clark, D.S.; Curtis, P.S.; Ellsworth, D.S.; Hanson, P.J.; Law, B.E.; Luo, Y.; Pregitzer, K.S.; et al. Belowground carbon allocation in forests estimated from litterfall and IRGA-based soil respiration measurements. Agric. For. Meteorol. 2002, 113, 39–51. [Google Scholar] [CrossRef]
  59. McDowell, N.G.; Balster, N.J.; Marshall, J.D. Belowground carbon allocation of Rocky Mountain Douglas-fir. Can. J. For. Res. 2001, 31, 1425–1436. [Google Scholar] [CrossRef]
  60. Litton, C.M.; Giardina, C.P. Below-ground carbon flux and partitioning: Global patterns and response to temperature. Funct. Ecol. 2008, 22, 941–954. [Google Scholar] [CrossRef]
  61. Nadelhoffer, K.J.; Raich, J.W. Fine Root Production Estimates and Belowground Carbon Allocation in Forest Ecosystems. Ecology 1992, 73, 1139–1147. [Google Scholar] [CrossRef]
  62. Ryan, M.G.; Binkley, D.; Fownes, J.H. Age-Related Decline in Forest Productivity: Pattern and Process. Adv. Ecol. Res. 1997, 27, 213–262. [Google Scholar]
  63. Tang, J.; Luyssaert, S.; Richardson, A.D.; Kutsch, W.; Janssens, I.A. Steeper declines in forest photosynthesis than respiration explain age-driven decreases in forest growth. Proc. Natl. Acad. Sci. 2014, 111, 8856–8860. [Google Scholar] [CrossRef] [PubMed]
  64. Kopacek, J.; Turek, J.; Hejzlar, J.; Porcal, P. Bulk deposition and throughfall fluxes of elements in the Bohemian Forest (central Europe) from 1998 to 2009. Boreal Environ. Res. 2011, 16, 495–508. [Google Scholar]
  65. Davidson, E.A.; Hart, S.C.; Firestone, M.K. Internal cycling of nitrate in soils of a mature coniferous forest. Ecology 1992, 73, 1148–1156. [Google Scholar] [CrossRef]
  66. Stark, J.M.; Hart, H.C. High rates of nitrification and nitrate turnover in undisturbed coniferous forests. Nature 1997, 385, 61–64. [Google Scholar] [CrossRef]
Figure 1. Measured soil efflux (g·m−2·day−1) of C and corresponding soil temperature (°C) in spruce (left) and beech (right) stands, and (lower panel) modelled daily soil respiration (kg·ha−1·day−1) in spruce (black solid line) and beech (grey dashed line) stands for the period 2013–2015. Soil moisture under the forest floor was measured in the spruce stand (solid red line) and in the beech stand (dashed red line) for the period 2013–2015.
Forests 07 00282 g001
Table 1. Number of trees (trees·ha−1) and their DBH (diameter at breast height), tree height and crown area (m2) characteristics in both stands.
No. of TreesDBHHeightCrown Area
Spruce standhacmmm2
Avg54037.925.029.5
Median 37.725.824.6
Min 14.714.94.0
Max 59.230.0105
Beech stand
Avg34040.129.937.8
Median 42.031.232.6
Min 16.920.24.4
Max 55.634.8123
Table 2. Stocks (kg·ha−1) of biomass (dry weight), carbon, nitrogen and the mass ratio of C:N in spruce and beech vegetation.
2013StemBranchesLeavesRootsAbovegrTotal
Spruce standkg ha−1
DW249,34435,97323,00095,518308,317403,835
C118,43817,08710,92545,371146,451191,822
N3742272765708771447
C/N317754080167133
Beech stand
DW390,09579,084410470,611473,283543,894
C185,29537,565194933,540224,809258,350
N4955439632011341454
C/N3746920105198178
Table 3. Pools (kg·ha−1) of fine soil (LFH < 5 mm; 0–40 cm < 2 mm), carbon, and nitrogen and the mass ratio of C:N in spruce and beech soils. Total C and N concentration in soil profiles of spruce and beech forests; standard deviations in parentheses and significant differences (p < 0.05) among stands are highlighted in bold.
Spruce StandBeech Stand
Fine soilCNC/NCNFine soilCNC/NCN
kg ha–1 g.g−1%%kg ha–1 g.g−1%%
L36,50516,02658627.343.2 (0.41)1.59 (0.08)28,94013,13550925.845.8 (1.85)1.79 (0.09)
FH95,83821,38691623.331.6 (3.30)1.35 (0.18)142,56552,225262719.936.7 (4.30)1.84 (0.16)
0–10540,30536,817132527.86.7 (1.74)0.24 (0.04)467,55947,127203523.210.0 (2.22)0.43 (0.09)
10–20508,00915,70763824.63.1 (0.45)0.13 (0.01)533,82134,929137825.36.5 (0.36)0.26 (0.02)
20–401,031,09823,65399923.72.2 (0.48)0.09 (0.02)1,022,62951,265199925.75.1 (0.51)0.2 (0.02)
Total2,211,754113,590446425.4 2,195,514198,681854723.2
Table 4. Fluxes (±standard deviation) of water (mm), DOC and N (kg·ha−1·year−1) in bulk deposition, throughfall and beech stemflow for the period 2013–2015.
2013–2015H2ODOCDONN-NH4N-NO3
mmkg ha−1 year−1
Bulk deposition1092 ± 19821 ± 5.01.5 ± 0.66.0 ± 1.73.6 ± 0.7
Spruce
Throughfall761 ± 18180 ± 134.1 ± 0.36.7 ± 0.56.8 ± 0.4
Beech
Throughfall750 ± 10436 ± 5.01.5 ± 0.98.4 ± 2.36.4 ± 0.8
Stemflow148 ± 3111 ± 1.50.6 ± 0.20.8 ± 0.10.5 ± 0.1
Table 5. Fluxes (±standard deviation) of water (mm), DOC, N (kg·ha−1·year−1) and mass ratio of DOC/DON in seepage water from the forest floor and mineral soil at the depth of 30 cm for the period 2013–2015.
2013–2015H2ODOCDONN-NH4N-NO3DOC/DON
mmkg ha−1 year−1g.g−1
Spruce stand
LFH336 ± 96179 ± 595.6 ± 1.70.34 ± 0.130.58 ± 0.1832 ± 0.59
30 cm311 ± 10323 ± 100.83 ± 0.180.10 ± 0.050.12 ± 0.1328 ± 6.7
Beech stand
LFH443 ± 51182 ± 3.15.2 ± 0.490.18 ± 0.051.1 ± 0.3736 ± 3.5
30 cm314 ± 4418 ± 5.00.63 ± 0.160.70 ± 1.11.2 ± 1.028 ± 1.5
Table 6. Stand-specific exponential relationships between soil temperature (°C) and soil respiration (g C·m−2·day−1). Intercept (α), exponential coefficient (β), Q10, R10, r2, number of measurements (n) and p value.
ModelFs = α*e βT
αβQ10R10r2np
Spruce stand0.890.1303.73.30.7884<0.001
Beech stand0.780.1434.23.20.7284<0.001
Table 7. Carbon allocation in spruce and beech stands (kg C·ha−1·year−1).
ANPP WoodANPP FoliageANPP LitterBNPP Coarse RootANPPTBCAFsRaboveRrootRtotalGPPBNPP Fine RootBNPP ex/myccNPPWUE
kg C ha−1 year−1g C kg−1 H2O
Spruce stand3495230165013825375960098695160560210,76320,1361335128193732.6
Beech stand250218288237054016579909151853999918417,1651135107579802.2
ANPP (aboveground net primary production) and BNPP (belowground net primary production) of the coarse roots were derived according to biomass equations. Total belowground carbon allocation (TBCA) equals soil efflux (Fs) − ANPP litter + BNPP coarse roots, BNPP of the fine roots was estimated as a 0.14 fraction of NPP following [44], total autotrophic respiration (Rtotal) was calculated as 1.33 × (ANPP + BNPP root) and aboveground autotrophic respiration (Rabove) as 0.96 × ANPP following [45]. BNPP ex/mycc accounted for C root exudates and mycorrhizae. Gross primary production is the sum of ANPP, TBCF and Rabove. Net primary productivity (NPP) equals GPP − Rtotal. WUE (water use efficiency) was calculated as the ratio of GPP and evapo-transpiration (precipitation − seepage at 30 cm depth).
Table 8. Biomass (dry weight), carbon and nitrogen fluxes (kg·ha−1·year−1) and respective mass C:N ratios in individual litterfall compartments in spruce and beech forests.
2014–2015DWCNC/N
kg ha−1 year−1g.g−1
Spruce litterfall
Needles258912953142
Twigs3121484.335
Fruits4382083.756
Spruce total333816503942
Beech litterfall
Leaves410419463752
Twigs5542634.262
Fruits14156721546
Beech total607428825652
Table 9. Nitrogen allocation in spruce and beech stands (kg N·ha−1·year−1). Annual nitrogen requirements (Nreq) of the wood and coarse roots were derived according to biomass equations. Nreq of the fine roots was estimated as a 0.14 fraction of NPP following [44]. Annual N translocation (Ntrans) is the difference between foliage Nreq and annual N litter production. Net N uptake (Nuptake) was calculated as the difference between the sum of Nreq of aboveground and coarse root production and Ntrans. Total flux of N to the forest floor (Ninsoil) consisted of litterfall N and throughfall N fluxes.
Nreq WoodNreq FoliageNreq AbovegrNreq Coarse RootsNreq Fine RootsNreq BelowgrNtransNuptakeNinsoil
kg ha−1 year−1
Spruce stand1545601728455.77157
Beech stand121161273.52326607174

