Article

The Urban Environment Can Modify Drought Stress of Small-Leaved Lime (Tilia cordata Mill.) and Black Locust (Robinia pseudoacacia L.)

1
Forest Growth and Yield Science, School of Life Sciences Weihenstephan, Technische Universität München, Hans-Carl-von-Carlowitz-Platz 2, Freising 85354, Germany
2
Strategic Landscape Planning and Management, School of Life Sciences Weihenstephan, Technische Universität München, Emil-Ramann-Str. 6, Freising 85354, Germany
*
Author to whom correspondence should be addressed.
Forests 2016, 7(3), 71; https://doi.org/10.3390/f7030071
Submission received: 8 January 2016 / Revised: 10 March 2016 / Accepted: 11 March 2016 / Published: 17 March 2016
(This article belongs to the Special Issue Urban and Periurban Forest Diversity and Ecosystem Services)

Abstract

:
The urban environment characterized by various stresses poses challenges to trees. In particular, water deficits and high temperatures can cause immense drought stress to urban trees, resulting in reduced growth and die-off. Drought-tolerant species are expected to be resilient to these conditions and are therefore advantageous over other, more susceptible species. However, the drought tolerance of urban trees in relation to the specific growth conditions in urban areas remains poorly researched. This study aimed to analyze the annual growth and drought tolerance of two common urban tree species, namely small-leaved lime (Tilia cordata Mill. (T. cordata)) and black locust (Robinia pseudoacacia L. (R. pseudoacacia)), in two cities in southern Germany in relation to their urban growing conditions. Marked growth reductions during drought periods and subsequent fast recovery were found for R. pseudoacacia, whereas T. cordata exhibited continued reduced growth after a drought event, although these results were highly specific to the analyzed city. We further show that individual tree characteristics and environmental conditions significantly influence the growth of urban trees. Canopy openness and other aspects of the surrounding environment (water supply and open surface area of the tree pit), tree size, and tree species significantly affect urban tree growth and can modify the ability of trees to tolerate the drought stress in urban areas. Sustainable tree planting of well adapted tree species to their urban environment ensures healthy trees providing ecosystem services for a high quality of life in cities.

1. Introduction

Urban trees are of great value to a city: their performance and esthetics are beneficial to the climate and human population. By providing ecosystem services such as evaporative cooling [1] and shading [2], trees in an urban landscape are able to ameliorate negative effects of urban climates and climate change by reducing irradiances, and surface and air temperatures [3,4,5]. Furthermore, urban trees store carbon [6], reduce rainwater runoff [7], and filter pollutants [8]. The moderation of microclimates and improvement of environmental conditions by urban trees has been analyzed by several studies [9,10,11,12,13], with results highlighting the importance of trees for cities and the city climate. Therefore, urban forests can also become a key component to the adaptation of cities to climate change [14]. However, healthy and well growing trees provide the greatest benefits.
In addition to the functions and effects of trees on the climate of a city, tree growth and site conditions are closely related to the services that trees can provide. Cities are characterized by varying growth conditions that highly influence the growth, resilience, and mortality of trees [15,16,17]. Urban environments can be stressful habitats for trees [18], with hindering growth conditions such as restricted water availability [19], restricted soil volume [20], de-icing salt in winter [21], mechanical injury [22], and insect infestation [23]. Climate change with an associated higher frequency of years of extreme weather events [24] will expose urban trees to even more restrictive growth conditions. Drought years can cause high stress levels for trees with excessive evaporative demands [25] and less photosynthesis. Frequent drought years with short time periods in between may result in less time for tree recovery. High water stress can induce a change in tree growth with modified tree allometry [26,27], overall reduced growth [28], and tree die-off [29,30]. Tree species with a higher drought tolerance are expected to be more resistant and are therefore advantageous to altered climates than those with less tolerance. Moreover, the individual tree structure can additionally influence the drought tolerance of a tree, with higher crown volume increasing drought resistance [31] and higher age decreasing growth during drought episodes [32].
The annual growth patterns of urban trees can indicate their growth conditions and provide information regarding the climate influencing individual tree growth [33] and drought tolerance. Dendrochronology describes the study of tree rings with the aim of examining events through time recorded by tree-ring widths [34]; it can be used to interpret urban ecosystem dynamics and the impact of land use on trees as well as to analyze the climate-growth relationships of trees [33]. Tree-ring analysis of forest trees has been conducted in many studies [29,31,35,36,37], whereas studies on urban trees are relatively scarce [3,15,33]. Gillner et al. [38] and He et al. [39] pointed out that the effects of past climates on growth can provide valuable information on tree performance, including performance under climate change, using the growth patterns of urban trees based on dendrochronology. Knowledge regarding the drought tolerance and sensitivity of common urban tree species could assist urban space planners in selecting long-living and healthy trees, thereby providing sustainable ecosystem services, such as evaporative cooling, to mitigate the effects of a changing climate [38]. Dendrochronology allows a retrospective study of how tree species perform within urban climates and provides important information regarding the choice of optimal species for planting at a certain location.
The aims of this study were to analyze the annual growth rates and drought response of two common urban tree species, namely the small-leaved lime (Tilia cordata Mill. (T. cordata)) and the black locust (Robinia pseudoacacia L. (R. pseudoacacia)), in two cities in southern Germany with differing climates. Furthermore, the influence of individual tree structure and site conditions (canopy openness, distance to neighboring trees and buildings, and open surface area (OSA)) on annual tree-ring development was assessed. In more specific detail, we focused on the following questions:
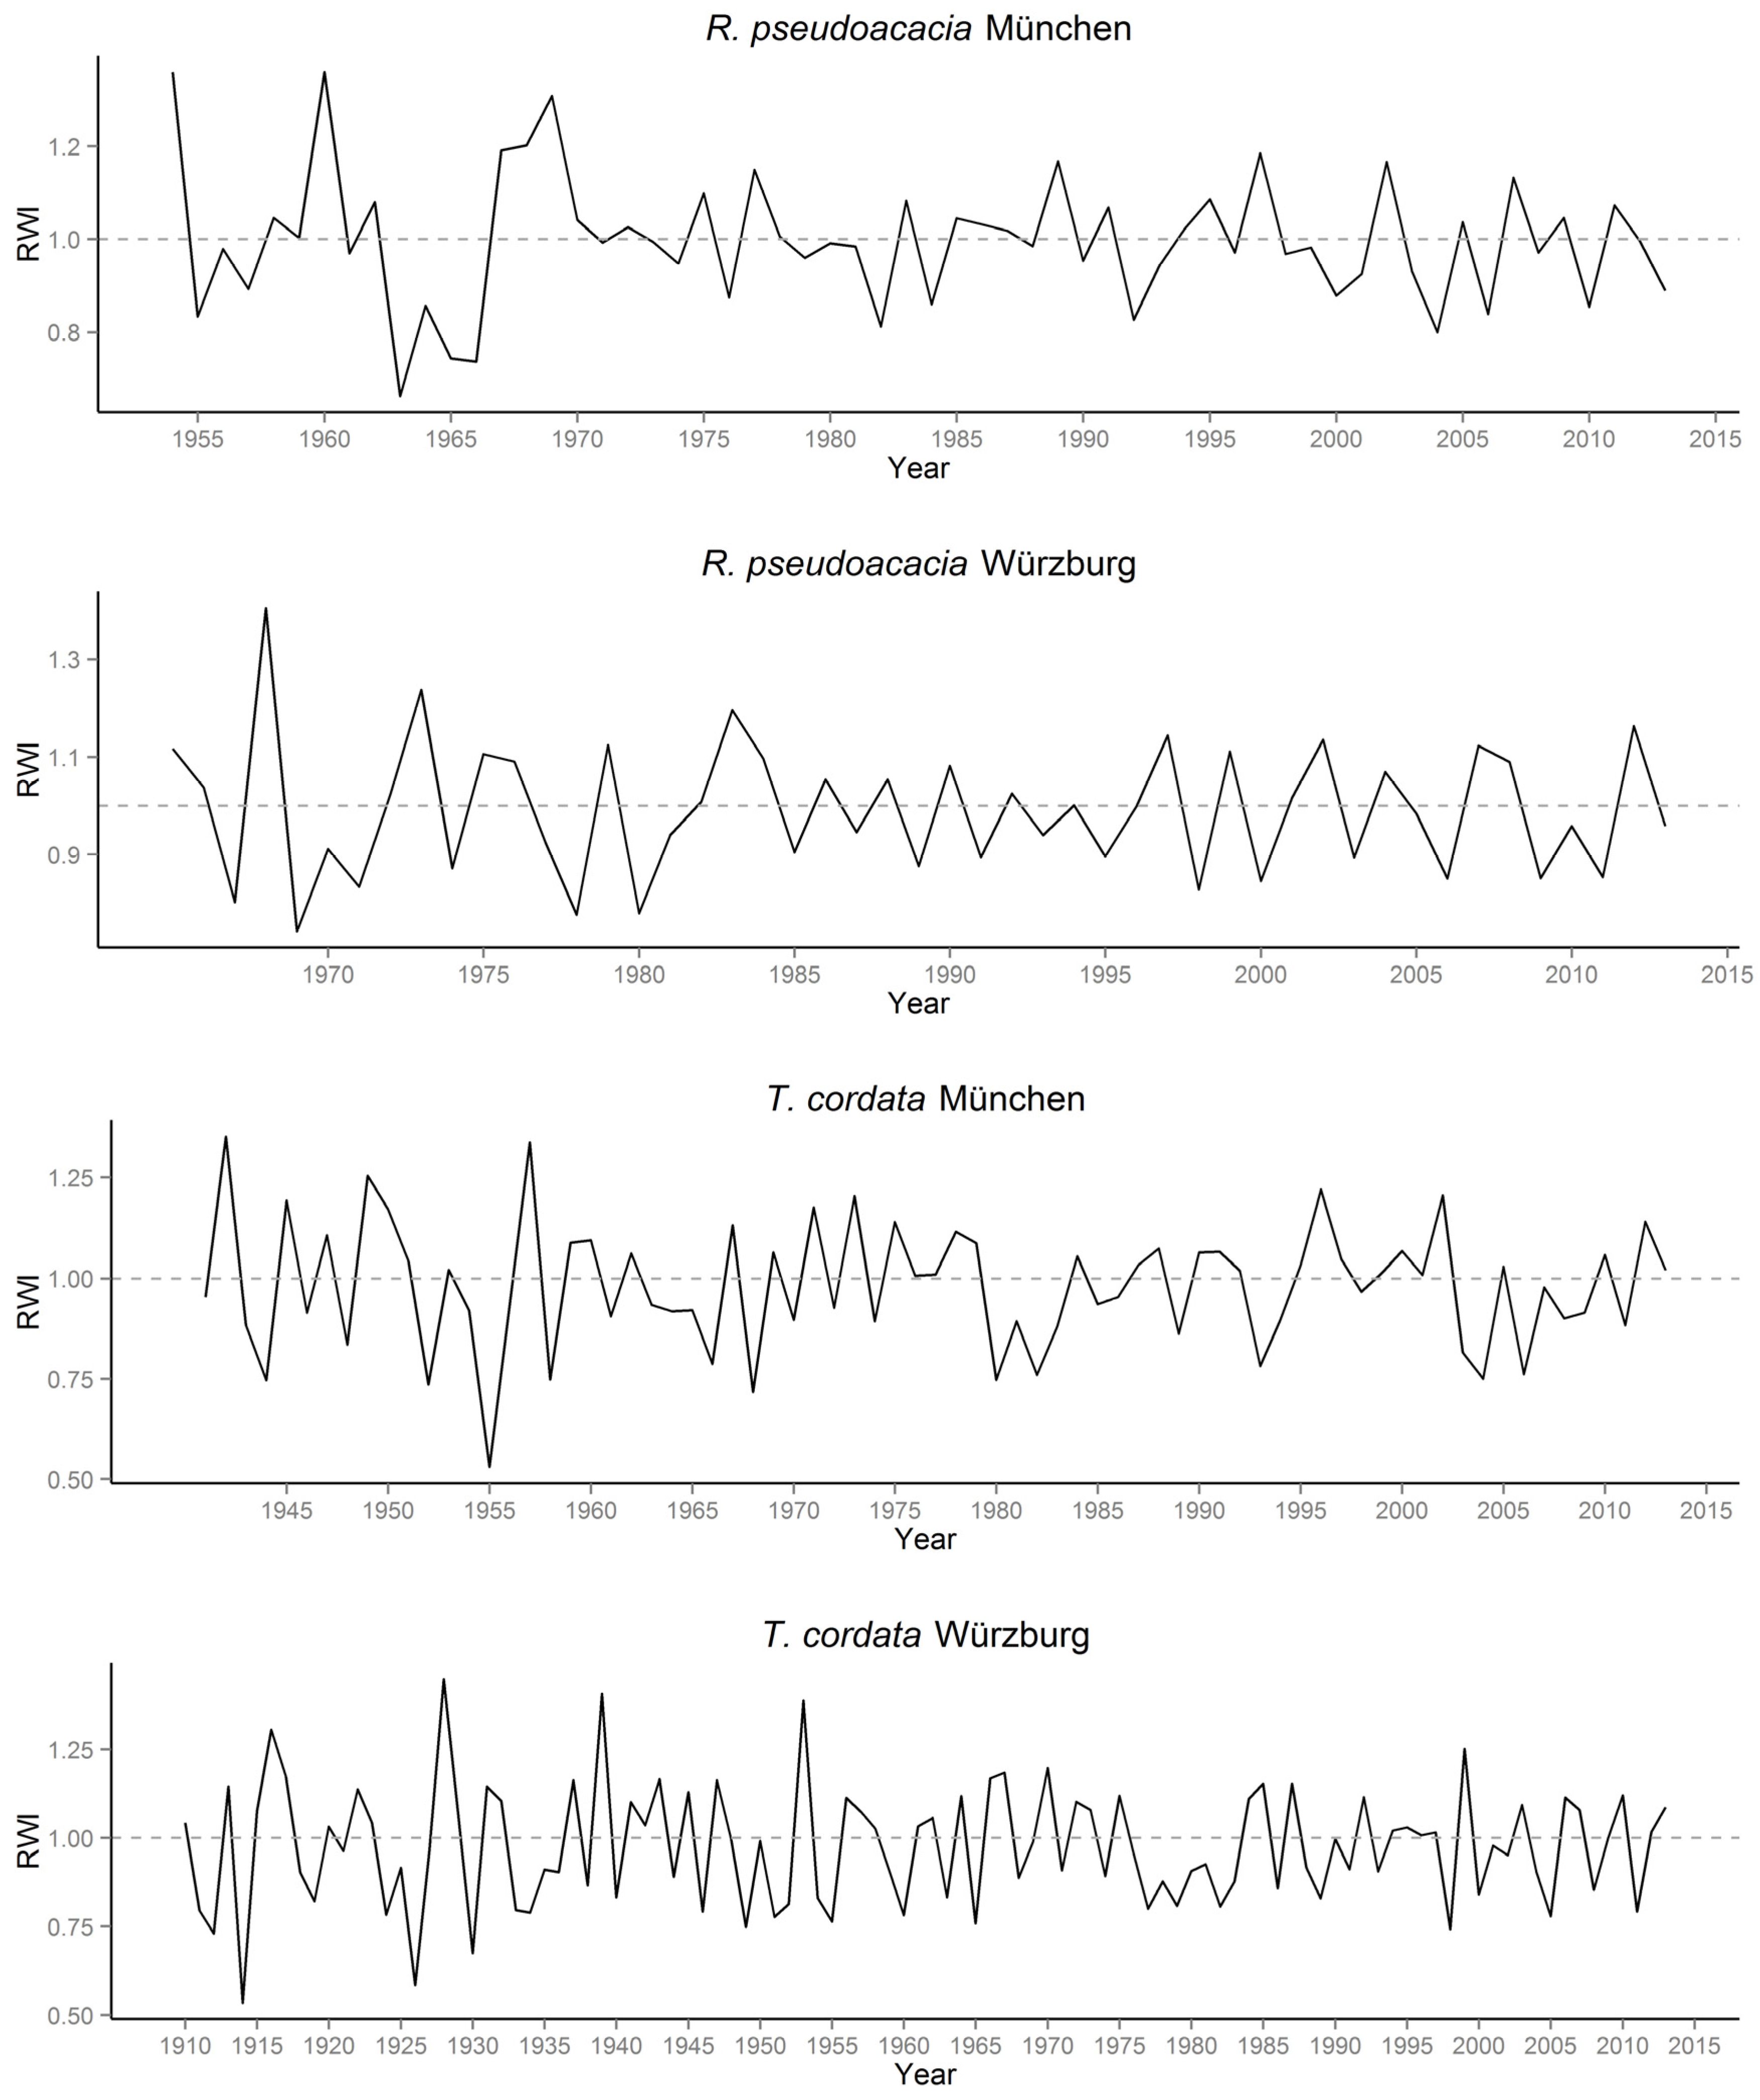
  • Can the average growth rates of the analyzed tree species be quantified in respect to their growing sites?
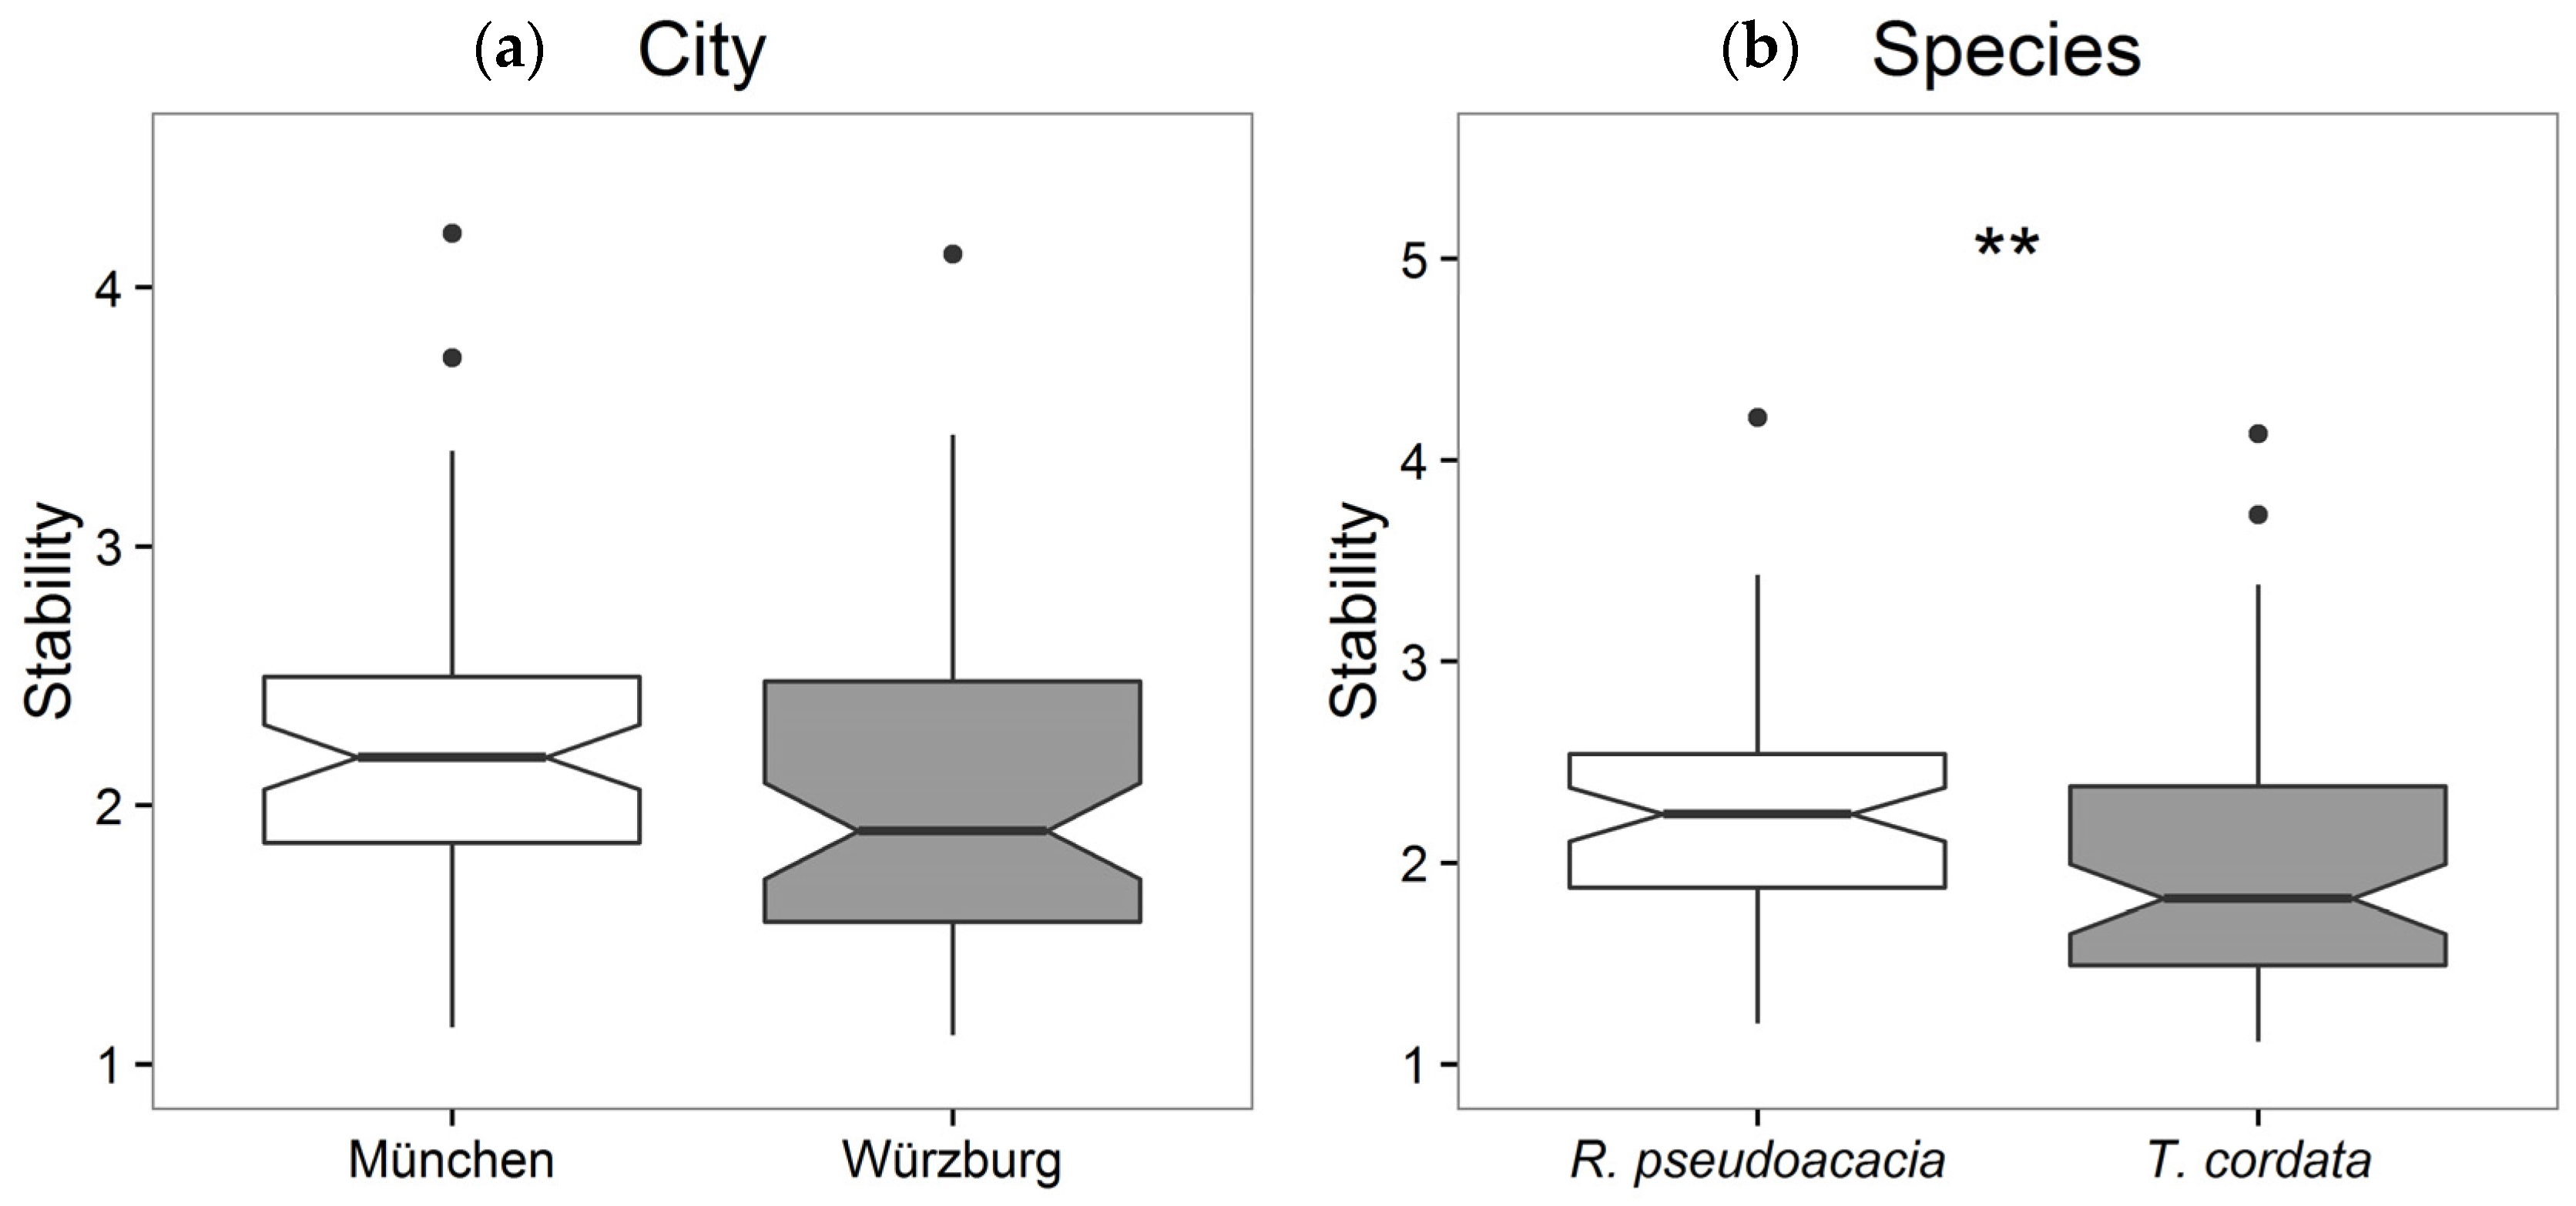
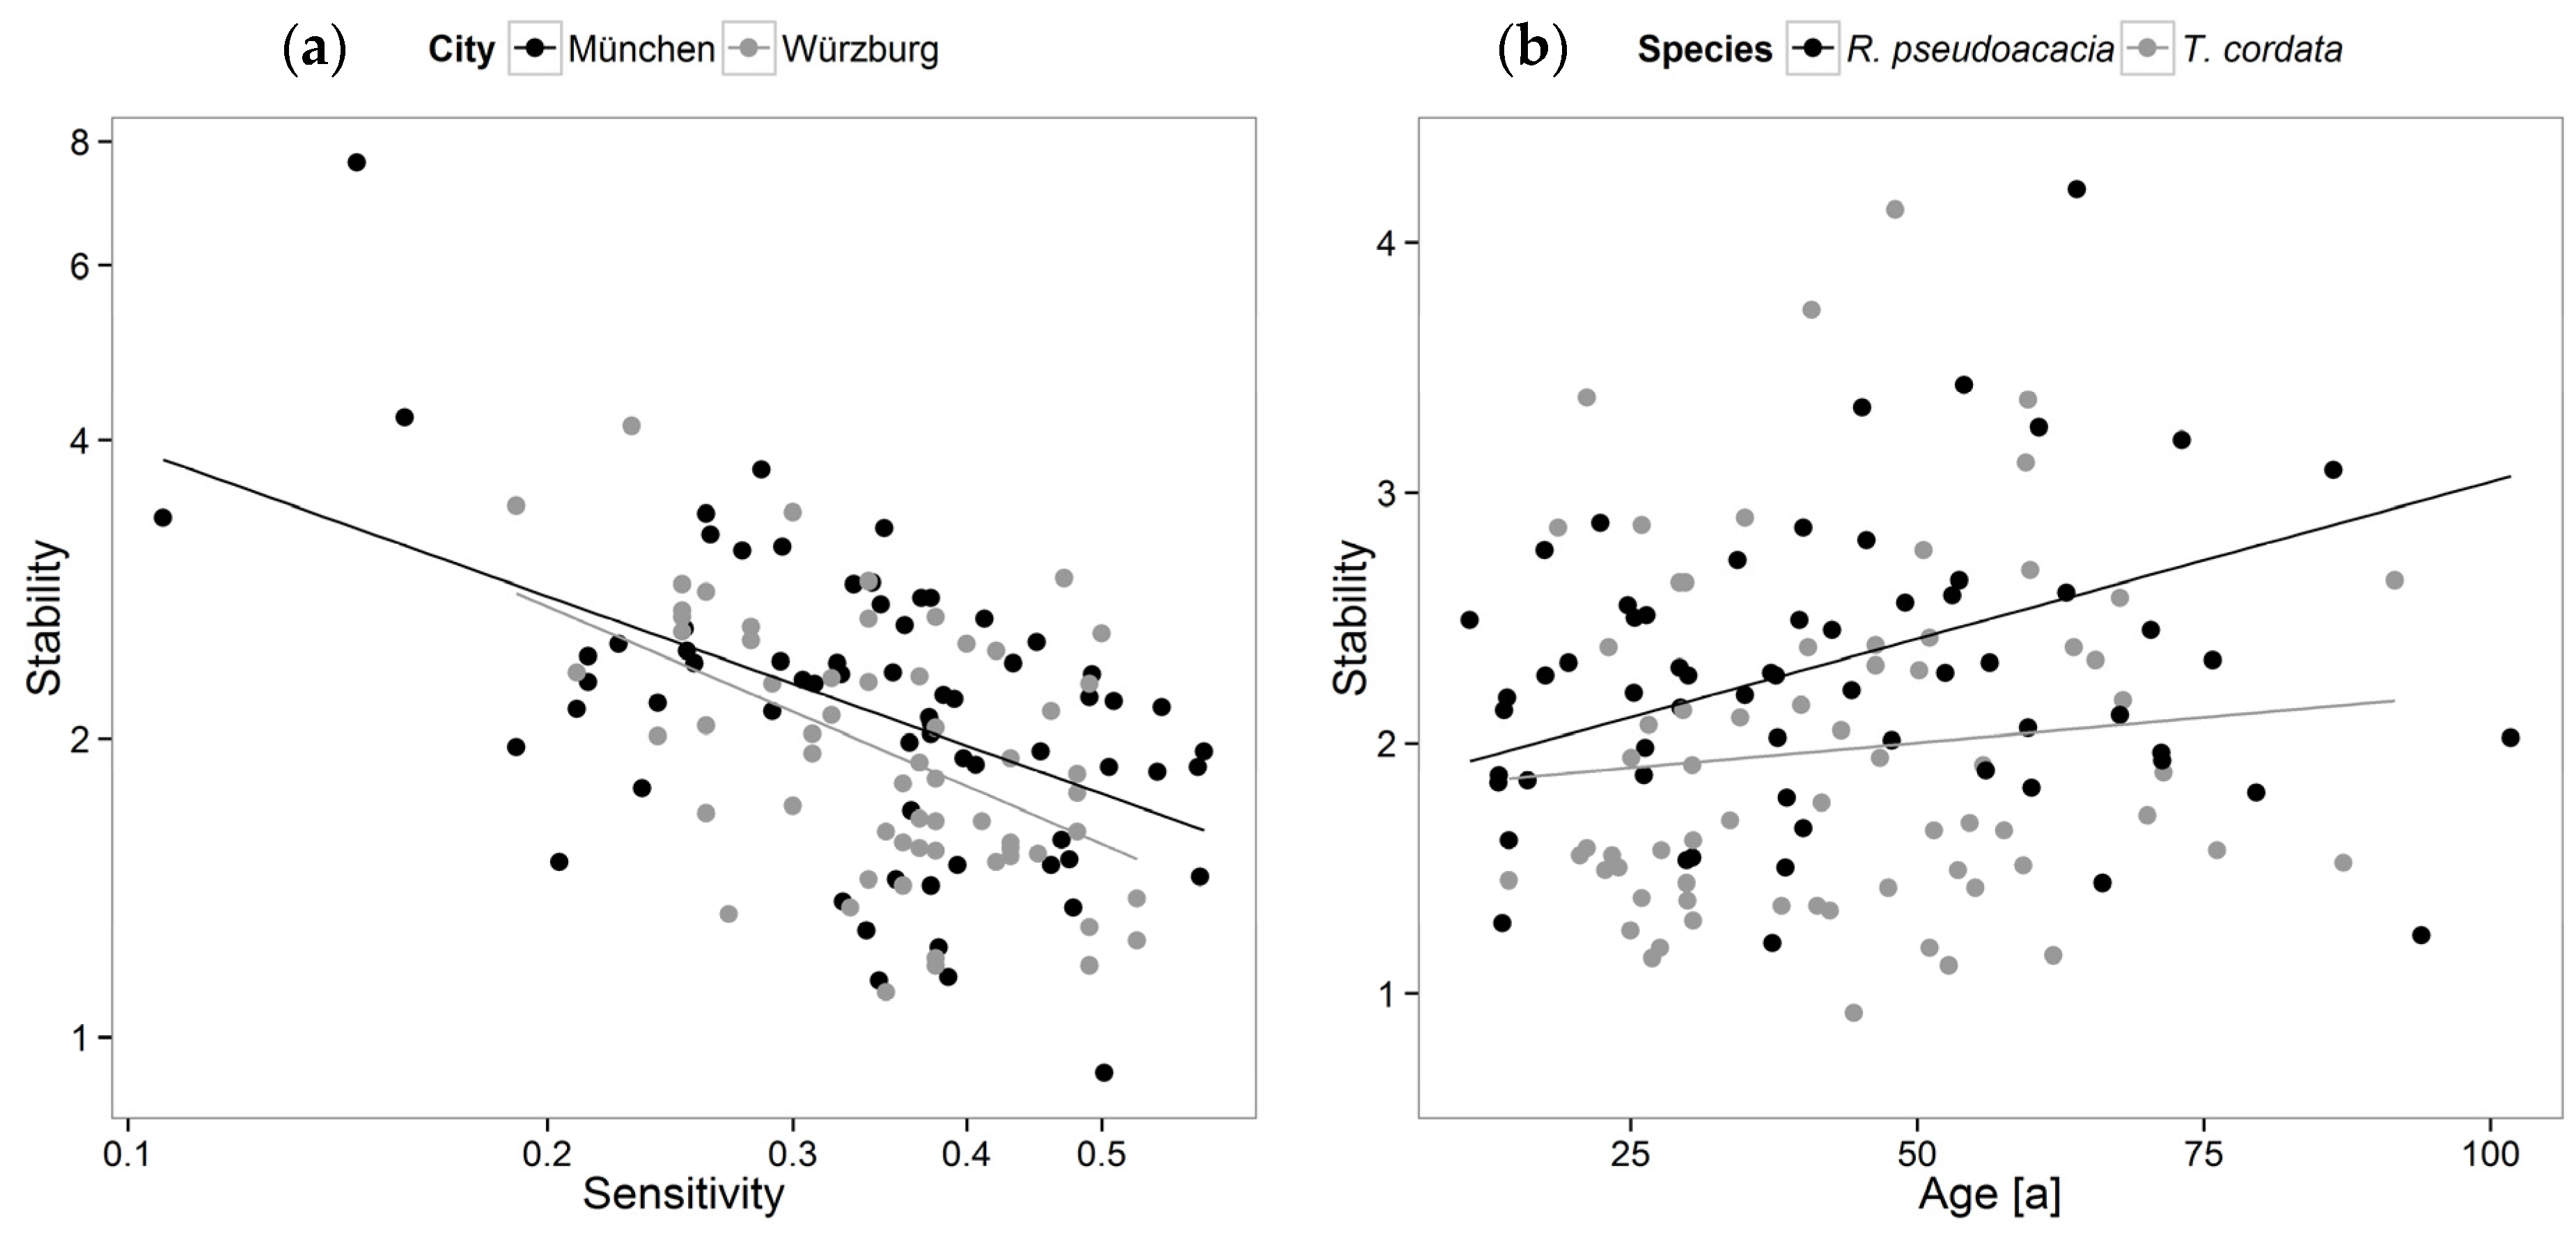
  • How stable and sensitive is the growth of trees in urban environments?
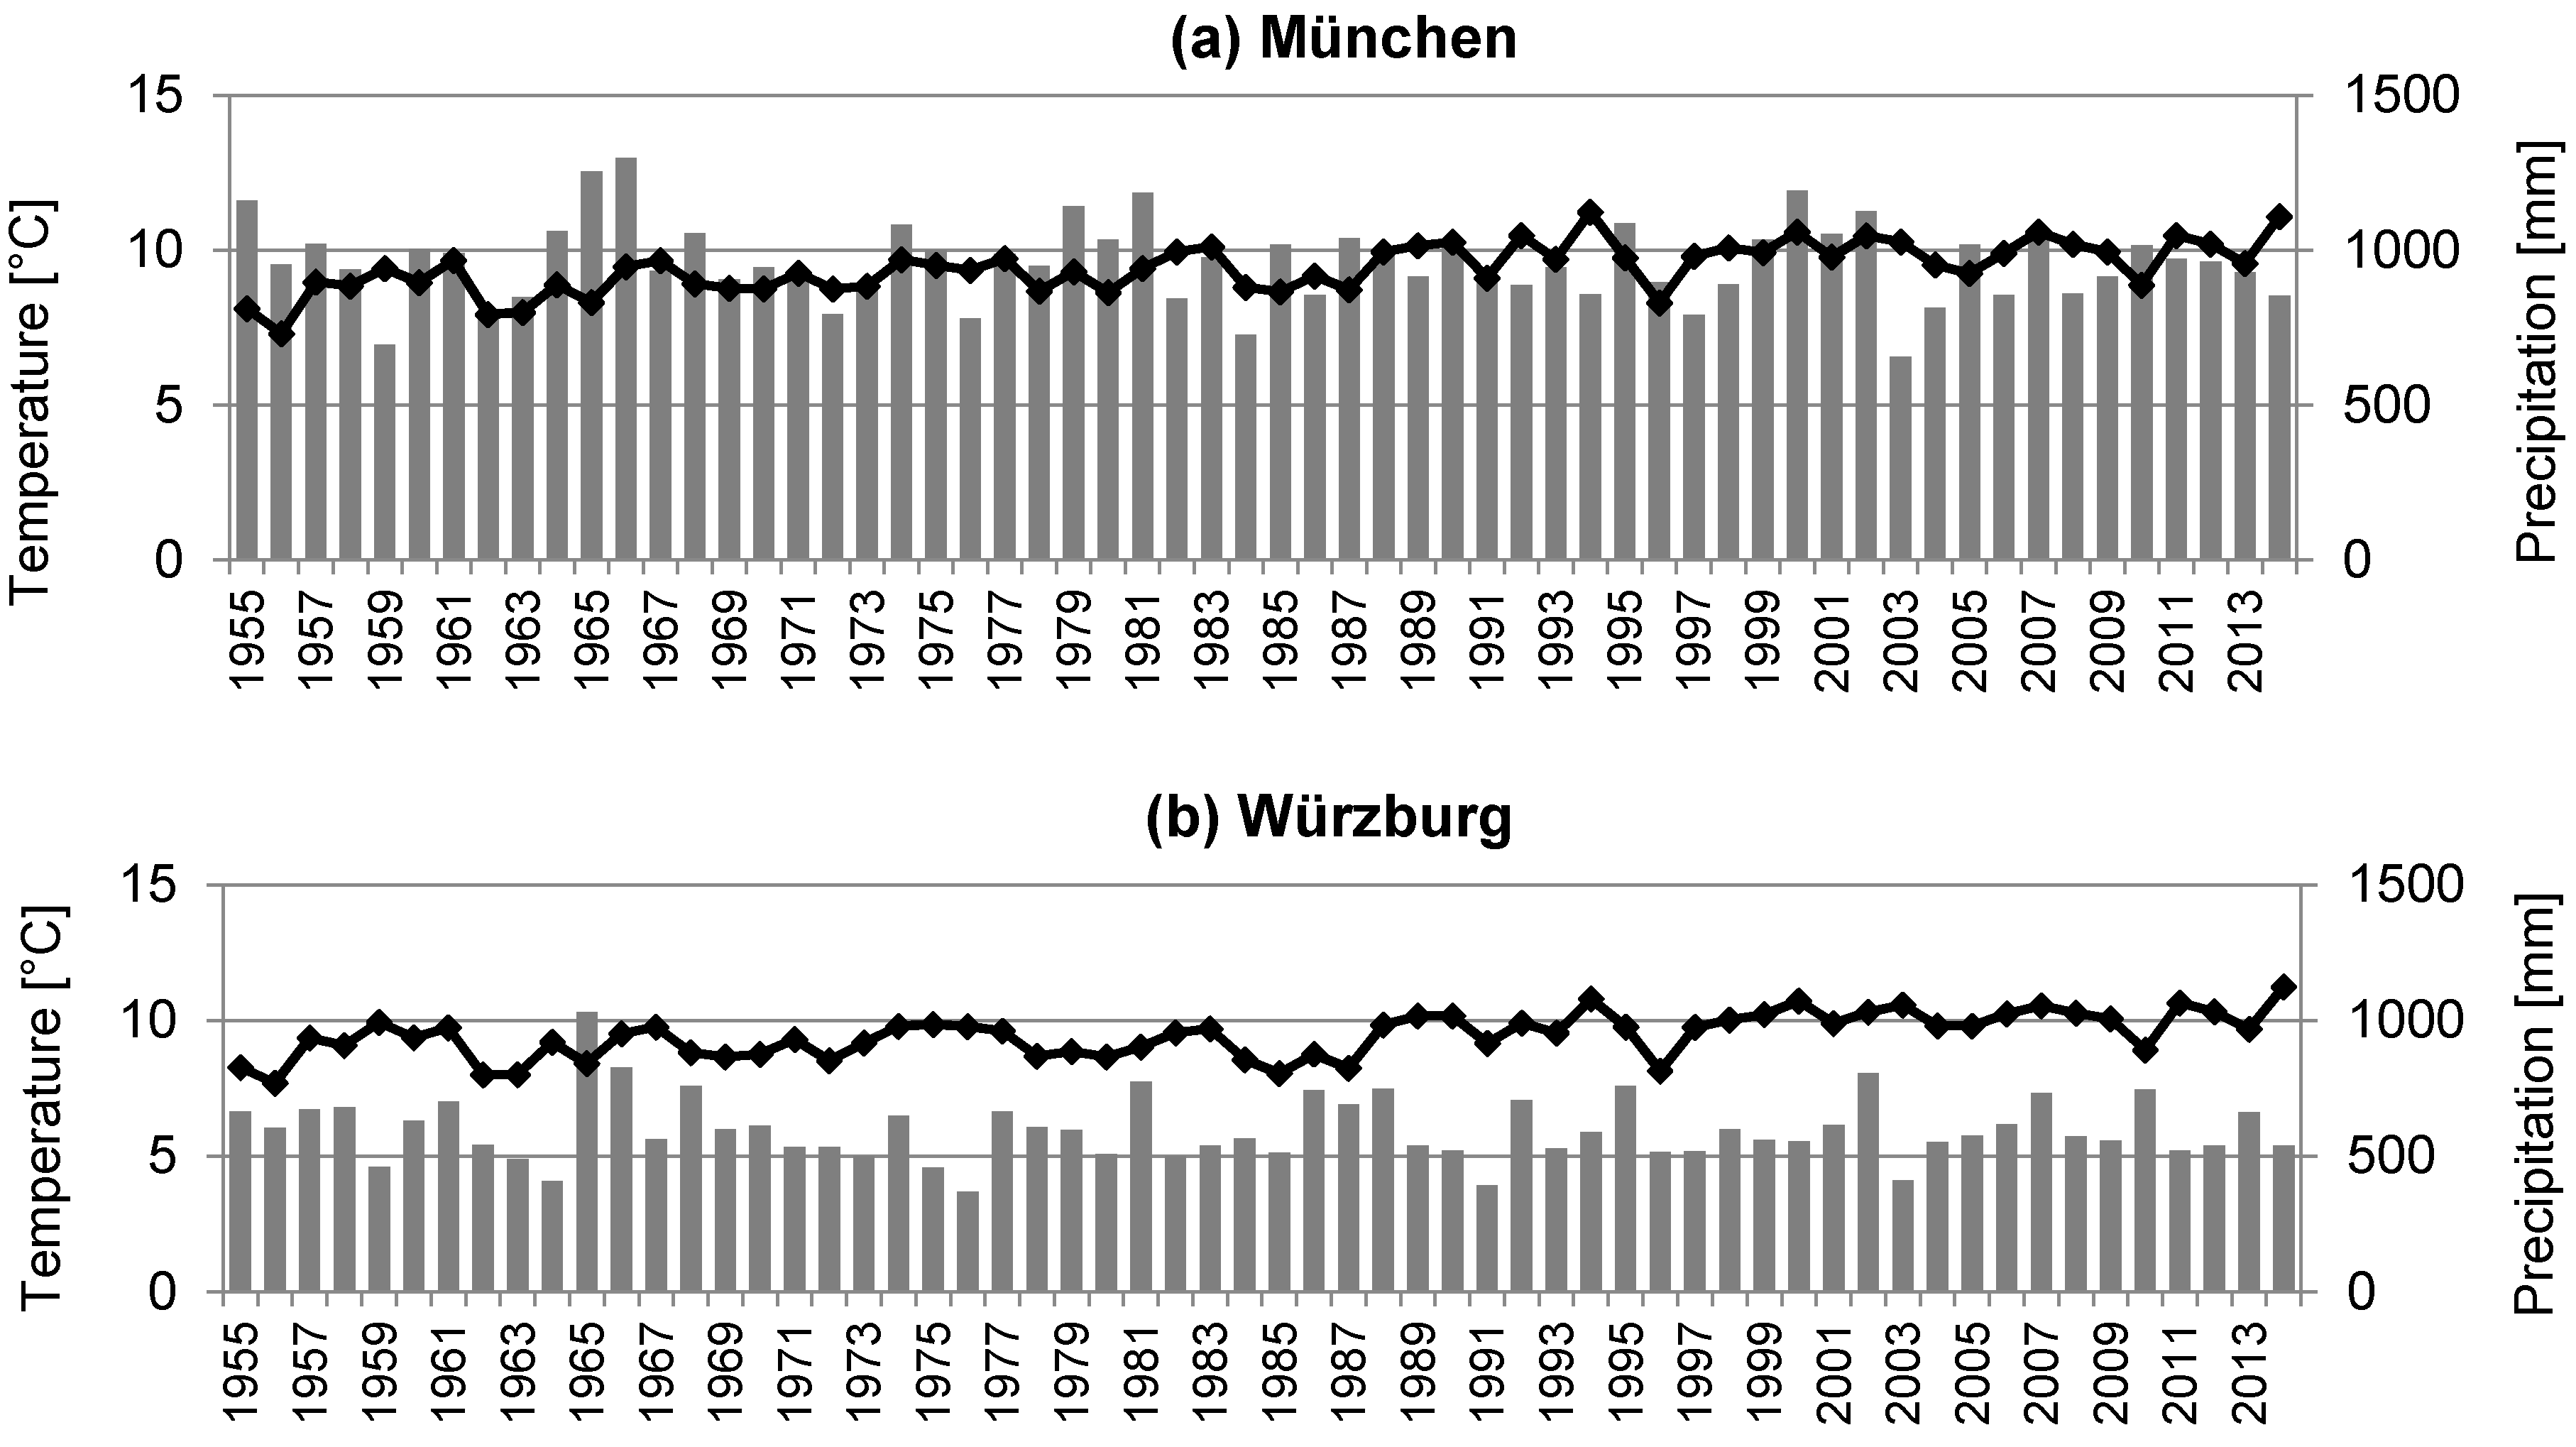
  • How does the urban climate (temperature and precipitation) and environment (light, open surface, neighboring trees, and close buildings) influence tree growth?
  • What are the responses of urban tree species with varying drought tolerances to drought years?
  • Do the urban environment and individual tree structure modify the drought stress of trees?

2. Materials and Methods

2.1. Site Description and Data Collection

Increment cores were collected in München (48°09′ N, 11°35′ E, 519 m above sea level (a.s.l.)) and Würzburg (49°48′ N, 9°56′ E, 177 m a.s.l.), two major cities in southern Germany. As shown in Figure 1, the climatic characteristics of the two cities differ. The long-term annual precipitation values of München and Würzburg are 959 and 596 mm, respectively [40], whereas the mean annual temperature (1961–1990) of both cities is 9.4 °C [40].
For this study, two common urban tree species were selected: T. cordata and R. pseudoacacia. These two species were selected as they are most relevant common urban tree species in Germany and markedly differ in their ecological features [41]. Whereas T. cordata is shade tolerant and moderately drought tolerant [42,43], R. pseudoacacia requires a certain amount of light (shade intolerant) and is very tolerant to drought as well as fast growing [43,44,45,46].
Tree selection was based on visual impression, that is, damaged, pruned, or low-forking trees were excluded. Increment cores were collected from June 2014 to September 2014. Altogether, increment cores were taken from 68 individual T. cordata trees and 62 individual R. pseudoacacia trees. All trees were located in street canyons, parks, and public squares and were randomly distributed in both cities. Two cores perpendicular to each other were extracted per tree at a height of 1.3 m, in a northern and eastern direction. Due to the main wind direction (southwest), coring from north and east yields more representative tree ring widths [29].
Moreover, stem diameter (dbh) at a height of 1.3 m, tree height, open surface area of the tree pit (OSA) of all trees, and distance to neighboring trees as well as distance to adjacent buildings were recorded [47]. Hemispheric photographs of the tree crowns were taken using a Nikon Coolpix P5100 camera with a fisheye lens and Mid-OMount. The resulting hemispherical photos were analyzed using WinSCANOPY (Régent Instruments Inc., Ville de Québec, Canada) to derive the canopy openness (percentage of open sky visible, degree of development, equivalent to the sky view factor SVF) of every individual tree [48,49].

2.2. Quantification of Urban Tree Growth in Relation to Growing Site Based on Tree Ring Analysis

All cores were mounted on grooved boards with glue and sanded using progressively finer sand papers. The first sanding was applied to flatten the cores, whereas the subsequent sanding episodes polished the cores for better visualization of the cross-sectional area [34]. The annual tree-ring widths of the cores were measured using a Lintab digital positioning table with a resolution of 1/100 mm [50]. For cross-dating of the time-series, the software package TSAP-Win [51] was used.
Further analyses were carried out in R [52] using package dplR [53]. With dplR, all tree-ring series were indexed using a double detrending process: first, modified negative exponential curves were applied followed by cubic smoothing splines (20 years rigidity, 50% wavelength cutoff). The detrending was conducted to remove low frequency trends, which are age associated [38,54]. The resulting detrended series were averaged using Tukey’s biweight robust mean to build chronologies for both species and each city. As a result of detrending, standardized chronologies with a yearly ring width index (RWI) averaging around 1 were obtained. Values smaller than 1 indicate growth below normal, while values greater than 1 indicate growth higher than normal. Further, for chronology building, the autocorrelation of every individual series was removed using autoregressive models with a maximum order of three. This procedure of detrending ensured a removal of all long-term growth trends, thereby obtaining a chronology containing only tree ring variability with climate fluctuations [3,55]. The statistical validity of the chronologies was assessed using the expressed population signal (EPS) for the common period of the time series of all analyzed tree individuals.

2.3. Investigated Variables

Linear regressions and linear mixed models were used to assess the influence of structural and environmental variables on the annual growth rates (response variable). Tested explanatory variables were the analyzed species (R. pseudoacacia and T. cordata), the sampling city (München and Würzburg), the growing site (park, public square, or street canyon), the stability of growth (Equation (1)), the sensitivity of growth in relation to environment (see below), the dbh, the tree height, the estimated age (Equations (2) and (3)), estimation of vitality by Roloff [56], the OSA (Equation (4)), the distance to neighboring trees (Equation (5)), the distance to adjacent buildings (Equation (6)), and the canopy openness. According to Roloff [56] the vitality was rated from very good (0) to very poor (3) conditions regarding the branching structure of the crown. Stability of growth was computed following Jucker et al. [57] by
Stability = Average growth rate per tree/standard deviation of growth
with values ranging from 0 to 10, whereby low values indicate less stability and high values high stability.
The average growth rates and sensitivity of each tree were derived using the R package dplR. The mean sensitivity describes the year-to-year variability of tree ring data in relation to the previous year ring width [58]. The ages of T. cordata trees were calculated by the formula of Lukaszkiewicz and Kosmala [59]:
age = a + exp ( b + c × dbh 100 + d × tree height )
where a = 264.073, b = 5.5834, c = 0.3397, and d = 0.0026; dbh in cm and tree height in m ([47]).
To estimate the age of R. pseudoacacia we applied a species-dependent age factor of 0.996, which was computed by the measurements of Dwyer [60] for honey locust (Gleditsia triacanthos):
age = 0.996 × dbh
The open surface area (OSA) of the tree pit is calculated by
OSA  ( m 2 )   = ( ( r N 2 + r NE 2 + + r NW 2 ) / 8 )
where rN is the length of the visible open surface in the northern direction and rNW the length of the visible open surface in the northwest direction.
Mean distances to neighboring trees dt and adjacent buildings db were computed as follows:
d t ( m )   =   ( ( ( t d N r N ) 2 + ( t d NW r NW ) 2 ) / 8 )
d b ( m )   =   ( ( ( b d N r N ) 2 + ( b d NW r NW ) 2 ) / 8 )
where tdN is the distance to neighboring trees in the northern direction, tdNW is the distance to neighboring trees in the northwest direction, bdN is the distance to adjacent buildings in the northern direction, bdNW is the distance to adjacent buildings in the northwest direction, rN is the maximum crown extension in the northern direction, and rNW the maximum crown extension in the northwest direction.
To analyze the effects of climate in terms of the water supply on tree growth, we calculated a monthly, multiscalar climatic drought index, the SPEI [61]. The SPEI uses precipitation and potential evapotranspiration (PET) as input data, whereby PET was calculated according to the Hargreaves approach [62,63]. The time scale was set to 4 months, with a Gaussian kernel to consider the water supply, and a log-logistic distribution was applied [61]. Using the calculated SPEI, the influence of the identified drought years on the growth patterns of urban trees was investigated. A yearly SPEI for 1955–2013 was computed by averaging the monthly index values of the growing season from April to September. Years with an SPEI smaller than −1 were classified as moderate drought years, whereas years with an SPEI smaller than −2 were interpreted as years with severe droughts [61,64].

2.4. Statistical Analyses

The stability of growth was assessed with linear regressions following Pretzsch et al. [26]:
y = b × x a  or  = ln ( a ) + b × ln ( x )
where y is the response variable, x is the explanatory variable, a is the intercept, and b is the slope.
Further, using the R package nlme [65], linear mixed models of the following form were developed to estimate the influence of climate, environment, and tree structure (explanatory variables) on the annual tree growth (response variable) derived by increment cores:
Growth rateij = β1 × x1ij + … + βn × xnij + bi1 × z1ij + … + bin × znij + εij
where the growth rate is the response variable for the jth of ni observations in the ith of M groups or clusters, β1, …, βn are the fixed-effect coefficients, which are identical for all groups, x1ij, …, xnij are the fixed-effect regressors for observation j in group i; the first regressor is usually for the constant, x1ij−1, bi1, …, bin are the random-effect coefficients for group i, z1ij, …, znij are the random-effect regressors, and εij is the error for observation j in group i.
The derived annual growth rates over the past twenty years (1994−2013) for each tree were used as input for the response variable. The individual tree number and the species were set as random effects. The back-calculated dbh, the water supply (measured with SPEI), the distance to neighboring trees, the distance to adjacent buildings, the OSA, the vitality, and the canopy openness were used as fixed effects along with the species (R. pseudoacacia, T. cordata), city (Würzburg, München), and growing site (park, public square, and street canyon). In addition, all fixed effects were tested with interactions. Nonsignificant terms were gradually removed from the models. The models with significant p-values for the fixed effects and the overall lowest Akaike’s information criterion (AIC) were chosen as final models.
To investigate the influence of the urban environment and tree structure on growth during low growth episodes and episodes with extraordinarily high growth, another two linear mixed models were calculated. First, we investigated all years with a ring width index of <1 (detrended values averaged around 1). Second, all years with a ring width index of >1 were analyzed in relation to the tree structure and environment as explained earlier.
Extreme drought years, such as 2003, can have a great impact on the growth of trees [31]. The effects of extreme droughts on tree growth patterns may persist several years after the drought. Therefore, we analyzed the influence of single years on the tree growth using superposed epoch analysis (SEA). SEA investigates the significance of a mean tree growth response to certain events (such as droughts) to pre- and post-drought growth periods [53]. According to Lough and Fritts [66], Orwig and Abrams [36], and Gillner et al. [38], deviations from the mean ring width index of each core were calculated for the following three periods. The growth of the 5 years prior to the analyzed drought year (pre-drought), of the drought year and of the 5 years after the drought year (post-drought) was averaged to detect significant departures between those superposed epochs. The SEA was computed using the R package dplR [53], using random sets of 11 years from 1000 bootstrapped sets [38,53].

3. Results

3.1. Quantification of Urban Tree Growth in Relation to Growing Site Based on Tree Ring Analysis

The average dbh of the analyzed trees was 44.5 cm in München and 44.3 cm in Würzburg for R. pseudoacacia and 34.2 cm in München and 33.1 cm in Würzburg for T. cordata with a maximum range between 11 cm and 102.2 cm (Table 1). The tree individuals chosen for coring therefore represented a broad size spectrum of urban trees. The annual growth rates of both species were similar in München and Würzburg, with R. pseudoacacia displaying a higher overall growth rate compared with T. cordata (3.9 and 4.0 mm·year−1 versus 3.2 and 2.9 mm·year−1, respectively). After crossdating and detrending, four tree ring chronologies were derived. The EPS values of all series varied between 0.85 and 0.90 for the common period of all tree ring series, thereby exceeding the required threshold of 0.85 [67].
All tree ring series showed a similar mean sensitivity of 0.33 to 0.39 and were within the range given by Speer [34] (Table 1). The slightly higher sensitivity of T. cordata indicated a higher susceptibility to climatic variables and poor growth conditions [3,38,68,69].
In total, the chronologies of R. pseudoacacia covered the period from 1954 to 2013 in München and 1960 to 2013 in Würzburg, whereas the tree ring data of T. cordata ranged from 1941 to 2013 in München and 1910 to 2013 in Würzburg (Figure 2). Of the analyzed species and cities, T. cordata in Würzburg showed the longest tree ring series covering 103 years. The chronologies of R. pseudoacacia of München and Würzburg were both shorter than that of T. cordata, covering 59 years in München and 53 years in Würzburg.

3.2. Stability, Sensitivity, and Modeling of Tree Growth in Relation to Their Environment

To reveal any species-specific reaction patterns and the effect of the sampled cities on the stability of growth, simple linear regressions were applied (Figure 3). With a p-value of 0.08, the relationship of stability with city was not significant, whereas there was a significant relationship of species with stability (p = 0.001, r2 = 0.1); however, the low coefficient of determination indicated a very weak fit. The stability value between the species was significantly different, with R. pseudoacacia showing a higher stability on average as compared to T. cordata.
The regressions of the further analyzed variables tree height, vitality, OSA, distance to adjacent buildings, and trees as well as the canopy openness resulted in non-significant p-values. Significant relationships were only found for sensitivity, dbh, and age (Table 2).
For dbh and age, the r2 values obtained were <0.1 with small F-values and therefore not suitable for explaining the variance in the stability of growth. In contrast, sensitivity displayed a higher r2 and F-value. The r2 of stability in relation to sensitivity and age strongly increased when adding the terms “species” and “city” as dummy variables to the regression (Figure 4).
As shown in Table 2 and Figure 4, stability decreased with increasing sensitivity. In contrast, stability increased with increasing age. To derive a final model best fitting the data, “city” and “species” were tested as explanatory variables. Therefore, a regression with both “species” and “city” added to explain stability on the basis of sensitivity was obtained. With an r2 of 0.29 (F = 17.37, p < 0.01), the model resulted in the highest r2 values and could explain most variance in the data of all computed models. The form of the final model was:
ln(Stability) = 0.18 − 0.48 × ln(Sensitivity) + 0.11 × “Species” − 0.09 × “City” + ε
The derived regression illustrates, again, that stability and sensitivity were opposing variables. Further, the analyzed individuals of T. cordata showed a higher sensitivity than those of R. pseudoacacia and the trees in München had a slightly higher stability than the trees in Würzburg.
Using the water supply (measured with SPEI), the growth of R. pseudoacacia and T. cordata before, during, and after certain drought years was investigated (Figure 5). In München, the SPEI of 2003 was −2.0, whereas the indices for 1998 and 1992 were −1.3 and −1.1, respectively. Several years showed an SPEI close to −1: 2004 (−0.96) and 1976 (−0.93). The drought years of Würzburg as indicated by the SPEI were 2003 (−1.6), 1976 (−1.5), and 1947 (−1.2). Moreover, 2012 (−1.1), 1993 (−1.1), and 1964 (−1.1) showed SPEI values smaller than −1. The SPEI additionally identified years with a high positive index, therefore revealing years with extraordinarily positive growth conditions. In München, those being 1979 (1.2), 1966 (1.5), 1965 (2.0), and 1955 (1.5). Positive SPEI values in Würzburg were found for 1968 (1.4), 1966 (1.2), and 1965 (1.65).
In the following step, linear mixed models of tree growth over the past 20 years in relation to site conditions were developed. Table 3 presents the statistical results of the final model including significant fixed effects and lowest AIC.
Of all tested variables, the dbh, the canopy openness, the OSA, and the water supply (measured with SPEI) proved to be highly significant variables, whereas the vitality, the city, the distance to neighboring trees and adjacent buildings, and the growing site (parks, public squares, and street canyons) had no marked effect and were therefore removed from the final model (Table 3). The variable species was significantly influencing tree growth especially in interaction with the canopy openness. The model showed that an increasing dbh had a strong negative influence on the growth rate, highlighting the age trend of tree growth. A higher canopy openness, in contrast, was beneficial for the growth of the analyzed urban trees; however a smaller OSA was more positive for tree growth. Furthermore, a higher water supply (measured with SPEI) increased the annual growth rate of the analyzed trees. The variable species was non-significant in the final model; however, this variable displayed a strong influence on tree growth in interactions with the canopy openness. According to the model, R. pseudoacacia displayed a higher growth with a higher canopy openness and consequently higher light availability. T. cordata was less influenced in its growth by the available light. Those results reflect the individual shade tolerance of both species, since R. pseudoacacia is characterized as a light-demanding species, whereas T. cordata is very shade-tolerant.
Another significant interaction was dbh with OSA; younger trees with a smaller OSA displayed growth reductions, while bigger, older trees with a larger OSA showed increased growth.
The model highlighted how the growth of the analyzed urban tree species was influenced by the local climate (in terms of the water supply (SPEI) calculated with the potential evapotranspiration), the individual tree structure (dbh), and the surrounding environment (OSA), whereas the variable species was highly significant in relation with another explanatory variable (the canopy openness, representing the light availability). Other variables such as the distance to adjacent buildings and the city were of less importance for growth.

3.3. Growth of Urban Trees Under Drought Stress in Relation to the Tree Structure and Environment

With the obtained SPEI of the drought years, a drought year analysis (SEA) was performed to investigate the different drought strategies of both tree species (Figure 6 and Figure 7).
Both species showed positive growth rates for most of the five pre-drought years in München and a decrease in growth during the drought year. The decline in growth was significant (asterisk) for R. pseudoacacia but not for T. cordata, which exhibited the highest growth decrease in the first year after drought. R. pseudoacacia could recover very quickly from the drought and reached nearly the former growth during the first year after the drought event. In the third year after a drought, R. pseudoacacia again had a positive average ring width index. T. cordata had recovered from the drought during the second post-drought year.
The growth patterns of both species in Würzburg were completely different compared with München (Figure 7). Although there were several growth reductions and positive ring width index values during the pre-drought years, during the drought years no decline in growth was observable for both species. T. cordata showed a reduction in the average ring width index value during the first and second years following the drought. However, a significant growth decline occurred five years after the analyzed drought years. R. pseudoacacia displayed no growth decrease during the first year after the drought but showed a very quick recovery during the fourth year. During the fifth year, R. pseudoacacia additionally exhibited a severe growth reduction.
To analyze the influence of the urban environment and tree structure on growth during drought years, we investigated all years with an RWI of <1 (Table 4).
The factors driving growth during drought years (Table 4) were partially altered compared with the model for the overall growth (Table 3). In the previous model on the annual growth rates over the past 20 years, dbh, the canopy openness, the OSA, and the water supply (measured with SPEI) as single terms as well as the interaction terms canopy openness with the species and the OSA with dbh were significantly affecting tree growth. During drought years (Table 4), the surrounding climate in terms of the water supply (SPEI) and the species proved to be highly influential for tree growth. Contrary to the overall growth, the dbh was not significantly affecting the growth patterns. The stand climate, especially in interaction with the city, was of most influence. Würzburg, with far less precipitation than München resulted in more frequent drought years, and was therefore more inhibiting for tree growth than München. This result was compliant with the overall study design, as the trees in Würzburg exhibit an even higher effect of drought years on growth. Further, the model highlighted the better growth of R. pseudoacacia during drought, displaying less growth reductions than T. cordata in years with poor growth conditions. The canopy openness, representing the available light conditions, once again had a pronounced effect on growth, but reversed to the previous model. The influence of light availability on growth was additionally dependent on size and age; less canopy openness inhibited the growth of younger trees to a stronger degree than those of older, bigger trees.
Since we used detrended values with a removed age trend for the drought model, the variable dbh alone did not significantly affect growth in contrast to the previous overall growth model we ran. Further, the OSA did not affect growth during drought years. The growth in drought years appeared to be influenced by overall environmental factors including the water supply (SPEI), the species, the growing city, and the available light, and was less significantly influenced by the tree structure (age and dbh) and surroundings such as the OSA, neighboring trees, and buildings.
To reveal the differences in the growth patterns during drought years (low growth episodes) and favorable years (high growth periods), we ran an additional model using a ring width index greater than 1 (Table 5). In contrast to the model with a ring width index of smaller than 1 (Table 4), the canopy openness positively affected growth, which was in accordance with the overall linear mixed model on tree growth (Table 3). Moreover, during years with extraordinarily good growing conditions, T. cordata could display higher growth than R. pseudoacacia. Converse to the model of years with poor growth, younger trees with a higher light availability obtained higher growth rates. Other factors such as the distance to neighboring trees as well as the OSA were of less importance for growth.

4. Discussion

4.1. Tree Ring Analysis: Quantification of Growth of Urban Trees in Relation to the Growing Site

Although numerous studies regarding the drought tolerance and resilience of forest trees in relation to their site conditions exist [29,31,37,70,71,72], the behavior of urban trees to drought is rarely researched [33,38,39]. However, urban trees are of great benefit to the climate of a city and the well-being of its citizens. The current study points out a high variability in the growth of urban trees. Since urban trees experience increased stress situations at their growing sites, for example a stronger limitation of water availability, higher temperatures, limited space, and a high variation in their growing conditions, the variability in growth indicates a high adaptability of urban trees to their environment. As expected from the ecological characteristics of both species, R. pseudoacacia showed a higher annual growth rate than T. cordata [44,47].
München and Würzburg were chosen as study sites since they differ in regard to climate characteristics; with 300 mm·year−1 less precipitation Würzburg is considerably drier than München. Minor growth differences in relation to the differing climates of München and Würzburg were observable for T. cordata; this species showed a slightly higher growth in München than in Würzburg. This is not surprising regarding the low drought tolerance of the species, whereas R. pseudoacacia had similar growth rates in both cities. R. pseudoacacia is considered as a drought tolerant species [43]; therefore, the individuals in Würzburg are expected to show improved adaptation to a drier climate compared with the less drought-tolerant species T. cordata. The measured growth based on tree ring data of both analyzed species was similar to those reported in other dendrochronological studies with regard to urban trees. T. cordata had an average growth rate of 3.05 mm·year−1, which is higher than the growth found by Gillner [73] in Dresden (1.6 and 2.43 mm·year−1 for two different streets). Iakovoglou et al. [18] found that for the honey locust (G. triacanthos), growth rates were approximately 4.8 mm·year−1 in the United States Midwest, whereas R. pseudoacacia in München and Würzburg exhibited a growth of 3.95 mm·year−1.

4.2. Stability, Sensitivity, and Modeling of Tree Growth in Relation to Their Environment

The stability of growth was similar in both cities, but a difference regarding species was found. R. pseudoacacia had a significantly higher stability than T. cordata. This is consistent with the slightly higher sensitivity of T. cordata than that of R. pseudoacacia, which can be explained by a higher vulnerability to climate and poor sites [3,38,68,69] Therefore, the sensitivity proved to be inversely related to the stability of growth; however, stability increased with age. With higher age an equilibrium between growth and the environmental influences is achieved, which leads to a stabilization of the growth rates over time, reducing the variation in growth [57]. This pattern is similar to the age trend of trees.
Trees growing in an urban landscape are affected by various environmental factors and site conditions, which influence the annual growth rate aside from their structure and species characteristics [18,19,20]. We could prove using a linear mixed model approach that in particular the available light, dbh, OSA, and water supply (measured with SPEI) influenced the growth of the analyzed tree species. Light is one of the driving forces of growth [74,75], not only in forests but also in urban areas. Trees growing solitarily without neighboring higher trees and shading buildings can reach their growth maximum [76,77]. These findings are strongly dependent on the species, with T. cordata being less affected by shade as a shade-tolerant species in comparison with R. pseudoacacia, a light-demanding species experiencing growth deficits when growing in shade. Furthermore, the analyzed growth over the last 20 years was not significantly affected by the city although Würzburg is characterized by 300 mm·year−1 less precipitation than München. The growing site with its local climate and individual tree characteristics are more important for tree growth than the overall growing city. A negative or positive city effect was therefore not observable.

4.3. Growth of Urban Trees under Drought Stress in Relation to the Tree Structure and Environment

The results of the drought year analysis (SEA) for München could not confirm the high drought resistance of R. pseudoacacia, which exhibited a significant growth reduction during the drought year, but recovered very quickly from the drought, proving a high drought resilience. When examining the original distribution of R. pseudoacacia, those results are not surprising. The original distribution of this species is the Atlantic North America at sites with yearly precipitation rates of 1000–1500 mm [44]. Roloff et al. [43] classified R. pseudoacacia as well suited for dry sites but not fit for more humid sites. The former distribution of this species suggests that R. pseudoacacia can additionally grow in regions of very high precipitation rates and is not as drought tolerant as expected. However, a fast recovery from the drought events highlights a high resilience to drought. T. cordata had the highest growth decrease during the first year after the drought event, followed by a quick recovery. Those results are similar to the results of Roloff et al. [43] and Gillner et al. [38] for two Acer species and confirm the classification of T. cordata as a moderate drought tolerant-species.
The drought year analysis (SEA) could prove that the studied species react to drought events with different water management strategies. Anisohydric species such as Quercus rubra close their stomata very slowly after a drought event; they show high fluctuations in their water management [78,79]. In contrast, isohydric species such as Picea abies react immediately to drought by closing their stomata; therefore, they exhibit fewer disruptions in their water management. Fagus sylvatica shows an intermediate water management type, showing similar patterns to T. cordata [78,79]. Although T. cordata reacted slowly, with growth reductions visible 1–2 years after the drought, R. pseudoacacia showed an immediate growth decrease during drought, with a fast recovery in München. Those species traits indicate that T. cordata is a more anisohydric species, whereas R. pseudoacacia displays characteristics more indicative of an isohydric species. This is in line with the findings of Peters et al. [80], who characterized ring-porous species such as R. pseudoacacia as having a higher capacity for regulation of their stomata as protection against drought, whereas diffuse-porous species such as T. cordata experience higher rates of water loss during summer [81].
Trees sampled in Würzburg showed no clear patterns regarding growth during and after drought. During the drought year, both species displayed no growth decline, whereas R. pseudoacacia showed a distinct growth reduction two years after the drought and T. cordata during the first- and second-year post-drought year. In particular, R. pseudoacacia displayed rapid recovery after the growth reduction; however, both species exhibited the highest drop in growth five years after the analyzed drought events (significant for T. cordata), which was presumably caused by an additional drought year. The SPEI of Würzburg revealed more frequent drought years than in München. Furthermore, the frequency of drought years in Würzburg is very high; after approximately five years, an additional year with an SPEI of <−0.5 occurs, adding further stress to the trees, which have only a very short time to recover from the previous drought. Moreover, Würzburg is characterized by extreme growth conditions with frequent late frosts and an overall low precipitation rate. Altogether, the factors driving the growth of urban trees in Würzburg are more complex compared to München, and tree growth can be influenced by other factors besides the extreme climate, including different planting methods or soil material and different fertilization methods. In particular, the method and soil used for planting, along with soil compaction, may have a strong effect on water management and growth of urban trees [82,83].

4.4. Effect of Urban Environment and Individual Tree Structure on the Drought Stress of Trees

A linear mixed model describing the growth behavior of the analyzed trees during low-growth episodes revealed that under stress, light availability, species traits, and the water supply (measured with SPEI) of the city are the driving forces of growth. The found results are mainly related to the analyzed species characteristics (higher shade tolerance of T. cordata), and contrary to the model for the overall growth, the variable “city” (München and Würzburg) in relation to the water supply (SPEI) proved significant, showing that specific city effects like, e.g., less precipitation and smaller planting pit in Würzburg [84,85] can modify the growth and drought stress of urban trees. During years with high growth episodes, the water supply (measured with SPEI) and the city had no influence on growth. All other variables (species, dbh, and canopy openness) significantly affected growth, but with reversed effects. While during drought years, a smaller canopy openness diminished tree growth, during favorable years the effect of higher canopy openness was positive. Both models of growth during drought years and during favorable years revealed the driving forces of urban tree growth reacting opposing on growth dependent on the surrounding environmental conditions.

5. Conclusions

The study highlights the growth patterns of two common European urban tree species (R. pseudoacacia and T. cordata) and how their growth changed with age. Different strategies were found depending on the analyzed city and species, with the ring-porous R. pseudoacacia exhibiting immediate growth reductions followed by fast recovery, while the diffuse-porous T. cordata showed delayed growth reductions. Further, the influence of the surrounding environment on tree growth was analyzed. Hereby, light conditions, water supply, and the species were most important for tree growth, which proved to be detrimental for tree growth during drought. However, the effects of the urban environment such as higher temperatures, highly sealed sites, late frosts, and de-icing salting in winter on tree growth, in particular within the context of drought years and climate change, have rarely been analyzed up to date. Further studies regarding the driving forces of urban tree growth during drought in relation to their environment, structure, and ecophysiology, as well as in view of climate change are necessary. These further studies would help to gain valuable information on sustainable tree planting and tree performance for healthy, long-living trees, thereby providing ecosystem services such as evaporative cooling, shading, carbon sequestration, and pollutant filtering for increasing the quality of life of human populations in cites.

Acknowledgments

This research was funded by the Bavarian State Ministry of the Environment and Consumer Protection (project TUF01UF-64971 “Urban trees under climate change: their growth, environmental performance, and perspectives”). Further, this work was supported by the German Research Foundation (DFG) and the Technical University of Munich (TUM) in the framework of the Open Access Publishing Program. We thank the departments for the municipal green areas of München and Würzburg for their support and encouragement. The authors also thank Chan Ka Nok, Alexander Hellwig, and Karin Beer for their assistance in field data collection as well as Peter Biber for statistical support.

Author Contributions

Thomas Rötzer, Stephan Pauleit, and Hans Pretzsch initiated the project; Astrid Moser performed the experiments and analyzed the data; Astrid Moser and Thomas Rötzer wrote the manuscript; and Stephan Pauleit and Hans Pretzsch revised the manuscript.

Conflicts of Interest

The authors declare no conflict of interest.

Abbreviations

The following abbreviations are used in this manuscript:
AIC
Akaike’s information criterion
Dbh
diameter at breast height
EPS
expressed population signal
OSA
open surface area of the tree pit
PET
potential evapotranspiration
RSE
residual standard error
RWI
ring width index
SD
standard deviation
SE
standard error
SEA
superposed epoch analysis
SPEI
standardized precipitation-evapotranspiration index
SVF
sky view factor

References

  1. Shashua-Bar, L.; Hoffman, M.E. Geometry and orientation aspects in passive cooling of canyon streets with trees. Energy Build. 2003, 35, 61–68. [Google Scholar] [CrossRef]
  2. Akbari, H.; Pomerantz, M.; Taha, H. Cool surfaces and shade trees to reduce energy use and improve air quality in urban areas. Sol. Energy 2001, 70, 295310. [Google Scholar] [CrossRef]
  3. Gillner, S.; Vogt, J.; Roloff, A. Climatic response and impacts of drought on oaks at urban and forest sites. Urban For. Urban Green. 2013, 12, 597–605. [Google Scholar] [CrossRef]
  4. Leuzinger, S.; Vogt, R.; Körner, C. Tree surface temperature in an urban environment. Agr. For. Meteorol. 2010, 150, 56–62. [Google Scholar] [CrossRef]
  5. Mueller, E.C.; Day, T.A. The effect of urban ground cover on microclimate, growth and leaf gas exchange of oleander in Phoenix, Arizona. Int. J. Biometeorol. 2005, 49, 244–255. [Google Scholar] [CrossRef] [PubMed]
  6. Nowak, D.J.; Crane, D.E. Carbon storage and sequestration by urban trees in the USA. Environ. Pollut. 2002, 116, 381–389. [Google Scholar] [CrossRef]
  7. Bolund, P.; Hunhammar, S. Ecosystem services in urban areas. Ecol. Econ. 1999, 29, 293–301. [Google Scholar] [CrossRef]
  8. Nowak, D.J.; Hirabayashi, S.; Bodine, A.; Hoehn, R. Modeled PM2.5 removal by trees in ten US cities and associated health effects. Environ. Pollut. 2013, 176, 395–402. [Google Scholar] [CrossRef] [PubMed]
  9. Dimoudi, A.; Nikolopoulou, M. Vegetation in the urban environment: Microclimatic analysis and benefits. Energy Build. 2003, 35, 69–76. [Google Scholar] [CrossRef]
  10. Dobbs, C.; Kendal, D.; Nitschke, C.R. Multiple ecosystem services and disservices of the urban forest establishing their connections with landscape structure and sociodemographics. Ecol. Indic. 2014, 43, 44–55. [Google Scholar] [CrossRef]
  11. Dobbs, C.; Escobedo, F.J.; Zipperer, W.C. A framework for developing urban forest ecosystem services and goods indicators. Landsc. Urban Plan. 2011, 99, 196–206. [Google Scholar] [CrossRef]
  12. Xiao, Q.; McPherson, E.G.; Ustin, S.L.; Grismer, M.E.; Simpson, J.R. A new approach to modeling tree rainfall interception. J. Geophys. Res. 2000, 105, 29–173. [Google Scholar] [CrossRef]
  13. Xiao, Q.; McPherson, E.G.; Ustin, S.L.; Grismer, M.E.; Simpson, J.R. Winter rainfall interception by two mature open-grown trees in Davis, California. Hydrol. Process. 2000, 14, 763–784. [Google Scholar] [CrossRef]
  14. Tyrväinen, L.; Pauleit, S.; Seeland, K.; Vries, S. Benefits and Uses of Urban Forests and Trees. In Urban Forests and Trees: A Reference Book; Konijnendijk, C., Nilsson, K., Randrup, T., Schipperijn, J., Eds.; Springer Berlin Heidelberg: Berlin, Germany, 2005; pp. 81–114. [Google Scholar]
  15. Fahey, R.T.; Bialecki, M.B.; Carter, D.R. Tree Growth and Resilience to Extreme Drought Across an Urban Land-use Gradient. Arboric. Urban For. 2013, 39, 279–285. [Google Scholar]
  16. Iakovoglou, V.; Thompson, J.; Burras, L.; Kipper, R. Factors related to tree growth across urban-rural gradients in the Midwest, USA. Urban Ecosyst. 2001, 5, 71–85. [Google Scholar] [CrossRef]
  17. Nowak, D.J.; Kuroda, M.; Crane, D.E. Tree mortality rates and tree population projections in Baltimore, Maryland, USA. Urban For. Urban Green. 2004, 2, 139–147. [Google Scholar] [CrossRef]
  18. Iakovoglou, V.; Thompson, J.; Burras, L. Characteristics of trees according to community population level and by land use in the U.S. Midwest. J. Arboric. 2002, 28, 59–69. [Google Scholar]
  19. Whitlow, T.H.; Bassuk, N.L. Trees in difficult sites. J. Arboric. 1986, 13, 10–17. [Google Scholar]
  20. Day, S.D.; Bassuk, N.L.; van Es, H. Effects of four compaction remediation methods for landscape trees on soil aeration, mechanical impedance and tree establishment. J. Arboric. 1995, 22, 144–150. [Google Scholar]
  21. Petersen, A.; Eckstein, D. Roadside trees in Hamburg-their present situation of environmental stress and their future chance for recovery. Arboric. J. 1988, 12, 109–117. [Google Scholar] [CrossRef]
  22. Beatty, R.A.; Heckman, C.T. Survey of urban tree programs in the United States. Urban Ecol. 1981, 5, 81–102. [Google Scholar] [CrossRef]
  23. Rhoades, R.W.; Stipes, R.J. Growth of trees on Virgina Tech campus in response to various factors. J. Arboric. 1999, 25, 211–217. [Google Scholar]
  24. IPCC. Climate Change 2007: The Physical Science Basis. In Contribution of Working Group I to the Fourth Assessment Report of the Intergovernmental Panel on Climate Change; Cambridge University Press: Cambridge, UK, 2007. [Google Scholar]
  25. Kjelgren, R.K.; Clark, J.R. Microclimates and Tree Growth in Tree Urban Spaces. J. Environ. Hortic. 1992, 10, 139–145. [Google Scholar]
  26. Pretzsch, H.; Matthew, C.; Dieler, J. Allometry of Tree Crown Structure. Relevance for Space Occupation at the Individual Plant Level. In Growth and Defence in Plants; Matyssek, R.E.A., Ed.; Springer Verlag: Berlin, Germany, 2012. [Google Scholar]
  27. Rötzer, T.; Seifert, T.; Gayler, S.; Priesack, E.; Pretzsch, H. Effects of Stress and Defence Allocationon Tree Growth: Simulation Results at the Individual and Stand Level. In Growth and Defence in Plants, Ecological Studies; Al, R.M.E., Ed.; Springer-Verlag: Berlin, Germany, 2012; Volume 220, pp. 401–432. [Google Scholar]
  28. Pretzsch, H.; Dieler, J. The dependency of the size-growth relationship of Norway spruce (Picea abies [L.] Karst.) and European beech (Fagus sylvatica [L.]) in forest stands on long-term size conditions, drought events, and ozone stress. Trees 2011, 25, 355–369. [Google Scholar] [CrossRef]
  29. Pretzsch, H.; Schütze, G.; Uhl, E. Resistance of European tree species to drought stress in mixed versus pure forests: Evidence of stress release by inter-specific faciliation. Plant Biol. 2013, 15, 483–495. [Google Scholar] [CrossRef] [PubMed]
  30. McDowell, N.; Pockman, W.T.; Allen, C.D.; Breshears, D.D.; Cobb, N.; Kolb, T.; Plaut, J.; Sperry, J.; West, A.; Williams, D.G.; et al. Mechanisms of plant survival and mortality during drought: Why do some plants survive while others succumb to drought? New Phytol. 2008, 178, 719–739. [Google Scholar] [CrossRef] [PubMed]
  31. Rais, A.; van de Kuilen, J.-W.G.; Pretzsch, H. Growth reaction patterns of tree height, diameter, and volume of Douglas-fir (Pseudotsuga menziesii [Mirb.] Franco) under acute drought stress in Southern Germany. Eur. J. For. Res. 2014, 133, 1043–1056. [Google Scholar] [CrossRef]
  32. Ryan, M.G.; Binkley, D.; Fownes, J.H. Age-Related Decline in Forest Productivity: Pattern and Process. Adv. Ecol. Res. 1997, 27, 213–262. [Google Scholar]
  33. Bartens, J.; Grissino-Mayer, H.D.; Day, S.D.; Wiseman, P.E. Evaluating the potential for dendrochronological analysis of live oak (Quercus virginiana Mill.) from the urban and rural environment—An explorative study. Dendrochronologia 2012, 30, 15–21. [Google Scholar] [CrossRef]
  34. Speer, J.H. Fundamentals of Tree-Ring Research; The University of Arizona Press: Tucson, AZ, USA, 2012. [Google Scholar]
  35. Cavin, L.; Mountford, E.P.; Peterken, G.F.; Jump, A.S. Extreme drought alters competitive dominance within and between tree species in a mixed forest stand. Funct. Ecol. 2013, 27, 1424–1435. [Google Scholar] [CrossRef]
  36. Orwig, D.A.; Abrams, D.A. Variation in radial growth responses to drought among species, site, and canopy strata. Trees 1997, 11, 474–484. [Google Scholar] [CrossRef]
  37. Rybníček, M.; Čermák, P.; Kolář, T.; Žid, T. Growth responses of Norway spruce (Picea abies (L.) Karst.) to the climate in the south-eastern part of the Českomoravská Upland (Czech Republic). Geochronometria 2012, 39, 149–157. [Google Scholar]
  38. Gillner, S.; Bräuning, A.; Roloff, A. Dendrochronological analysis of urban trees: Climatic response and impact of drought on frequently used tree species. Trees 2014, 28, 1079–1093. [Google Scholar] [CrossRef]
  39. He, X.; Chen, Z.; Chen, W.; Shao, X.; He, H.; Sun, Y. Solar activity, global surface air temperature anomaly and pacific decadal oscillation recorded in urban tree rings. Ann. For. Sci. 2007, 64, 743–756. [Google Scholar] [CrossRef]
  40. DWD. Deutscher Wetterdienst. Available online: http://www.dwd.de.
  41. Pauleit, S.; Jones, N.; Garcia-Marin, G.; Garcia-Valdecantos, J.-L.; Rivière, L.M.; Vidal-Beaudet, L.; Bodson, M.; Randrup, T.B. Tree establishment practice in towns and cities—Results from a European survey. Urban For. Urban Green. 2002, 1, 83–96. [Google Scholar] [CrossRef]
  42. Radoglou, K.; Dobrowolska, D.; Spyroglou, G.; Nicolescu, V.-N. A review on the ecology and silviculture of limes (Tilia cordata Mill., Tilia platyphyllos Scop. and Tilia tormentosa Moench.) in Europe. Die Bodenkult. 2009, 60, 9–19. [Google Scholar]
  43. Roloff, A.; Bonn, S.; Gillner, S. Klimawandel und Baumartenwahl in der Stadt—Entscheidungsfindung mit der Klima-Arten-Matrix (KLAM). Available online: http://www.frankfurt.de/sixcms/media.php/738/klam_stadt.pdf (accessed on 16 March 2016).
  44. Keresztesi, B. The Black Locust; Akadémiai Kiadó: Budapest, Hungary, 1988. [Google Scholar]
  45. Baker, F.S. A revised tolerance table. J. For. 1949, 47, 179–181. [Google Scholar]
  46. Niinemets, Ü.; Valladares, F. Tolerance to shade, drought, and waterlogging of temperate northern hemisphere trees and shrubs. Ecol. Monogr. 2006, 76, 521–547. [Google Scholar] [CrossRef]
  47. Moser, A.; Rötzer, T.; Pauleit, S.; Pretzsch, H. Structure and ecosystem services of small-leaved lime (Tilia cordata Mill.) and black locust (Robinia pseudoacacia L.) in urban environments. Urban For. Urban Green. 2015, 14, 1110–1121. [Google Scholar] [CrossRef]
  48. Matzarakis, A.; Rutz, F.; Mayer, H. Modelling radiation fluxes in simple and complex environments—Application of the RayMan model. Int. J. Biometeorol. 2007, 51, 323–334. [Google Scholar] [CrossRef] [PubMed]
  49. Yamashita, S.; Sekine, K.; Shoda, M.; Yamashita, K.; Hara, Y. On relationships between heat island and sky view factor in the cities of Tama River Basin, Japan. Atmos. Environ. 1986, 20, 681–686. [Google Scholar] [CrossRef]
  50. Rinn, F. TSAP Reference Manual. Available online: http://www.rinntech.com/.
  51. TSAP-Win: Time Series Analysis and Presentation for Dendrochronology and Related Applications, version 0.55; Rinn Tech.: Heidelberg, Germany, 2010.
  52. R, A language and environment for statistical computing; R Core Team: Vienna, Austria, 2014.
  53. Bunn, A.; Korpela, M.; Biondi, F.; Campelo, F.; Mérian, P.; Qeadan, F.; Zang, C.; Buras, A.; Cecile, J.; Mudelsee, M.; et al. (Eds.) Package “dplR”, version 1.6.3; Dendrochronology Program Library in R. 2015.
  54. COFECHA and ARSTAN, Chronology Series VI. In Tree-Ring Chronologies of Western North America: California, Eastern Oregon and Northern Great Basin with Procedures Used in the Chronology Development Work Including Users Manuals; Laboratory of Tree-Ring Research: University of Arizona, Tuscon, AZ, USA, 1986.
  55. Cook, E.R.; Holmes, R.L. User manual for computer program ARSTAN. In Tree-Ring Chronologies of Western North America: California, Eastern Oregon and Northern Great Basi; Holmes, R.L., Adams, R.K., Fritts, H.C., Eds.; University of Arizona: Tucson, AZ, USA, 1986; Volume 6, pp. 50–57. [Google Scholar]
  56. Roloff, A. Baumkronen. Verständnis Und Praktische Bedeutung Eines Komplexen Naturphänomens; Ulmer: Stuttgart, Germany, 2001. [Google Scholar]
  57. Jucker, T.; Bouriaud, O.; Avacaritei, D.; Coomes, D.A. Stabilizing effects of diversity on aboveground wood production in forest ecosystems: linking patterns and processes. Ecol. Lett. 2014, 17, 1560–1569. [Google Scholar] [CrossRef] [PubMed] [Green Version]
  58. Fritts, H.C. Tree Rings and Climate; Academic Press: London, UK, 1976. [Google Scholar]
  59. Lukaszkiewicz, J.; Kosmala, M. Determining the Age of Streetside Trees with Diameter at Breast Height-based Multifactorial Model. Arboric. Urban For. 2008, 34, 137–143. [Google Scholar]
  60. Dwyer, J.F. How old is that tree? Illinois Trees 2009, 24, 13. [Google Scholar]
  61. Vicente-Serrano, S.M.; Beguería, S.; López-Moreno, J.I. A Multiscalar Drought Index Sensitive to Global Warming: The Standardized Precipitation Evapotranspiration Index. J. Clim. 2010, 23, 1696–1718. [Google Scholar] [CrossRef] [Green Version]
  62. Droogers, P.; Allen, R.G. Estimating reference evapotranspiration under inaccurate data conditions. Irrig. Drain. Syst. 2002, 16, 33–45. [Google Scholar] [CrossRef]
  63. Hargreaves, G.H. Defining and using reference evapotranspiration. J. Irrig. Drain. Eng. 1994, 120, 1132–1139. [Google Scholar] [CrossRef]
  64. Quinoa: Improvement and Sustainable Production; Wiley-Blackwell: Oxford, UK, 2015.
  65. Pinheiro, J.; Bates, D.; DebRoy, S.; Sarkar, D.; R Core Team (Eds.) Nlme: Linear and Nonlinear Mixed Effects Models, 2015.
  66. Lough, J.M.; Fritts, H.C. An assessment of the possible effects of volcanic eruptions on North American climate using tree-ring data, 1602 to 1900 A.D. Clim. Chang. 1987, 10, 219–239. [Google Scholar] [CrossRef]
  67. Wigley, T.M.L.; Briffa, K.R.; Jones, P.D. On the Average Value of Correlated Time Series, with Applications in Dendroclimatology and Hydrometeorology. J. Clim. Appl. Meteor. 1984, 23, 201–213. [Google Scholar] [CrossRef]
  68. Schweingruber, F.H. Tree Rings and Environment; Swiss Federal Institute for Forest, Snow and Landscape Research: Birmensdorf, Switzerland, 1996. [Google Scholar]
  69. Beck, W.; Müller, J. Impact of heat and drought on tree and stand vitality─Dendroecological methods and first results from level II-plots in southern Germany. Schr. Forstl. Fak. Univ. Gött. Niedersächs. Forstl. Versanst. 2006, 142, 120–127. [Google Scholar]
  70. George, J.P.; Schueler, S.; Karanitsch-Ackerl, S.; Mayer, K.; Klumpp, R.T.; Grabner, M. Inter- and intra-specific variation in drought sensitivity in Abies spec. and its relation to wood density and growth traits. Agr. For. Meteorol. 2015, 214–215, 430–443. [Google Scholar] [CrossRef]
  71. Juday, G.P.; Alix, C. Consistent negative temperature sensitivity and positive influence of precipitation on growth of floodplain Picea glauca in Interior Alaska. Can. J. For. Res. 2012, 42, 561–573. [Google Scholar] [CrossRef]
  72. Pretzsch, H.; Dieler, J.; Seifert, T.; Rötzer, T. Climate effects on productivity and resource-use efficiency of Norway spruce (Picea abies [L.] Karst.) and European beech (Fagus sylvatica [L.]) in stands with different spatial mixing patterns. Trees 2012, 26, 1343–1360. [Google Scholar] [CrossRef]
  73. Gillner, S. Stadtbäume im Klimawandel—Dendrochronologische und physiologische Untersuchungen zur Identifikation der Trockenstressempfindlichkeit häufig verwendeter Stadtbaumarten in Dresden. Ph.D. Thesis, Universität Dresden, Dresden, Germany, 2012. [Google Scholar]
  74. Monteith, J.L. Climate and the efficiency of crop production in Britain. Philos. Trans. R. Soc. B 1977, 281, 277–294. [Google Scholar] [CrossRef]
  75. Walters, M.B.; Reich, P.B. Are shade tolerance, survival, and growth linked? Low light and nitrogen effects on hardwood seedlings. Ecology 1996, 77, 841–853. [Google Scholar] [CrossRef]
  76. Hasenauer, H. Dimensional relationship of open-grown trees in Austria. For. Ecol. Manag. 1997, 96, 197–206. [Google Scholar] [CrossRef]
  77. Uhl, E.; Metzger, H.G.; Seifert, T. Dimension und Wachstum von Solitären Buchen und Eichen, Sektion Ertragskunde, Jahrestagung, Staufen; Deutscher Verband Forstlicher Forschungsanstalten: Staufen, Germany, 2006. [Google Scholar]
  78. Río, M.D.; Schütze, G.; Pretzsch, H. Temporal variation of competition and facilitation in mixed species forests in Central Europe. Plant Biol. 2014, 16, 166–176. [Google Scholar] [PubMed]
  79. Pretzsch, H.; Rötzer, T.; Matyssek, R.; Grams, T.E.E.; Häberle, K.-H.; Pritsch, K.; Kerner, R.; Munch, J.-C. Mixed Norway spruce (Picea abies [L.] Karst) and European beech (Fagus sylvatica [L.]) stands under drought: From reaction pattern to mechanism. Trees 2014, 28, 1305–1321. [Google Scholar] [CrossRef]
  80. Peters, E.B.; McFadden, J.P.; Montgomery, R.A. Biological and environmental controls on tree transpiration in a suburban landscape. J. Geophys. Res. 2010. [Google Scholar] [CrossRef]
  81. Rahman, M.A.; Armson, D.; Ennos, A.R. A comparison of the growth and cooling effectiveness of five commonly planted urban tree species. Urban Ecosyst. 2015, 18, 371–389. [Google Scholar] [CrossRef]
  82. Rahman, M.A.; Smith, J.G.; Stringer, P.; Ennos, A.R. Effect of rooting conditions on the growth and cooling ability of Pyrus calleryana. Urban For. Urban Green. 2011, 10, 185–192. [Google Scholar] [CrossRef]
  83. Zaharah, S.S.; Razi, I.M. Growth, stomata aperture, biochemical changes and branch anatomy in mango (Mangifera indica) cv. Chokanan in response to root restriction and water stress. Sci. Hortic. 2009, 123, 58–67. [Google Scholar] [CrossRef]
  84. Prügl, B.J. Vegetationstechniken für Innerörtliche Baumstandorte; Bodeninstitut Johannes Prügl: Hallertau, Germany, 2016. [Google Scholar]
  85. Stadt Würzburg. STELLPLATZSATZUNG der Stadt Würzburg (SPS). Stellplatzsatzung vom 25. März 2014 (MP und VBl Nr. 73/2014 vom 28. März 2014)
Figure 1. Climate graphs of München (a) and Würzburg (b) from 1955 to 2014 (data source: DWD [40]). Black dots and line represent the mean annual temperature in °C and the gray bars represent the annual precipitation in mm.
Forests 07 00071 g001
Figure 2. Ring width index of Robinia pseudoacacia and Tilia cordata in München and Würzburg after double detrending (negative exponential function and 2/3 cubic smoothing spline).
Forests 07 00071 g002
Figure 3. Boxplots showing the relationships of growth stability with city (a) and species (b). Significances are marked by asterisks.
Forests 07 00071 g003
Figure 4. Regressions of stability with sensitivity (a) and stability with age (b). Highlighted are the regression lines of trees in München and Würzburg (a, ln(Stability) = 0.18 – 0.53 × ln(Sensitivity) – 0.08 × “City” + ε), and Tilia cordata as well as Robinia pseudoacacia (b, Sensitivity = 1.57 + 0.01 × age + 0.36 × “Species” + ε). For the regression of stability with sensitivity (b), both variables were log transformed.
Forests 07 00071 g004
Figure 5. Calculated standard precipitation-evapotranspiration index (SPEI) for München (a) from 1955 to 2014 and Würzburg (b) from 1947 to 2014 with a time scale of four months. Blue-colored series represents positive SPEI values (>0) of years with a positive climatic water balance, and red-colored series represents negative SPEI (<0) values of a negative climatic water balance.
Forests 07 00071 g005aForests 07 00071 g005b
Figure 6. Drought year analysis (superposed epoch analysis) of the ring width index (RWI) during drought years (0), pre-drought (−5 to −1) and after drought (1−5) for Robinia pseudoacacia (black) and Tilia cordata (gray) in München. Input drought years are 2004, 2003, 1998, 1992, 1982, and 1976 for R. pseudoacacia and 2004, 2003, 1998, 1992, 1982, and 1976 for T. cordata. Marked columns (asterisk) represent a departure that is greater than would have occurred randomly as determined from 1000 bootstrap simulations at p < 0.05.
Forests 07 00071 g006
Figure 7. Drought year analysis (superposed epoch analysis) of the ring width index (RWI) during drought years (0), pre-drought (−5 to −1) and after drought (1–5) for Robinia pseudoacacia (black) and Tilia cordata (gray) in Würzburg. Input drought years are 2012, 2003, 1993, 1976, and 1964 for R. pseudoacacia and 2012, 2003, 1976, and 1947 for T. cordata. Marked columns (asterisk) represent a departure that is greater than would have occurred randomly as determined from 1000 bootstrap simulations at p < 0.05.
Forests 07 00071 g007
Table 1. Statistical characteristics of the tree ring series of Tilia cordata and Robinia pseudoacacia in München and Würzburg.
ndbh min [cm]dbh Avg [cm]dbh Max [cm]Avg Tree Height [m]Avg OSA [m²]Avg Age [a]Growth Rate ± SD [mm·Year−1] Mean SensitivityEPS 1
Robinia pseudoacacia
München3014.044.5101.915.7102.3944.33.9 ± 1.70.330.90
Würzburg3211.044.3102.215.1109.5544.14.0 ± 1.90.340.85
Tilia cordata
München3712.034.286.713.1146.4842.63.2 ± 1.60.380.89
Würzburg3014.033.171.512.5123.3444.02.9 ± 1.60.390.89
1 Based on the ring width index of tree ring chronologies for the common period, obtained by double detrending of the tree ring series. dbh = stem diameter; OSA = open surface area; EPS = expressed population signal; SD = standard deviation.
Table 2. Results of linear regressions with stability as response variable and the variables sensitivity, dbh, and age as individually tested explanatory variables for the stability of growth of Tilia cordata and Robinia pseudoacacia in München and Würzburg (equation: response variable = a + b × explanatory variable). The table lists the regression coefficients (a, b), coefficients of determination (r2), RSE for bias correction, F-values, p-values, and SEs of regression coefficients as well as the sample size (n).
Response VariableExplanatory Variablena ± SEb ± SEr2RSEFp
ln(Stability)ln(Sensitivity)1280.14 ± 0.09−0.54 ± 0.080.250.2842.83<0.001
StabilityDbh1281.68 ± 0.150.01 ± 0.0030.090.7712.85<0.001
StabilityAge1281.74 ± 0.160.01 ± 0.0030.060.787.770.006
Dbh = stem diameter; RSE = residual standard error; SE = standard error.
Table 3. Linear mixed model on the annual growth rate (mm·year−1) during the last 20 years (1994–2013) of all analyzed trees (response variable) with the individual tree code as random effect and a random slope added for the effect of dbh, and fixed effects dbh, canopy openness, OSA, species, and water supply (measured with SPEI) of the form: Growth rateij = β1 × x1ij + … + βn × xnij + bi1 × z1ij + … + bin × znij + εij where the growth rate is the response variable for the jth of ni observations in the ith of M groups or clusters, β1, …, βn are the fixed-effect coefficients, which are identical for all groups, x1ij, …, xnij are the fixed-effect regressors for observation j in group i; the first regressor is usually for the constant, x1ij−1, bi1, … bin are the random-effect coefficients for group i, z1ij, …, znij are the random-effect regressors, and εij is the error for observation j in group i.
Value ± SEp
Intercept8.46 ± 1.74<0.001
Dbh−0.27 ± 0.03<0.001
Canopy openness0.10 ± 0.03<0.001
OSA−0.02 ± 0.010.03
Species−0.33 ± 1.900.86
Water supply (SPEI)0.18 ± 0.04<0.001
Dbh:OSA0.001 ± 2.1 × 10⁻⁴<0.001
Canopy openness:Species0.09 ± 0.040.03
SD Intercept5.72-
SD Dbh0.19-
ε1.18-
Dbh = stem diameter; OSA = open surface of the ground; SPEI = standardized precipitation-evapotranspiration index; SD = standard deviation; SE = standard error. Levels of species: 2 (Robinia pseudoacacia and Tilia cordata).
Table 4. Linear mixed model on ring width index (RWI) development of all years with an index < 1 (growth lower than normal, drought years) of all analyzed trees as the response variable with the individual tree code as a random effect and a random slope added for the effect of dbh, and fixed effects water supply (measured with SPEI), canopy openness, analyzed species, growing city, and dbh of the form: RWIij = β1 × x1ij + … + βn × xnij + bi1 × z1ij + … + bin × znij + εij where RWI is the response variable for the jth of ni observations in the ith of M groups or clusters, β1, …, βn are the fixed-effect coefficients, which are identical for all groups, x1ij, …, xnij are the fixed-effect regressors for observation j in group i; the first regressor is usually for the constant, x1ij−1, bi1, … bin are the random-effect coefficients for group i, z1ij, …, znij are the random-effect regressors, and εij is the error for observation j in group i.
Value ± SEp
Intercept0.82 ± 0.04<0.001
Water supply (SPEI)0.03 ± 0.01<0.001
City−0.01 ± 0.010.67
Species−0.05 ± 0.01<0.001
Dbh−0.001 ± 7.4 × 10−40.27
Canopy openness−0.002 ± 7.4 × 10−40.03
Water supply (SPEI): City−0.03 ± 0.010.009
Canopy openness: Dbh0.0001 ± 1.7 × 10−50.002
SD Intercept0.09-
SD Dbh0.001-
ε0.17-
RWI = ring width index, dbh = stem diameter; SPEI = standardized precipitation-evapotranspiration index; SD = standard deviation; SE = standard error. Levels of species: 2 (Robinia pseudoacacia and Tilia cordata), levels of city: 2 (Würzburg and München).
Table 5. Linear mixed model on ring width index (RWI) development of all years with an index > 1 (growth higher than normal, favorable years) of all analyzed trees as the response variable with the individual tree code as a random effect and a random slope added for the effect of dbh, and fixed effects canopy openness, analyzed species, and dbh of the form: RWIij = β1 × x1ij + … + βn × xnij + bi1 × z1ij + … + bin × znij + εij where RWI is the response variable for the jth of ni observations in the ith of M groups or clusters, β1, …, βn are the fixed-effect coefficients, which are identical for all groups, x1ij, …, xnij are the fixed-effect regressors for observation j in group i; the first regressor is usually for the constant, x1ij1, bi1, … bin are the random-effect coefficients for group i, z1ij, …, znij are the random-effect regressors, and εij is the error for observation j in group i.
Value ± SEp
Intercept1.24 ± 0.04<0.001
Canopy openness0.002 ± 8.9 × 10−40.01
Species0.05 ± 0.020.001
Dbh0.001 ± 7.5 × 10−40.30
Canopy openness: Dbh−0.0001 ± 1.8 × 10−50.003
SD Intercept0.11-
SD Dbh0.001-
ε0.22-
RWI = ring width index; dbh = stem diameter; SD = standard deviation; SE = standard error. Levels of species: 2 (Robinia pseudoacacia and Tilia cordata).

