Article

Ecofunctional Traits and Biomass Production in Leguminous Tree Species under Fertilization Treatments during Forest Restoration in Amazonia

by
Roberto K. Jaquetti
1,
José Francisco de C. Gonçalves
1,*,
João Baptista S. Ferraz
1,
Marciel J. Ferreira
2 and
Ulysses M. dos Santos Junior
1
1
National Institute of Amazonian Research, Laboratory of Plant Physiology and Biochemistry, Ave. André Araújo, 2936, Aleixo, Manaus, AM 69011-970, Brazil
2
Federal University of the Amazon, Ave. Gal. Rodrigo Otávio Jordão Ramos, 3000, Coroado, Manaus, AM 69077-000, Brazil
*
Author to whom correspondence should be addressed.
Forests 2016, 7(4), 76; https://doi.org/10.3390/f7040076
Submission received: 21 December 2015 / Revised: 4 March 2016 / Accepted: 18 March 2016 / Published: 12 April 2016

Abstract

:
Background: Choosing the correct species and fertilization treatments is a determining factor in the success of forest restoration. Methods: A field study was conducted in a degraded area near the Balbina hydroelectric dam in Amazonas State (AM), Brazil, to evaluate two hypotheses: (i) leguminous tree species exhibit differences in growth, leaf nutrient content, and photosynthetic nutrient use efficiencies; and (ii) differences in these characteristics depend on the fertilization treatments to which the species have been subjected. Dipteryx odorata, Inga edulis and Schizolobium amazonicum were subjected to the following treatments: (T1) unfertilized control; (T2) post-planting chemical fertilization; (T3) post-planting organic fertilization and (T4) combined chemical and organic post-planting fertilization. Results: In general, I. edulis had the highest absolute growth rate of biomass under all of the fertilization treatments. I. edulis and S. amazonicum showed the highest growth rates under the T4 treatment. D. odorata showed the greatest responses under the T2 and T4 treatments. Native leguminous trees with higher photosynthetic performance and better nutrient use efficiency exhibited greater growth and biomass production. Conclusion: The results suggest that an adequate balance between leguminous species selection and fertilization will aid in the success of forest restoration in Amazonia.

1. Introduction

Years of deforestation in Amazonian forest ecosystems have resulted in a loss of 20% of their original area and 10 million hectares of degraded landscapes [1,2,3]. In these areas, the establishment of forest plantations using species of commercial value would have significant socio-economic and environmental value, as such plantations can play multiple roles by accelerating natural regeneration and reducing human pressure on natural forests [2,4,5,6,7,8].
The environmental conditions in degraded areas are far from ideal; high solar irradiance, drought periods and low soil nutrient availability, which are common in Amazonian ecosystems, can compromise the initial establishment and biomass production and enhance the root/shoot ratio of tree species [9,10,11,12]. Of these stress factors, the easiest to modify is generally the soil conditions, which can be altered by applying chemical treatments and occasionally organic fertilizer. Limited data are available regarding the adequate nutrient application rates and methods as well as plant utilization efficiency, especially under field conditions [13].
Several studies have suggested the use of leguminous tree species in forest plantations to reclaim soil fertility [14,15,16,17,18]. These species have been used for fallow enrichment and green fertilization for both restorative and commercial purposes in forest plantations [19,20,21]. Chemical and organic fertilizers can be utilized more effectively by selecting more efficient species that can absorb nutrients present in lower concentrations in the soil at higher rates [22].
In this study, we tested two hypotheses: (i) leguminous tree species exhibit differences in growth, leaf nutrient content, and photosynthetic rates, with photosynthetic nutrient use efficiencies being an important functional trait for determining the growth performances of these species in degraded areas; and (ii) differences in these characteristics depend on the fertilization treatments to which the species have been subjected. The objectives of this study were to investigate the growth, biomass allocation and photosynthetic nutrient use efficiencies of three native leguminous trees that were grown in a degraded area of the Amazon and to determine the responses of these species to different post-planting chemical and organic fertilization treatments.

2. Experimental Section

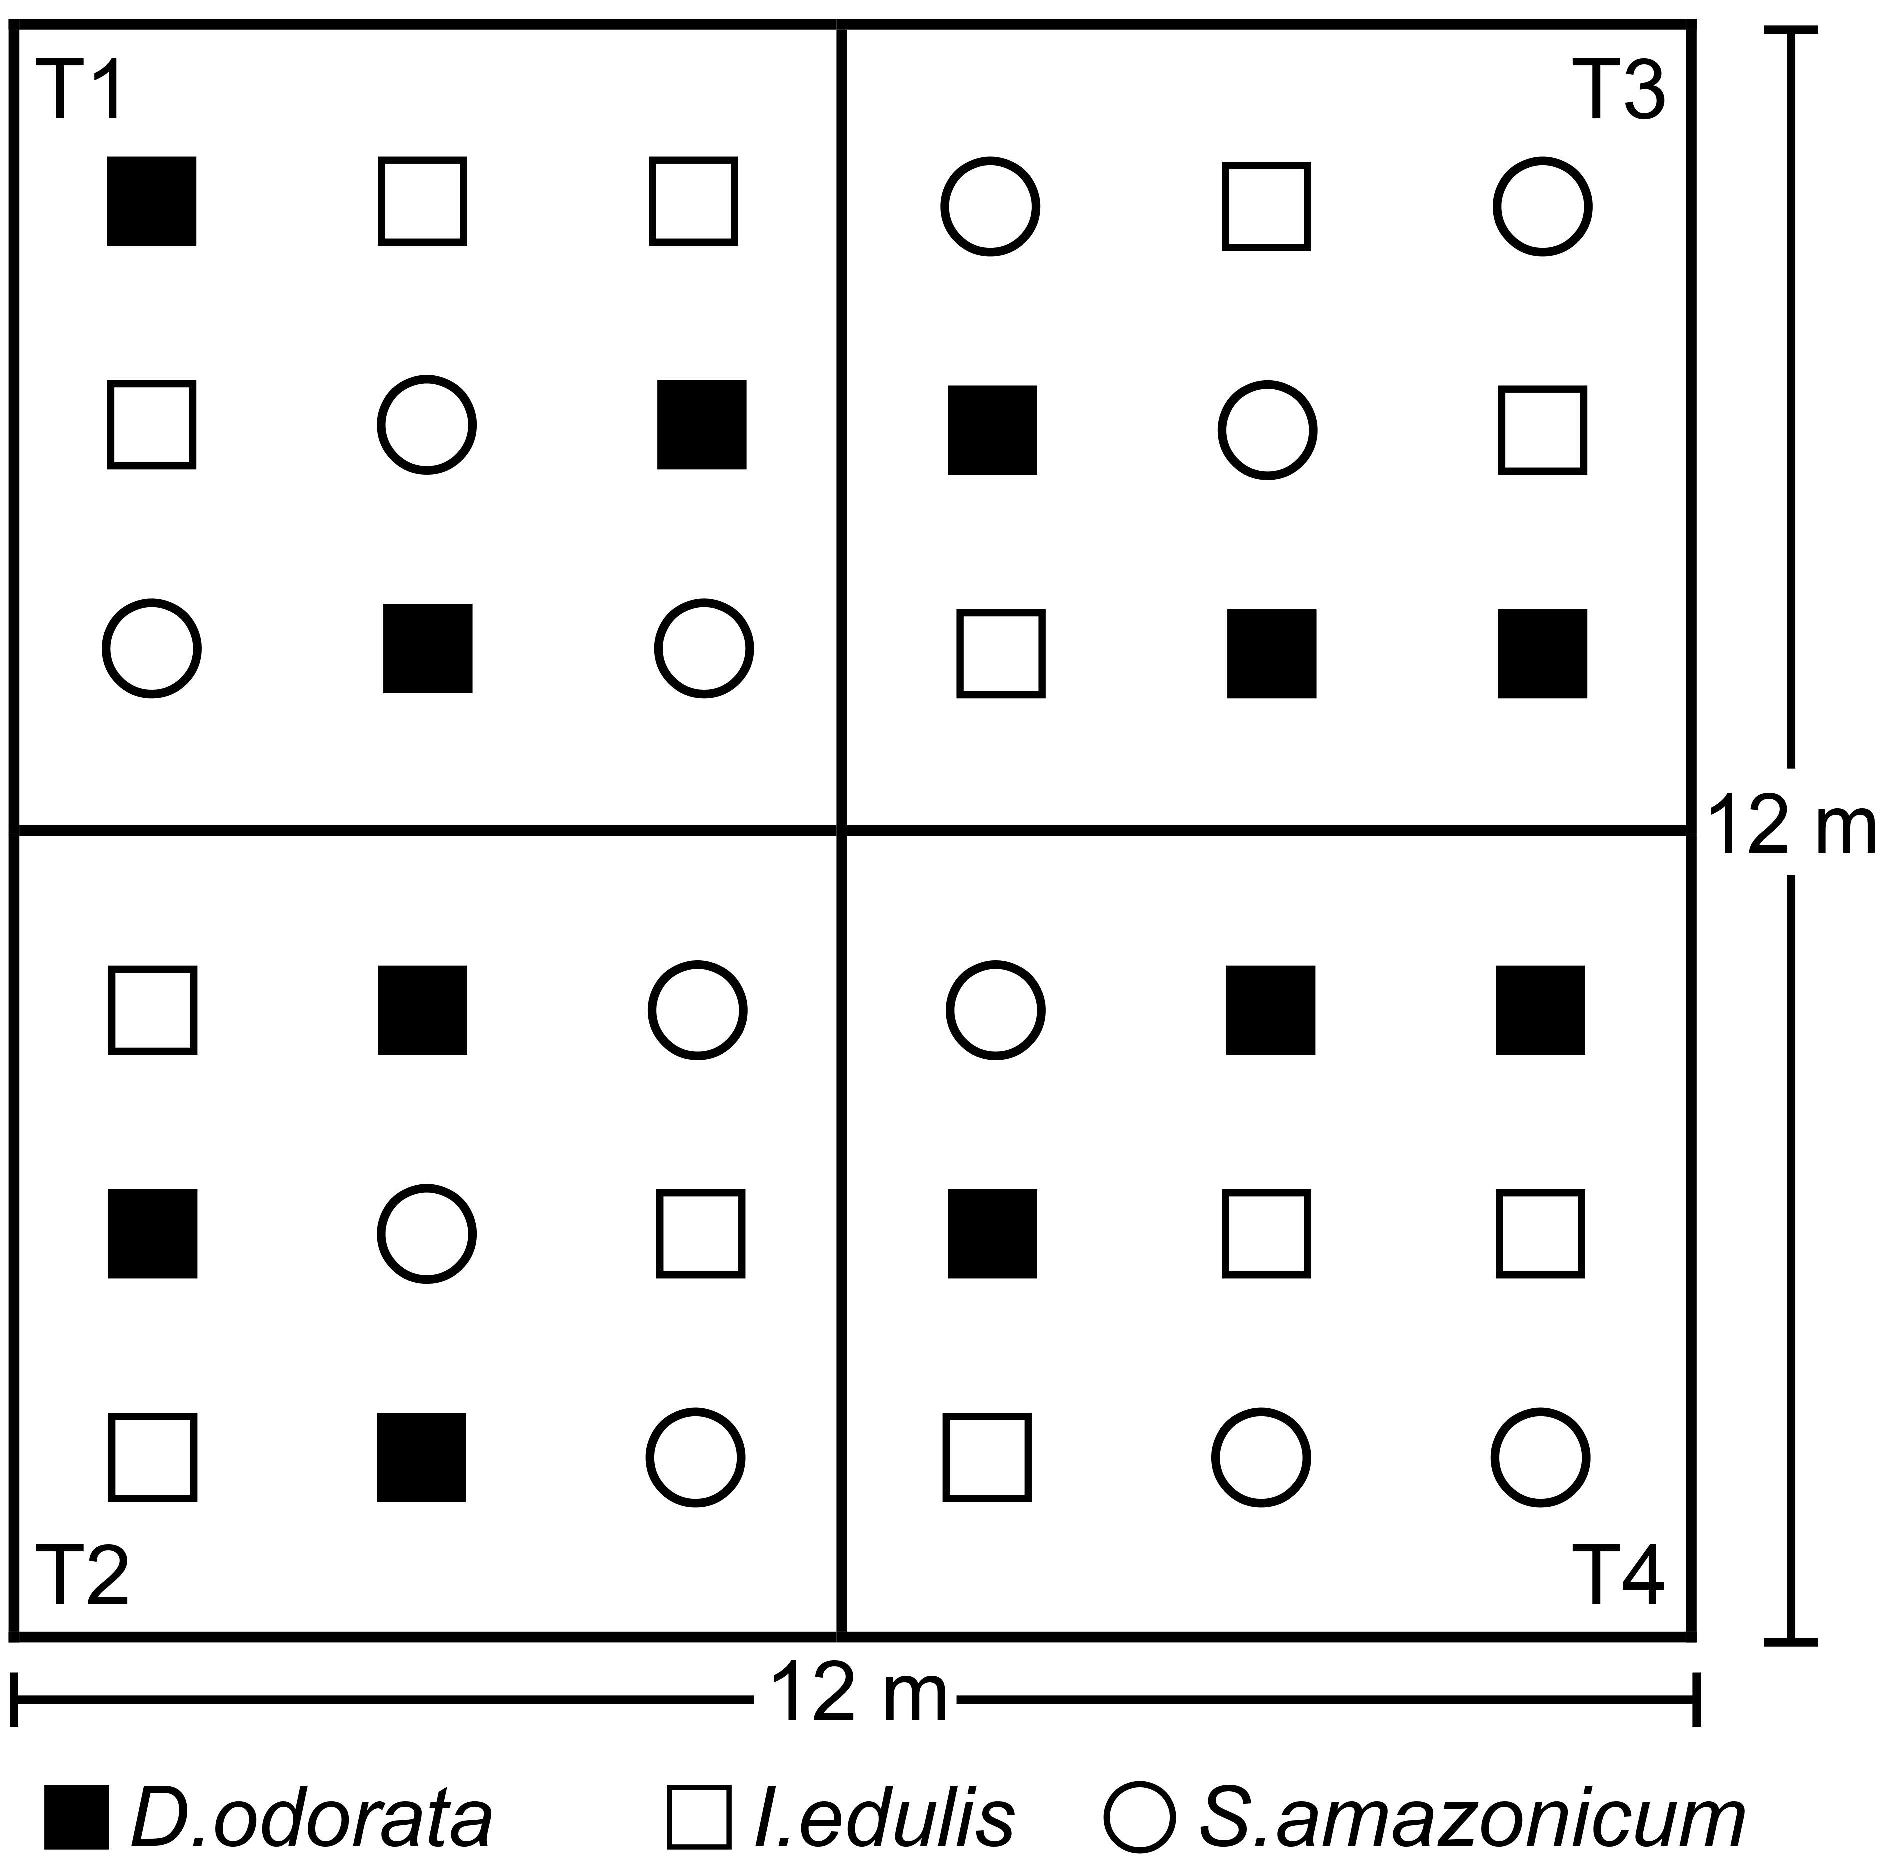
2.1. Study Site, Leguminous Species and Fertilization Treatments

This study was conducted in a degraded area of the Balbina Hydroelectric Dam Forest Restoration Program (PRAD Balbina) (01°55′99′′ S and 59°24′65′′ W) in President Figueiredo County, AM, Brazil, in Central Amazonia. The area covers 6 hectares and was degraded when the dam was constructed in 1983. The natural vegetation of the area, which is characterized as “non-flooded dense forest”, was completely removed, but the topsoil was left in place. The most common species found in the surrounding natural forest are Pouteria spp., Protium spp., Inga spp. Ocotea spp., Hymenaea courbaril, Eschweilera sp., and Dipteryx odorata, with a mean height of 30 m. The most probable limiting factor for natural regeneration in the area is the low concentration of nutrients at the site. After the litter layer was removed, nutrient cycling was likely reduced. The study blocks were located in vegetation gaps to avoid shaded spots that are produced by islands of natural regeneration. Based on the Köppen climate classification system, the climate of the region is Af (tropical humid) with a mean annual temperature above 25 °C and an annual precipitation of 2280 mm. The soil in the area is a yellow oxisol with high acidity and low natural fertility.
The experiment was initiated in December 2010. The preparation of the site began with the manual excavation of 30 cm square × 40 cm deep tree-planting holes using a straight spade with an iron cable. Fifteen days before planting the seedlings, 50 g of lime, 150 g of the chemical fertilizer Fosmag® Bunge (São Paulo, SP, Brazil; 4% N, 14% P, 7% K, 11.5% Ca, 2.7% Mg, 10.4% S, 0.07% B, 0.59% Zn and 0.15% Cu) and 15 g of FTE BR-12® Nutriplant (São Paulo, SP, Brazil; 7.1% Ca, 5.7% S, 1.8% B, 0.8% Cu, 2.0% Mn, 0.1% Mo and 9.0% Zn) were incorporated into the soil in all of the fertilization treatments except for T1 (control), which did not receive any type of fertilization at any time. The excavated pits will be referred to as fertilization pits in this paper. The fertilization pits were only created at the time of site preparation; thus, the period following fertilization in the T2, T3 and T4 treatments can be considered as the post-planting fertilization period. The distance between the seedlings was 2 m × 2 m.
A randomized block experimental design was used. Six experimental blocks (n = 6) were placed in the area. Each block covered 144 m2 (12 m × 12 m) and contained all 12 of the treatments from the combination of the three species and four fertilization treatments. Each treatment was replicated three times in each block, which resulted in 36 seedlings per block and 216 seedlings in the experiment. The species were randomly placed within each block, and the fertilization treatments were installed in a particular arrangement, as shown in Figure 1. The chemical fertilization treatments were placed in the bottom half of the blocks to avoid contamination between the treatments due to the slope gradient. The organic fertilization treatments were placed on the same side to better examine the effects of the organic amendments.
Three native leguminous species, i.e., the ice-cream bean tree (Inga edulis Mart.), tonka bean (Dipteryx odorata [(Aubl.) Willd.]) and white faveira (Schizolobium amazonicum Huber ex Ducke), were selected for study based on the criteria of uniform size and individual health within the same species (heights of 40 cm for I. edulis, 35 cm for D. odorata and 30 cm for S. amazonicum). Among the three species selected for the present study, I. edulis, an early successional species, is the only N2-fixing species and is primarily used in agroforestry systems and mixed-species plantations as a facilitative species [23]. D. odorata has great potential for use in forest restoration because it is a late successional species that is well adapted to degraded areas and also produces high-quality hardwood [24]. S. amazonicum, a mid-successional species, is currently the most commonly planted native species in commercial forest plantations in Amazonia because of its rapid growth and high-quality stems [18,25,26].
The following fertilization schemes were used: (T1) unfertilized (control); (T2) post-planting chemical fertilization; (T3) post-planting organic fertilization and (T4) post-planting chemical and organic fertilization. The post-planting chemical fertilization treatments (T2 and T4) received two additional applications. In the first application, which was performed four months after planting, 50 g of lime and 150 g of Fosmag® were applied (the same formulation as above) with 15 g of FTE BR-12® Nutriplant (the same formulation as above). The second application was performed 8 months after planting and consisted of 50 g of lime and 150 g of the chemical fertilizer NPK 4-14-8® Bunge (São Paulo, SP, Brazil; 4% N, 14% P and 8% K). The chemical fertilizers were applied over a 50-cm diameter area around the seedlings.
For treatments T3 and T4 (organic fertilization treatments), branches and leaves were collected from the lower third of the trees in the study area where a secondary forest was present. The collected material was then manually chopped into 10-cm-long pieces using a machete, and the material was applied to the bare soil without incorporation. The areas of treatments T3 and T4 were covered (36 m2 for T3 and 36 m2 for T4 in each block) to form a 25-cm-high layer of green material.
The organic fertilization treatments were also applied twice. The first application was performed 10 days before planting and consisted of 12.45 kg·m−2 (124.5 ton·ha−1) of fresh mass or 6.78 kg·m−2 (67.8 ton·ha−1) of oven-dried mass. The second application was performed 4 months after planting and consisted of 5.52 kg·m−2 (55.2 ton·ha−1) of fresh mass or 3.07 kg·m−2 (30.7 ton·ha−1) of oven-dried mass. The mean values of 10 samples analyzed to determine macronutrient and micronutrient contents in the dry plant material used in the organic fertilization treatments were as follows: 481.1 g·kg−1 C, 10.7 g·kg−1 N, 0.4 g·kg−1 P, 3.9 g·kg−1 K, 5.3 g·kg−1 Ca, 1.5 g·kg−1 Mg, 244.2 mg·kg−1 Fe and 23.7 mg·kg−1 Zn. Assuming that each plant covered an area of 4 m2, the first application consisted of approximately 13 kg C, 290 g N, 11 g P, 106 g K, 144 g Ca and 41 g Mg per plant, and the second application consisted of approximately 6 kg C, 131 g N, 5 g P, 48 g K, 65 g Ca and 18 g Mg per plant.
The total nutrients that were applied per plant were as follows: (T1) no fertilization; (T2) 18 g N, 63 g P, 33 g K, 82 g Ca, 38 g Mg, 33 g S, 0.7 g B, 4.4 g Zn, 0.7 g Cu, 0.6 g Mn, and 0.03 g Mo; (T3) 19 kg C, 427 g N, 37 g P, 164.5 K, 242 g Ca, 73 g Mg, 16 g S, 0.4 g B, 2 g Zn, 0.3 g Cu, 0.3 Mn, and 0.015 g Mo; and (T4) 19 kg C, 445 g N, 100 g P, 197 g K, 324 g Ca, 111 g Mg, 49 g S, 1 g B, 6.4 g Zn, 1 g Cu, 0.9 g Mn, and 0.045 g Mo.

2.2. Soil Fertility Analysis

Six soil samples from each fertilization treatment were collected at the end of the experiment at four depths: 0–2.5, 2.5–7.5, 7.5–20 and 20–40 cm. Each sample represented a composite of three soil sub-samples that were collected at the base of the seedlings in each species treatment. The samples were analyzed for carbon (C) and macronutrients (N, P, K, Ca and Mg). The total N level was determined using the Kjeldahl method [27]. The concentrations of Ca and Mg were obtained using 1 M KCl extraction and were determined using atomic absorbance spectrophotometry [28]. The macronutrients P and K were extracted with Mehlich 1 solution (0.05 M HCl + 0.0125 M H2SO4); the P levels were determined using visible spectrophotometry [29], and the K levels were determined using flame photometry [27].

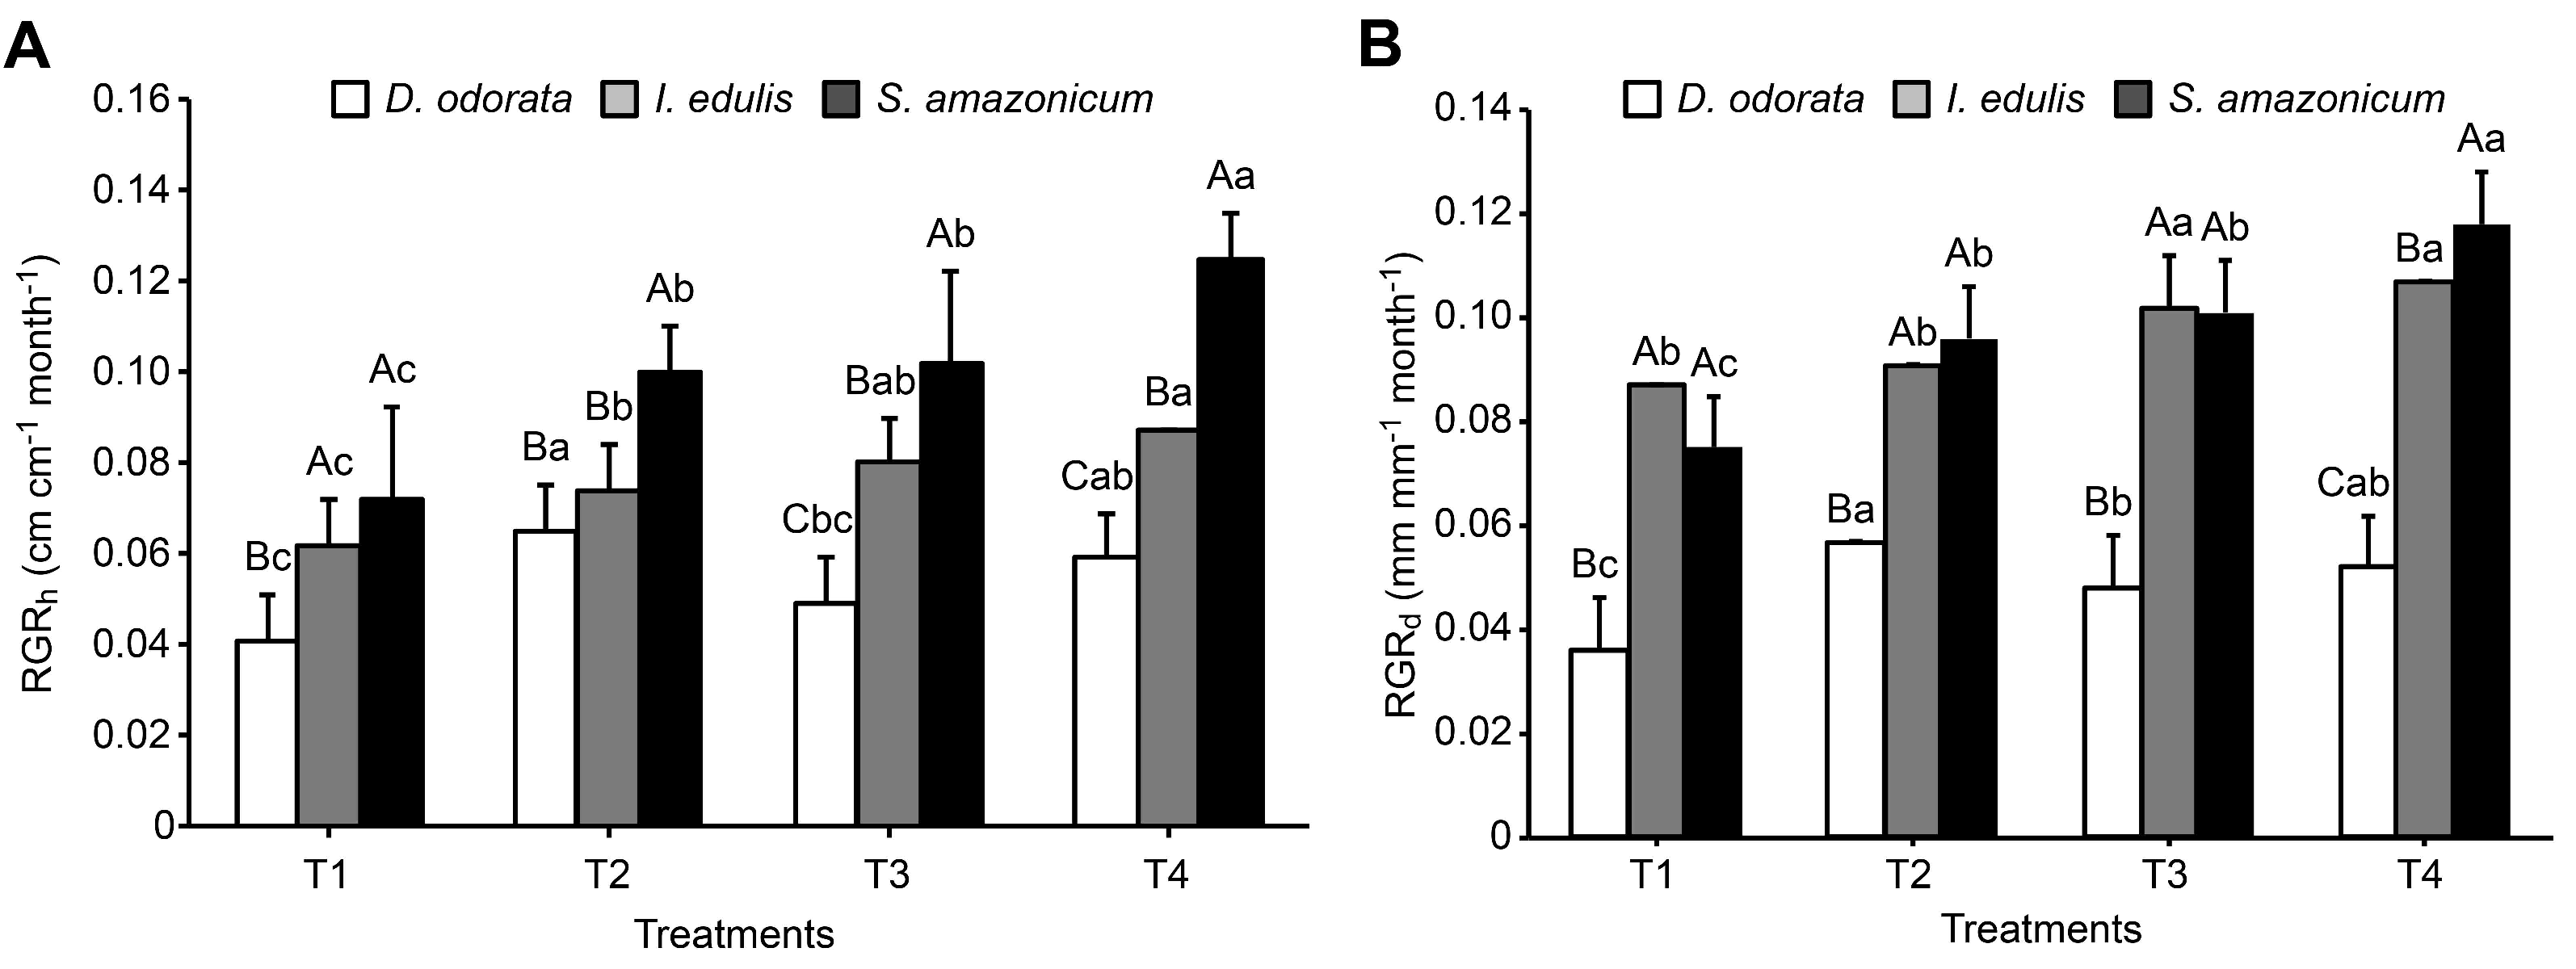
2.3. Relative Height and Diameter Growth Rates

The growth of the species was evaluated by determining the relative growth rates (RGRs) of the plant dimensions, such as height and diameter. Stem length (SL) and collar diameter (CD) data were collected in two stages with six replicates per treatment (n = 6). The first measurement was performed in January 2011, 10 days after planting, and the second measurement was performed 11 months later. The relative height (RGRh) and diameter (RGRd) growth rates were determined as described by Hunt [30] (RGRh = Log h2 − Log h1/t2 − t1), where Log h1 = initial height, Log h2 = final height, t1 = initial time, and t2 = final time.

2.4. Biomass Production and Allocation

To determine the absolute biomass growth rates (AGRbiomass) of the treatments for all compartments (leaves, stems and roots), six additional seedlings per species were randomly selected at planting. The leaves, stems and roots were detached from each seedling and placed in a forced-ventilation oven at 65 °C until the material reached a constant weight. After drying, the material was weighed using a digital scale (Mettler PM 30-K) with a precision of 0.01 g. The second data collection was performed 11 months after planting by randomly selecting one of the three replicates from each treatment in the six blocks (n = 6). First, the shoots were collected and set aside. To collect the roots, we excavated soil starting at a distance of 50–100 cm from the plant until the first roots were visible. Next, we carefully dug in this area to separate the soil from the roots. The leaves, stems and roots were detached from each plant and taken to the Laboratory of Soils and Plants of the National Institute of Amazonian Research (LSP—INPA). The roots were washed until all of the soil particles were removed. The material was placed in a forced-ventilation oven (65 °C for the leaves and fine roots, 105 °C for the stems and coarse roots) until the material reached a constant weight according to a digital scale (Mettler PM 30-K) with a precision of 0.01 g [31,32].
The absolute biomass growth rates (AGRbiomass) for all of the compartments (leaves, stems and roots) were calculated as described by Hunt [30] (AGRbiomass = W2 − W1/t2 − t1), where W1 = initial weight, W2 = final weight, t1 = initial time, and t2 = final time.
The dry mass allocation, leaf mass fraction (LMF), stem mass fraction (SMF) and root mass fraction (RMF) were determined as described by Poorter, et al. [33], where LMF = leaf dry mass/total plant dry mass, SMF = stem dry mass/total dry mass, and RMF = root dry mass/total dry mass.

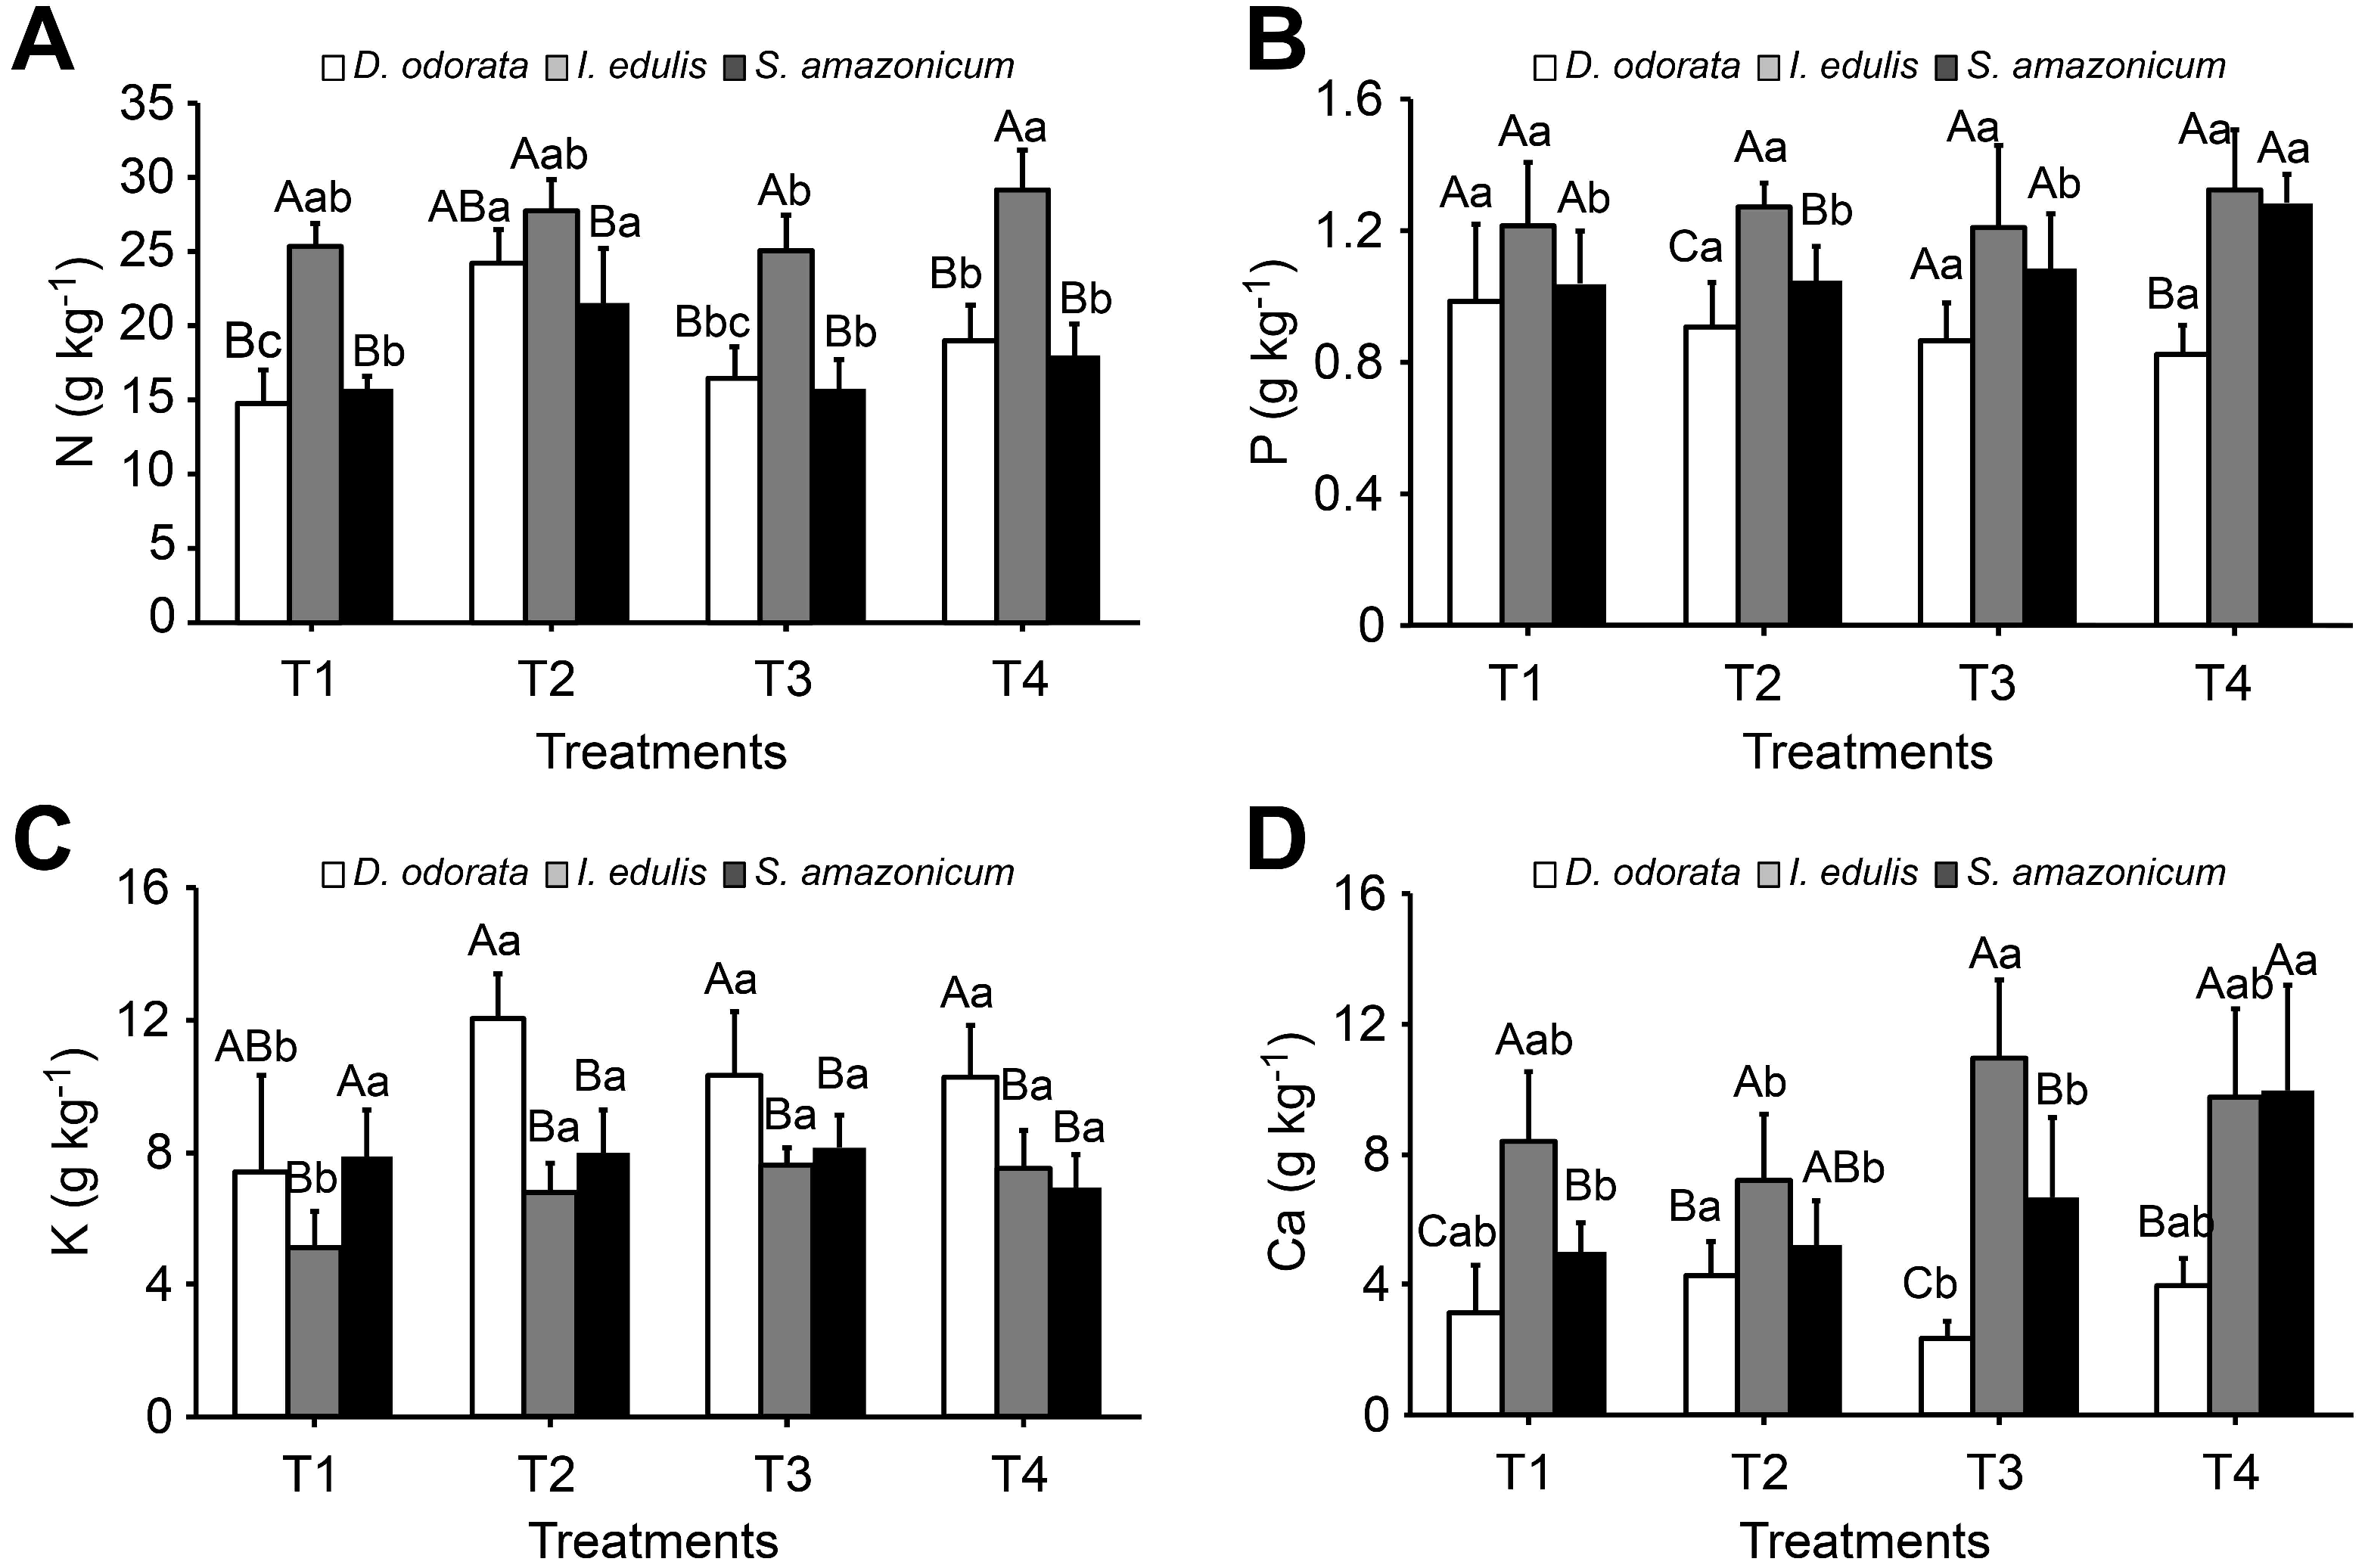
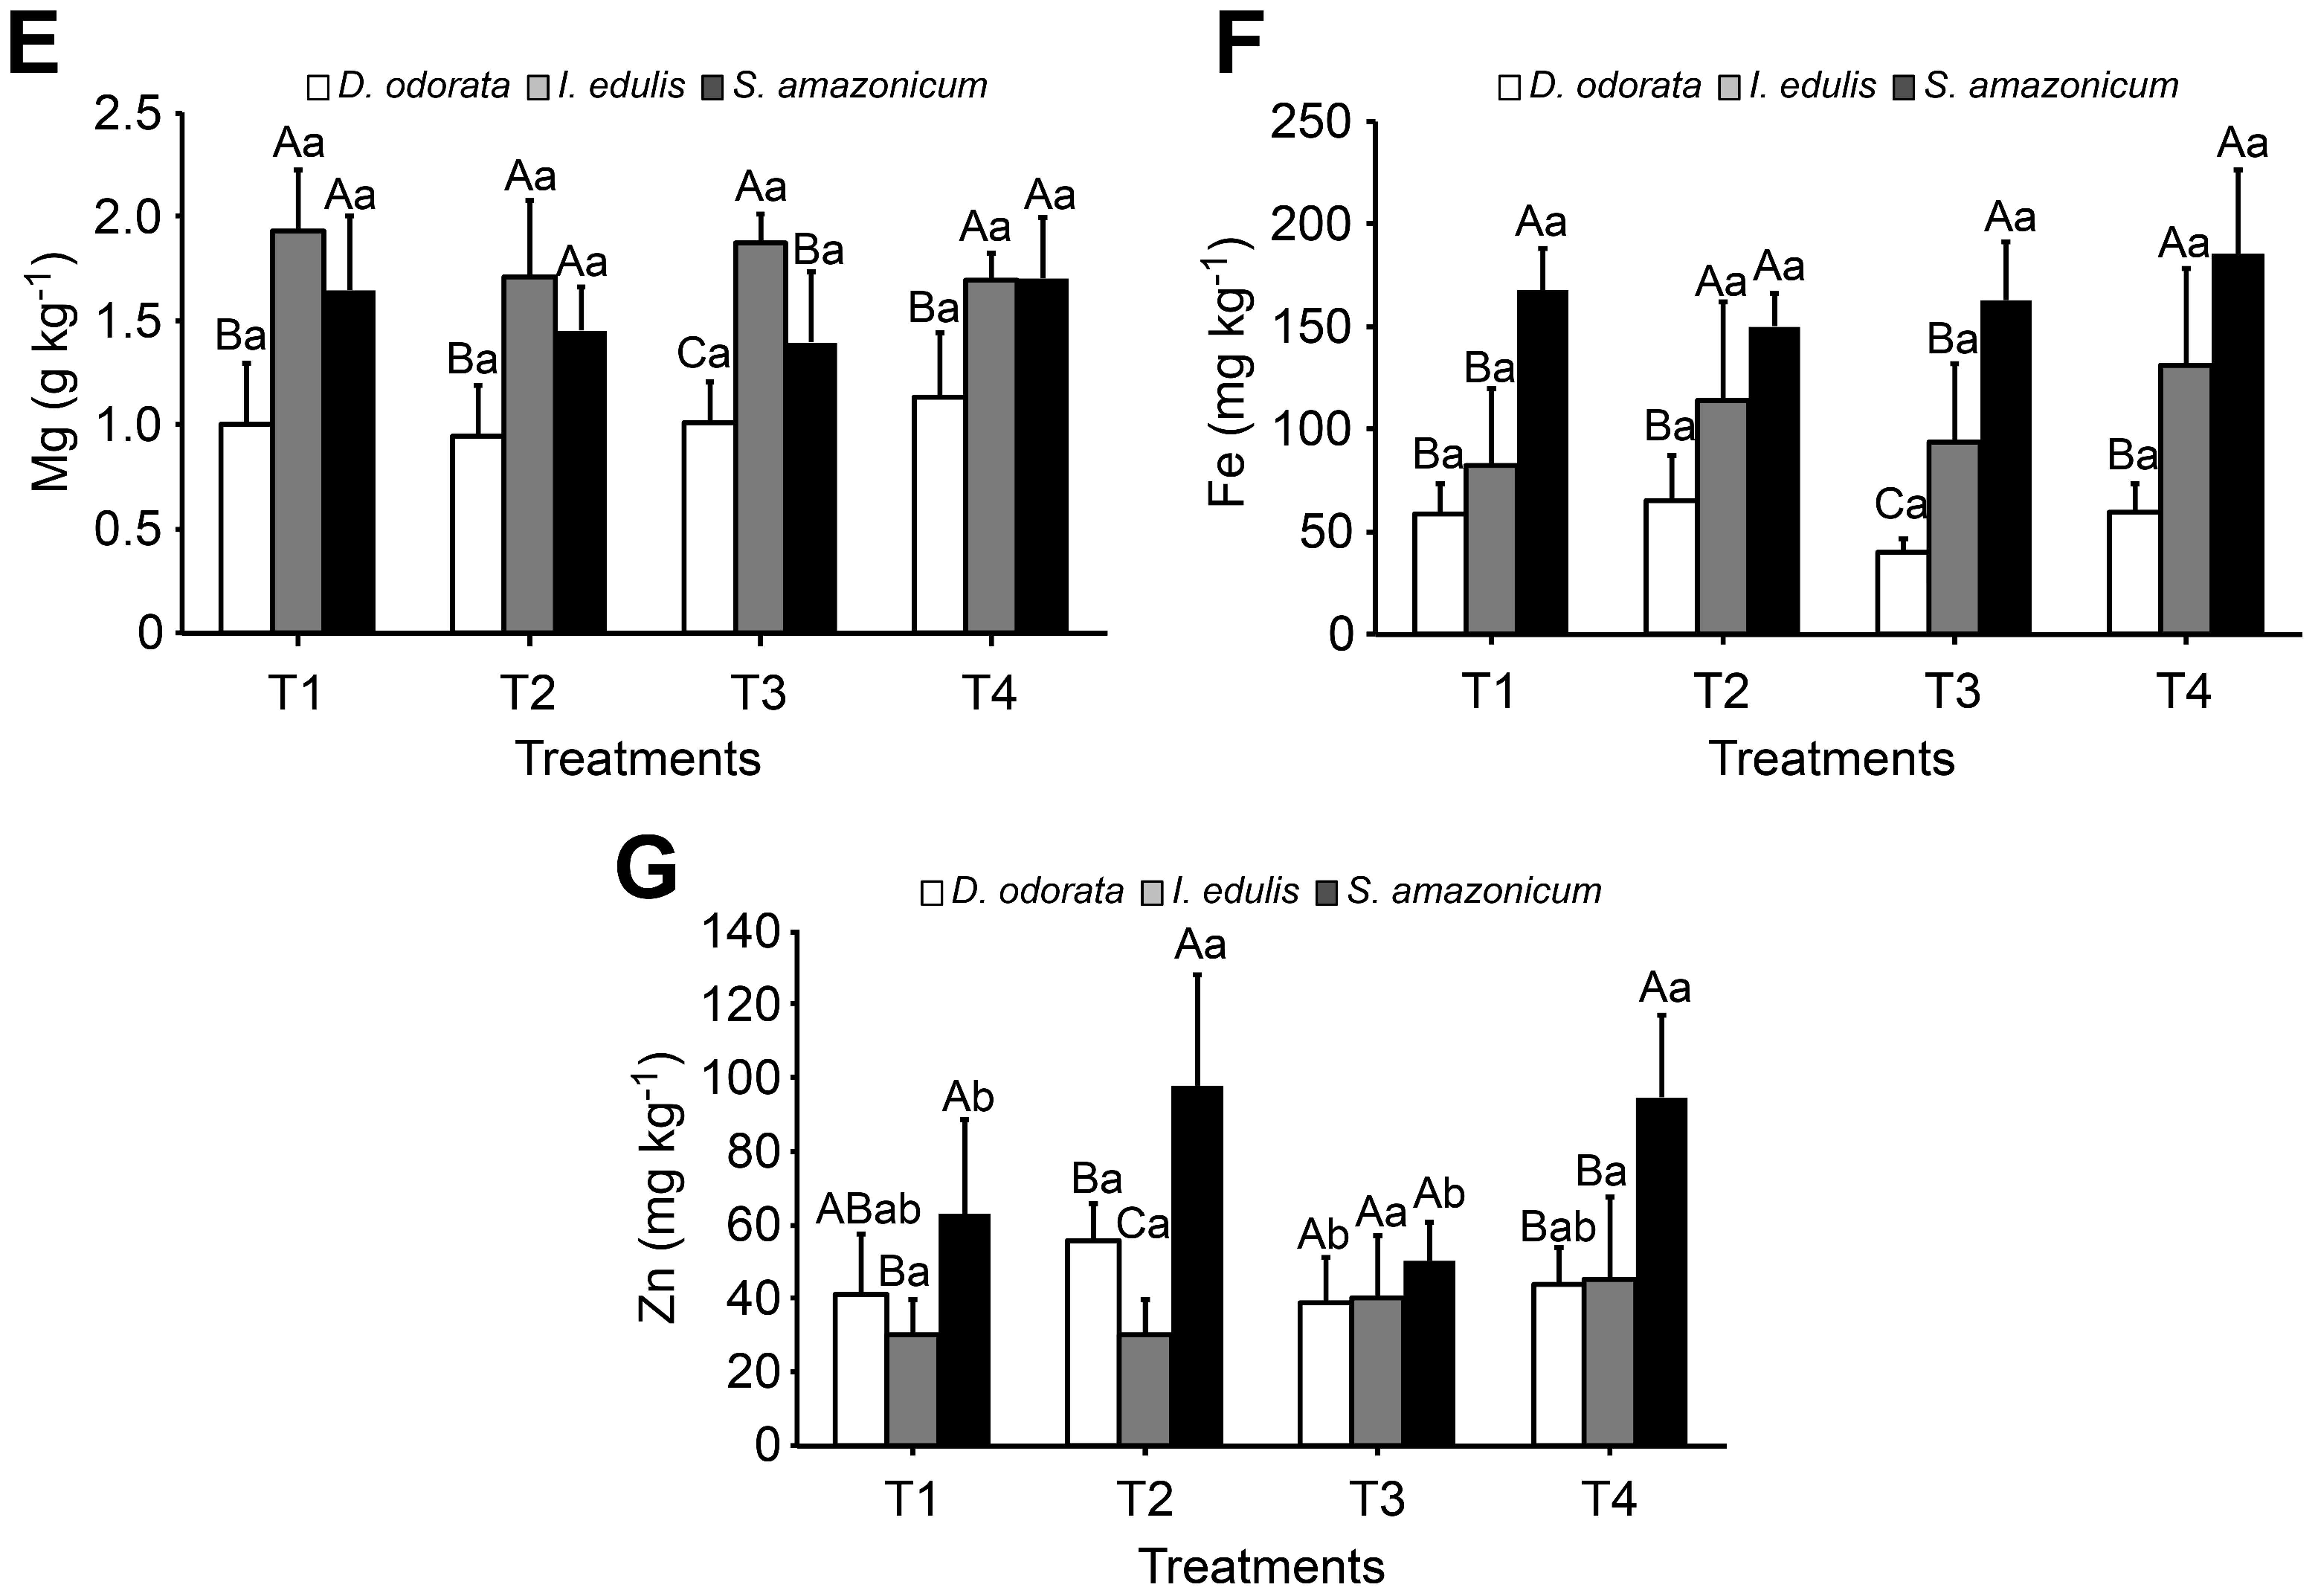
2.5. Leaf Nutrient Content

Four fully expanded and healthy leaves from the middle third of the plants were pre-selected in each treatment to determine the macronutrient and micronutrient contents of the leaves. To determine the N content, 0.1 g of the pre-selected dry leaf samples were submitted to predigestion overnight followed by double acid digestion (H2O2 + H2SO4) as described by Miyazawa et al. [28]. The total N content was determined according to the Kjeldahl method. The phosphorus content was determined using spectrophotometry at 725 nm according to Vitti and Ferreira [34]. The macronutrient (K, Ca and Mg) and micronutrient (Fe and Zn) contents were determined using atomic absorption spectroscopy (Perkin-Elmer 1100B, Uberlingen, Germany) [35].

2.6. Photosynthesis and Photosynthetic Nutrient Use Efficiency

Fully expanded and healthy leaves from the middle third of the plants were selected to determine the net photosynthetic rate (Pn), which was measured using a portable open system infrared gas analyzer (IRGA) (LI-COR 6400, Lincoln, NE, USA). The measurements were taken between 8:00 and 11:00, and the foliar chamber was adjusted for irradiance, CO2 concentration, temperature, and water vapor at approximately 1000 µmol·m−2·s−1, 380 ± 4 µmol·mol−1, 31 ± 1 °C and 21 ± 1 mmol·mol−1, respectively [12]. The photosynthetic rate per unit mass (Pnmass) was obtained from the ratio between Pn and the specific leaf area [(Pn/SLA) * 0.1], and the SLA was calculated as the ratio of the leaf area to the leaf mass using leaf discs with a known area that were dried to a constant weight at 70 °C.
The photosynthetic nutrient use efficiency [P(element)UE] was then calculated as the ratio of photosynthesis to the unit mass and nutrient leaf content [36].

2.7. Data Analysis

The 12 installed treatments involved a combination of 2 main factors (3 species and 4 fertilization treatments). The data were analyzed using two-way ANOVA, and the means were compared using Duncan’s multiple range test, which was performed at a probability level of p < 0.05 using the statistical program STATISTICA 7.0 (StatSoft Inc., Tulsa, OK, USA). The following model was used to test the variables:
Yijk = μ + αi + βj + αβij + γk+ εijk
where Y = the variables tested (e.g., growth, photosynthesis, P(element)UE), μ = overall mean, αi = species factor, βj = fertilization treatment factor, αβij = interaction between factors, γk = block factor, εijk = residual (standard error), and ijk = levels of each factor.

3. Results and Discussion

3.1. Soil Fertility

The P, K, Ca and Mg concentrations in the soil were higher in all of the fertilization treatments than in the non-fertilized treatment, while the N and C concentrations were higher in the treatments that included post-planting organic fertilization (Table 1).
The concentrations of C in the 0–2.5 cm soil layer increased from 6.9 g·kg−1 in the T1 treatment to 15.0 g·kg−1 in T4 (Table 2). The greatest changes in C with the fertilization treatments occurred in the upper soil layers (0–2.5 cm and 2.5–7.5 cm). The T4 treatment had higher soil concentrations of N (0.7 g·kg−1) in the 0–2.5 cm layer compared with the T1 treatment (0.4 g·kg−1).
The T2 treatment led to the highest concentrations of P (442.0 mg·kg−1) in the 0–2.5 cm soil layer as well as in all of the other soil layers (Table 2). The K concentrations in the 0–2.5 cm soil layer increased from 6.3 mg·kg−1 in T1 to 64.0 mg·kg−1 in T4 (Table 2).
Treatments T2 and T4 led to the highest concentrations of Ca in the 0–2.5 and 2.5–7.5 cm soil layers. The T3 treatment led to the highest Ca concentration in the 7.5–20 cm layer (Table 2). The T2 and T4 treatments also resulted in higher concentrations of Mg in the topsoil layers (0–2.5 and 2.5–7.5 cm).

3.2. Plant Growth and Biomass Allocation

Significant effects were observed for species and fertilization treatments for both RGRh and RGRd and for the biomass production of all of the compartments (leaves, stems and roots). Additionally, interactions were observed between the species and fertilization treatments for all variables except LMF (Table 3). Significant effects for biomass allocation were observed for both species and fertilization treatments for the LMF and RMF parameters and the S/R ratio (Table 3).
S. amazonicum had higher RGRh values than the other two species in all of the fertilization treatments except T1. The RGRh values of I. edulis were higher than those of D. odorata in all of the fertilization treatments except T2. The RGRd values of S. amazonicum were higher than those of I. edulis in the T4 treatment, and D. odorata had lower RGRd values than the other two species in all of the fertilization treatments (Figure 2). S. amazonicum and I. edulis had higher RGRh and RGRd values in the T4 treatment, and D. odorata had higher RGRh and RGRd values in the T2 and T4 treatments (Figure 2).
Overall, D. odorata had the lowest absolute growth rates (AGRs) for biomass in all of the compartments in the T1 treatment. In addition, I. edulis produced more biomass than the other two species in the T2, T3 and T4 treatments in all compartments. The AGRleaves values for I. edulis were 19 times higher than those for D. odorata and nine times higher than those for S. amazonicum in the T3 treatment (Table 4). The AGRstems value of I. edulis was 21 times higher than that of D. odorata in the T3 treatment. A comparison of the fertilization treatments showed that the greatest responses of I. edulis and S. amazonicum occurred with the simultaneous application of chemical and organic post-planting fertilizer (T4), and the best AGRleaves responses of D. odorata occurred in the T2 (17.1 g·plant−1·month−1) and T4 (17.0 g·plant−1·month−1) treatments (Table 4).
The fertilization treatments resulted in AGRleaves values of I. edulis that were 72 times higher in the T4 treatment (225.0 g·plant−1·month−1) than in the T1 treatment (3.1 g·plant−1·month−1) (Table 4). The AGRleaves values of D. odorata were nearly 29 times higher in the T2 treatment (17.1 g·plant−1·month−1) than in the T1 treatment (0.6 g·plant−1·month−1). However, the values in the same compartment for S. amazonicum were nearly 21 times higher in response to the T4 treatment compared with the T1 treatment.
In terms of biomass allocation, D. odorata produced more leaves in most of the fertilization treatments, S. amazonicum produced more woody material than leaves, and I. edulis produced more woody material and roots in all of the fertilization treatments (Table 5). D. odorata and I. edulis exhibited the same behavior, with more biomass allocated to root production in the unfertilized control (Table 5).

3.3. Leaf Nutrient Content

Species had a significant effect on the foliar nutrient content under the different fertilization treatments, and fertilization had a significant effect on the foliar N, K, Ca and Zn contents. Interactions were also observed between the species and fertilization treatments with respect to the N, K, Ca and Zn nutrient contents (Table 3).
The N content of the leaves was higher in I. edulis than in the other two species in all of the fertilization treatments. The T2 treatment promoted higher N contents in the leaves of D. odorata and S. amazonicum. Furthermore, D. odorata had a lower P content in the leaves than the other species, and S. amazonicum had a higher P content in the T4 treatment (Figure 3).
D. odorata generally had higher foliar K contents in all of the fertilization treatments, and I. edulis had higher foliar Ca contents compared with D. odorata in all of the fertilization treatments and compared with S. amazonicum in the T1 and T3 treatments (Figure 3). Higher Ca contents were observed for I. edulis in treatments T4 and T3 and for S. amazonicum in treatment T4. The foliar Mg contents were higher in I. edulis and S. amazonicum than in D. odorata in all of the fertilization treatments.

3.4. Photosynthesis and Photosynthetic Nutrient Use Efficiency

Significant differences in the net photosynthetic rate (Pnmass) and the photosynthetic nutrient use efficiency [P(element)UE] were observed between the species. Except for N and Fe, no significant effects for the fertilization treatment factor were generally observed for the nutrient use efficiencies. No interactions between the factors were found except for PCaUE and PFeUE (Table 3).
Both I. edulis and S. amazonicum had higher net photosynthetic rates (Pnmass) compared with D. odorata in all of the fertilization treatments. S. amazonicum exhibited higher PNUE values than the other two species. Differences in the PPUE values between species were only observed in the T2 treatment, where the values for S. amazonicum were higher than those for D. odorata (Figure 4). Significant differences in PCaUE between the species were found in the T3 treatment, where the D. odorata value was higher than that of the other two species. D. odorata had a higher PFeUE value in the T3 treatment (Figure 4). In addition, I. edulis had a higher PZnUE value compared with the other two species in all of the fertilization treatments.

4. Discussion

One of the main reasons for the higher absolute growth rates in the biomass under the post-planting organic fertilization treatments (AGRstems was 51 times higher in I. edulis and 10 times higher in S. amazonicum in the T4 treatment compared to T1) involves changes in the soil C concentrations and consequently the soil organic matter (SOM). Numerous benefits of a higher SOM content may result in increased biomass production, including additional water; higher exchangeable K, Ca, and Mg holding capacities; and improved soil physical conditions [22,37,38]. In addition, the highest N concentrations in the soil were primarily found in the post-planting organic fertilization treatments that favored biomass production [39]. Recent studies with similar fertilization treatments (secondary forest biomass application without incorporation) have conferred benefits to other native Amazonian species, such as the Brazil nut (Bertholletia excelsa), which had an AGRh that was 12 times higher under organic fertilization compared with the unfertilized control [40].
It appears that the functional (ecological) groups of the species are a determinant trait for biomass production. Early successional species such as I. edulis have higher C assimilation and photosynthetic rates and can thus exhibit higher AGRs, especially in the early stages of development [24]. This can be reversed as the plantation matures and the mid- and late-successional species produce more biomass, especially in the stem compartment. As expected, I. edulis, as an early successional species, showed higher photosynthetic rates and greater biomass production with a more rapid response to the fertilization treatments than S. amazonicum and D. odorata, which are associated with later stages of succession [41,42]. Furthermore, I. edulis has developed the ability to fix atmospheric nitrogen through symbiosis, which can be an advantageous strategy for obtaining a higher foliar nitrogen content, resulting in the higher biomass production of this species.
The choice of early successional species can result in high biomass production and therefore enhance the C stock in the litter and soil. In addition, mixing species of later successional stages can guarantee long-term C stocks in both biomass and soil [43]. This is one of the reasons why it is desirable to mix species from different functional groups, unless the main goal is to produce large amounts of biomass, for which pioneer and early successional species are better suited. In addition, choosing N2-fixing species such as I. edulis is an appropriate means to restore the soil N and C content in highly degraded areas, which is directly related to the success of forest restoration [44,45]. The rapid recovery of other nutrients, especially K, P, Ca and Mg, by mixing different species, is fundamental to provide conditions for natural regeneration in degraded areas [46].
In general, the growth rates of the species in our study are comparable to the results of previous studies on the same species [1,25,26,47,48]. Joslin et al. [18] found that fertilization treatments enhanced the height growth of both S. amazonicum and I. edulis. In addition, a slash-and-mulch treatment performed with I. edulis pruning increased the growth of S. amazonicum and manioc [18]. Monteiro, et al. [49] observed an increase in the diameter at breast height of S. amazonicum due to the application of forestry residues. Chemical fertilization had positive effects on the height and biomass production of S. amazonicum seedlings [50,51].
According to Poorter et al. [33], plants allocate more dry mass to roots if the limiting factor is below ground. The functional aspect of this response is that it can favor plant growth by improving the uptake of the most limiting factor [52]. Changes in allocation in response to nutrient limitations are the strongest of all allocation responses [33]. However, broad responses in dry mass allocation are generally modest or even absent [53,54]. In this study, both D. odorata and I. edulis allocated more biomass to root production under the unfertilized control conditions, which indicated the nutritional limitations of the site.
The improved availability of soil nutrients, such as N, P, K, Ca and Mg, can improve photosynthetic performance, provide greater carbon fixation, and consequently increase biomass production and growth [12,39,55]. The highest photosynthetic rates (Figure 4) and the best nutrient use efficiencies of certain elements (N, K, Fe and Zn) reflected the higher growth and biomass production of the species under both chemical and organic post-planting fertilization treatments. In contrast, poor performances of the three species can occur under unfertilized conditions because the excess production of reactive oxygen species under physiological stress conditions (high irradiance and temperature combined with low soil fertility and periods of drought) during photosynthesis can seriously damage cells, which results in a sharp decrease in biomass production, especially in degraded areas [31,56,57]. The higher soil K and Ca contents in the fertilization treatments can help minimize these effects because both nutrients function as metabolic regulators and can trigger many physiological responses to stress factors [56].
In addition, greater root biomass production and higher photosynthetic rates and nutrient use efficiencies of species can contribute to improved use of available resources and can enhance plant growth [13,24]. The type of species appeared to influence the nutrient use efficiency, and the fertilization treatments did not affect most elements (P, K, Ca, Mg and Zn). Species with higher nutrient use efficiencies should be chosen for soils with low natural fertility, as these species may be better adapted to these soils [58].
The restoration of tropical forests is gaining attention in the scientific community because of the impact these ecosystems have on the global C cycle and the maintenance of global biodiversity [43,59,60,61]. For this reason, the restoration of forest plantations that can provide both services (C stocks) and goods (stem production) in degraded areas in Amazonia is desirable for the local community [1,4,6,62].

5. Conclusions

The native Amazonian leguminous tree species developed different reestablishment strategies when they grew under different soil fertility conditions in degraded areas. Higher photosynthetic performance and nutrient use efficiency were caused by changes in the soil fertility and physical conditions under the fertilization treatments, resulting in higher carbon assimilation rates and greater growth in terms of height, diameter and biomass production. I. edulis and S. amazonicum responded better in the T4 fertilization treatment, while D. odorata had the highest biomass production in the T2 and T4 treatments. The three species exhibited considerable growth in highly degraded areas. The main factors determining the growth of the individuals were the functional groups of the species and the low natural fertility of the area; consequently, appropriate fertilization treatments and the mixing of different functional groups are fundamental for the early establishment of species. Finally, the results indicate that species selection and ecofunctional traits enhanced by fertilization may play a key role in the success of forest restoration in Amazonia.

Acknowledgments

The authors thank the National Institute of Amazonian Research (MCTI-INPA) for logistical support, the Balbina hydroelectric dam for donating the experimental area, the staff of the Balbina hydroelectric dam for providing assistance, and CAPES and CNPq for fellowships and funding for this research. J.F.C. Gonçalves is a researcher with the Brazilian Council for Research and Development (CNPq). American Journal Experts (AJE) for revising the English manuscript.

Author Contributions

José Francisco de C. Gonçalves and João Baptista S. Ferraz conceived and designed the experiments; Roberto K. Jaquetti performed the experiments; Roberto K. Jaquetti and José Francisco C. Gonçalves analyzed the data; José Francisco C. Gonçalves and João Baptista S. Ferraz contributed reagents/materials/analysis tools; and Roberto K. Jaquetti, José Francisco C. Gonçalves, Marciel, J. Ferreira and Ulysses M. dos Santos Junior wrote the paper.

Conflicts of Interest

The authors declare no conflicts of interest.

References

  1. Souza, C.R.; de Azevedo, C.P.; Lima, R.M.; Rossi, L.M.B. Comportamento de espécies florestais Em plantios a pleno Sol e Em faixas de enriquecimento de Capoeira na Amazônia. Acta Amazonica 2010, 40, 127–134. [Google Scholar] [CrossRef]
  2. Davidson, E.A.; Araújo, A.C.; Artaxo, P.; Balch, J.K.; Brown, I.F.; Bustamante, M.M.; Coe, M.T.; DeFries, R.S.; Keller, M.; Longo, M.; et al. The Amazon basin in transition. Nature 2012, 481, 321–328. [Google Scholar] [CrossRef] [PubMed]
  3. Instituto Nacional de Pesquisas Espaciais—INPE. PROJETO PRODES. Available online: http://www.obt.inpe.br/prodes/index.php (accessed on 22 March 2015).
  4. Lamb, D.; Erskine, P.D.; Parrotta, J.A. Restoration of degraded tropical forest Landscapes. Science 2005, 310, 1628–1632. [Google Scholar] [CrossRef] [PubMed]
  5. Kelty, M.J. The role of species mixtures in Plantation Forestry. For. Ecol. Manag. 2006, 233, 195–204. [Google Scholar] [CrossRef]
  6. Lamb, D. Forest restoration—The third big Silvicultural Challenge. J. Trop. For. Sci. 2012, 24, 295–299. [Google Scholar]
  7. Van Haren, J.; de Oliveira, R.C.; Beldini, P.T.; de Camargo, P.B.; Keller, M.; Saleska, S. Tree species effects on soil Properties and Greenhouse Gas Fluxes in East-Central Amazonia: Comparison between Monoculture and Diverse Forest. Biotropica 2013, 45, 709–718. [Google Scholar] [CrossRef]
  8. Lima, T.A.; Vieira, G. High plant species richness in Monospecific Tree Plantations in the Central Amazon. For. Ecol. Manag. 2013, 295, 77–86. [Google Scholar] [CrossRef]
  9. Marenco, R.A.; Gonçalves, J.F.C.; Vieira, G. Photosynthesis and leaf nutrient contents in Ochroma Pyramidale. Photosynthetica 2001, 39, 539–543. [Google Scholar] [CrossRef]
  10. Gonçalves, J.F.C.; Santos Junior, U.M. Utilization of the chlorophyll a fluorescence technique as a Tool for Selecting Tolerant Species to Environments of High Irradiance. Braz. J. Plant Physiol. 2005, 17, 307–313. [Google Scholar] [CrossRef]
  11. Santos Junior, U.M.; Gonçalves, J.F.C.; Feldpausch, T.R. Growth, leaf nutrient concentration and Photosynthetic Nutrient Use Efficiency in Tropical Tree Species Planted in Degraded Areas in Central Amazonia. For. Ecol. Manag. 2006, 226, 299–309. [Google Scholar] [CrossRef]
  12. Quesada, C.A.; Phillips, O.L.; Schwarz, M.; Czimczik, C.I.; Baker, T.R.; Patiño, S.; Fyllas, N.M.; Hodnett, M.G.; Herrera, R.; Almeida, S.; et al. Basin-wide variations in Amazon Forest Structure and Function Are Mediated by Both Soils and Climate. Biogeosciences 2012, 9, 2203–2246. [Google Scholar] [CrossRef] [Green Version]
  13. Fageria, N.K.; Baligar, V.C.; Li, Y.C. The role of nutrient efficient plants in Improving Crop Yields in the Twenty First Century. J. Plant Nutr. 2008, 31, 1121–1157. [Google Scholar] [CrossRef]
  14. Denich, M.; Vlek, P.; Deabreusa, T.; Vielhauer, K.; Lucke, W. A concept for the development of fire-free Fallow Management in the Eastern Amazon, Brazil. Agric. Ecosyst. Environ. 2005, 110, 43–58. [Google Scholar] [CrossRef]
  15. Siddique, I.; Engel, V.L.; Parrotta, J.A.; Lamb, D.; Nardoto, G.B.; Ometto, J.P.; Martinelli, L.A.; Schmidt, S. Dominance of legume trees alters nutrient Relations in Mixed Species Forest Restoration Plantings within Seven Years. Biogeochemistry 2008, 88, 89–101. [Google Scholar] [CrossRef]
  16. De Faria, S.M.; Diedhiou, A.G.; de Lima, H.C.; Ribeiro, R.D.; Galiana, A.; Castilho, A.F.; Henriques, J.C. Evaluating the nodulation status of leguminous species from the Amazonian Forest of Brazil. J. Exp. Bot. 2010, 61, 3119–3127. [Google Scholar] [CrossRef] [PubMed]
  17. Brienza Junior, J.S.; Oliveira, R.P.; Denich, M.; Vlek, P.L.G. Plantio de Árvores de Crescimento Rápido para Recuperação de Áreas Agrícolas na Amazônia Oriental Brasileira: Estudo de Caso Com Produção de Milho e Mandioca. Braz. J. For. Res. 2011, 31, 347–353. [Google Scholar] [CrossRef]
  18. Joslin, A.H.; Markewitz, D.; Morris, L.A.; DeAssis Oliveira, F.; Figueiredo, R.O.; Kato, O.R. Five native tree species and Manioc under Slash-And-Mulch Agroforestry in the Eastern Amazon of Brazil: Plant Growth and Soil Responses. Agrofor. Syst. 2011, 81, 1–14. [Google Scholar] [CrossRef]
  19. Franco, A.A.; de Faria, S.M. The contribution of n2-fixing tree Legumes to Land Reclamation and Sustainability in the Tropics. Soil Biol. Biochem. 1997, 29, 897–903. [Google Scholar] [CrossRef]
  20. Sprent, J.I.; Parsons, R. Nitrogen fixation in legume and Non-Legume Trees. Field Crops Res. 2000, 65, 183–196. [Google Scholar] [CrossRef]
  21. Forrester, D.I.; Bauhus, J.; Cowie, A.L.; Mitchell, P.A.; Brockwell, J. Productivity of three young Mixed-Species Plantations Containing N2-Fixing Acacia and Non-N2-Fixing Eucalyptus And Pinus Trees in Southeastern Australia. For. Sci. 2007, 53, 426–434. [Google Scholar]
  22. Baligar, V.C.; Fageria, N.K.; He, Z.L. Nutrient use efficiency in plants. Commun. Soil Sci. Plant Anal. 2001, 32, 921–950. [Google Scholar] [CrossRef]
  23. Nichols, J.D.; Carpenter, F.L. Interplanting Inga Edulis yields nitrogen benefits to Terminalia Amazonia. For. Ecol. Manag. 2006, 233, 344–351. [Google Scholar] [CrossRef]
  24. Jaquetti, R.K.; Gonçalves, J.F.C.; Ferraz, J.B.S.; Ferreira, M.J.; Santos Junior, U.M.; Lacerda, C.F. Green fertilization enhances the photosynthetic performance and the Growth of Leguminous Trees for Restoration Plantation in Central Amazon. Am. J. Plant Sci. 2014, 5, 2497–2508. [Google Scholar] [CrossRef]
  25. Silva, A.K.L.; Vasconcelos, S.S.; de Carvalho, C.J.R.; Cordeiro, I.M.C.C. Litter dynamics and fine root Production in Schizolobium Parahyba Var. Amazonicum Plantations and Regrowth Forest in Eastern Amazon. Plant Soil 2011, 347, 377–386. [Google Scholar]
  26. Siviero, M.A.; Motta, A.M.; dos Lima, D.S.; Birolli, R.R.; Huh, S.Y.; Santinoni, I.A.; Murate, L.S.; de Castro, C.M.A.; Miyauchi, M.Y.H.; Zangaro, W.; et al. Interaction among N-fixing bacteria and am fungi in Amazonian Legume Tree (Schizolobium Amazonicum) in Field Conditions. Appl. Soil Ecol. 2008, 39, 144–152. [Google Scholar] [CrossRef]
  27. Bremner, J.M. Nitrogen-Total. In Methods of Soil Analysis, Part 3: Chemical Methods; Soil Science Society of America and American Society of Agronomy: Madison, WI, USA, 1996; pp. 1085–1121. [Google Scholar]
  28. Miyazawa, M.; Pavan, M.A.; Muraoka, T.; Carmo, F.S.; Mello, W.J. Análise química de tecidos vegetais. In Manual de Análise Química de Solos, Plantas e Fertilizantes; Silva, F.C., Ed.; EMBRAPA: Brasília, Brazil, 2009. [Google Scholar]
  29. Murphy, J.; Riley, J.P. A modified single solution reagent for the Determination of Phosphate in Natural Waters. Anal. Chim. Acta 1962, 27, 31–36. [Google Scholar] [CrossRef]
  30. Hunt, R. Basic Growth Analysis; Edward Arnold: London, UK, 1990; p. 112. [Google Scholar]
  31. Zhao, D.; Oosterhuis, D.M.; Bednarz, C.W. Influence of potassium deficiency on Photosynthesis, Chlorophyll Content, and Chloroplast Ultrastructure of Cotton Plants. Photosynthetica 2001, 39, 103–109. [Google Scholar] [CrossRef]
  32. Schroth, G.; D’Angelo, S.A.; Teixeira, W.G.; Haag, D.; Lieberei, R. Conversion of secondary Forest into Agroforestry and Monoculture Plantations in Amazonia: Consequences for Biomass, Litter and Soil Carbon Stocks after 7 Years. For. Ecol. Manag. 2002, 163, 131–150. [Google Scholar] [CrossRef]
  33. Poorter, H.; Niklas, K.J.; Reich, P.B.; Oleksyn, J.; Poot, P.; Mommer, L. Biomass allocation to Leaves, Stems and Roots: Meta-Analyses of Interspecific Variation and Environmental Control. New Phytol. 2012, 193, 30–50. [Google Scholar] [CrossRef] [PubMed]
  34. Vitti, G.C.; Ferreira, A.C. Síntese de Análises Químicas em Tecido Vegetal; Escola Superior de Agricultura Luiz de Queiroz: Piracicaba, Brazil, 1997. [Google Scholar]
  35. EMBRAPA. Manual de Análises Químicas de Solos, Plantas e Fertilizantes; EMBRAPA: Brasília, Brazil, 2009; p. 370. [Google Scholar]
  36. Santos Junior, U.M.; Gonçalves, J.F.C.; Fearnside, P.M. Measuring the impact of Flooding on Amazonian Trees: Photosynthetic Response Models for Ten Species Flooded by Hydroelectric Dams. Trees 2013, 27, 193–210. [Google Scholar] [CrossRef]
  37. Shepherd, M.A.; Harrison, R.; Webb, J. Managing soil Organic Matter—Implications for Soil Structure on Organic Farms. Soil Use Manag. 2002, 18, 284–292. [Google Scholar] [CrossRef]
  38. Lal, R. Challenges and opportunities in Soil Organic Matter Research. Eur. J. Soil Sci. 2009, 60, 158–169. [Google Scholar] [CrossRef]
  39. Maathuis, F.J. Physiological Functions of Mineral Macronutrients. Curr. Opin. Plant Biol. 2009, 12, 250–258. [Google Scholar] [CrossRef] [PubMed]
  40. Ferreira, M.J.; Gonçalves, J.F.C.; Ferraz, J.B.S. Crescimento e Eficiência do Uso da Água de Plantas Jovens de castanheira-da-amazônia em Área Degradada e Submetidas à Adubação. Ciênc. Florest. 2012, 22, 393–401. [Google Scholar] [CrossRef]
  41. Lawrence, D. The Response of Tropical Tree Seedlings to Nutrient Supply: Meta-Analysis for Understanding a Changing Tropical Landscape. J. Trop. Ecol. 2003, 19, 239–250. [Google Scholar] [CrossRef]
  42. Resende, A.V.; Furtini Neto, A.E.; Curi, N. Mineral Nutrition and Fertilization of Native Tree Species in Brazil: Research Progress and Suggestions for Management. J. Sustain. For. 2005, 20, 45–81. [Google Scholar] [CrossRef]
  43. Rodrigues, R.R.; Lima, R.A.F.; Gandolfi, S.; Nave, A.G. On the Restoration of High Diversity Forests: 30 Years of Experience in the Brazilian Atlantic Forest. Biol. Conserv. 2009, 142, 1242–1251. [Google Scholar] [CrossRef]
  44. Hobbs, R.J.; Harris, J.A. Restoration Ecology: Repairing the Earth’s Ecosystems in the New Millennium. Restor. Ecol. 2001, 9, 239–246. [Google Scholar] [CrossRef]
  45. Viana, R.M.; Ferraz, J.B.S.; Neves, A.F.; Vieira, G.; Pereira, B.F.F. Soil Quality Indicators for Different Restoration Stages on Amazon Rainforest. Soil Tillage Res. 2014, 140, 1–7. [Google Scholar] [CrossRef]
  46. Feldpausch, T.R.; Rondon, M.A.; Fernandes, E.C.M.; Riha, S.J.; Wandelli, E. Carbon and Nutrient Accumulation in Secondary Forests Regenerating on Pastures in Central Amazonia. Ecol. Appl. 2004, 14, S164–S176. [Google Scholar] [CrossRef] [Green Version]
  47. Lojka, B.; Preininger, D.; van Damme, P.; Rollo, A.; Banout, J. Use of the Amazonian Tree Species Inga Edulis for Soil Regeneration and Weed Control. J. Trop. For. Sci. 2012, 24, 89–101. [Google Scholar]
  48. Gama, B.; Rocha, R.B.; Salman, A.K.D.; Mendes, Â.M.; Figueiró, M.R. Reforestation Feasibility in Area Formerly Used for Cattle Rasing in the State of Rondônia, Northwest Brazilian Amazon. Rev. Árvore 2013, 37, 1001–1010. [Google Scholar] [CrossRef]
  49. Monteiro, K.F.G.; Kern, D.C.; Ruivo, M.L.P.; Rodrigues, T.E.; Cometti, J.L.S. Uso de Resíduos de Madeira Como Alternativa de Melhorar as Condições Ambientais em Sistema de Reflorestamento. Acta Amazonica 2010, 40, 409–414. [Google Scholar]
  50. Marques, T.C.; Carvalho, J.G.; Lacerda, M.P.C.; Mota, P.E.F. Initial Growthing of Paricá (Schizolobium Amazonicum) under Nutrient Omission and Sodium in Nutritive Solution. Cerne 2004, 10, 184–195. [Google Scholar]
  51. Caione, G.; Lange, A.; Schoninger, E.L. Growth of Seedlings Schizolobium Amazonicum (Huber Ex Ducke) on Substrate Fertilized with Nitrogen, Phosphorus and Potassium. Sci. For. 2012, 40, 213–221. [Google Scholar]
  52. Chen, Y.; Liu, Z.; Rao, X.; Wang, X.; Liang, C.; Lin, Y.; Zhou, L.; Cai, X.; Fu, S. Carbon Storage and Allocation Pattern in Plant Biomass among Different Forest Plantation Stands in Guangdong, China. Forests 2015, 6, 794–808. [Google Scholar] [CrossRef]
  53. Poorter, H.; Nagel, O. The Role of Dry Mass Allocation in the Growth Response of Plants to Different Levels of Light, CO2, Nutrients and Water: A Quantitative Review. Aust. J. Plant Physiol. 2000, 27, 595–607. [Google Scholar] [CrossRef]
  54. Cheng, X.; Yu, M.; Wang, G.G.; Wu, T.; Zhang, C. Growth, Morphology and Biomass Allocation in Response to Light Gradient in Five Subtropical Evergreen Broadleaved Tree Seedlings. J. Trop. For. Sci. 2013, 25, 537–546. [Google Scholar]
  55. Ferreira, M.J.; Gonçalves, J.F.C.; Ferraz, J.B.S. Photosynthetic Parameters of Young Brazil Nut (Bertholletia Excelsa H.B.) Plants Subjected to Fertilization in a Degraded Area in Central Amazonia. Photosynthetica 2009, 47, 616–620. [Google Scholar] [CrossRef]
  56. Cakmak, I. The Role of Potassium in Alleviating Detrimental Effects of Abiotic Stresses in Plants. J. Plant Nutr. Soil Sci. 2005, 168, 521–530. [Google Scholar] [CrossRef]
  57. Ashraf, M.; Harris, P.J.C. Photosynthesis under Stressful Environments: An Overview. Photosynthetica 2013, 51, 163–190. [Google Scholar] [CrossRef]
  58. Silva, C.E.M.; Gonçalves, J.F.C.; Feldpausch, T.R.; Luizão, F.J.; Morais, R.R.; Ribeiro, G.O. Eficiência no Uso dos Nutrientes Por Espécies Pioneiras Crescidas em Pastagens Degradadas na Amazônia Central. Acta Amazonica 2006, 36, 503–512. [Google Scholar] [CrossRef]
  59. Gibbs, H.K.; Brown, S.; Niles, J.O.; Foley, J.A. Monitoring and Estimating Tropical Forest Carbon Stocks: Making REDD a Reality. Environ. Res. Lett. 2007, 2, 1–13. [Google Scholar] [CrossRef]
  60. Wortley, L.; Hero, J.; Howes, M. Evaluating Ecological Restoration Success: A Review of the Literature. Restor. Ecol. 2013, 21, 537–543. [Google Scholar] [CrossRef]
  61. Guariguata, M.; Brancalion, P. Current Challenges and Perspectives for Governing Forest Restoration. Forests 2014, 5, 3022–3030. [Google Scholar] [CrossRef]
  62. Bullock, J.M.; Aronson, J.; Newton, A.C.; Pywell, R.F.; Rey-Benayas, J.M. Restoration of Ecosystem Services and Biodiversity: Conflicts and Opportunities. Trends Ecol. Evol. 2011, 26, 541–549. [Google Scholar] [CrossRef] [PubMed]
Figure 1. Design of each block (12 m × 12 m) with four fertilization treatments. T1 = no fertilization, T2 = post-planting chemical fertilization, T3 = post-planting organic fertilization and T4 = combined chemical and organic post-planting fertilization. The three species include the following: ■, D. odorata; □, I. edulis and ○, S. amazonicum.
Forests 07 00076 g001
Figure 2. Relative growth rates of the (A) height (RGRheight) and (B) diameter (RGRdiameter) of the three leguminous trees in all of the fertilization treatments 11 months after planting. T1 = no fertilization, T2 = post-planting chemical fertilization, T3 = post-planting organic fertilization and T4 = combined chemical and organic post-planting fertilization. Mean of six samples (±SD); mean values followed by the same letters did not differ between the treatments at p ≤ 0.05 based on Duncan’s test. Uppercase letters compare the three species within the same fertilization treatment, and lowercase letters compare different fertilization treatments for each species.
Forests 07 00076 g002
Figure 3. (A) Leaf nitrogen (N); (B) phosphorus (P); (C) potassium (K); (D) calcium (Ca); (E) magnesium (Mg); (F) iron (Fe) and (G) zinc (Zn) contents in all of the treatments. Mean of six samples (±SD); mean values followed by the same letters did not differ between the treatments at p ≤ 0.05 based on Duncan’s test. Uppercase letters compare the three species within the same fertilization treatment, and lowercase letters compare different fertilization treatments for each species.
Forests 07 00076 g003aForests 07 00076 g003b
Figure 4. Net photosynthetic rate per unit mass (Pnmass) (A) and the photosynthetic nutrient use efficiencies for (B) nitrogen (PNUE); (C) phosphorus (PPUE); (D) potassium (PKUE); (E) calcium (PCaUE); (F) magnesium (PMgUE); (G) iron (PFeUE) and (H) zinc (PZnUE) in all of the treatments. Mean of six samples (±SD); mean values followed by the same letters did not differ between the treatments at p ≤ 0.05 based on Duncan’s test. Uppercase letters compare the three species within the same fertilization treatment, and lowercase letters compare different fertilization treatments for each species.
Forests 07 00076 g004
Table 1. ANOVA results (F values) (n = 6) of nutrients in the soil after the application of the fertilization treatments. Parameters: carbon (C), soil organic matter (SOM), nitrogen (N), phosphorus (P), potassium (K), calcium (Ca) and magnesium (Mg).
ParameterFertilizationDepthD.F. Fert.D.F. Depth
C23.4 **11.8 **33
SOM23.4 **11.8 **33
N18.8 **18.9 **33
P49.1 **22.2 **33
K68.0 **5.9 **33
Ca36.3 **32.3 **33
Mg79.0 **85.1 **33
** Significant effect at the p < 0.01 level; D.F. degrees of freedom.
Table 2. Concentrations of macronutrients (C, N, P, K, Ca and Mg) and soil organic matter (SOM) in the soil of a forest plantation with leguminous trees in a degraded area near the Balbina hydroelectric dam, Amazonas State, Brazil, after the application of the fertilization treatments.
Depth (cm)FertilizationParameter
CSOMNPKCaMg
(g·kg−1)(mg·kg−1)(cmol·kg−1)
0–2.5T16.9 ± 1.3 Ba11.9 ± 2.2 Ba0.4 ± 0.1 Ba0.2 ± 0.1 Da6.3 ± 1.1 Ba0.2 ± 0.1 Ca0.2 ± 0.1 Ca
2.5–7.56.8 ± 1.4 Ba11.7 ± 2.4 Ba0.4 ± 0.1 Ca0.2 ± 0.1 Ca6.2 ± 0.9 Ca0.1 ± 0.0 Ca0.1 ± 0.0 Ca
7.5–206.7 ± 1.1 Aa11.5 ± 1.8 Aa0.3 ± 0.1 Aa0.2 ± 0.1 Ca5.5 ± 1.6 Ca0.1 ± 0.1 Ca0.1 ± 0.0 Ba
20–406.4 ± 1.0 Ba11.1 ± 1.9 Ba0.3 ± 0.1 Aa0.1 ± 0.1 Ba4.9 ± 1.6 Ca0.1 ± 0.0 Ba0.1 ± 0.1 Ca
0–2.5T27.5 ± 1.8 Ba13.0 ± 3.2 Ba0.4 ± 0.1 Ba442.0 ± 129.0 Aa60.0 ± 15.6 Aa2.2 ± 0.8 Aa0.7 ± 0.1 Aa
2.5–7.57.3 ± 1.6 Ba12.5 ± 2.8 Ba0.4 ± 0.1 BCa99.2 ± 55.0 Ab63.7 ± 21.6 Aa1.1 ± 0.2 Ab0.4 ± 0.1 Ab
7.5–207.3 ± 1.7 Aa12.5 ± 2.9 Aa0.4 ± 0.1 Aa114.5 ± 102.5 Ab62.2 ± 14.6 Aa0.7 ± 0.3 Ab0.4 ± 0.1 Ab
20–407.0 ± 1.2 Ba12.0 ± 2.1 Ba0.4 ± 0.1 Aa69.9 ± 57.4 Ab62.2 ± 18.9 Aa0.7 ± 0.3 Ab0.4 ± 0.1 Ab
0–2.5T312.4 ± 3.0 Aa21.3 ± 5.1 Aa0.7 ± 0.1 Aa13.0 ± 7.2 Ca53.3 ± 14.6 Aa1.1 ± 0.1 Ba0.5 ± 0.1 Ba
2.5–7.511.1 ± 2.6 Aa19.0 ± 4.5 Aa0.5 ± 0.1 Ab13.1 ± 13.0 Ba32.3 ± 9.0 Bb0.7 ± 0.3 Ba0.2 ± 0.1 Bb
7.5–207.8 ± 1.8 Ab13.3 ± 3.0 Ab0.4 ± 0.1 Ac18.4 ± 11.3 Ba23.1 ± 8.6 Bb0.9 ± 0.3 Aa0.1 ± 0.0 Bb
20–407.3 ± 0.9 Bb12.6 ± 1.6 Bb0.4 ± 0.1 Ac7.5 ± 6.2 Aa20.4 ± 14.6 BCb0.7 ± 0.4 Aa0.1 ± 0.0 BCb
0–2.5T415.0 ± 2.1 Aa25.9 ± 3.7 Aa0.7 ± 0.1 Aa124.6 ± 55.1 Ba64.0 ± 17.1 Aa2.5 ± 0.8 Aa0.9 ± 0.2 Aa
2.5–7.510.4 ± 2.2 Ab17.9 ± 3.9 Ab0.5 ± 0.1 ABb93.1 ± 86.4 Aa45.0 ± 15.3 ABb0.9 ± 0.4 ABb0.4 ± 0.1 Ab
7.5–209.1 ± 2.2 Ab15.6 ± 3.8 Ab0.4 ± 0.1 Abc10.5 ± 7.2 Bb32.6 ± 8.8 Bb0.6 ± 0.2 Ab0.1 ± 0.1 Bc
20–408.9 ± 1.4 Ab15.2 ± 2.3 Ab0.4 ± 0.1 Ac10.4 ± 9.8 Ab37.9 ± 13.3 Bb0.6 ± 0.2 Ab0.2 ± 0.0 Bc
Mean of six samples (±SD); mean values followed by the same letters did not differ between the treatments at p ≤ 0.05 based on Duncan’s test. Within the columns, uppercase letters compare the four fertilization treatments at the same depth, and lowercase letters compare different depths for each fertilization treatment.
Table 3. ANOVA results (F values) (n = 6) for the species and fertilization treatment factors and the interactions between the factors (Sp. X Fert.). Parameters: relative growth rates of height (RGRh) and diameter (RGRd); absolute growth rates of leaf biomass (AGRleaves), stem biomass (AGRstems), and root biomass (AGRroots); leaf mass fraction (LMF); stem mass fraction (SMF); root mass fraction (RMF); shoot/root ratio (S/R ratio); foliar nutrient contents of nitrogen (N), phosphorus (P), potassium (K), calcium (Ca), magnesium (Mg), iron (Fe) and zinc (Zn); net photosynthetic rate (Pnmass); and the photosynthetic nutrient use efficiencies of N (PNUE), P (PPUE), K (PKUE), Ca (PCaUE), Mg (PMgUE), Fe (PFeUE) and Zn (PZnUE).
ParameterFertilizationSpeciesSp. X Fert.BlockD.F. Fert.D.F. Sp.
RGRheight72.7 **127.2 **3.0 *2.0 ns32
RGRdiameter85.9 **212.9 **6.0 **1.6 ns32
AGRleaves88.0 **109.9 **38.3 **0.5 ns32
AGRstems52.5 **67.6 **23.3 **0.3 ns32
AGRroots113.1 **222.9 **57.2 **0.2 ns32
LMF19.0 **14.5 **2.0 ns1.2 ns32
SMF1.1 ns6.6 **2.7 *0.4 ns32
RMF8.7 **14.7 **4.0 **0.3 ns32
Shoot/Root ratio9.6 **15.8 **4.9 **0.7 ns32
N21.5 **96.0 **2.7**1.8 ns32
P0.2 ns6.6 **0.7 ns0.9 ns32
K6.3 **26.5 **3.0 **1.7 ns32
Ca5.0 **42.8 **3.2 **2.3 ns32
Mg1.1 ns41.6 **0.8 ns2.4 *32
Fe1.2 ns47.2 **0.5 ns4.2 **32
Zn4.4 **22.7 **2.7 *1.7 ns32
Pnmass1.9 ns31.2 **0.8 ns1.2 ns32
PNUE3.4 **33.6 **1.0 ns0.7 ns32
PPUE1.3 ns3.5 *0.9 ns0.7 ns32
PKUE2.2 ns24.2 **1.3 ns0.9 ns32
PCaUE1.4 ns9.4 **3.2 **0.7 ns32
PMgUE0.7 ns2.0 ns0.2 ns2.8 *32
PFeUE2.9 *18.9 **2.6 *1.6 ns32
PZnUE0.9 ns46.7 **0.9 ns2.8 *32
* Significant effect at the p < 0.05 level; ** Significant effect at the p < 0.01 level; ns = not significant; D.F. degrees of freedom.
Table 4. Absolute growth rates of leaf biomass (AGRleaves), stem biomass (AGRstems) and root biomass (AGRroots) of three leguminous trees in all of the fertilization treatments 11 months after planting. T1 = no fertilization, T2 = post-planting chemical fertilization, T3 = post-planting organic fertilization, and T4 = combined chemical and organic post-planting fertilization.
FertilizationSpeciesVariables
AGRleavesAGRstemsAGRroots
(g·plant−1·month−1)
T1D. odorata0.59 ± 0.3 Bb0.57 ± 0.1 Bb0.66 ± 0.3 Bb
I. edulis3.12 ± 1.8 Ac4.95 ± 2.2 Ac5.70 ± 2.9 Ac
S. amazonicum2.59 ± 1.0 Ac6.17 ± 3.3 Ac3.97. ± 2.9 Ac
T2D. odorata17.10 ± 5.1 Ba15.15 ± 5.3 Ba8.74 ± 1.5 Ba
I. edulis104.71 ± 20.1 Ab116.33 ± 31.1 Ab131.78 ± 30.8 Ab
S. amazonicum15.82 ± 6.7 Bb16.92 ± 8.7 Bb8.54 ± 4.9 Bbc
T3D. odorata6.95 ± 2.5 Bb6.47 ± 2.7 Bb3.10 ± 1.2 Bb
I. edulis134.19 ± 61.2 Ab139.61 ± 34.1 Ab118.42 ± 39.4 Ab
S. amazonicum14.76 ± 6.8 Bb24.12 ± 15.5 Bb19.12 ± 10.9 Bb
T4D. odorata16.97 ± 4.8 Ba15.37 ± 4.4 Ba7.63 ± 3.3 Ca
I. edulis224.98 ± 54.1 Aa252.10 ± 75.6 Aa190.58 ± 25.1 Aa
S. amazonicum54.32 ± 12.9 Ba65.88 ± 24.9 Ba50.27 ± 16.2 Ba
Mean of six plants (±SD); mean values followed by the same letters did not differ between the treatments at p ≤ 0.05 based on Duncan’s test. Within the columns, uppercase letters compare the three species within the same fertilization treatment, and lowercase letters compare different fertilization treatments for each species.
Table 5. Biomass allocation of leaves, stems and roots and the shoot-to-root ratios of three leguminous trees in all of the fertilization treatments: leaf mass fraction (LMF), stem mass fraction (SMF), root mass fraction (RMF) and shoot-to-root ratio (S/R ratio).
SpeciesFertilizationParameter
LMFSMFRMFShoot/Root Ratio
T1D. odorata0.33 ± 0.06 Ab0.34 ± 0.04 Aa0.34 ± 0.07 ABa2.1 ± 0.8 ABb
I. edulis0.23 ± 0.06 Bb0.37 ± 0.04 Aa0.40 ± 0.09 Aa1.6 ± 0.6 Ab
S. amazonicum0.24 ± 0.06 Bc0.48 ± 0.05 Ba0.28 ± 0.06 Ba2.7 ± 0.8 Bb
T2D. odorata0.42 ± 0.04 Aa0.36 ± 0.03 Aa0.22 ± 0.03 Bb3.6 ± 0.6 Aa
I. edulis0.30 ± 0.04 BAb0.33 ± 0.08 Aa0.37 ± 0.07 Aab1.8 ± 0.6 Bab
S. amazonicum0.40 ± 0.07 Aa0.40 ± 0.06 Ab0.20 ± 0.03 Bb4.3 ±0.8 Aa
T3D. odorata0.42 ± 0.04 Aa0.39 ± 0.07 ABa0.18 ± 0.03 Bb4.4 ± 1.4 Aa
I. edulis0.34 ± 0.04 Ba0.36 ± 0.03 Ba0.30 ± 0.06 Ab2.3 ± 0.2 ABb
S. amazonicum0.25 ± 0.05 Cc0.42 ± 0.05 Aab0.33 ± 0.04 Aa2.6 ± 1.1 Bb
T4D. odorata0.42 ± 0.03 Aa0.38 ± 0.06 Aa0.19 ± 0.04 Bb4.5 ± 1.0 Aa
I. edulis0.33 ± 0.04 Ba0.37 ± 0.04 Aa0.30 ± 0.07 Ab2.5 ± 0.6 Ba
S. amazonicum0.33 ± 0.06 Bb0.38 ± 0.06 Ab0.29 ± 0.05 Aa2.5 ± 0.5 Bb
Mean of six plants (±SD); mean values followed by the same letters did not differ between the treatments at p ≤ 0.05 based on Duncan’s test. Within the columns, uppercase letters compare the three species within the same fertilization treatment, and lowercase letters compare different fertilization treatments for each species.

