Article

Genetic Diversity of the Black Mangrove Avicennia germinans (L.) Stearn in Northwestern Mexico

by
Olivia Millán-Aguilar
1,*,
Marlenne Manzano-Sarabia
1,
Alejandro Nettel-Hernanz
2,
Richard S. Dodd
3,
Miguel Ángel Hurtado-Oliva
1 and
Ernesto Velázquez-Velázquez
2
1
Facultad de Ciencias del Mar, Universidad Autónoma de Sinaloa, Paseo Claussen s/n, Colonia Los Pinos., Mazatlán, Sinaloa 82000, Mexico
2
Instituto de Ciencias Biológicas, Libramiento Norte-Poniente s/n, Universidad de Ciencias y Artes de Chiapas (UNICACH), Tuxtla Gutiérrez, Chiapas 29000, Mexico
3
Department of Environmental Science, Policy and Management, University of California, 137 Mulford Hall, Berkeley, CA 94720, USA
*
Author to whom correspondence should be addressed.
Forests 2016, 7(9), 197; https://doi.org/10.3390/f7090197
Submission received: 18 July 2016 / Revised: 24 August 2016 / Accepted: 30 August 2016 / Published: 3 September 2016

Abstract

:
Mangrove forests of Mexico have been threatened by the effects of anthropogenic activities during the last decades, mostly related to aquaculture, agriculture, livestock and urban development. Genetic diversity and fine-scale genetic structure of two generations of the black mangrove Avicennia germinans (L.) Stearn were investigated in perturbed and preserved sites from three lagoon systems in Sinaloa, Mexico. Genetic diversity and overall genetic structure were similar between perturbed and preserved sites. However, lower levels of fine-scale spatial genetic structure were observed in two of the younger (sapling) generations. We attribute this to differences in local dynamics of each lagoon system, their status of conservation and levels of fragmentation. Also, low connectivity and the effects of disturbance could restrict the movement of pollinators and seed dispersal capabilities, resulting in low levels of genetic diversity and signs of inbreeding. Perturbed populations of A. germinans may play an important role in in situ conservation of this complex ecosystem.

Graphical Abstract

1. Introduction

Understanding the effects of anthropogenic perturbation on the genetic diversity of key forest species is crucial for the implementation of ecological conservation and management strategies [1,2,3]. Anthropogenic perturbation in tropical forests, e.g., mangroves, includes land conversion, habitat reduction and fragmentation, pollution, release of invasive species, human-induced fires, and direct exploitation [4,5]. Changes in coastal lagoons in Sinaloa, Mexico have been associated mostly with aquaculture, agriculture, livestock and urban development [6]. Human-driven perturbations affect population demography that in turn could potentially lead to reductions in species genetic diversity and changes in patterns of genetic structure [7,8,9]. These disturbances could represent a real threat for the long term ability of species to respond if adaptive genetic traits are lacking [10].
Mangrove forests are among the most productive ecosystems in the world [11], providing several goods and services. Located in the transition zone between sea and land, these highly productive areas provide nurseries and refuges for several species, including those with economical importance [12] for rural coastal communities [13]. However, they are also highly vulnerable to human activities and natural phenomena, e.g., ~35% of coverage worldwide has been lost (1980–2000) [14]. On the other hand, they have shown a remarkable resilience to perturbation [15]. The ability of mangrove forests to regenerate depends on geomorphological characteristics of the area and tidal flooding frequency [16], as well as the ability of their propagules to disperse and establish in new areas. The insect-pollinated genus Avicennia is one of the key components of mangrove ecosystems around the world [16]. The black mangrove, Avicennia germinans (L.) Stearn [17], is widespread along tropical and subtropical coasts of the American continent and West Africa, and is a major component of mangrove forests in these regions. A. germinans occurs more frequently in inland habitats compared to other key species (e.g., Rhizophora sp.), which is explained by its resistance to high soil salinity, and is therefore more vulnerable to human impacts. In this study, mangroves located in three lagoons in the eastern Gulf of California, Mexico, were studied including sites with different levels of human-driven disturbance. The rationale of this work was that mangrove areas with higher anthropogenic disturbance would show differences in the level and structure of genetic diversity in comparison with less perturbed areas.

2. Materials and Methods

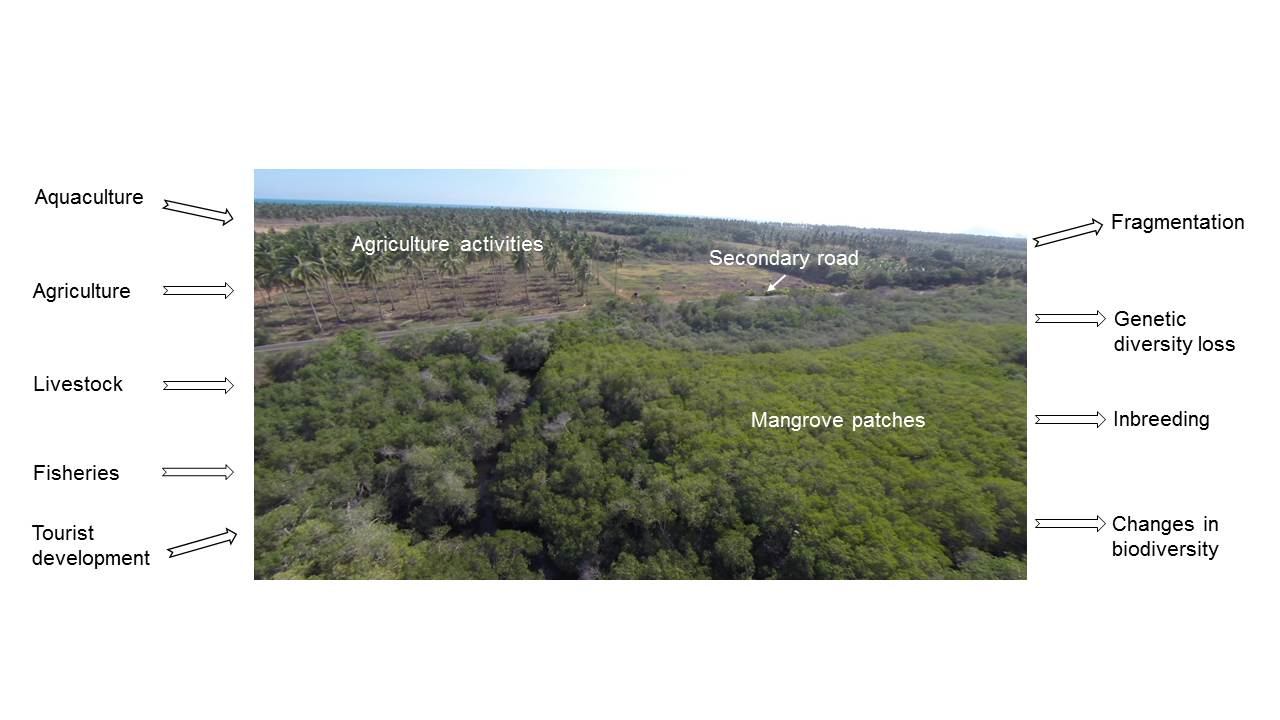
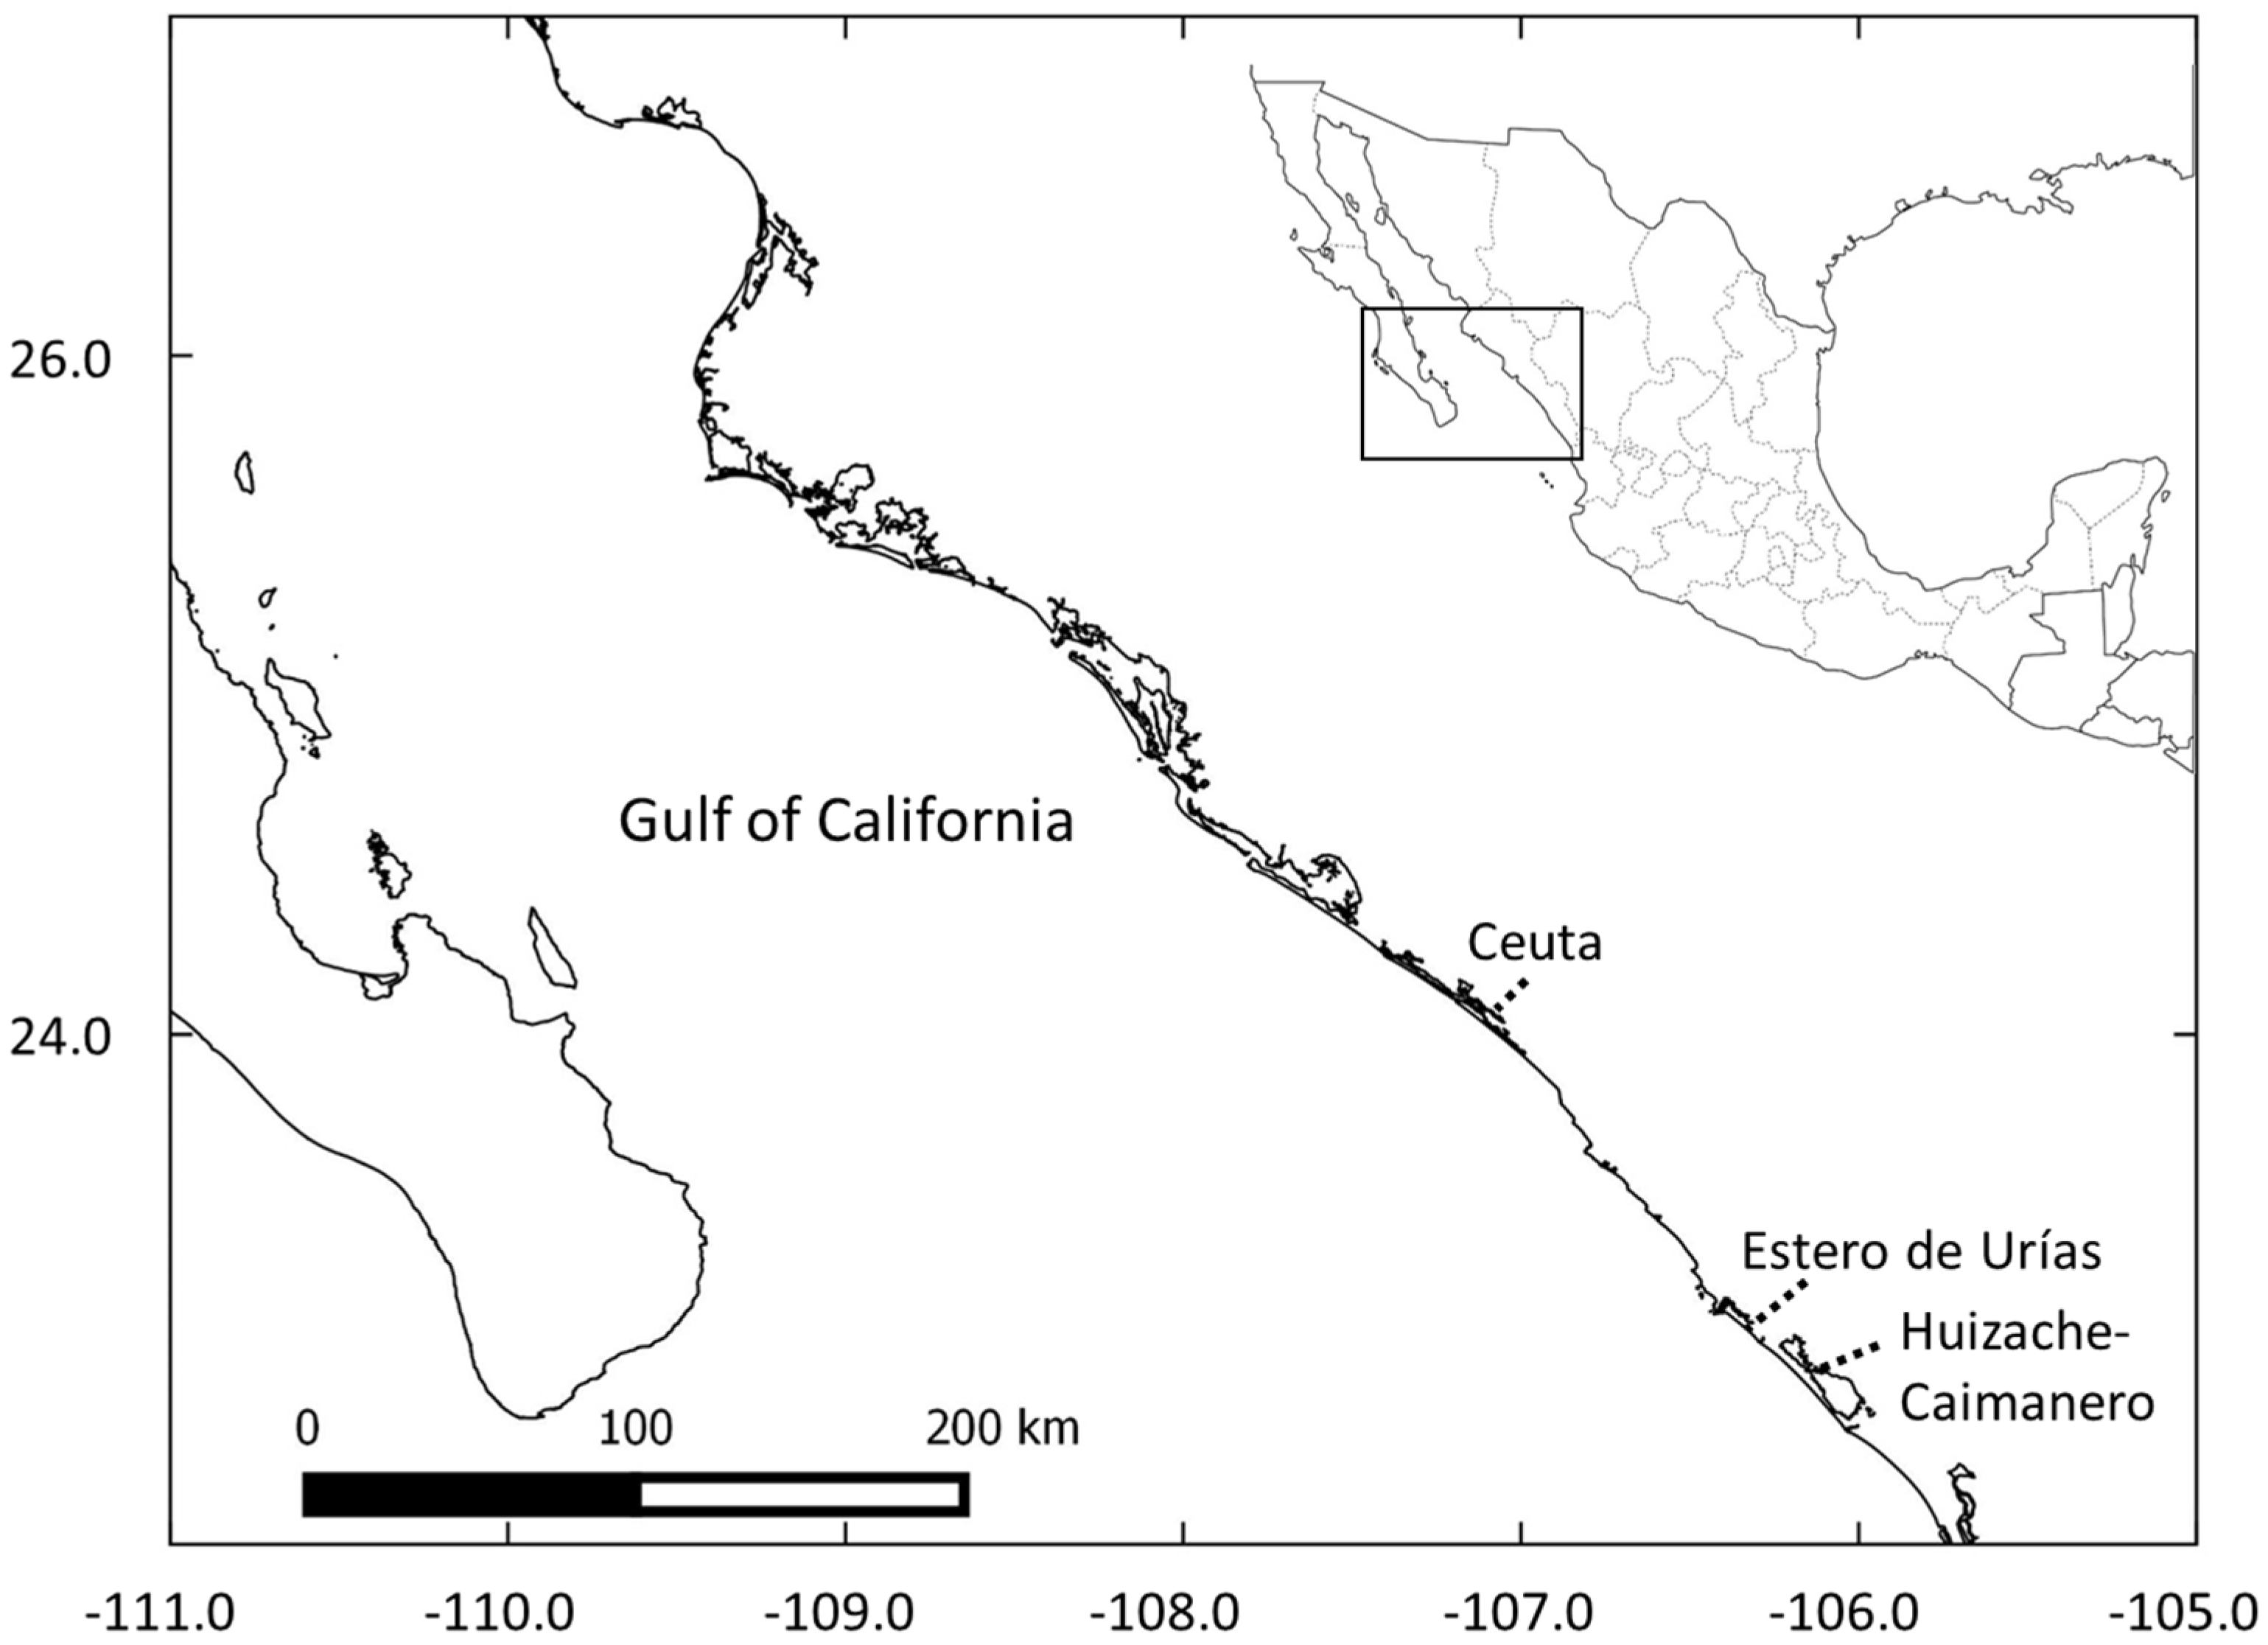
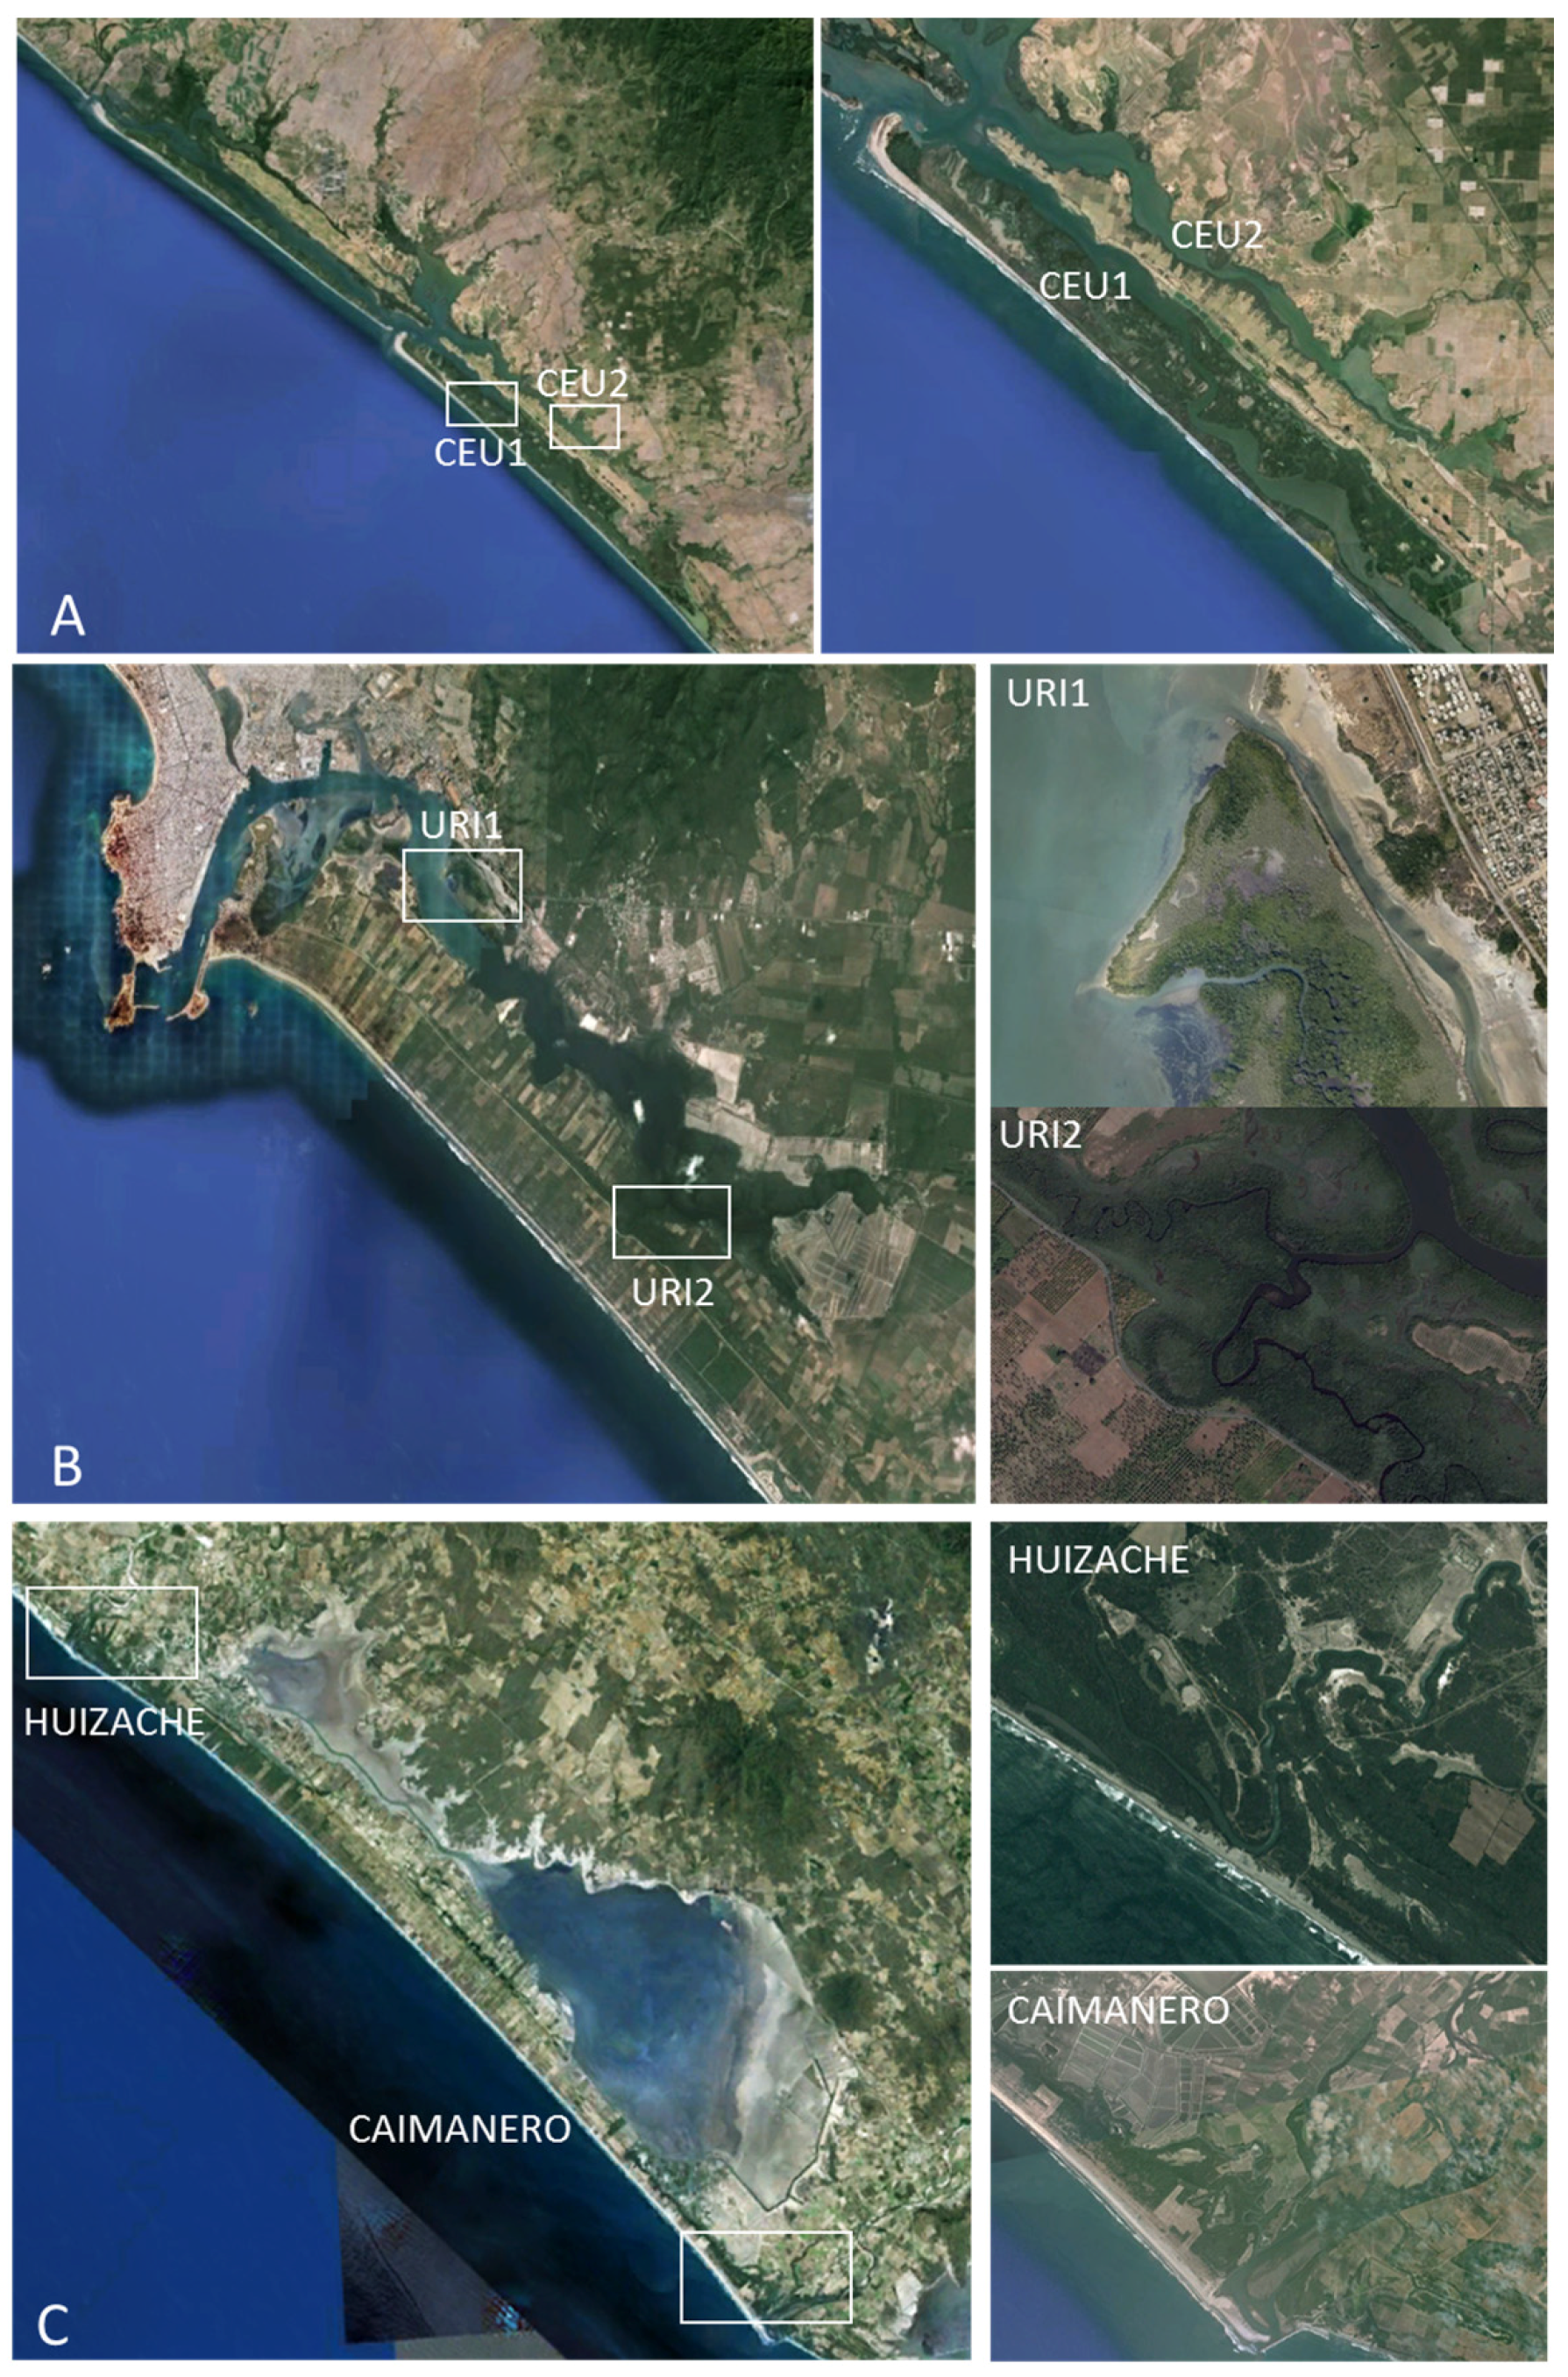
2.1. Study Site Selection

Sampling sites were located in three coastal lagoon systems in Sinaloa (Mexico): Ceuta (CEU), Huizache-Caimanero (referred to as HC for the entire lagoon system or separately when discussing differences between both lagoons), and Estero de Urías (URI) (Figure 1), and were selected according to perturbed and preserved characteristics (remote sensing data (Landscape characterization was derived from Landsat TM 5 imagery (Normalized Difference Vegetation Index or NDVI, mangrove cover, aquaculture area, and fragmentation index)), in situ prospection, official cartography and ancillary data) [18]. CEU and HC have been designated as Ramsar sites [19] according to their ecological relevance, whereas URI has no protection status.

2.2. Sampling Strategy and DNA Extraction

Two generations were sampled, adult and young trees (saplings) from two areas (perturbed and preserved) for each of the three lagoon systems (CEU, HC, and URI) (Figure 2). Three fresh leaves were collected from each individual separated at least 30 m apart to prevent consanguinity. In total, twelve subpopulations were analyzed by age and disturbance status for each lagoon system. Sampled material was maintained at −20 °C in the laboratory. Genomic DNA was extracted for 294 adults and 213 sapling individuals (further details are shown in Table 1) using a modified CTAB method [20].

2.3. Microsatellite Analysis

A total of 507 individuals were genotyped using eighteen microsatellite loci with primers developed for A. germinans (Table A1; Appendix A) [21,22,23], which were fluorescent-labeled with FAM or VIC. Amplifications were performed in multiplex groups, or individually as follows: (1) Ag15; (2) Ag16, Ag11; (3) Ag07, Ag03; (4) Ag06, with the following thermocycling conditions: 95 °C for 10 min, initial denaturation at 94 °C for 10 min, followed by 20 cycles at 94 °C for 45 s, 64 °C for 45 s, 50 °C for 45 s, 72 °C for 45 s, 20 cycles at 94 °C for 45 s, 50 °C for 45 s, 72 °C for 45 s, and 10 min at 72 °C for a final extension; (5) Ag01; (6) Di6t, Te4t; (7) Di13, Te8, a cycle at 95 °C for 10 min, initial denaturation at 94 °C for 10 min, followed by 30 cycles at 94 °C for 45 s, 50 °C for 45 s, 72 °C for 45 s, and 10 min at 72 °C for a final extension; (8) Ag20, Ag14; (9) CTT1, CA1; (10) CA2, CT3, a cycle at 95 °C for 10 min, initial denaturation at 94 °C for 10 min, followed by 20 cycles at 94 °C for 45 s, 61 °C for 45 s, 47 °C for 45 s, 72 °C for 45 s, 20 cycles at 94 °C for 45 s, 47 °C for 45 s, 72 °C for 4 5 s and 10 min at 72 °C for a final extension; and (11) Te7, Te9, a cycle at 95 °C for 10 min, initial denaturation at 94 °C for 10 min, 20 cycles at 94 °C for 45 s, 55 °C for 45 s, 72 °C for 45 s and 10 min for a final extension. PCR conditions were applied as follows: 12.5 μL of Master Mix PROMEGA (containing Taq polymerase, dNTPs, MgCl2 and buffers to optimize the reaction), 1.5 μL each primer and 1 μL of 1:10 dilution of extracted DNA in a total volume of 25 μL. PCR products were mixed with a solution of 10 μL of formamide and 0.25 μL of LIZ size standard (Applied Biosystems, Austin, TX, USA). Samples were sent to Macrogen, Inc. (Seoul, Korea) for automated fragment analysis on an ABI 3730XL. Allele sizes were assessed using GeneMarker V.2.6.3 software (SoftGenetics, State Collage, PA, USA).

2.4. Statistical Analysis

Data were tested for the presence of null alleles using MICRO-CHECKER [24]. In order to compare the genetic diversity estimates among locations and between adults and saplings the following analyses were performed. Observed and expected heterozygosity (Ho, He) were estimated using ARLEQUIN V.3.5.1.2 [25]. Allelic richness, by the rarefaction method (Rt), was estimated with the program FSTAT V.2.9.3.2. [26]. Inbreeding coefficient (FIS) and deviations from Hardy-Weinberg were calculated with GENEPOP [27]. Significant differences of diversity estimates were tested among preserved and perturbed sites and among adults and saplings using group comparisons as implemented in FSTAT and by performing paired t-tests. The null hypothesis was tested that there were no significant differences between genetic diversity estimates in perturbed and preserved sites for each of the adults and saplings.
A hierarchical analysis was performed the genetic structure with an analysis of molecular variance or AMOVA [28] to evaluate the importance of substructure among conservation status and age group relative to regional structure using ARLEQUIN version 3.5 (Institute of Zoology, University of Berne, Bern, Switzerland) [25]. Different regional groupings were compared to test for significant differences and to assess how much of the genetic diversity was explained.
We used the Bayesian inference-based program STRUCTURE V.2.3.4. (Pritchard Lab, Stanford, CA, USA) [29] to infer the number of genetically homogeneous populations among adults and saplings separately. The admixture model was used with correlated frequencies without prior population information. The number of clusters (K) was inferred by performing 20 independent runs of each K (K = 1 to K = 10). The length of the sampler run included a burn-in of 100,000 iterations followed by 1 million iterations. STRUCTURE HARVESTER [30] was used to determine the optimal value of K [31].
Spatial genetic structure within populations for each site and age group was analyzed using the SPAGeDi v 1.5 version (Brussels, Belgium) [32]. Analyses were based on the codominant estimator of the kinship coefficient Fij [33]. Distance classes were defined for both adults and saplings as follows: 0–50, 50–100, 100–200, and each hundred meters up to a maximum of 1 km. Pairwise kinship coefficients were regressed on the log of spatial distance to estimate b log, the regression slope. The 95% confidence intervals of the multilocus-weighed average of Fij for each distance class and b log were obtained through jackknifing locations over loci. Intensity of within population spatial genetic structure was measured with the Sp statistic [34]. Sp was calculated for each sample as Sp  =  −bln/(1  −  F(1)), where bln is the regression slope of Fij on the natural logarithm of the distance and F(1) is the multilocus mean Fij of the first distance class, including all pairs of closest neighbors.

3. Results

3.1. Genetic Diversity

All 18 tested loci were polymorphic in at least one of the sampled locations either for adults or saplings. Summary genetic diversity estimates are presented in Table 1. Null alleles were detected at locus Agerm11 at two sites and at locus Agerm15 for 50% of the sites. Data analysis was performed on the full data set. Genetic diversity estimates were relatively low for all sampled locations and ages. Allelic richness in the conserved sites ranged from 1.89 in CEU to 1.55 in Huizache for adult trees and between 1.75 in Huizache and 1.90 in URI for saplings. For perturbed sites, allelic richness in ranged from 1.69 in Caimanero to 1.73 in CEU for adults, and from 1.86 in CEU to 1.66 in Caimanero for saplings. FIS estimates ranged from 0.175 for adults in the URI-preserved site to −0.061 in the same site for saplings. Adults from one preserved site (CEU) and four sapling sites [two preserved (URI, Huizache) and two perturbed (CEU, URI)], showed significant deviations from Hardy-Weinberg equilibrium, indicating heterozygote deficiency. FSTAT perturbed vs. preserved group comparisons and pairwise t tests for all locations (overall, adults, and saplings) were not statistically different.

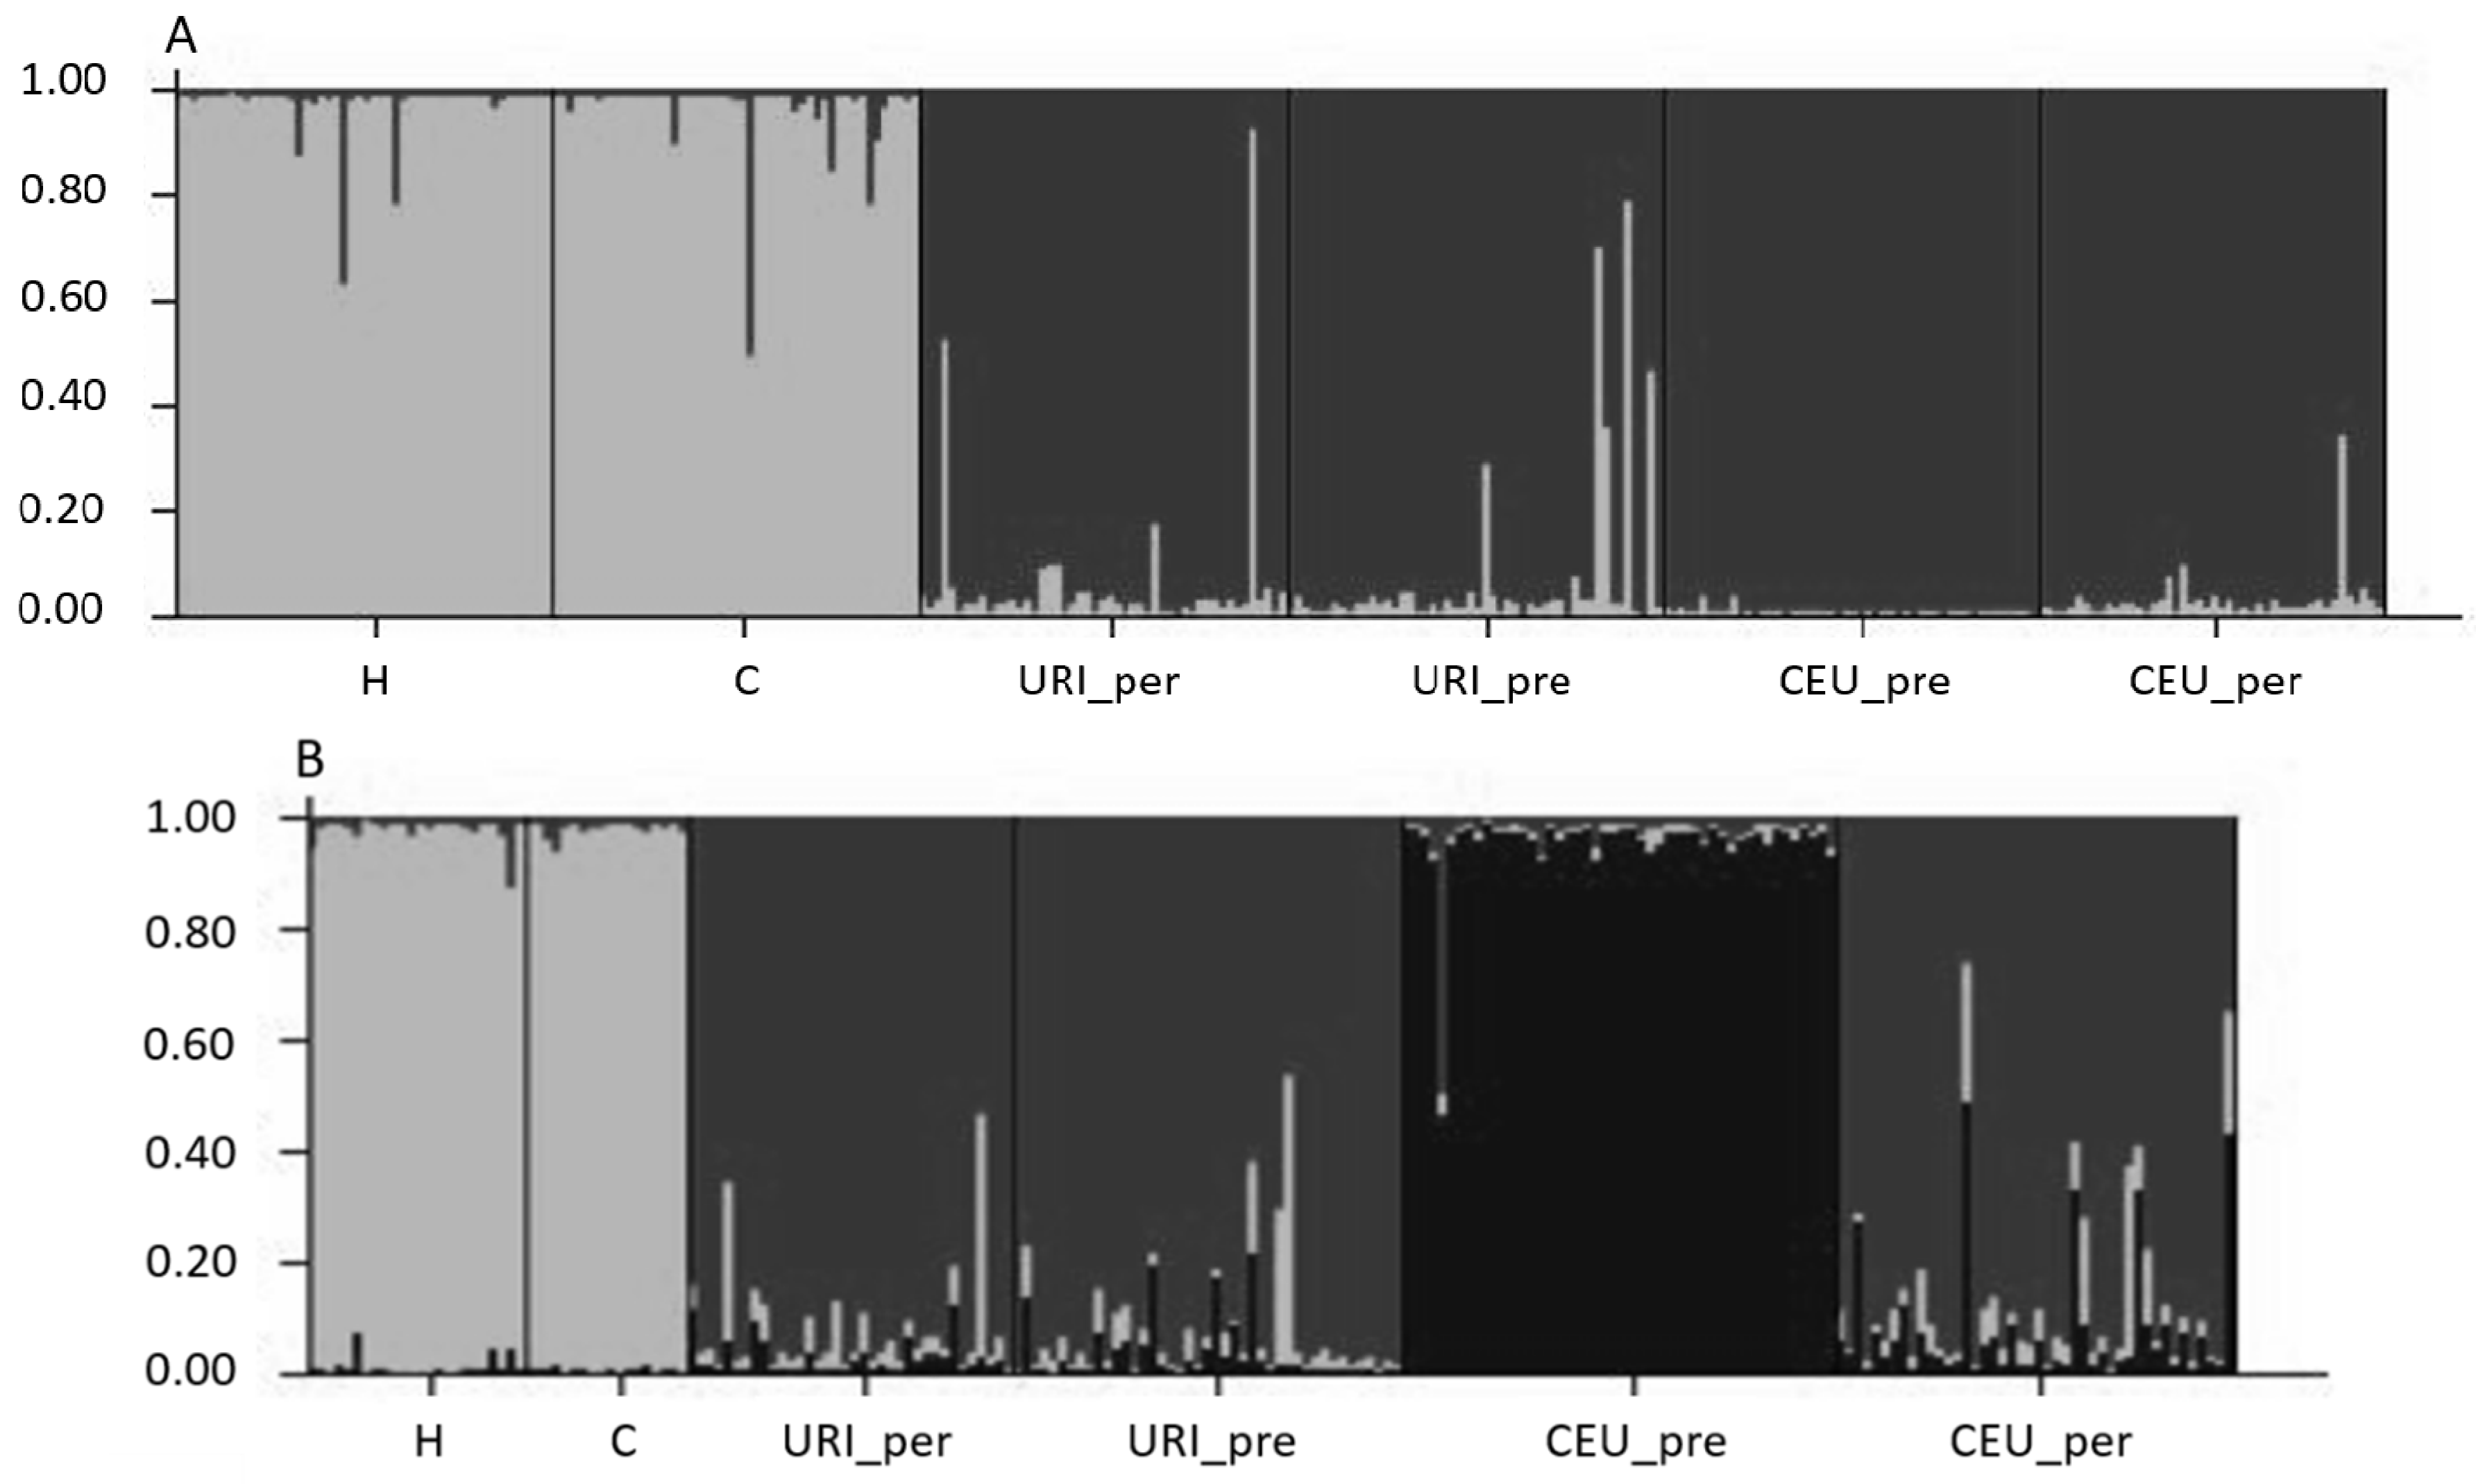
3.2. Population Genetic Structure

AMOVA results showed significant structuring at the coastal lagoon system level, where differentiation between systems was significant. In general, perturbed vs. preserved sites explained 3.31% of the variation (p = 0.169) (Table 2). In addition, differences within populations were significant in all cases, explaining the higher percentage of the variance. Bayesian inference of genetically homogeneous populations for adults and saplings supported K = 2 for adults and K = 3 for saplings, with the highest ΔK of 821.4 and 80.5, respectively. Bayesian clustering of adult tree genotypes separated clearly both HC sites from the other two systems, with a few individuals showing admixture between inferred clusters (Figure 3a). Clustering of sapling populations also indicated that HC differed from the rest of the sites and, in addition, CEU—preserved segregated as a different cluster, with one individual being of mixed origin (Figure 3b). We were unable to detect a pattern of higher or lower genetic structure when comparing perturbed and preserved sites from this analysis, i.e., all sampled sites formed a single cluster among individuals.

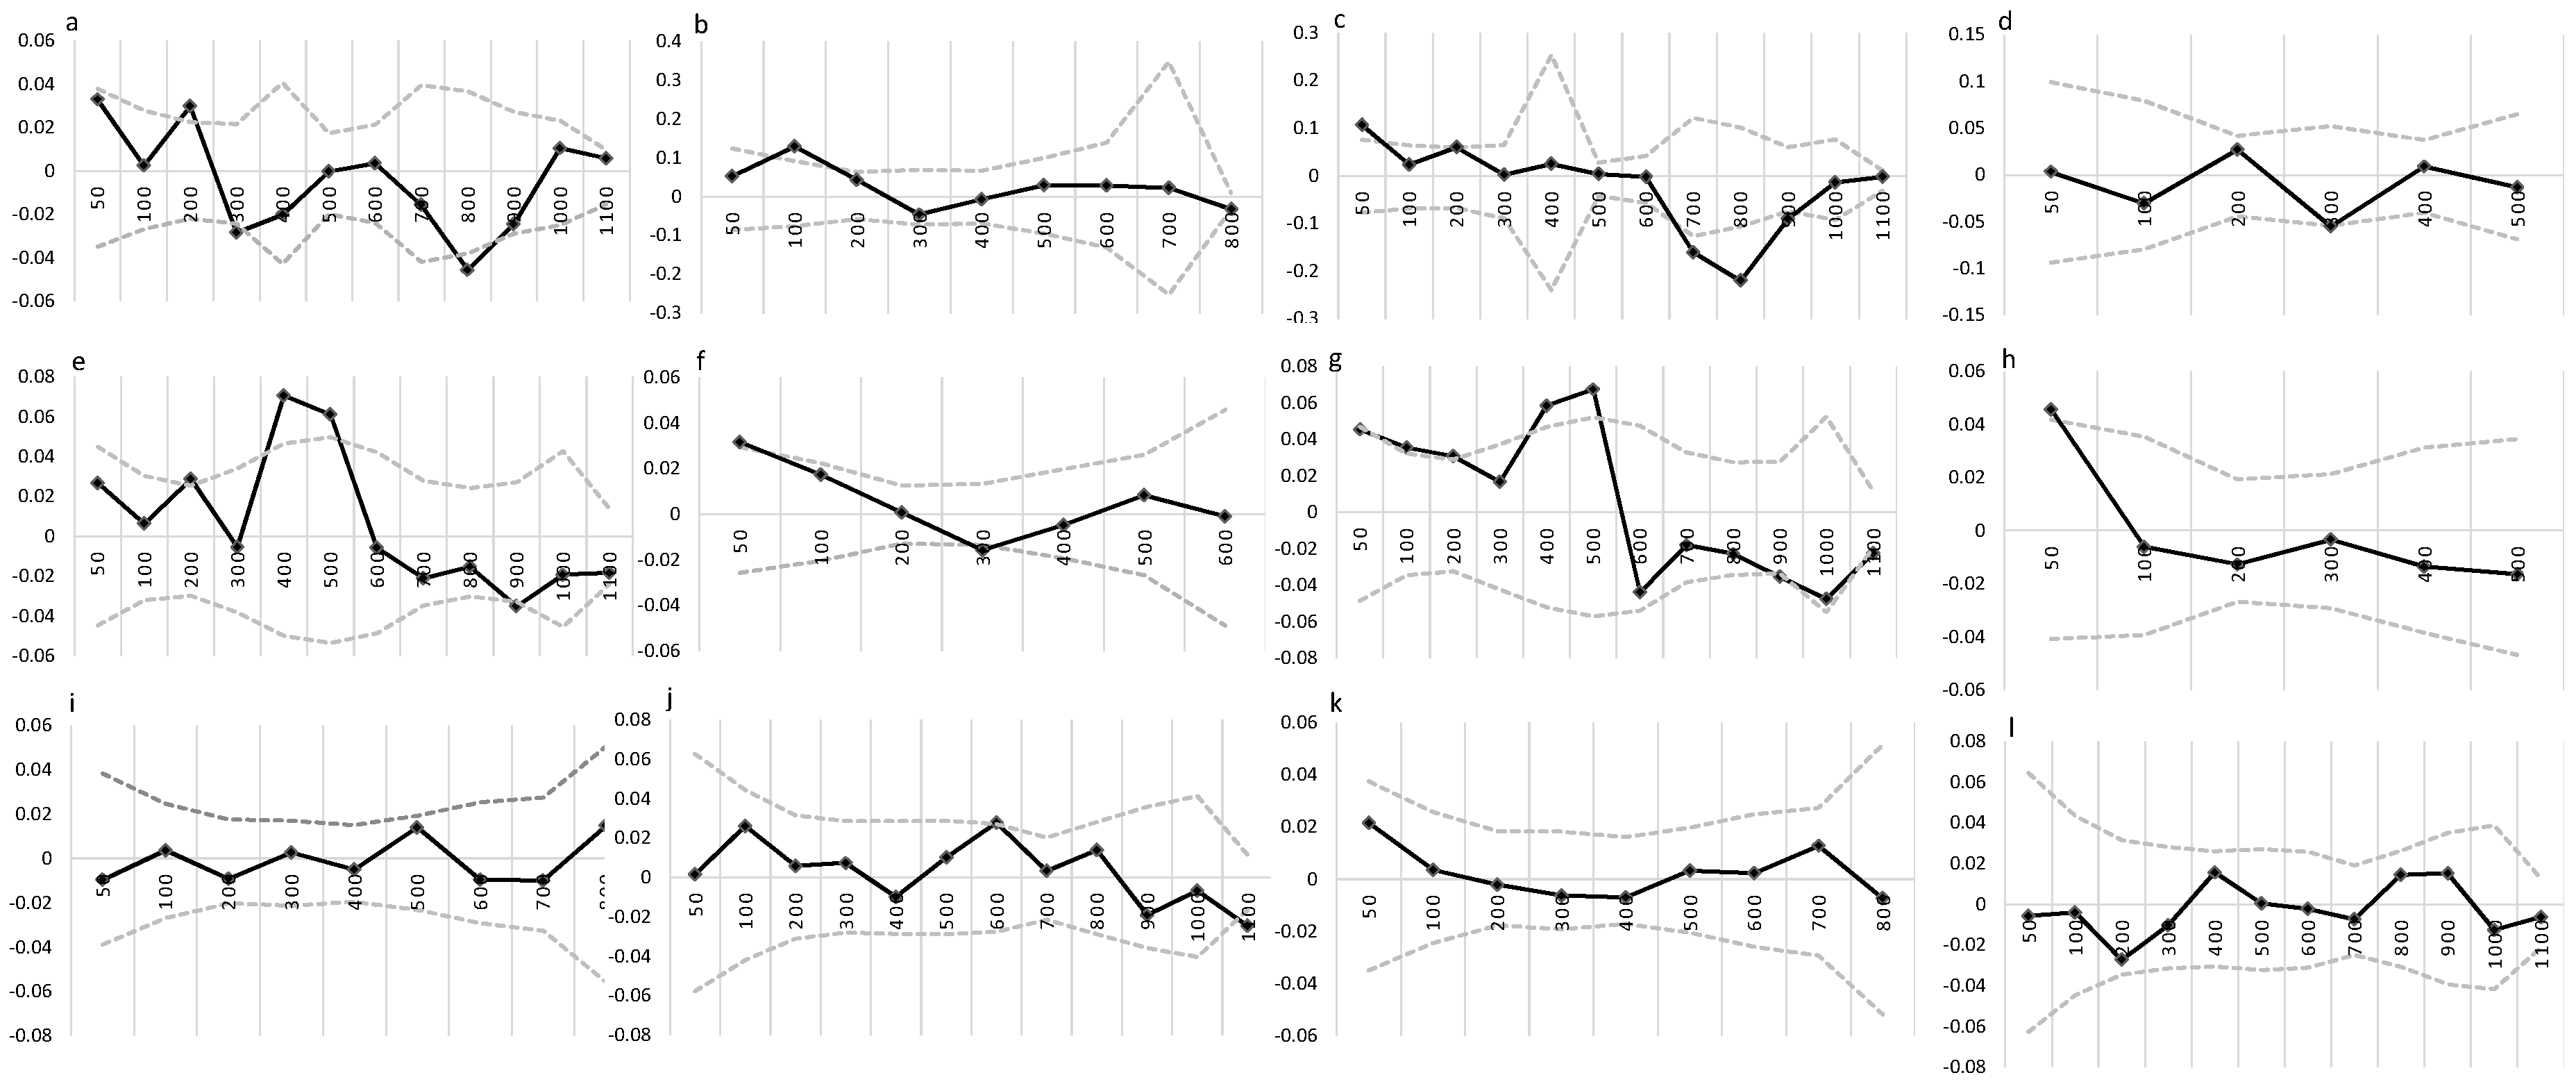
3.3. Spatial Genetic Structure

Sampled sites showed unclear patterns of spatial genetic structure. Some sites showed higher levels of genetic structure at 200 m, 400 m, and 500 m than at the first distance class. Five sites had significant kinship coefficient values for the first distance class F1 (0–50); two of those were adult stands (HC-preserved and URI-perturbed) and three sapling sites (HC-preserved, URI-preserved, and URI-perturbed; Table 3). There was no evidence of difference in the kinship coefficient for the first distance class (F1), when comparing perturbed vs. preserved sites (Table 3). At CEU, no spatial structure was detected in any of the sampled sites (perturbed or preserved) according to the spatial autocorrelograms (Figure 4), or F1, b-log, and Sp estimates (Table 3). The highest level of structure as measured by Sp was detected in preserved sapling sites in HC and URI; 0.035 and 0.024, respectively. In adults, the highest Sp values were detected in URI preserved (0.015), URI perturbed (0.013), and CEU perturbed (0.011). Strong differences were observed in Sp and b-log in these preserved sites in comparison with the associated perturbed sites. CEU-preserved saplings showed a minor difference with a similar pattern between preserved (Sp = 0.002) and perturbed (Sp = −0.003) sites. b-log estimates were lower in adults from perturbed sites at HC and CEU; however, the Sp values were very similar between adults in paired perturbed vs. preserved site comparisons.

4. Discussion

Genetic diversity and structure among perturbed and preserved stands of the black mangrove A. germinans were investigated in the eastern margin of the Gulf of California (central-southern Sinaloa state). Overall, genetic diversity was relatively low, consistent with previous reports for northern East-Pacific mangrove populations [35,36]. No significant differences were observed in genetic diversity among preserved and perturbed sites in the analyzed generations (adults and saplings).
Genetic structure was comparable among sites according to the number of Bayesian clusters detected, where each sampled site showed a single cluster. Adult stand spatial genetic structure as estimated by Sp was also similar between perturbed and preserved sites. Nevertheless, a marked dissimilarity in spatial genetic structure was detected between sapling sites in two lagoon systems, HC and URI. In these two wetlands, Sp values were two orders of magnitude higher in preserved vs. perturbed sites. Sapling generation is expected to be more sensitive to perturbation effects than adults, which are a sample of ancestral conditions. This loss of spatial genetic structure in two sapling perturbed sites suggests the elimination of local genetically related groups. This loss of structure could imply an increase in the distance of seed and/or pollen dispersal. Average spatial genetic structure for adults was three times lower than expected for a tree with mixed mating [34]. We acknowledge that it would be necessary to sample individuals that are within close proximity (10–30 m) to establish the precise distance at which these populations present fine-scale spatial genetic structure and that our sampling could also affect the strength of detected spatial structure at the first distance class. Nevertheless, a biologically plausible factor that could influence the low level of overall spatial genetic structure is the water-dispersed black mangrove propagules. These propagules, which are viable for up to two months when floating in salty water, tend to get trapped in the pneumatophores of the mother or nearby trees. Establishment could be complicated in dense areas. Results showed that most sites do not follow a pattern of isolation by distance, where nearby individuals are more genetically related than distant individuals. Correlograms showed either higher spatial genetic structure at greater distances (200 and up to 500 m) than expected or no structure. Local system dynamics, e.g., hydroperiod (duration and frequency of inundation at a period time), may explain the observed differences related to the distribution of genetic diversity. Previous work [37] has demonstrated that in Central American populations of A. germinans, within-population genetic structure indicates the formation of demes at different spatial scales. The significant spatial genetic structure detected at higher distances in this work could be explained by the sampling of different genetic demes between 200 to 500 m distance classes in these populations.
Some factors that determine the movement of propagules and pollinators in lagoon systems are the distance between populations, levels of fragmentation, and the distribution of species. Pollinator movement patterns are influenced by the lack of connectivity among individuals. Pollinators tend to move within fragments, reducing pollen dispersal in more fragmented areas, which could lead to an increase in bi-parental inbreeding [38,39]. Furthermore, insect flights tend to span smaller areas than other animal pollinators [40]. This restricted pollen movement may play a relevant role in determining the level of genetic structuring in some areas. However, the lack of spatial genetic structure in juveniles from two perturbed sites (HC and URI) as compared to preserved sites from the same lagoon systems implies that either pollinators tend to move greater distances than expected, or that propagule dispersal effectively diminishes the formation of genetically homogeneous clusters of individuals.
Lower levels of genetic diversity and increased inbreeding were recorded along the Colombian Pacific coast associated with fragmentation processes and restricted propagule dispersal [41]. At a regional level, isolation of lagoon systems could lead to an increase in inbreeding and lack of incoming genes from nearby populations. In the same way, HC was the site with the lowest estimates of allelic richness and also the location in which a third cluster was detected according to STRUCTURE analysis. One of the main anthropogenic disturbances in HC is the presence of seasonally fixed fishing structures known as “tapos”, which restricts propagule dispersal, i.e., a higher abundance of propagules have been reported during autumn when those fishing barriers are operating [42], causing isolation of mangroves, at least in this lagoon system. Also, HC showed a tendency to be naturally closed because of the accumulation of sediments, especially at the northern mouth isolating mangroves from tidal sea water, which could act as another dispersal barrier.
Although the geographical distance is relatively short (~211 km) among lagoon systems, the internal dynamics of each one differs and may account for observed genetic diversity and regional genetic structuring. HC had the lowest level of genetic diversity while less recruitment was observed in the field and trees and saplings showed signs of stress (e.g., low chlorophyll values, results not shown). Rehabilitation of natural hydrodynamics of HC must be a priority because of its widely recognized ecological importance [43].
The conservation status of the study areas vary according to their related ecological history. However, A. germinans in perturbed areas showed a similar level of genetic diversity than nearby preserved areas, which may be related to a short time scale to record a negative impact on genetic diversity of these mangrove populations. The level of genetic diversity in perturbed sites could also be maintained by incoming gene flow from more preserved areas. Nevertheless, perturbed sites may suffer a loss of spatial genetic structure in the following generations (as recorded in HC and URI). Perturbed sites may act as reservoirs of the species evolutionary potential if such genetic changes are maintained through several generations, being relevant for mangrove conservation initiatives.

Acknowledgments

Authors acknowledge financial support provided by PROMEP UAS-NPTC UAS-PTC-039, PROFAPI 2011/100, 2012/098, 2013/106, CONABIO LM004 grants. Special acknowledgments to Consejo Nacional de Ciencia y Tecnología for providing a doctoral scholarship to O. Millán-Aguilar (No. 202595). The authors thank Alberto Abreu Grobois from ICMyL-UNAM for his valuable comments on this manuscript.

Conflicts of Interest

The authors declare no conflict of interest. The founding sponsors had no role in the design of the study; in the collection, analyses, or interpretation of data; in the writing of the manuscript, and in the decision to publish the results.

Appendix A

Table A1. Microsatellite loci for Avicennia germinans showing the primer sequences, the annealing temperature and the size range in base pairs.
PrimerSequence 5′–3′Repeat MotifAnnealing Temperature (°C)Allele Range (bp)
1 Agerm15F: ACT TAC ACA CAA AAT GCA CA(CA) 4 (AC) 1356.7248
R: CTG AGA GTG CCG ACT GAA TG
1 Agerm16F: CCT AAT ACA AAT GAC ACT AAA A(TG) 953.4176
R: TGC ATG TCA ATT ATC AGT CT
1 Agerm11F: GCC CTC AGC ATG AAA CTT GT(TG) 1053.4138
R: AAA TAA TAA GGC GCC CGT GT
1 Agerm07F: CCT GAC ACT CTG GGA CAT CA(GT) 950.5157
R: CCT TTT GAC GCA TTT GTG G
1 Agerm03F: CCA TGT TTT TGA CTT TTT ATT TTG(CA) 948.2161
R: TTA CGA TAG GGT GGA TTG AGA TTT T
1 Agerm06F: GAA TTG GCT GGA ATG AGG AA(GT) 663.4175
R: GTG TTT TGG AAG GAG CCT GT
1 Agerm01F: CAG TTT GGT GAG AAG GAT GTT(AC) 1553.4127
R: TTT GAG GTC GGC TCG TTA AG
2 Di6tF: TAT ATG GAA ACC AAC CAT GC(ATT) 4 N 7 (GT) 1550207–260
R: GAT GGT GCG GGC TGT C
2 Te4TF: CAA GAT TTT GAT CAA TTA TG(CATA) 5 CATG (CATA) 95279–107
R: ACG TGA CGC ATT GAT CTA CC
2 Di13F: TTC ACC TAT ATG AAT GGC GCA C(CA) 1058297–303
R: GGA GCA CGC GAT AAC AAG AGC
2 Te8F: ACA CAA CGC AGA TAA ATC C(TGTA) 652104–112
R: AAT GAT CGC CTG TCT CCG TC
1 Agerm20F: TAT AAC AAT GCC CTG ACA CTC T(GT) 959.6203
R: ACA AAC ATG CCA ACA CAA ATA
1 Agerm14F: CCA ATT GTG TCG TCC TTT TA(CA) 8 (AT) 659.6159
R: AGC CTT ACT TTT CCT TTG T
3 CTT1F: CAT CCA CAT TGC CCT GAT(CTT) 855114–141
R: GCC TGA TAA GTT GAG TTG CTG
3 CA1F: AAG AGA ATG AGG AGT GGT AGG C(CA) 1356335–391
R: CAA GCC TCG CAT TAA AGT GG
3 CA2F: AGC CCT GGT GAT AGT GAC AG(CA) 1255310–346
R: ACC AGC AAA ATG TAA AGT GGC ATC
3 CT3F: ATT CCG AGC AAG AGC CTA C(CT) 1455412–516
R: ACT GAG GAT GAG TTG GTT TAT CTC
2 Te7F: CTA AGT AGG ACA GTA ATG CGA C(CAT) 2 (AT) 3 (GTAT) 550170–198
R: AAT CAT CAG AAT CCC TCA AGT GC
2 Te9F: GAA CCT GAT TTA ATG GTT GC(CA) 8 (GA) 2 (CAGA) 550218–238
R: TCA ATT TGC TTG TAG AGG
1 [21], 2 [22] 3 [23]

References

  1. Bradshaw, R.H.W. Past anthropogenic influence on European forests and some possible genetic consequences. For. Ecol. Manag. 2004, 197, 203–212. [Google Scholar] [CrossRef]
  2. Azevedo, V.C.R.; Kanashiro, M.; Ciampi, A.Y.; Grattapaglia, D. Genetic structure and mating system of Manilkara huberi (Ducke) A. Chev., a Heavily Logged Amazonian Timber Species. J. Hered. 2007, 98, 646–654. [Google Scholar] [CrossRef] [PubMed]
  3. Ratnam, W.; Rajora, O.P.; Finkeldey, R.; Aravanopoulos, F.; Bouvet, J.M.; Vaillancourt, R.E.; Kanashiro, M.; Fady, B.; Tomita, M.; Vinson, C. Genetic effects of forests management practices: Global synthesis and perspectives. For. Ecol. Manag. 2014, 332, 52–65. [Google Scholar] [CrossRef]
  4. Golladay, S.W.; Martin, K.L.; Vose, J.M.; Wear, D.N.; Covich, A.P.; Hobbs, R.J.; Klepzig, K.D.; Likens, G.E.; Naiman, R.J.; Shearer, A.W. Achievable future conditions as a framework for guiding forest conservation and management. For. Ecol. Manag. 2016, 360, 80–96. [Google Scholar] [CrossRef]
  5. Alongi, D.M. Present state and future of the world’s mangrove forests. Environ. Conserv. 2002, 29, 331–349. [Google Scholar] [CrossRef]
  6. Ruiz-Luna, A.; Berlanga-Robles, C.A. Modifications in Coverage Patterns and Land Use around the Huizache-Caimanero Lagoon System, Sinaloa, Mexico: A Multi-temporal Analysis using LANDSAT images. Estuar. Coast. Shelf Sci. 1999, 49, 37–44. [Google Scholar] [CrossRef]
  7. Sjölund, M.J.; Jump, A.S. Coppice management of forest impacts spatial genetic structure but not genetic diversity in European beech (Fagus sylvatica L.). For. Ecol. Manag. 2015, 336, 65–71. [Google Scholar] [CrossRef]
  8. Piotti, A.; Leonardi, S.; Heuertz, M.; Buiteveld, J.; Geburek, T.; Gerber, S.; Kramer, K.; Vettori, C.; Vendramin, G.G. Within-Population Genetic Structure in Beech (Fagus sylvatica L.) Stands Characterized by Different Disturbance Histories: Does Forest Management Simplify Population Substructure? PLoS ONE 2013, 8, e73391. [Google Scholar] [CrossRef] [PubMed]
  9. Loveless, M.D.; Hamrick, J.L. Ecological Determinants of Genetic Structure in Plants Populations. Annu. Rev. Ecol. Syst. 1984, 15, 65–95. [Google Scholar] [CrossRef]
  10. Jump, A.S.; Marchant, R.; Peñuelas, J. Environmental change and the option value of genetic diversity. Trends Plant Sci. 2009, 14, 51–58. [Google Scholar] [CrossRef] [PubMed]
  11. Jennerjahn, T.C.; Itekkot, V. Revelance of mangroves for the production and deposition of organic matter along tropical continental margins. Sci. Nat. 2002, 89, 23–30. [Google Scholar] [CrossRef]
  12. Day, J.W., Jr.; Hall, C.A.S.; Kemp, W.M.; Yanez-Arancibia, A. Estuarine Ecology; John Wiley & Sons, Inc.: New York, NY, USA, 1989; p. 543. [Google Scholar]
  13. Aburto-Oropeza, O.; Ezcurra, E.; Danemann, G.; Valdez, V.; Murray, J.; Sala, E. Mangroves in the Gulf of California increase fishery yields. Environ. Sci. 2008, 105, 10456–10459. [Google Scholar] [CrossRef] [PubMed] [Green Version]
  14. Valiela, I.; Bowen, J.L.; York, J.K. Mangrove forests: One of the world’s threatened major tropical environments. Bioscience 2001, 51, 807–815. [Google Scholar] [CrossRef]
  15. Gunderson, L.H.; Holling, C.S. Panarchy: Understanding Transformations in Human and Natural Systems; Island Press: Washington, DC, USA, 2002. [Google Scholar]
  16. Duque-Estrada, G.C.; Gomes-Soares, M.L.; Oliveira-Chaves, F.D.; Fernandez-Cavalcanti, V. Analysis of the structural variability of mangrove forests through the physiographic types approach. Aquat. Bot. 2013, 111, 135–143. [Google Scholar] [CrossRef]
  17. Tomlinson, B.P. The Botany of Mangroves; Cambridge University Press: Cambridge, UK, 1986. [Google Scholar]
  18. Millán-Aguilar, O.; Nettel-Hernanz, A.; Hurtado-Oliva, M.; Flores-Cárdenas, F.; Díaz-Lara, L.; Manzano-Sarabia, M. Landscape metrics and conservation status of five mangrove wetlands in the Eastern Gulf of California margin. Sci. Total Environ. submitted for publication. 2016. [Google Scholar]
  19. Ramsar. Available online: http://www.ramsar.org/wetland/mexico (accessed on 1 September 2016).
  20. Cullings, K.W. Design and testing of a plant-specific PCR primer for ecological and evolutionary studies. Mol. Ecol. 1992, 1, 233–240. [Google Scholar] [CrossRef]
  21. Nettel, A.; Rafii, F.; Dodd, S. Characterizacion of microsatellite markers for the mangrove tree Avicennia germinans L. Avicenniaceae. Mol. Ecol. Resour. 2005, 5, 103–105. [Google Scholar] [CrossRef]
  22. Ceron-Souza, I.; Rivera-Ocasio, E.; Funk, M.S.; McMillan, O. Development of six microsatellite loci for black mangrove (Avicennia germinans). Mol. Ecol. 2006, 6, 692–694. [Google Scholar] [CrossRef]
  23. Mori, G.M.; Zucchi, M.I.; Sampaio, I.; Souza, A.P. Microsatellites for the mangrove tree Avicennia germinans. Acanthaceae: Tools for hybridization and mating system studies. Am. J. Bot. 2010, 97, 79–81. [Google Scholar] [CrossRef] [PubMed]
  24. Van Oosterhout, C.V.; Hutchison, W.F.; Wills, D.P.; Shipley, P. MICRO-CHECKER: Software for identifying and correcting genotyping errors in microsatellite data. Mol. Ecol. Resour. 2004, 4, 535–538. [Google Scholar] [CrossRef]
  25. Excoffier, L.; Lischer-Heidi, E.L. Arlequin suite ver 3.5: A new series of programs to perform population genetics analyses under Linux and Windows. Mol. Ecol. Resour. 2010, 10, 564–567. [Google Scholar] [CrossRef] [PubMed]
  26. Goudet, J. FSTAT, a Program to Estimate and Test Gene Diversities and Fixation Indices; Institute of Ecology Biology Building, UNIL: Lausanne, Switzerland, 2002. [Google Scholar]
  27. GENEPOP software. Available online: http://genepop.curtin.edu.au (accessed on 1 September 2016).
  28. Excoffier, L.; Smouse, P.E.; Quattro, J.M. Analysis of molecular variance inferred from metric distances among DNA haplotypes—Application to human mitochondrial—DNA restriction data. Genetics 1992, 131, 479–491. [Google Scholar] [PubMed]
  29. Pritchard, D.W.; Stephens, M.; Donnelly, P.J. Inference of population structure using multilocus genotype data. Genetics 2000, 155, 945–959. [Google Scholar] [PubMed]
  30. Dent, E.A.; VonHoldt, B.M. Structure Harvester: A website and program for visualizing STRUCTURE output and implementing the Evanno Method. Conserv. Genet. Resour. 2012, 4, 359–361. [Google Scholar]
  31. Evanno, G.; Regnaut, S.; Goudet, J. Detecting the number of clusters of individuals using the software STRUCTURE: A simulation study. Mol. Ecol. 2005, 14, 2611–2620. [Google Scholar] [CrossRef] [PubMed]
  32. Hardy, O.J.; Vekemans, X. SPAGEDI: A versatile computer program to analyse spatial genetic structure at the individual or population levels. Mol. Ecol. 2002, 2, 618–620. [Google Scholar] [CrossRef]
  33. Loiselle, B.A.; Sork, V.L.; Nason, J.; Graham, C. Spatial genetic-structure of a tropical understory shrub, Sychotria officinalis (Rubiaceae). Am. J. Bot. 1995, 82, 1420–1425. [Google Scholar] [CrossRef]
  34. Vekemans, X.; Hardy, O.J. New insights from fine-scale spatial genetic structure analyses in plant populations. Mol. Ecol. 2004, 13, 921–934. [Google Scholar] [CrossRef] [PubMed]
  35. Nettel, A.; Dodd, R.S. Drifting propagules and receding swamps: Genetic footprints of mangrove recolonization and dispersal along tropical coast. Journal compilation. Int. J. Org. Evol. 2007, 61, 958–971. [Google Scholar] [CrossRef] [PubMed]
  36. Sandoval-Castro, E.; Dodd, R.S.; Riosmena-Rodríguez, R.; Enriquez-Paredes, L.M.; Tovilla-Hernández, C.; López-Vivas, J.M.; Aguilar-May, B.; Muñiz-Salazar, R. Post-Glacial expansión and population genetic divergence of mangrove species Avicennia germinans and Rhizophora mangle L. along the Mexican coast. PLoS ONE 2014, 9, e93358. [Google Scholar] [CrossRef] [PubMed]
  37. Cerón-Souza, I.; Bermingham, E.; McMillan, O.W.; Jones, F.A. Comparative genetic structure of two mangrove species in Caribbean and Pacific estuaries of Panama. BMC Evol. Biol. 2010, 12, 205. [Google Scholar] [CrossRef] [PubMed]
  38. Cresswell, J.E. Spatial heterogeneity, pollinator behavior and pollinator-mediated gene flow: Bumblebee movements in variously aggregated rows of oil-seed rape. Oikos 1997, 78, 546–556. [Google Scholar] [CrossRef]
  39. Goverde, M.; Schweizer, K.; Baur, B.; Erhardt, A. Small-scale habitat fragmentation effects on pollinator behavior: Experimental evidence from the bumblebee Bombus veteranus on calcareous grasslands. Biol. Conserv. 2002, 104, 293–299. [Google Scholar] [CrossRef]
  40. Vranckx, G.; Jacquemyn, H.; Muys, B.; Honnay, O. Meta-Analysis of susceptibility of woody plants to loss of genetic diversity through habitat fragmentation. Conserv. Biol. 2011, 26, 228–237. [Google Scholar] [CrossRef] [PubMed]
  41. Salas-Leiva, D.E.; Mayor-Durán, V.M.; Toro-Perea, N. Genetic diversity of the black mangrove. Avicennia germinans L. in Colombia. Aquat. Bot. 2009, 91, 187–193. [Google Scholar] [CrossRef]
  42. Flores-Cárdenas, F.; Hurtado-Oliva, M.A.; Doyle, T.W.; Nieves-Soto, M.; Díaz-Castro, S.; Manzano-Sarabia, M. Litterfall production of mangroves in Huizache-Caimanero lagoon system, México. J. Coast. Res. 2016. [Google Scholar] [CrossRef]
  43. Ramsar. Ramsar Sites Information System. Available online: https://rsis.ramsar.org/ris/1689 (accessed on 31 August 2016).
Figure 1. Map showing the sampling locations of the three lagoon systems in Sinaloa, Mexico. Zoomed panels for each lagoon are shown in Figure 2.
Forests 07 00197 g001
Figure 2. Maps showing the three lagoon systems (left) and details of sampling sites (right), where: (A) CEU; (B) URI; and (C) HC. Satellite imagery was obtained from Google Earth.
Forests 07 00197 g002
Figure 3. Results derived from STRUCTURE analysis of the three lagoon systems based on their age and status conservation (preserved and perturbed), where (A) is represented by two genetics groups of adults; and (B) assignment of three genetics groups of saplings individuals. The assignments of populations are: H (Huizache); C (Caimanero); URI per (Urias perturbed); URI pre (Urias preserved); CEU pre (Ceuta preserved); CEU per (Ceuta perturbed).
Forests 07 00197 g003
Figure 4. Spatial structure through autocorrelograms using kinship coefficient (Fij) [33] with a 50 m first distance and consecutive 100 m distance class. (a) H adults; (b) C adults; (c) H saplings; (d) C saplings; (e) URI_preserved adults; (f) URI_perturbed adults; (g) URI_preserved saplings; (h) URI_perturbed saplings; (i) CEU_preserved adults; (j) CEU_perturbed adults; (k) CEU_preserved saplings; (l) CEU_perturbed saplings.
Forests 07 00197 g004
Table 1. Genetic diversity and inbreeding coefficients from twelve subpopulations of Avicennia germinans, where: He, expected heterozygosity; Ho, observed heterozygosity; allelic richness; FIS, inbreeding coefficient and HW.eq, Hardy-Weinberg equilibrium.
Age GroupsSiteNHeHoAllelic RichnessFISHW.eq
PRESERVED
AdultsCEU500.2260.1921.890.1550.000
URI500.2210.1821.840.1750.000
HUIZACHE500.1650.1511.550.0900.017
Total/Mean1500.2040.1751.760.140
SaplingsCEU480.2340.2321.780.0070.195
URI430.2370.2101.900.1150.000
HUIZACHE240.1940.1561.750.2000.001
Total/Mean1150.2220.1991.810.107
PERTURBED
AdultsCEU460.2020.1981.710.0200.035
URI490.1930.1991.73−0.0610.179
CAIMANERO490.1880.1851.690.0210.486
Total/Mean1440.1950.1941.71−0.007
SaplingsCEU440.1840.1581.860.1380.000
URI360.2190.1891.770.1400.001
CAIMANERO180.2440.2201.660.1040.098
Total/Mean980.2200.1901.760.13
Table 2. Results of hierarchical AMOVA of Avicennia germinans populations based on five level analyses.
Source of Variationd.f.Variance Component% Total Variancep
Coastal lagoon system
Among regions20.1027.330.013
Within regions90.1349.57<0.01
Within populations10021.16083.1<0.01
Status: Preserved vs. Perturbed (saplings and adults)
Among regions10.0463.310.169
Within regions100.18313.16<0.01
Within populations10021.16083.54<0.01
Age: Saplings vs. Adults (preserved and perturbed)
Among regions1−0.036−2.680.804
Within regions100.22716.82<0.01
Within populations10021.16085.86<0.01
Status and age
Among regions3−0.024−1.730.701
Within regions80.22716.65<0.01
Within populations10021.16085.08<0.01
Preserved and perturbed saplings
Among regions1−0.071−4.710.801
Within regions40.48432.080.00
Within populations4201.09572.620.00
Preserved and perturbed adults
Among regions1−0.013−0.990.900
Within regions40.21215.81<0.01
Within populations5821.14385.18<0.01
Table 3. Spatial genetic structure parameters within populations.
SitesAge GroupConditionF1b-logSpSE
HCAdultsPreserved0.033 *−0.0050.0050.003
Perturbed0.026−0.005 *0.0050.003
SaplingsPreserved0.106 **−0.031 **0.0350.008
Perturbed0.0030.0002−0.00020.01
URIAdultsPreserved0.026−0.015 **0.0150.004
Perturbed0.031 *−0.013 *0.0130.005
SaplingsPreserved0.045 *−0.023 ***0.0240.005
Perturbed0.046 *0.006−0.0060.009
CEUAdultsPreserved0.0090.002−0.0020.005
Perturbed0.002−0.011 *0.0110.005
SaplingsPreserved0.021−0.0020.0020.005
Perturbed−0.0050.003−0.0030.005
Significance presented as 1-sided p values; * p < 0.05; ** p < 0.01;*** p < 0.001.

