Article

Clearcutting and Site Preparation, but Not Planting, Promoted Early Tree Regeneration in Boreal Alaska

1
School of Natural Resources and Extension, University of Alaska Fairbanks, Fairbanks, AK 99775, USA
2
Natural Science, Landmark College, Putney, VT 05346, USA
*
Author to whom correspondence should be addressed.
Forests 2017, 8(1), 12; https://doi.org/10.3390/f8010012
Submission received: 11 November 2016 / Revised: 13 December 2016 / Accepted: 16 December 2016 / Published: 25 December 2016

Abstract

:
The stand initiation stage decisively influences future forest structure and composition, particularly in the boreal forest which is a stand replacement disturbance driven system. In boreal Alaska, the conventional forest management paradigm has focused on the production of large-dimension timber, particularly white spruce (Picea glauca). However, energy generation and heating from wood is increasing, and is likely to significantly expand total forest harvest, further shifting management focus to fuelwood production. We evaluated the effects of forest harvest management practices on post-harvest regeneration by examining whether harvest type, site preparation method, and reforestation technique resulted in differences in forest regeneration in terms of species presence, dominance, basal area, and total stem biomass using a stochastic gradient boosting (TreeNet algorithm). We recorded diameter at breast height and height of white spruce, birch (Betula neoalaskana), and aspen (Populus tremuloides) in 726 plots from 30 harvest units, distributed across the various harvest and treatment types, harvest years, harvest sizes, and geographical locations. Our results indicate that management practices suitable/acceptable for woody biomass production differ from the more traditional dimensional timber production from white spruce-focused management. Artificial reforestation does not differ from natural regeneration in obtaining more stems or producing greater biomass. Clearcutting and site preparation increased tree regeneration, basal area, and woody biomass when compared to a partial harvest with no site preparation. Planting of white spruce in the Alaskan boreal forest may only be necessary in some specific circumstances, such as years with no/low white spruce seed crop, or in landscapes depleted of seed trees.

1. Introduction

In central Interior Alaska, a large portion of the most productive boreal forest sites, especially near transportation and population centers, was transferred from federal to state ownership, beginning at statehood in 1959. On these lands the conventional forest management paradigm in the second half of the 20th century focused on the production of large-dimension timber, particularly white spruce (Picea glauca (Moench) Voss) [1]. As a result, several silvicultural systems designed to maximize regeneration and production of white spruce have been studied, which have included both clearcutting (even-aged) and partial harvest (uneven-aged) methods combined with various site preparation treatments and assisted tree regeneration [2,3,4,5].
During ecological succession, the stand initiation stage decisively influences future forest structure and composition, particularly in the boreal forest, which is primarily a stand replacement disturbance driven system [6,7,8]. Fire is the dominant natural disturbance in North American boreal forest, although various fire suppression policies are in place that modify or limit its effects, particularly near communities [9,10,11]. Pre-fire vegetation and fire severity greatly influence post-fire tree regeneration [8,12,13]. In particular, the depth of the organic layer is one of the most important variables determining the post-fire regeneration trajectory [12,14]. In Interior Alaska, a thick organic layer tends to accumulate because the rate of organic matter decomposition in soils, particularly in spruce stands, is very slow due to cold temperatures [15]. In Alaska, post-fire plant regeneration pathways vary from self-replacement to initial or relay floristics, depending on the depth of organic layer remaining following fire [12,16]. When fire consumes a small amount of the organic layer, regeneration is dominated by previous vegetation that survived belowground and can regenerate asexually from the remaining parts. In contrast, when fire largely consumes the organic layer, burned sites promote establishment of early-successional species that germinate from seeds on exposed mineral soil [16,17].
The same principles of organic layer thickness that affect post-fire succession also influence post-harvest stand development. Although wildfire has been and continues to be the dominant disturbance in Interior Alaska, forest harvest can be one of the most important forms of disturbance in areas dedicated to sustained yield. Numerous studies examining post-fire forest succession are available for Alaska and northern boreal Canada [14,16,18,19,20,21]. However, studies of post-harvest tree regeneration are limited [3,5,22].
Within the study region, the predominant operational harvest method used from the start of industrial wood harvest in the early 20th century up to the late 1990s was clearcutting of the mature white spruce-dominated stands, and partial harvest of larger diameter white spruce trees within mixed stands [23]. However, since the 1990s, when demand decreased for large-dimension white spruce from the Asian market, the proportion of all harvesting that used the clearcutting silvicultural system decreased [24]. In the North American boreal forest, there is increasing concern over some effects observed in large clearcuts. For example, in a study in Northern Alberta, clearcuts that exceeded 100 ha experienced low spruce recruitment due to the limited seed dispersal ability of white spruce [25]. Increasingly clearcutting is used in conjunction with mitigating measures, such as variable retention and carefully planned harvest distribution and layout across the landscape [26].
Natural regeneration of white spruce as a silvicultural system is strongly affected by the masting behavior of the species. White spruce typically produces a large seed crop roughly every 11 years in Interior Alaska [27,28]. White spruce regenerates almost exclusively from seeds, thus seedbed quality is a critical factor for adequate regeneration. Mineral soil substrate is ideal for white spruce regeneration [29]. As a result, in order to achieve an adequate component of white spruce in regenerating stands, on managed forest lands in the study area between the years 1972–2012 various site preparation (16% of harvested area) and assisted tree regeneration (predominantly planting of white spruce seedlings; 49% of harvested area) treatments were applied [23].
In addition to issues of timing of seed production and seedbed receptivity, successful white spruce regeneration must overcome strong early competition. The early growth of white spruce is slower than specialized early-successional species established by seed and asexually regenerated species such as Alaska birch (Betula neoalaskana Sarg.), quaking aspen (Populus tremuloides Michx.), and bluejoint (Calamagrostis canadensis (Michx.) P. Beauv.) [3,30,31]. Calamagrostis is the major species of concern as a competitor of white spruce regeneration because it spreads rapidly by belowground rhizomes and restricts white spruce seedlings establishment and growth [32]. As a result, when Calamagrostis is present prior to harvest, site preparation is typically applied following harvest to remove the organic layer and belowground rhizomes of competitive vegetation [2,5]. Additionally, when state minimum stocking standards (1112 seedlings (diameter at breast height < 2.5 cm) ha−1) are not met or not expected to be met, forest managers often require planting of white spruce seedlings [33].
In Interior Alaska, the use of wood for home heating and energy generation is expected to increase to meet fossil fuel reduction goals and to provide relief from high fossil fuel prices, especially in remote communities off the road system [34]. As of 2015, nine wood biomass energy facilities have been built in Interior Alaska with another ten under construction, and more than eleven are in design or feasibility status [35]. In contrast to many other forest regions, wood biomass for energy can be, and often is, the entire goal of a harvest, not simply as a byproduct generated after large dimension trees are removed. Energy demands for woody biomass are both expanding total forest harvest and changing the conventional forest management paradigm from production of large-dimension white spruce timber (the strongly dominant management goal) to a slowly expanding harvest of other species and size classes in addition. The harvest cycle is also likely to be shorter for biomass harvest than for large-dimension wood products, requiring more frequent regeneration over a given period of time [36]. Due to limited resources for management, including research, and until recently low demand for timber harvest overall, a clear, empirically based understanding of the effects of harvest has not been available. As a result, in order to meet the needs of this evolving forest management situation while ensuring sustained yield wood production, it is crucial to identify the effects of forest harvest and post-harvest management on the regeneration of not just white spruce, but other species as well.
The total area harvested in this part of the boreal forest is relatively small when compared to boreal Canada, Fennoscandia, and Russia [25,37,38]. However, during the past 40 years of regeneration under systematic silvicultural practices the total area harvested has accumulated to be more than 7000 ha. Although unconstrained logging occurred in the early 1900s near a few early population centers, river banks, and gold mines [24,39], in this study we analyze only the last 40 years of post-harvest regeneration because of the lack of records before that time period [39].
The objective of this study is to evaluate the effects of harvest methods over the past 40 years and the subsequent management practices on post-harvest tree regeneration in central Interior Alaska. To achieve this objective, we evaluated the harvest type, site preparation method, and reforestation techniques used in order to assess the differences in forest regeneration outcomes in terms of species presence, dominance, basal area, and total woody biomass. There are a few studies examining the effects of various harvest and reforestation practices on post-harvest regeneration in Interior Alaska, but those have occurred on small experimental plots [2,3,5,40]. This study is the first landscape-scale study in central Interior Alaska to examine both temporal and spatial effects of mature forest harvest on regeneration in an operational context.

2. Materials and Methods
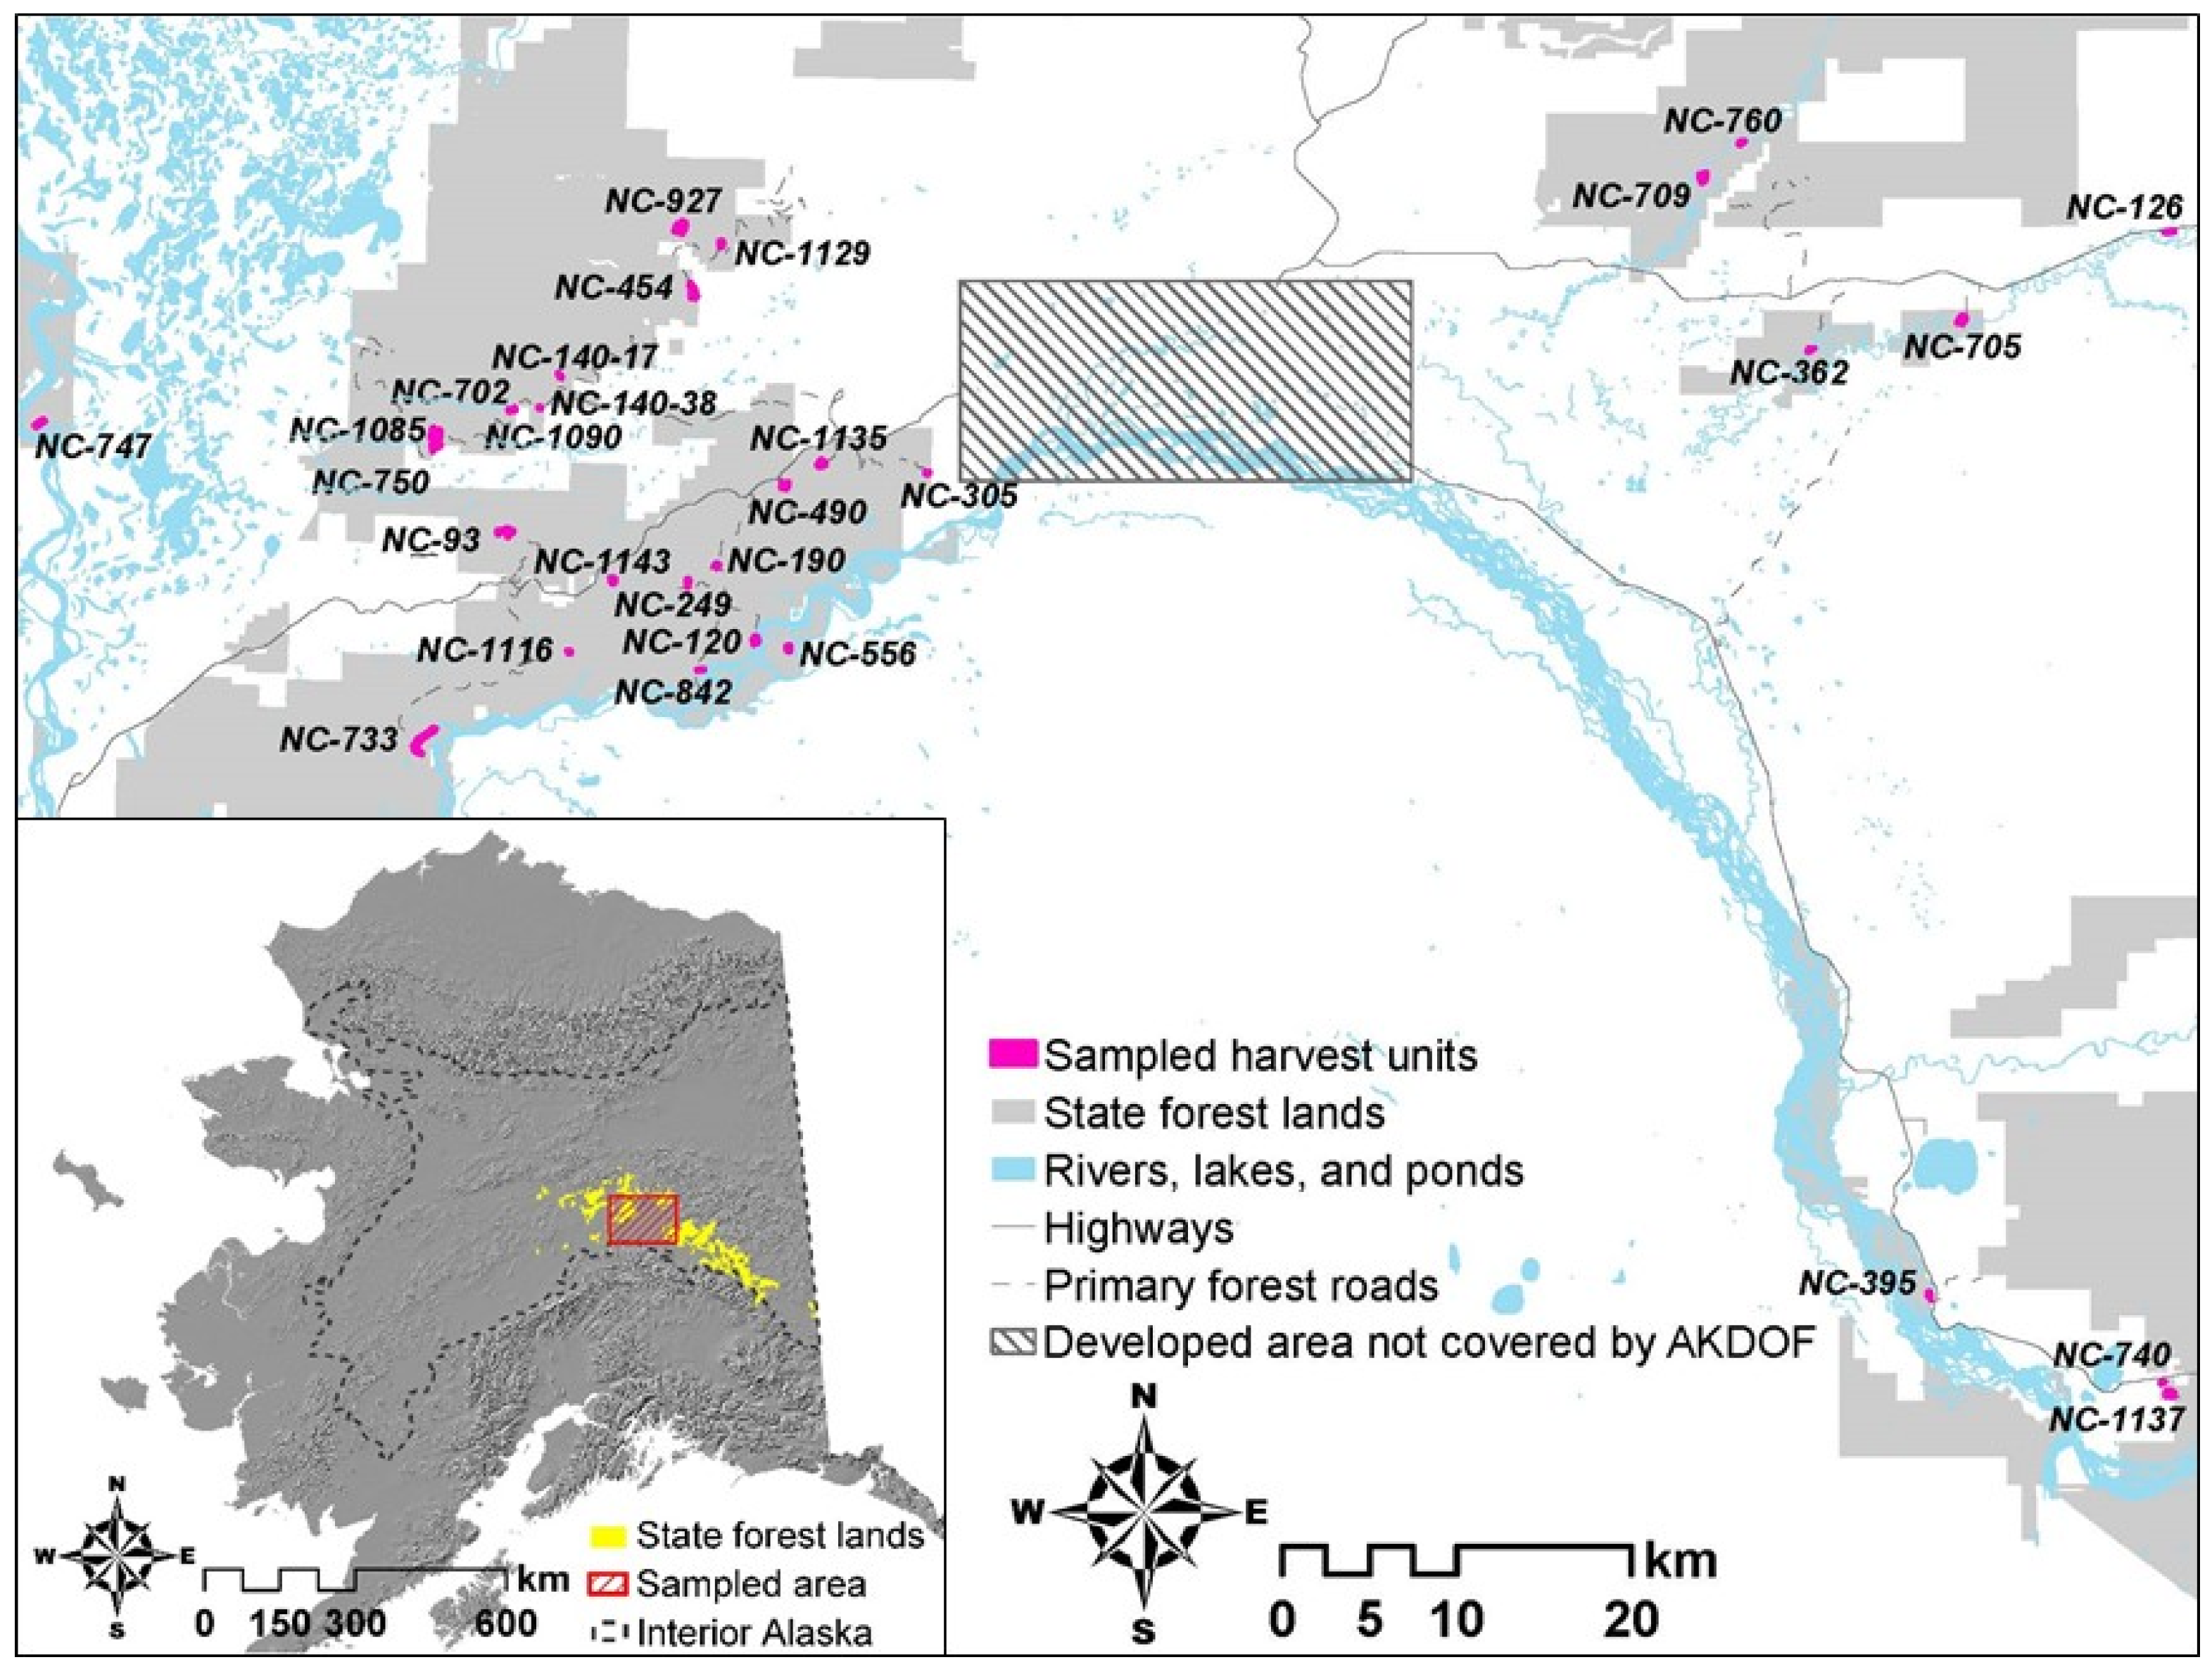
2.1. Study Area

The study area is located in the greater Interior Alaska boreal forest which stretches from the Alaska Range in the south, the Brooks Range to the north, the Canadian border in the east, and the Chukchi Sea to the west, covering approximately 47 million ha in total (Figure 1). The study was conducted within the Fairbanks and Kantishna Management Areas of the Tanana Valley State Forest and adjacent “forest classified” lands (“state forest lands”; Figure 1) which cover 578,575 ha in Alaska, USA. These lands are available for multiple uses, including sustained yield forest management. The Interior Alaska boreal forest is composed primarily of white spruce, black spruce (Picea mariana (Mill.)), Alaska birch, quaking aspen, with minor amounts of balsam poplar (Populus balsamifera L.), and tamarack (Larix laricina (Du Roi) K. Koch) [41]. The most extensive forest cover types in the Tanana Valley State Forest and adjacent state lands are black spruce and mixed white spruce-hardwood types [42]. Although black spruce forest type is the most extensive, it generally occurs on low-productive, permafrost underlain soils, resulting in low productivity [43]. In contrast, white spruce types often occur on the most productive sites resulting in high productivity [43]. Soils are mostly silt loams formed from loess parent material [44] and elevations range from 100 m to 600 m.
Climate of the study area is strongly continental and varies substantially across topographic factors, including elevation and aspect [45]. The mean annual temperature for the region is −2 °C, with extreme temperatures ranging from −50 °C to 35 °C and annual precipitation of 270 mm, with about one third falling during the cold season (October through April) months. The area currently experiences a growing season of approximately 123 days [46]. However, meso-climate in the region varies substantially according to factors such as elevation and aspect [45]. Temperature inversion is a major factor that creates great temperature variation across elevation, particularly in winter [45]. Aspect also affects temperature variability because of the low-angle of the sun [45]. South-facing slopes are generally warmer and drier compared to north-facing slopes that are cold and wet, and often underlain by permafrost [45].

2.2. Silvicultural Systems

The two primary harvesting methods used within the study region have been clearcutting and various partial cutting systems. Both of these systems have been applied for both green wood and post-fire salvage harvests. The clearcut system, as used in the study area, ranged from a conventional clearcut, to a “clearcut with reserves”, as defined by Society of American Foresters [48]. Partial cuts, however, typically involved one of two types: the removal of a single species from mixed stands, predominantly white spruce, or an intermediate harvest with diameter limits [33]. Regardless of the harvest system, only whole tree harvesting was performed. All sampled regeneration units examined in this study were dominated by mature white spruce before harvest, and all stands originated from either wildfire or primary succession following flooding [23]. Although harvest of other species is likely to increase in the future, white spruce has been the major harvested species in the study area. As a result, this study examined only units that were either clearcut or partial cut for white spruce. Partial harvest units of hardwood types or post-fire salvage logging were excluded. All harvest units sampled experienced a single entry harvest between the years 1975 and 2004 and then were not subsequently disturbed by wildfire to the year sampled (2013 or 2014). The site preparation treatments used most frequently in the region and captured in this study involved mechanical scarification using either a bulldozer blade or a disk trencher [23]. Although different site preparation methods may affect regeneration slightly differently, we categorized harvest units that received any site preparation as scarified regardless of the method used. We believe this approach was justified because the main effect produced by these methods is to break up the thick organic layer of mature spruce stands and produce areas of seedbed suitable for white spruce seedling establishment. The combination of the various site disturbance methods was also necessary to have adequate replication of management treatments given the limited number of units that received site preparation.
All harvest units relied either on natural regeneration, white spruce artificial regeneration, or small amounts of planted exotic conifers. Within the study area, the most common artificial regeneration technique was the planting of container stock using locally sourced seeds [49]. In this study, we included only harvest units that experienced natural regeneration or planting of white spruce seedlings from container stock. Planting densities were generally either 2.4 m spacing (1483 trees·ha−1) or 3 m spacing (1075 trees·ha−1).
Within the study region, historical harvest units vary in size from ~1 to a few hundred ha. The size distribution of the harvest units was positively skewed, with a median of 4.66 ha and a mean of 10.89 ha. In this study, we excluded the smallest units (<1 ha) and extremely large units (>40 ha) because of the small number of units in these size ranges. As a result, the harvest units included in this study ranged from 1.4 to 30.3 ha in size. The total area sampled was 269 ha, accounting for approximately 3.5% of the total 7000 ha harvested in the Fairbanks and Kantishna areas of state forest lands in Interior Alaska since 1972 [23].

2.3. Sampling Design

We investigated 30 separate harvest units located in the Fairbanks and Kantishna areas of state forest lands from the Fairbanks office of the Alaska Department of Natural Resources Division of Forestry (AKDOF) Forest Management Database (FMD; Tables S2 and S3) [23]). The FMD is a file geodatabase which includes the location and types of all forest management activities that has occurred on state lands within the Fairbanks and Kantishna areas (see Figure 1) since 1972. Using this database, we selected representative harvest units that were evenly distributed across harvest types (16 clearcut and 14 partial cut units), site preparation methods (11 scarified and 19 unscarified units), reforestation techniques (16 planted and 14 naturally regenerated units), year of timber sale, and size of harvest units. Sample harvest units were also selected to achieve wide geographical coverage across the study region (Figure 1, Table 1).
To quantify tree regeneration, we used 1.69 m radius circular plots, the same plot size as operational AKDOF reforestation surveys [33]. We determined plot sampling intensity based on a preliminary test of sampling efficiency using a censused population of white spruce located in the study region [50]. Based on this analysis, we used four 1.69 m radius circular plots·ha−1 as our sampling intensity. To determine the placement of plots, we created a virtual 50 m × 50 m grid with points at the center of each cell over the entire study area using the Fishnet tool (ArcGIS 10.2, Esri, Redlands, CA, USA). The points falling within the selected harvest units represented the center of the plots. The number of plots in each unit varied between 7 and 120 due to the size and geographic configuration of the harvest units (Table 1). We prioritized sampling a large number of harvest units over intensive sampling in a single harvest unit to cover a greater geographic area, and allow more replications of management practices and years. Because of this strategy, when the calculated number of plots was greater than 50, the sampling intensity was truncated to 50 or fewer by sampling every other or every third plot. In units where only every other plot was sampled, sampled plots were evenly distributed starting from the first plot. The coordinates of the plots (±1 m) were exported to Trimble Pro XT GPS unit (Trimble Navigation, Sunnyvale, CA, USA) and were used to navigate to the sample plot centers in the field.

2.4. Data Collection and Preparation

2.4.1. Response Variables

Field sampling was conducted during the summers of 2013 and 2014. Within each plot, we counted all live white spruce regardless of diameter at breast height (DBH), and live birch, aspen, balsam poplar, and black spruce <1 cm in DBH. When a live white spruce crossed the DBH plane, we measured total height and DBH. We measured DBH and height if live birch, aspen, balsam poplar, and black spruce were 1 cm or greater in DBH. Residual stems were distinguished from regeneration based on estimated age of the tree, and excluded from analysis. The sampling protocol for this study will be made available at Bonanza Creek Long Term Ecological Research Site website [51].
Although our response variables were initially collected as continuous variables, we categorized the variables into binary classes to obtain high accuracy for robust and reliable inferences. We predicted presence/absence for an “all size” group and for a sapling group (DBH > 2.5 cm) of white spruce, birch, and aspen. We identified dominant species in each plot in terms of stem density, and assigned 1 (dominant) or 0 (not dominant) to each species by the size class. If the stem density of different species was the same, and a third species was either absent or present at lower density, both species were classified as dominant (assigned 1). Basal area and biomass were categorized into 1 (high) or 0 (low). For basal area, we set thresholds of 0.5, 1, and 0 m2 for white spruce, birch, and aspen, respectively, so that the binary classes were well balanced. For woody biomass calculation, we used biomass equations established using samples from Interior Alaska [52]. The equations follow the form:
Y = α1·DBH + α2·DBH2 + α3·height
where Y is the total above ground biomass (grams), and α1, α2, and α3 are specific empirically determined coefficients for each species. We combined biomass accumulation of each woody species (white spruce, birch, aspen, balsam poplar, and black spruce) and the aggregated biomass accumulation was categorized into high (≥5 t·ha−1) and low (<5 t·ha−1).

2.4.2. Predictors

All the predictors used in our TreeNet classifications are listed in Table 2. We obtained the values of field predictors at the center of a 50 m × 50 m lattice grid. The predictors were either publicly available or obtained from AKDOF files. We examined data and tested reliability where possible (e.g., alternative digital elevation model (DEM) data), and chose the most reliable of the publicly available data. Although the coarsest resolution was 771 m for the climate variables, we did not rescale the other predictors which had finer resolution to 771 m. We believe this approach is valid because it can be assumed that climate is largely uniform within the grid cells and topographic variables account for the mesoscale climate variations if they exist. Type and year of harvest, site preparation, and reforestation, and size of harvest unit were obtained from the FMD [23]. Elevation (m), aspect, slope (degree), and topographic position index (TPI) were obtained from a 5-m resolution DEM created by Geographic Information Network of Alaska (GINA) in ArcGIS. This DEM has 90% probability of 3 m vertical accuracy, and 90% probability of 12.2-m horizontal accuracy. The GIS data and metadata for the DEM are available at http://ifsar.gina.alaska.edu/. Aspect was transformed using the following equation:
1 − cos((2π × aspect/360))/2
where aspect is measured in degrees. Slope was considered flat when it was smaller than 5 degrees. TPI was calculated using Land Facet Corridor Designer, v. 1.2.884 tool [53] in ArcGIS.
We used the AKDOF forest type map (see details in [42,54]) to calculate distances (m) from each plot within a harvest unit to various features with the “Generate Near Table” tool in ArcGIS. The features include stands of white spruce forest, birch forest, aspen forest, water features, highways, forest roads, developed area, and urban area [54]. In some cases, the sampled harvest unit might have had a white spruce stand closer than indicated on the current forest type layer because of harvest in the landscape surrounding the sampled unit. In such cases, harvests nearest to sample units were considered white spruce forests if they were harvested eight years or more following the harvest of the sample units. We used eight years because white spruce most likely produces medium to large seed crops every seven years [27]. We assigned soil subgroups to each plot in ArcGIS using soil maps obtained from the US Department of Agriculture Natural Resources Conservation Service [55].
Downscaled historical average monthly temperature and monthly precipitation from 1975–2009 were obtained from the Scenarios Network for Alaska + Arctic Planning [56]. The resolution of downscaled climate data is 771 m. We used climate data of the growing season (May–August) because tree growth is greatly affected by climate variables of these summer months [57,58,59,60]. We averaged mean monthly temperatures and total monthly precipitation of twenty years post-harvest, which is the most critical time period for tree regeneration [61].

2.5. Statistical Analysis
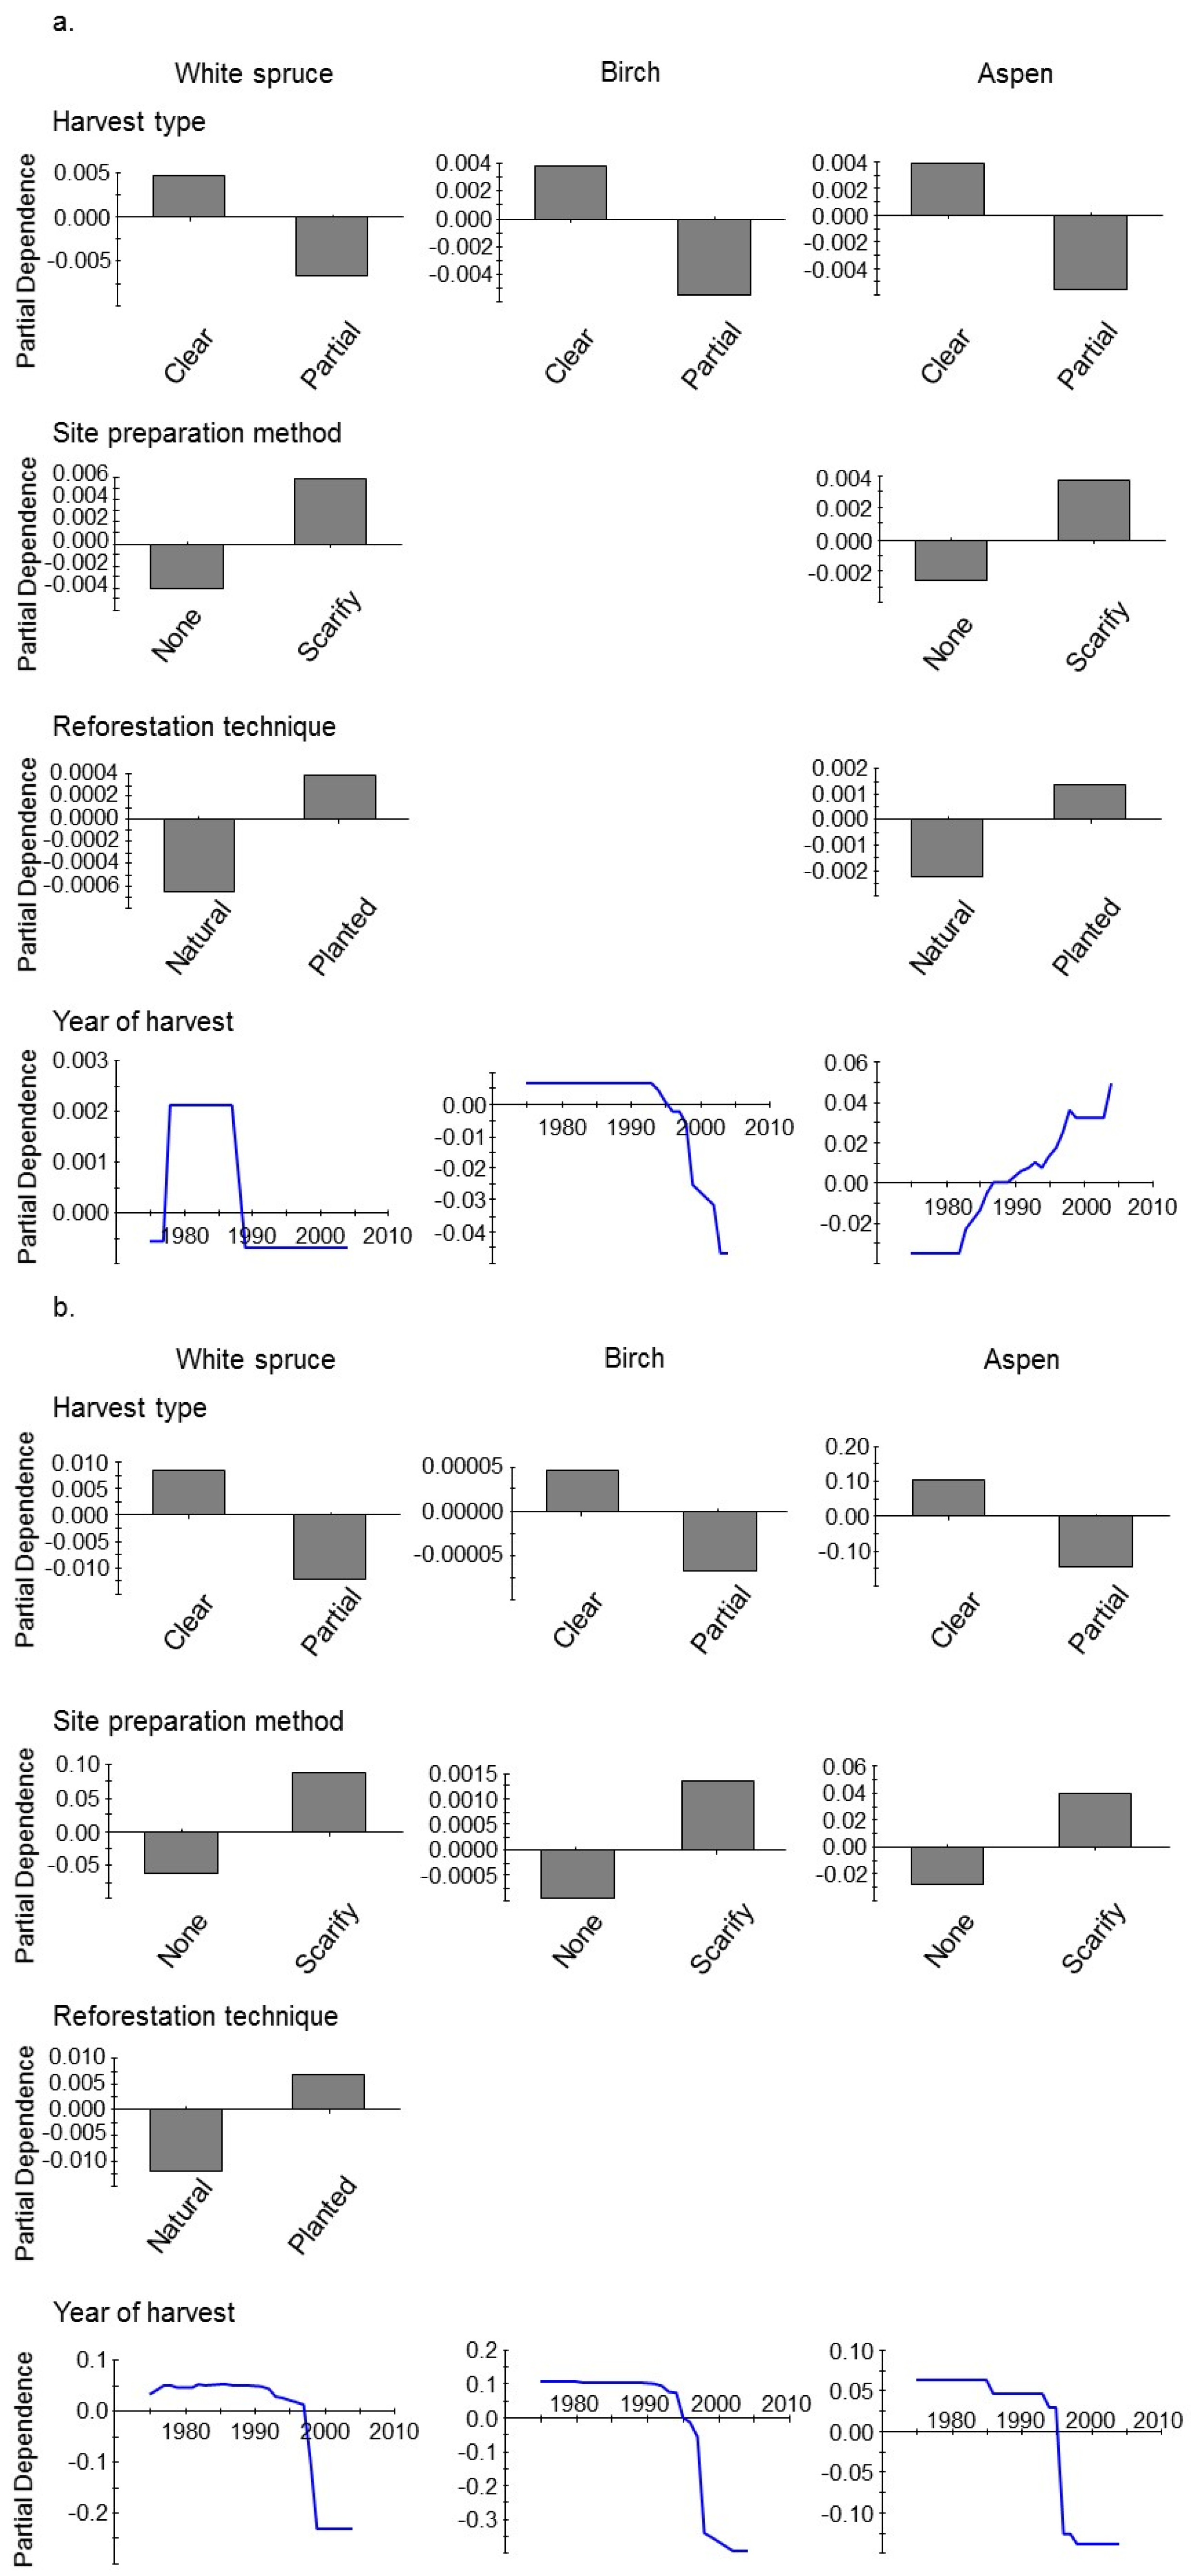
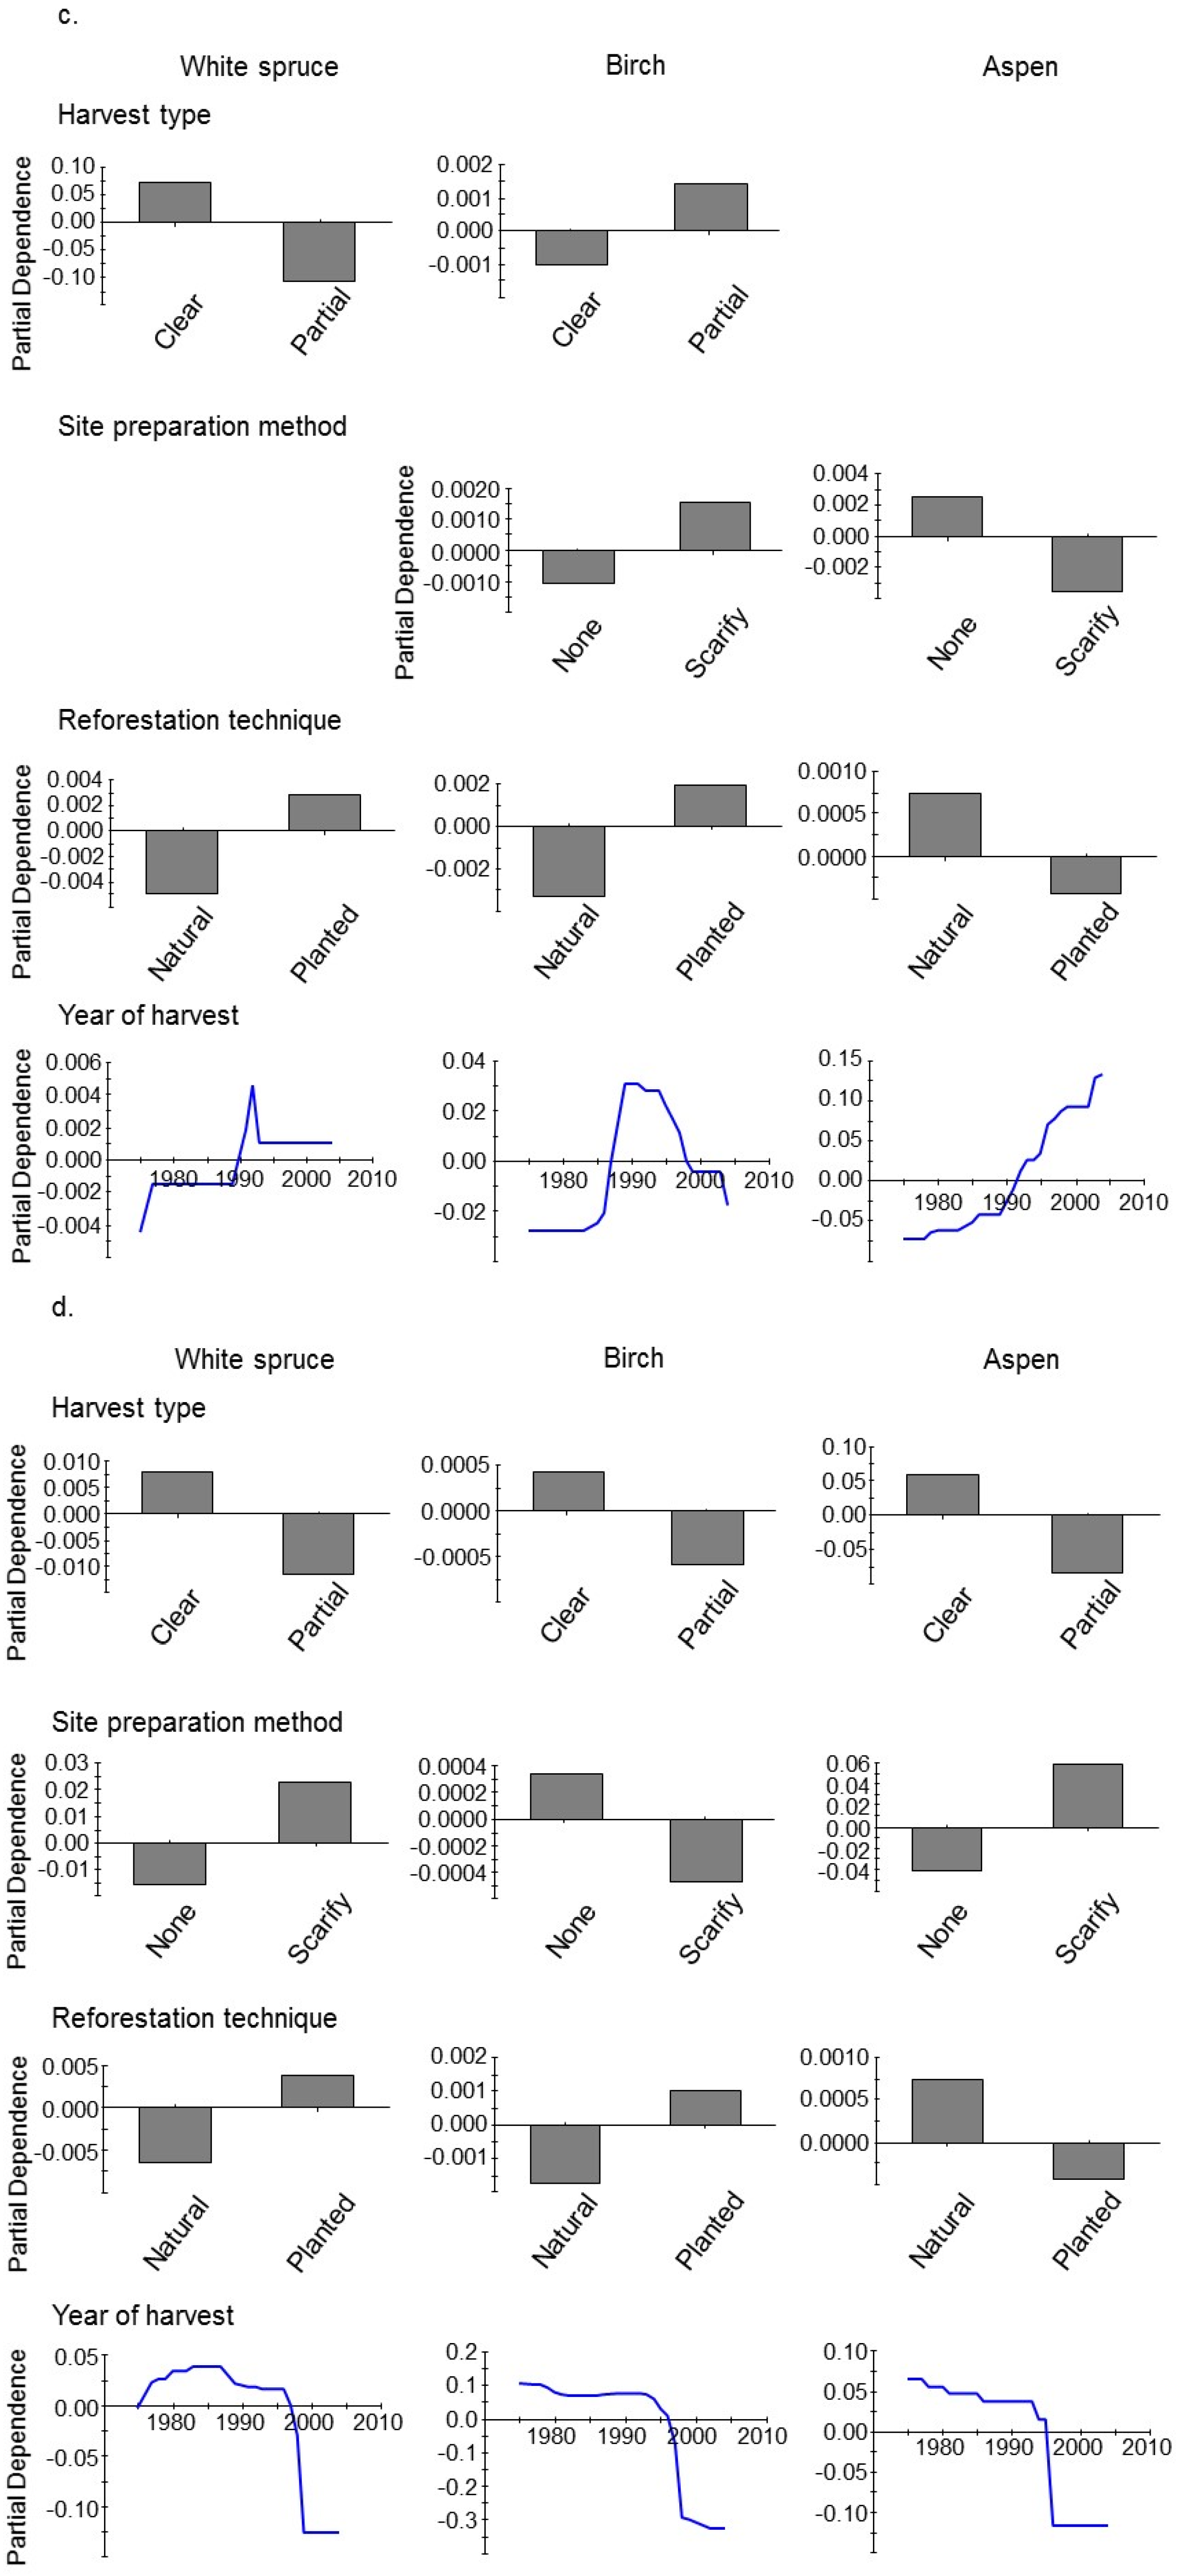
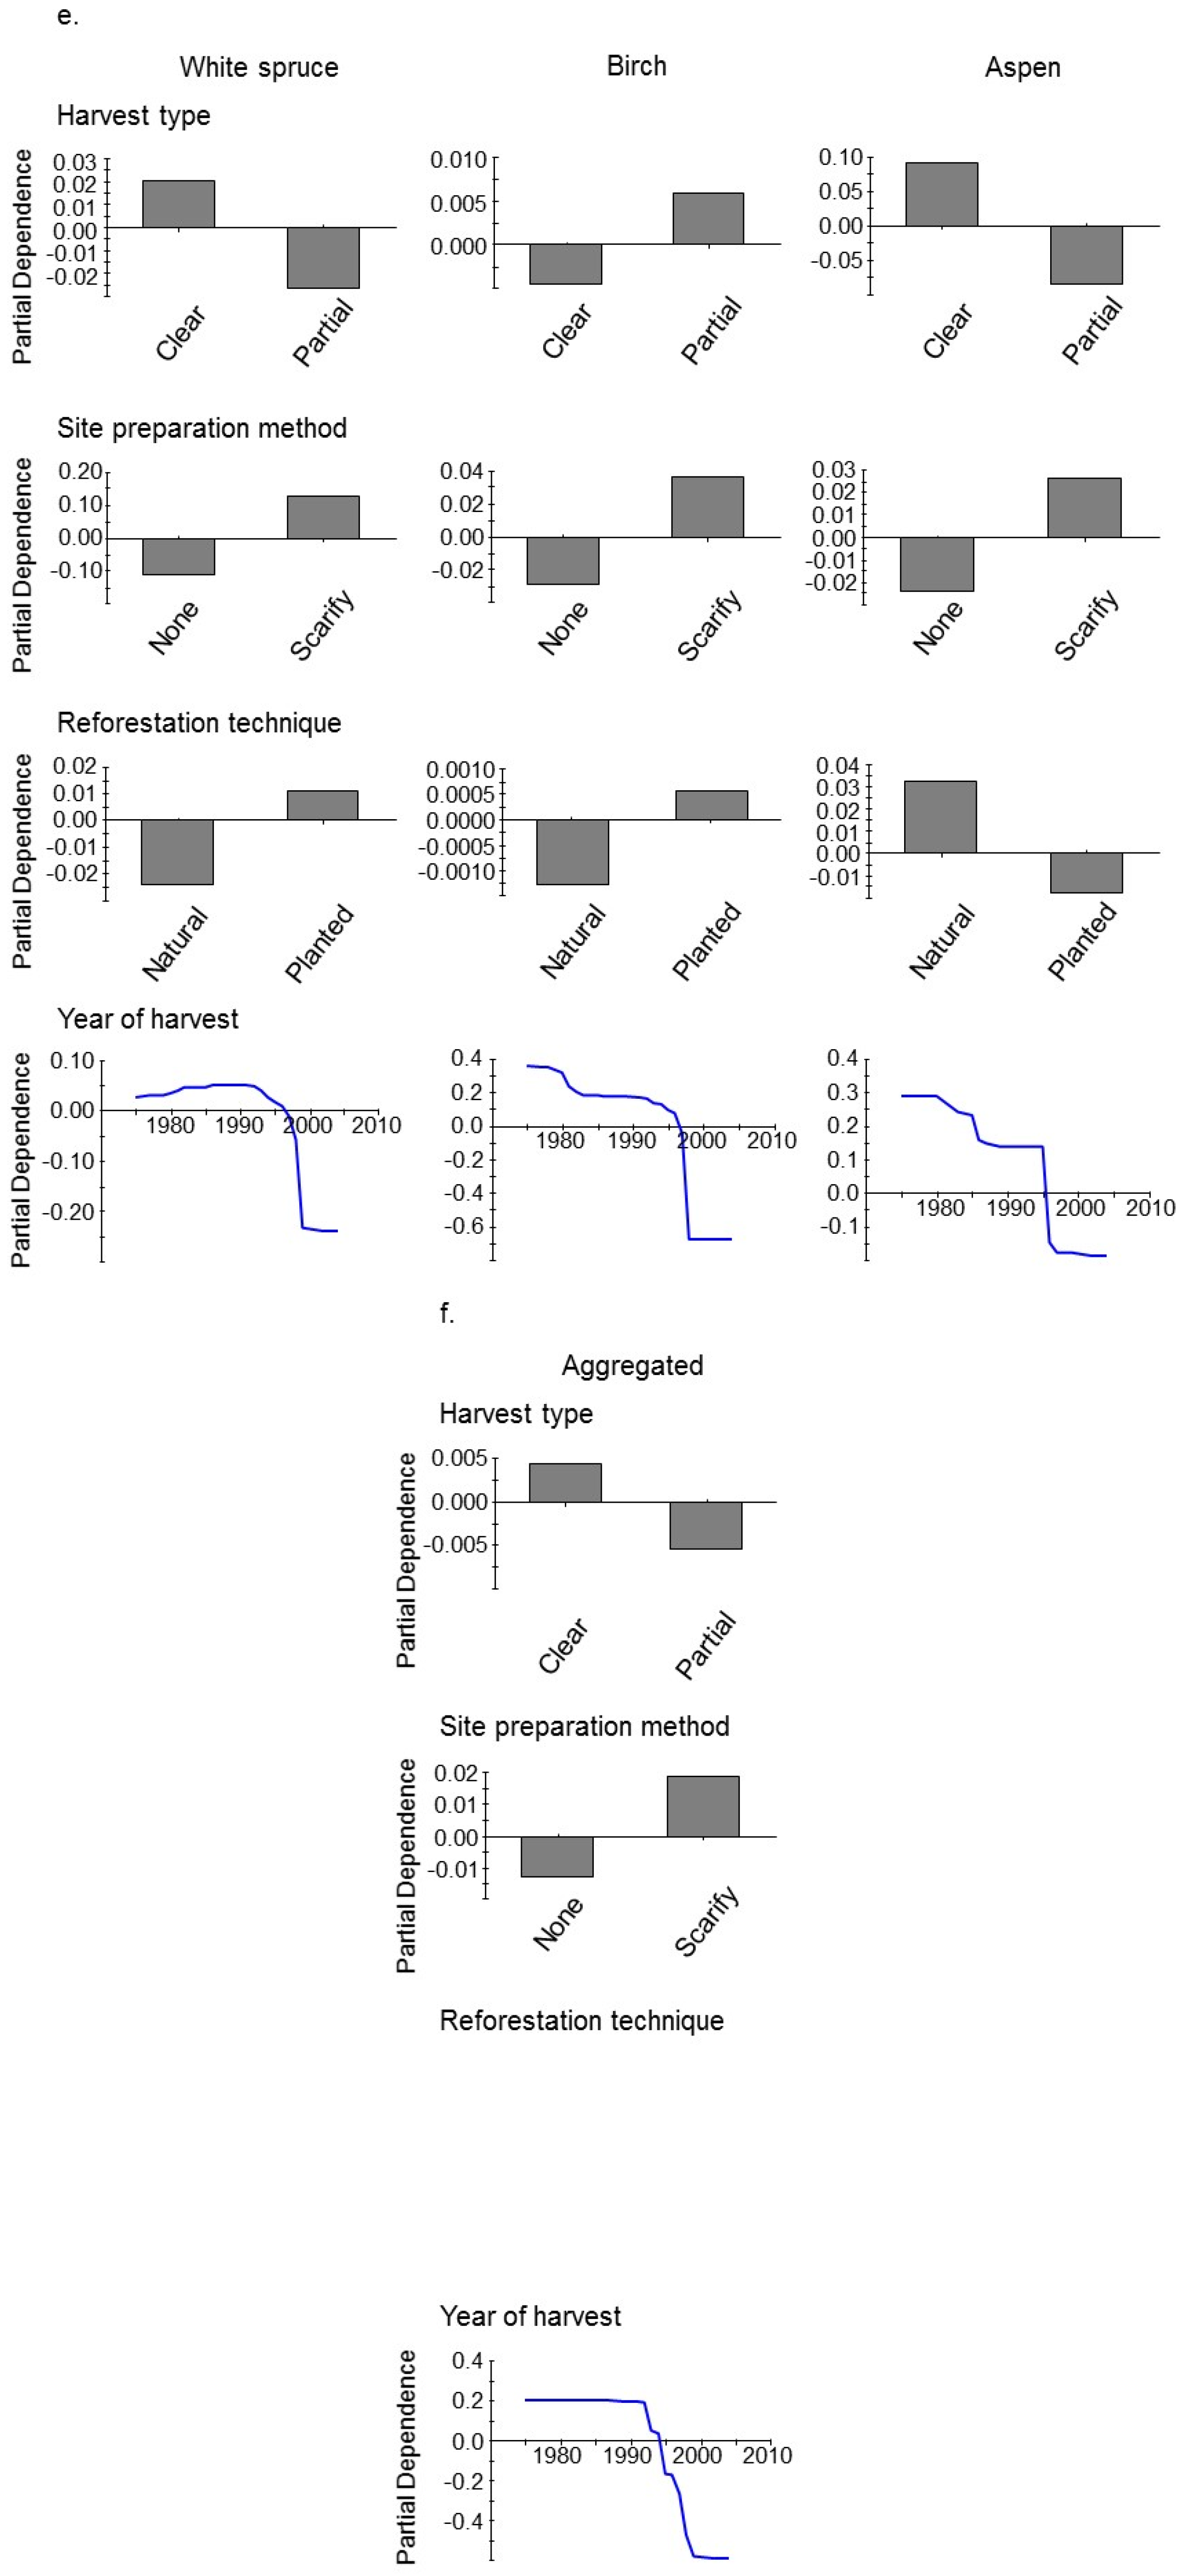
Due to the complex and multivariate nature of the data, we used the non-parametric TreeNet algorithm to predict post-harvest regeneration [62] as implemented in the Salford Predictive Modeler version 7 (Salford System, San Diego, CA, USA). This type of model does not require the same set of assumptions as frequency statistics, such as normality and independence, which are frequently violated when analyzing ecological data [63,64]. TreeNet is known to produce highly accurate predictions even with noisy data [65]. The TreeNet algorithm is often used for prediction, but it is also a powerful tool to mine data and identify relationships between a response variable and predictors by creating partial dependence plots in multivariate settings [63,66]. As a consequence, we chose the TreeNet algorithm to identify the effects of management practices, including harvest, site preparation, and reforestation, on post-harvest regeneration. Although our focus was on the effects of management practices, we built predictive models using all available environmental variables (Table 2) to improve predictive accuracy and to place our results in a greater ecological context for a robust inference.
To construct the decision trees used by TreeNet, a balanced option which rebalances unequal class sizes was selected [67]. We decided to grow 1000 trees, but the actual number of trees generated was optimized by the program for each predictive model [67]. For validation purposes, we used the testing method of cross-validation with a randomly selected 10% sample. All other options were set at program default values [67] which are known to perform well. The model performances were evaluated by applying the predictive model to the complete data set, and obtaining average accuracy and area under the receiver operating characteristic (ROC) curve (AUC). A perfect model will score an AUC of 1, while random guessing will score an AUC of around 0.5 [68].
In order to examine the effects of management practices on post-harvest regeneration, we evaluated relative variable importance and created partial dependence plots. The importance value for any predictor is determined by averaging the number of times it is selected as a tree node over all trees and squaring improvements in error rate resulting from these nodes [69]. A relative importance value of 100 is assigned to the most important predictor.

3. Results

The TreeNet algorithm predicted species presence/absence, species dominance, basal area, and biomass of regeneration in harvest units at high accuracy using the 27 predictors evaluated (Table 3). AUC values for each prediction mostly exceeded 0.8. The main exception to this result was for the presence/absence of white spruce and birch for the “all size” group (Table 3). Predictive models for aspen displayed the highest accuracy, as demonstrated by the high AUC values among the three species evaluated here. For aspen, AUC values were all above 0.9 (Table 3). The prediction of white spruce was the least successful for all variables except for the presence/absence of the “all size” group. However, even for spruce the AUC values were above 0.8 except in one case (Table 3). Overall, the model performances were more accurate for saplings than the “all size” group for both presence/absence and dominance of all species (Table 3). For each species, the prediction was most successful for basal area among all the variables (Table 3). Predictive accuracies were well balanced between two classes (presence/absence, dominant/not dominant, and high/low; Table 3). The TreeNet algorithm provided reproducible and robust models, and findings, in our data set.
The different management practices, including harvest type, site preparation, and reforestation, were generally not found to make as great a contribution to accurate predictions as the environmental variables (Figure 2a–f). In particular, the reforestation method was one of the least important predictors for the three different species studied here (Figure 2a–f). This indicates a smaller effect due to the management practices on post-harvest regeneration than that of the environmental variables. In general, management practices had greater effects on saplings than on stems of the “all size” group for white spruce and aspen, as indicated by the higher relative importance values for saplings (Figure 2a–d). The importance of management practices for white spruce and aspen varied, with harvest type and site preparation contributing relatively high importance in predictions for these species. The importance of management practices was generally low for birch (Figure 2a–e). Year of harvest was one of the most important predictors for presence and dominance of the sapling group, basal area, and biomass (Figure 2a–f).
The model presented here depicted the trend in species presence/absence, species dominance, basal area, and biomass in response to harvest type, site preparation method, reforestation technique, and year of harvest (Figure 3). White spruce presence, dominance, and basal area tended to be greater in clearcut, scarified, and planted units than in partial cut, unscarified, and naturally regenerated units, except that site preparation did not appreciably contribute to the dominance of the “all size” group (Figure 3a–e). White spruce presence in the “all size” group was lower in units that were logged within 25 years of sampling and higher in units that were logged 25–35 years before, but became lower again in units in which harvest occurred 35 years or more before sampling (Figure 3a). White spruce sapling presence was higher in units with longer time since harvest (Figure 3b). White spruce dominance of the “all size” group was greater in units with shorter time since harvest, while white spruce sapling dominance was greater in units with longer time since harvest (Figure 3c–d). White spruce basal area was low until 15 years after harvest, and became high after that time period (Figure 3e).
Clearcutting resulted in greater birch presence, birch sapling dominance, but lower birch “all size” group dominance and birch basal area (Figure 3a–e). Birch sapling presence and “all size” group dominance were greater in scarified than in unscarified units, while birch sapling dominance and birch basal area were greater in unscarified than in scarified units (Figure 3b–e). Birch dominance and basal area were greater in planted units than in naturally regenerated units (Figure 3c–e). Birch presence, sapling dominance, and basal area were low in units harvested 15 or fewer years before our sampling, and much greater in units harvested more than 15 years before sampling (Figure 3a,d,e). Dominance of birch in the “all size” group was greatest in units harvested 20–25 years or earlier (Figure 3c).
Aspen presence, dominance of sapling, and basal area were greatest in clearcut and scarified units (Figure 3a,b,d,e), although aspen dominance of “all size” group was greater in unscarified than in scarified units (Figure 3c). However, the effects of type of harvest and site preparation were limited on the aspen “all size” group (Figure 2 and Figure 3a,c). Planting spruce seedlings resulted in a lower aspen dominance and basal area, but slightly greater aspen presence (Figure 3a–e). Aspen presence and dominance of the “all size” group were greater in units that were logged more recently, while aspen presence and dominance of saplings, and basal area were greater in units that were logged in earlier years (Figure 3a–e).
Biomass tended to be greater in clearcut and/or scarified units than in partial cut and/or unscarified units (Figure 3f). Reforestation technique (planted vs. natural regeneration) did not contribute to biomass prediction (Figure 2f). Year of harvest was the most important variable for the biomass prediction (Figure 2f). Biomass accumulation was low until 15 years after harvest, and became high after 20 years post-harvest (Figure 3f).

4. Discussion

The trends identified in post-harvest regeneration using a robust TreeNet algorithm provide a unique and useful basis for forest harvest management. However, the predictions need to be interpreted with a recognition of varying contributions of each variable to each prediction indicated by the relative variable importance (Figure 2). Harvest type, site preparation technique, and especially reforestation methods were not the most important among all 27 predictors, particularly for birch. This result indicates that post-harvest regeneration outcomes cannot be successfully evaluated by management practices alone. Even so, by incorporating all the predictors TreeNet analysis identified trends in post-harvest regeneration described below (Figure 3).
The effect of harvest type on post-harvest regeneration was relatively consistent with the inference that clearcutting resulted in greater presence, dominance, and basal area of white spruce and aspen of any size groups, and greater presence of birch of any size groups when compared to partial cutting. The effect of harvest type was greater on sapling presence, dominance, and basal area than the “all size” group for both white spruce and aspen (Figure 2a–d). Clearcut units supported greater biomass accumulation (up to 40 years) than partial cuts, because of the overall greater predicted presence of the three tree species and greater basal area of trees in clearcuts than partial harvest stands (Figure 3). Both white spruce and aspen experience optimal growth under full light conditions [70,71], which were created by clearcutting. Clearcutting also promotes aspen suckering [71]. Although greater growth of white spruce in clearcuts is consistent with results from individual research plots in Interior Alaska [3] and in Alberta boreal mixed wood [72], our results now demonstrate that this effect was also achieved at the operational and landscape scale.
On the other hand, although birch was more likely to appear in clearcuts than in partial cuts, birch dominance of the “all size” group and birch basal area were greater in partial cuts than in clearcuts (Figure 3). This result is somewhat inconsistent with previous studies that demonstrate greater growth of birch under greater amounts of sunlight often present in clearcuts [73,74,75]. There was perhaps less competition in partial cuts than in clearcuts due to the lower presence and dominance of regenerating white spruce and aspen, which could have allowed greater birch dominance and growth. Even so, the contribution of harvest type to predictions of birch in harvest regeneration outcomes was low, and so environmental factors appear to affect birch regeneration more than harvest type. This is also consistent with the ability of birch to regenerate prolifically, both asexually from sprouts and from seeds, across a wide range of disturbances [73].
Although we found that clearcutting resulted in greater subsequent white spruce presence, it should be noted that a lack of seed trees can become a limiting factor for white spruce regeneration [25,76]. During mast years, white spruce seeds are wind dispersed, with the greatest number of seeds falling within 100 to 150 m from the source tree [30]. Timoney and Peterson [25] found that in boreal Canada spruce recruitment following clearcutting was poor due to the size of the clearcut (most clearcuts exceeded 100 ha). In contrast, in Interior Alaska clearcut sites supported similar white spruce regeneration density as units that received a shelterwood harvest, a regeneration harvest technique that leaves white spruce seed trees on the harvest site [5]. The size of clearcut units was only 1.3 ha in the earlier shelterwood study [5]. Such small clearcuts provide ample opportunities for unharvested trees outside the units to disperse seeds into the units. Because most clearcut units in our study were smaller than 10 ha, it is reasonable to infer that similar seed dispersal processes took place in the operational harvests as in the shelterwood research study. Our analysis of the configuration of the sampled harvest units shows that over 90% of plots were within 100 m of the harvest unit perimeter, with the greatest distance of 150 m. Harvest units in reality rarely approached a circular configuration, which for a unit of 10 ha in size would create a maximum distance from the harvest edge of 180 m. This means that in our sampled regeneration units of 10 ha or smaller, the actual distance from the harvest perimeter was generally much less than 180 m. Therefore, we tentatively conclude that harvests smaller than 10 ha would, for the most part, not need retained seed trees within the harvest stands for white spruce regeneration.
In Interior Alaska, although profound negative effects of clearcutting have not been found, the major harvest method has been shifting from clearcutting to partial cutting primarily due to social and ecological concerns about clearcutting which have been reported in other boreal regions. In Interior Alaska, clearcutting at the current (small) scale does have some advantages compared to partial cutting, particularly because clearcutting appears to promote regeneration, and is more operationally efficient and thus more economical [77]. In addition, clearcutting in general has to be small because of the predominantly small size of pure white spruce stands that are the main target of harvest. On the other hand, clearcutting (in the literal sense of complete tree removal) removes some legacy forest structures that are important to wildlife or ecological value that could be retained in a partial cutting system. As a result, clear management objectives are necessary in order to choose the optimal harvest method.
Site preparation resulted in greater presence, dominance, and basal area of spruce, birch, and aspen in most cases (Figure 3). Site preparation has been widely demonstrated to enhance seedbed quality for tree regeneration [73,78], thus promoting more vigorous trees that can achieve higher rates of both below- and above-ground growth. Several experimental studies in Interior Alaska have reported that site preparation results in higher density and/or growth of white spruce [2,3,5,79], and in the boreal forest of Canada [22,80]. Our study now establishes that these gains are also achieved in operational practices up to 40 years following harvest. Moreover, site preparation also appears to have positive effects on birch and aspen regeneration. The increases in the presence and basal area of birch and aspen due to site preparation appear to be the result of exposure of a mineral soil substrate compared to the undisturbed forest organic layer [71,73]. One exception to this, however, appears to be the lower dominance of birch saplings and the aspen “all size” group on scarified compared to unscarified sites (Figure 3). This reversal of the general scarification effect appears to be related to the greater dominance by other species, and the relative importance of site preparation on these response variables was low, indicating the magnitude of differences were small (Figure 2). In general, site preparation following harvest promoted greater tree establishment and growth, which subsequently resulted in greater biomass accumulation (Figure 3).
While we found that site preparation typically results in greater success of regeneration, site preparation can at times result in stunted stems and roots due to intense competition during the stem exclusion phase [5] For example, unit NC-305 in our study supported very dense white spruce regeneration, 31,814 ± 12,558 stems·ha−1. This unit was logged in 1987, followed immediately by site preparation, during a year of exceptionally large white spruce seed production [27]. Although the amount of biomass in this unit was greater than the average in other harvest units, the mean diameter of regenerated stems was low, so that many years of additional growth will be required to produce harvestable material. In such a case, the optimal management approach might be to limit site preparation during the mast year. In order to do this, white spruce cone crops can be estimated by the previous year’s seed production and visual inspection of bud primordia [78,81].
For the last few decades, foresters in Interior Alaska have used assisted regeneration techniques for white spruce [23] in order to sustain the species on some sites and promote large, well-positioned trees from the earliest stage of stand development. In fact, planting white spruce seedlings did result in greater white spruce presence, dominance, and basal area. However, the effects of planting on white spruce regeneration overall were very low (Figure 2a–e). In addition, dominance and basal area of aspen were lower in planted units than in naturally regenerated units (Figure 3), and reforestation did not contribute to prediction of biomass accumulation (Figure 2f). This result suggests that planted spruce seedlings suppressed natural regeneration of other species, although we cannot explicitly conclude this because of the low relative importance of the reforestation predictor term, and we do not have direct measurements of suppression. Due to the fact that planting white spruce seedlings is the most expensive post-harvest regeneration procedure, foresters should carefully evaluate the necessity of planting white spruce, and use this technique primarily in circumstances where the benefits are most likely to outweigh such undesired effects. Such circumstances include a management goal of producing large dimension white spruce in the shortest possible time, or regenerating spruce when no/low white spruce seed crop is present or predicted. Another possible management option would be delayed, refill planting that is spaced off from the established natural regeneration. On the other hand, if the goal is to produce biomass for energy generation, or to retain natural genetic diversity, then planting white spruce seedlings might have no or even potentially adverse effects.
The year of timber harvest was one of the most important predictors for many of our models, especially in determining basal area and biomass accumulation (Figure 2), because tree size clearly correlates with time since harvest. As expected, basal area and biomass tend to increase over time in the modeled prediction (Figure 3). Presence and dominance of the sapling group (DBH > 2.5 cm) also increase up to 40 years following harvest for all species as a result of tree growth (Figure 3). However, presence and dominance of trees of the “all size” group did not show a simple trend like those of saplings (Figure 3). In the early stage of regeneration, tree recruitment, growth, and mortality occur at different rates for each species, resulting in variability through time in the presence and dominance of seedlings. In addition, white spruce recruitment varies greatly by year due to its sporadic seed production cycle [27]. White spruce presence appears to increase up to 35 years following harvest, birch presence appears to increase up to about 25 years and then decline, but aspen presence shows a clear trend of decreasing for the entire study period (Figure 3). This reflects the early growth rate and the level of shade tolerance of each species [70,71,73]. White spruce has the slowest growth rates of the species measured in this study and is the most shade tolerant, while aspen has the fastest growth rates and is the least shade tolerant [70,71,73]. White spruce seedling recruitment seems to have continued for a longer period than birch and aspen, which are both shade-intolerant species that grow rapidly after disturbance [71,73]. The less shade tolerant aspen begins the self-thinning process earlier than birch (Figure 3). Birch regeneration appears to be determined largely by time since harvest and only marginally by management practices, suggesting that birch regeneration is only minimally affected by the environmental changes created by management practices.

5. Conclusions

The results of this study provide an important quantitative basis for future management planning in the western North American boreal forest. Management practices suitable or acceptable for some forms of biomass production appear to be different than practices traditionally used in the region for conventional spruce-focused management. In our study area, artificial reforestation does not appear to be superior to natural regeneration in obtaining more stems or producing greater biomass. However, clearcutting and site preparation consistently are associated with increased tree regeneration and greater basal area and biomass. As a result, clearcutting and site preparation are adequate as regeneration techniques, and planting white spruce may only be necessary in specific circumstances, such as in no/low white spruce seed crop years, or in landscapes depleted of seed trees. Finally, when biomass production of any species is the management goal, a shift from spruce harvest to birch may be possible, because birch regeneration is likely to be faster and more abundant without the additional effort required for white spruce establishment.

Acknowledgments

This research was funded by a project BAK LAP (Boreal Alaska—Learning, Adaptation, Production) supported by appropriation to the Alaska Department of Natural Resources Division of Forestry, the McIntire Stennis Cooperative Forestry Research Program (ALK13-04), and the Bonanza Creek Long-Term Ecological Research program funded by the National Science Foundation (DEB-1026415). We would like to thank the Fairbanks Area of the Alaska Department of Natural Resources Division of Forestry for providing the data, field equipment, and transportation to the study sites. We thank Salford Systems Ltd. for providing a copy of their software to the EWHALE lab by F. Huettmann, UAF for this study. Lastly, we thank R. Jess and M. Guisa for their invaluable help in the field.

Author Contributions

Miho Morimoto, Glenn Juday, and BrianYoung conceived and designed the sampling; Miho Morimoto performed the sampling and analyzed the data; Miho Morimoto and Glenn Juday wrote the paper.

Conflicts of Interest

The authors declare no conflict of interest.

References

  1. Wurtz, T.L.; Gasbarro, A.F. A brief history of wood use and forest management in Alaska. For. Chron. 1996, 72, 47–50. [Google Scholar] [CrossRef]
  2. Youngblood, A.; Cole, E.; Newton, M. Survival and growth response of white spruce stock types to site preparation in Alaska. Can. J. For. Res. 2011, 41, 793–809. [Google Scholar] [CrossRef]
  3. Youngblood, A.P.; Zasada, J.C. White spruce artificial regeneration options on river floodplains in interior Alaska. Can. J. For. Res. 1991, 21, 423–433. [Google Scholar] [CrossRef]
  4. Densmore, R.V.; Juday, G.P.; Zasada, J.C. Regeneration alternatives for upland white spruce after burning and logging in interior Alaska. Can. J. For. Res. 1999, 29, 413–423. [Google Scholar] [CrossRef]
  5. Wurtz, T.L.; Zasada, J.C. An alternative to clear-cutting in the boreal forest of Alaska: A 27-year study of regeneration after shelterwood harvesting. Can. J. For. Res. 2001, 31, 999–1011. [Google Scholar] [CrossRef]
  6. Chapin, F.; Fastie, C.; Viereck, L.; Ott, R.; Adams, P.; Mann, D.; Van Cleve, K.; Johnstone, J. Successional processes in the Alaskan Boreal Forest. In Alaska’s Changing Boreal Forest; Chapin, F., Oswood, M., Van Cleve, K., Viereck, L., Verbyla, D., Eds.; Oxford University Press: New York, NY, USA, 2006; pp. 100–120. [Google Scholar]
  7. Gauthier, S.; Bernier, P.; Kuuluvainen, T.; Shvidenko, A.Z.; Schepaschenko, D.G. Boreal forest health and global change. Science 2015, 349, 819–822. [Google Scholar] [CrossRef] [PubMed]
  8. Foote, M.J. Classification, Description, and Dynamics of Plant Communities after Fire in the Taiga of Interior Alaska; U.S. Department of Agriculture, Pacific Northwest Forest and Range Experiment Station, Ed.; U.S. Department of Agriculture, Pacific Northwest Forest and Range Experiment Station: Portland, OR, USA, 1983.
  9. Burton, P.J.; Parisien, M.-A.; Hicke, J.A.; Hall, R.J.; Freeburn, J.T. Large fires as agents of ecological diversity in the north american boreal forest. Int. J. Wildland Fire 2008, 17, 754–767. [Google Scholar] [CrossRef]
  10. Chapin, F.S., III; Lovecraft, A.L.; Zavaleta, E.S.; Nelson, J.; Robards, M.D.; Kofinas, G.P.; Trainor, S.F.; Peterson, G.D.; Huntington, H.P.; Naylor, R.L. Policy strategies to address sustainability of alaskan boreal forests in response to a directionally changing climate. Proc. Natl. Acad. Sci. USA 2006, 103, 16637–16643. [Google Scholar] [CrossRef] [PubMed]
  11. Calef, M.P.; Varvak, A.; McGuire, A.D.; Chapin, F.S., III; Reinhold, K.B. Recent changes in annual area burned in interior Alaska: The impact of fire management. Earth Interact. 2015, 19, 1–17. [Google Scholar] [CrossRef]
  12. Johnstone, J.F.; Hollingsworth, T.N.; Chapin, F.S., III; Mack, M.C. Changes in fire regime break the legacy lock on successional trajectories in Alaskan boreal forest. Glob. Chang. Biol. 2010, 16, 1281–1295. [Google Scholar] [CrossRef]
  13. Hollingsworth, T.N.; Johnstone, J.F.; Bernhardt, E.L.; Chapin, F.S., III. Fire severity filters regeneration traits to shape community assembly in Alaska’s boreal forest. PLoS ONE 2013, 8, e56033. [Google Scholar] [CrossRef] [PubMed]
  14. Shenoy, A.; Johnstone, J.F.; Kasischke, E.S.; Kielland, K. Persistent effects of fire severity on early successional forests in interior alaska. For. Ecol. Manag. 2011, 261, 381–390. [Google Scholar] [CrossRef]
  15. Valentine, D.W.; Kielland, K.; Chapin, F.S., III; McCuire, A.D.; Van Cleve, K. Patterns of biogeochemistry in Alaskan boreal forests. In Alaska’s Changing Boreal Forest; Oxford University Press: New York, NY, USA, 2006. [Google Scholar]
  16. Johnstone, J.; Chapin, F. Effects of soil burn severity on post-fire tree recruitment in boreal forest. Ecosystems 2006, 9, 14–31. [Google Scholar] [CrossRef]
  17. Johnstone, J.F.; Kasischke, E.S. Stand-level effects of soil burn severity on postfire regeneration in a recently burned black spruce forest. Can. J. For. Res. 2005, 35, 2151–2163. [Google Scholar] [CrossRef]
  18. Johnstone, J.F.; Chapin, F.S.; Foote, J.; Kemmett, S.; Price, K.; Viereck, L. Decadal observations of tree regeneration following fire in boreal forests. Can. J. For. Res. 2004, 34, 267–273. [Google Scholar] [CrossRef]
  19. Johnstone, J.F.; Rupp, T.S.; Olson, M.; Verbyla, D. Modeling impacts of fire severity on successional trajectories and future fire behavior in Alaskan boreal forests. Landsc. Ecol. 2011, 26, 487–500. [Google Scholar] [CrossRef]
  20. Viereck, L.A.; Schandelmeier, L.A. Effects of Fire in Alaska and Adjacent Canada: A Literature Review; U.S. Department of the Interior, Bureau of Land Management, Alaska State Office: Anchorage, AK, USA, 1980.
  21. Purdy, B.G.; Macdonald, S.E.; Dale, M.R.T. The regeneration niche of white spruce following fire in the mixedwood boreal forest. Silva Fenn. 2002, 36, 289–306. [Google Scholar] [CrossRef]
  22. Boateng, J.O.; Heineman, J.; Bedford, L.; Harper, G.; Nemec, A.F.L. Long-term effects of site preparation and postplanting vegetation control on picea glauca survival, growth and predicted yield in boreal british columbia. Scand. J. For. Res. 2009, 24, 111–129. [Google Scholar] [CrossRef]
  23. Alaska Division of Forestry. Forest management database. Data obtained from Alaska Division of Forestry, Fairbanks, Alaska; 2013. [Google Scholar]
  24. Wurtz, T.; Ott, R.; Maishc, J. Timber harvest in interior Alaska. In Alaska’s Changing Boreal Forest; Chapin, F., Oswood, M., Van Cleve, K., Viereck, L., Verbyla, D., Eds.; Oxford University Press: New York, NY, USA, 2006; pp. 302–308. [Google Scholar]
  25. Timoney, K.P.; Peterson, G. Failure of natural regeneration after clearcut logging in wood buffalo national park, Canada. For. Ecol. Manag. 1996, 87, 89–105. [Google Scholar] [CrossRef]
  26. Franklin, J.F.; Berg, D.R.; Thornburgh, D.A.; Tappeiner, J.C. Alternative silvicultural approaches to timber harvesting: Variable retention harvest systems. In Creating a Forestry for the 21st Century: The Science of Ecosystem Management; Kohm, K.A., Franklin, J.F., Eds.; Island Press: Washington, DC, USA, 1997; pp. 111–139. [Google Scholar]
  27. Roland, C.A.; Schmidt, J.H.; Johnstone, J.F. Climate sensitivity of reproduction in a mast-seeding boreal conifer across its distributional range from lowland to treeline forests. Oecologia 2014, 174, 665–677. [Google Scholar] [CrossRef] [PubMed]
  28. Juday, G.P.; Barber, V.; Rupp, S.; Zasada, J.; Wilmking, M. A 200-year perspective of climate variability and the response of white spruce in Interior Alaska. In Climate Variability and Ecosystem Response at Long-Term Ecological RESEARCH Sites; Greenland, D., Goodin, D.G., Smith, R.C., Eds.; Oxford University Press: New York, NY, USA, 2003. [Google Scholar]
  29. Zasada, J.C.; Gregory, R.A. Regeneration of White Spruce With Reference to Interior Alaska: A Literature Review; Research Paper PNW-79; Institute of Northern Forestry, U.S. Forest Service: Washington, DC, USA, 1969; p. 37.
  30. Youngblood, A.; Max, T.A. Dispersal of White Spruce Seed on Willow Island in Interior Alaska; USDA Forest Service Pacific Northwest Research Station Research Paper; USDA: Washington, DC, USA, 1992; pp. U1–U17.
  31. Youngblood, A. Regenerating White Spruce in Boreal Forests of Alaska. Land and Ecosystem Management, 2012. Available online: http://www.fs.fed.us/pnw/lwm/lem/projects/youngblood_alaska.shtml (accessed on 2 May 2013).
  32. Lieffers, V.I.; Macdonald, S.E.; Hogg, E.H. Ecology of and control strategies for Calamagrostis Canadensis in boreal forest sites. Can. J. For. Res. 1993, 23, 2070–2077. [Google Scholar] [CrossRef]
  33. Alaska Division of Forestry. Reforestation Handbook; Alaska Department of Natural Resources Division of Forestry: Fairbanks, AK, USA, 2008.
  34. Fresco, N.; Chapin, F.S., III. Assessing the Potential for Conversion to Biomass Fuels in Interior Alaska; U S Forest Service Pacific Northwest Research Station Research Paper PNW-RP; US Forest Service: Washington, DC, USA, 2009; pp. 1–56.
  35. Alaska Energy Authority. Alaska Wood Energy Development Task Force Project Status; AWEDTG_Status_081315_8.5×11; AEA: Anchorage, AK, USA, 2015. [Google Scholar]
  36. Janowiak, M.K.; Webster, C.R. Promoting ecological sustainability in woody biomass harvesting. J. For. 2010, 108, 16–23. [Google Scholar]
  37. Burton, P.J.; Messier, C.; Adamowicz, W.L.; Kuuluvainen, T. Sustainable management of Canada’s boreal forests: Progress and prospects. Ecoscience 2006, 13, 234–248. [Google Scholar] [CrossRef]
  38. Larsson, S.; Danell, K. Science and the management of boreal forest biodiversity. Scand. J. For. Res. 2001, 16, 5–9. [Google Scholar] [CrossRef]
  39. Roessler, J.S.; Packee, E.C. Disturbance history of the Tanana River Basin in Alaska: Management implications. In Proceedings of the Annual Tall Timbers Fire Ecology Conference. Fire and Forest Ecology: Innovative Silviculture and Vegetation Management, Tallahassee, FL, USA, 2000; pp. 46–57.
  40. Youngblood, A. Regenerating white spruce in boreal forests of Alaska. Available online: http://www.fs.fed.us/pnw/lwm/lem/projects/youngblood_alaska.shtml (accessed on 14 May 2016).
  41. Labau, V.J.; van Hees, W. An inventory of Alaska’s boreal forests: Their extent, condition, and potential use. In Proceedings of the International Symposium on Boreal Forests: Condition, Dynamics, Anthropogenic Effects, Archangelsk, Russia, 16–26 July 1990.
  42. Hanson, D. Timber Inventory of State Forest Lands in the Tanana Valley 2013; Alaska Department of Natural Resources Division of Forestry: Fairbanks, AK, USA, 2013.
  43. Viereck, L.A.; Dyrness, C.T.; Van Cleve, K.; Foote, M.J. Vegetation, soils, and forest productivity in selected forest types in interior Alaska. Canadian Journal of Forest Research 1983, 13, 703–720. [Google Scholar] [CrossRef]
  44. Ping, C.; Boone, R.; Clark, M.; Packee, E.; Swanson, D. State factor control of soil formation in interior alaska. In Alaska’s Changing Boreal Forest; Chapin, F., Oswood, M., Van Cleve, K., Viereck, L., Verbyla, D., Eds.; Oxford University Press, Inc.: New York, NY, USA, 2006; pp. 21–38. [Google Scholar]
  45. Shulski, M.; Wendler, G. The Climate of Alaska; University of Alaska Press: Fairbanks, AK, USA, 2007. [Google Scholar]
  46. Wendler, G.; Shulski, M. A century of climate change for Fairbanks, Alaska. Arctic 2009, 62, 295–300. [Google Scholar] [CrossRef]
  47. Nowacki, G.; Spencer, P.; Fleming, M.; Brock, T.; Jorgenson, T. Ecoregions of Alaska: 2001; U.S. Geological Survey Open-File Report 02-297 (map); U.S. Geological Survey: Reston, VA, USA, 2001.
  48. The Society of American Foresters. Dictionary of Forestry; The Society of American Foresters: Bethesda, MD, USA, 1994. [Google Scholar]
  49. Alaska Division of Forestry. Annual Report; Alaska Department of Natural Resources Division of Forestry: Anchorage, AK, USA, 2000.
  50. Juday, G.P. Monitoring hectare-scale forest reference stands at Bonanza Creek Experimental Forest LTER. In Long-Term Silvicultural & Ecological Studies: Results for Science and Management; Camp, A.E., Irland, L.C., Carroll, C.J.W., Eds.; Global Institute of Sustainable Forestry, School of Forestry & Environmental Studies, Yale University: New Haven, CT, USA, 2012; pp. 31–48. [Google Scholar]
  51. Bonanza Creek LTER. Available online: http://www.Lter.Uaf.Edu/ (accessed on 13 September 2016).
  52. Yarie, J.; Kane, E.; Mack, M.C. Aboveground biomass equations for trees of Interior Alaska. In Agricultural and Forestry Experiment Station Bulletin; Univesity of Alaska Fairbanks: Fairbanks, Alaska, USA, 2007. [Google Scholar]
  53. Jenness, J.; Brost, B.; Beier, P. Land Facet Corridor Designer: Extension for ArcGIS. 2013. Available online: http://www.jennessent.com/arcgis/land_facets.htm (accessed on 20 May 2014).
  54. Alaska Division of Forestry. Vegetation and Community Mapping of the Tanana Valley; Alaska Department of Natural Resources Division of Forestry Northern Region: Fairbanks, AK, USA, 2013.
  55. Web soil survey. Available online: http://websoilsurvey.sc.egov.usda.gov/App/HomePage.htm (accessed on 23 August 2016).
  56. Snap data. Available online: http://ckan.snap.uaf.edu/dataset (accessed on 24 May 2016).
  57. Wilmking, M.; Juday, G.P.; Barber, V.A.; Zald, H.S.J. Recent climate warming forces contrasting growth responses of white spruce at treeline in Alaska through temperature thresholds. Glob. Chang. Biol. 2004, 10, 1724–1736. [Google Scholar] [CrossRef]
  58. Lloyd, A.H.; Duffy, P.A.; Mann, D.H. Nonlinear responses of white spruce growth to climate variability in interior Alaska. Can. J. For. Res. 2013, 43, 331–343. [Google Scholar] [CrossRef]
  59. Beck, P.S.A.; Juday, G.P.; Alix, C.; Barber, V.A.; Winslow, S.E.; Sousa, E.E.; Heiser, P.; Herriges, J.D.; Goetz, S.J. Changes in forest productivity across alaska consistent with biome shift. Ecol. Lett. 2011, 14, 373–379. [Google Scholar] [CrossRef] [PubMed]
  60. Juday, G.P.; Alix, C. Consistent negative temperature sensitivity and positive influence of precipitation on growth of floodplain Picea glauca in Interior Alaska. Can. J. For. Res. 2012, 42, 561–573. [Google Scholar] [CrossRef]
  61. Van Cleve, K.; Viereck, L.A.; Dyrness, C.T. State factor control of soils and forest succession along the Tanana River in interior Alaska, USA. Arct. Alp. Res. 1996, 28, 388–400. [Google Scholar] [CrossRef]
  62. Friedman, J.; Hastie, T.; Tibshirani, R. Additive logistic regression: A statistical view of boosting. Ann. Stat. 2000, 28, 337–374. [Google Scholar] [CrossRef]
  63. Breiman, L. Statistical modeling: The two cultures. Stat. Sci. 2001, 16, 199–215. [Google Scholar] [CrossRef]
  64. Betts, M.G.; Ganio, L.M.; Huso, M.M.P.; Som, N.A.; Huettmann, F.; Bowman, J.; Wintle, B.A. Comment on "Methods to account for spatial autocorrelation in the analysis of species distributional data: A review". Ecography 2009, 32, 374–378. [Google Scholar] [CrossRef]
  65. Ohse, B.; Huettmann, F.; Ickert-Bond, S.M.; Juday, G.P. Modeling the distribution of white spruce (Picea glauca) for Alaska with high accuracy: An open access role-model for predicting tree species in last remaining wilderness areas. Polar Biol. 2009, 32, 1717–1729. [Google Scholar] [CrossRef]
  66. Drew, C.A.; Wiersma, Y.; Huettmann, F. Predictive Species and Habitat Modeling in Landscape Ecology: Concepts and Applications; Springer Science & Business Media: New York, NY, USA, 2010. [Google Scholar]
  67. Salford Systems. Introducing Treenet; Salford Systems, Ed.; Salford Systems: San Diego, CA, USA, 2013. [Google Scholar]
  68. Metz, C.E. Basic principles of ROC analysis. Sem. Nucl. Med. 1978, 8, 283–298. [Google Scholar] [CrossRef]
  69. Hastie, T.; Tibshirani, R.; Friedman, J. The Elements of Statistical Learning: Data Mining, Inference and Prediction; Springer: New York, NY, USA, 2009. [Google Scholar]
  70. Nienstaedt, H.; Zasada, J.C. Picea glauca (moench) voss, white spruce. In Silvics of North America: Volume 1. Conifers. Agriculture handbook 654; Burns, R.M., Honkala, B.H., Eds.; USDA Forest Service: Washington, DC, USA, 1990; pp. 204–226. [Google Scholar]
  71. Perala, D.A. Populus tremuloides Michx. Quaking Aspen. In Silvics of North America; Burns, R.M., Honkala, B.H., Eds.; USDA Forest Service: Washington, DC, USA, 1990; pp. 1082–1115. [Google Scholar]
  72. Solarik, K.A.; Lieffers, V.J.; Volney, W.J.A.; Pelletier, R.; Spence, J.R. Seed tree density, variable retention, and stand composition influence recruitment of white spruce in boreal mixedwood forests. Can. J. For. Res. 2010, 40, 1821–1832. [Google Scholar] [CrossRef]
  73. Safford, L.O.; Bjorkbom, J.C.; Zasada, J.C. Paper birch. In Silvics of North America; Burns, R.M., Honkala, B.H., Eds.; Forest Service, United States Department of Agriculture: Washington, DC, USA, 1990. [Google Scholar]
  74. Marquis, D.A.; Bjorkborn, J.C.; Yelenosky, G. Effect of seedbed condition and light exposure on paper birch regeneration. J. For. 1964, 62, 876–881. [Google Scholar]
  75. Perala, D.A.; Alm, A.A. Regeneration silviculture of birch: A review. For. Ecol. Manag. 1990, 32, 39–77. [Google Scholar] [CrossRef]
  76. Greene, D.F.; Zasada, J.C.; Sirois, L.; Kneeshaw, D.; Morin, H.; Charron, I.; Simard, M.J. A review of the regeneration dynamics of North American boreal forest tree species. Can. J. For. Res. 1999, 29, 824–839. [Google Scholar] [CrossRef]
  77. Keenan, R.J.; Kimmins, J.P. The ecological effects of clear-cutting. Environ. Rev. 1993, 1, 121–144. [Google Scholar] [CrossRef]
  78. Gartner, S.M.; Lieffers, V.J.; Macdonald, S.E. Ecology and management of natural regeneration of white spruce in the boreal forest. Environ. Rev. 2011, 19, 461–478. [Google Scholar] [CrossRef]
  79. Cole, E.; Youngblood, A.; Newton, M. Effects of competing vegetation on juvenile white spruce (Picea Glauca (Moench) Voss) growth in Alaska. Ann. For. Sci. 2003, 60, 573–583. [Google Scholar] [CrossRef]
  80. Calogeropoulos, C.; Greene, D.F.; Messier, C.; Brais, S. The effects of harvest intensity and seedbed type on germination and cumulative survivorship of white spruce and balsam fir in northwestern Quebec. Can. J. For. Res. 2004, 34, 1467–1476. [Google Scholar] [CrossRef] [Green Version]
  81. Lamontagne, J.M.; Boutin, S. Local-scale synchrony and variability in mast seed production patterns of Picea glauca. J. Ecol. 2007, 95, 991–1000. [Google Scholar] [CrossRef]
Figure 1. Map of study area. (a) Study area is on state forest lands within Interior Alaska boreal region [47]; (b) Sampled harvest units are distributed within Kantishna and Fairbanks areas of Tanana Valley State Forest and forest classified lands. NC- followed by number are sampled harvest units number.
Forests 08 00012 g001
Figure 2. Relative variable importance of predictors in the predictive models of (a) presence/absence of “all size” group; (b) presence/absence of saplings; (c) dominance of “all size” group; (d) dominance of saplings; (e) basal area; and (f) biomass. The importance value for any predictor is determined by averaging the number of times it is selected as a tree node over all trees and the squared improvements in error rate resulting from these nodes [69]. A relative importance value of 100 is assigned to the most important predictor, and relatively scaled values are assigned to other predictors based on the most important predictor. Missing bars mean that the TreeNet algorithm found the predictor to have zero importance for the prediction.
Forests 08 00012 g002
Figure 3. Partial dependence plots of harvest type, site preparation method, reforestation technique, and year of harvest for the predictive models of (a) presence/absence of “all size” group; (b) presence/absence of sapling; (c) dominance of “all size” group; (d) dominance of saplings; (e) basal area; and (f) biomass. Partial dependence plots show the relationship between the response and any given predictor by representing the dependence of the response on the predictor variable when all other variables are held at their mean [67]. Y-axes are the partial dependence value of a prediction being 1 (present/high). An empty space means that the TreeNet algorithm found the predictor to have zero importance for the prediction.
Forests 08 00012 g003aForests 08 00012 g003bForests 08 00012 g003c
Table 1. List of sampled harvest units. The location of the units is displayed in Figure 1.
UnitSize (ha)Number Plots SampledLogged YearHarvest TypeSite PreparationReforestation
NC-12010.4411975Partial cutNonePlant
NC-9317.9351975Partial cutNoneNatural
NC-1905.1221977ClearcutScarifyNatural
NC-1265.7221978Partial cutNoneNatural
NC-140-172.581979ClearcutNoneNatural
NC-2495.0221980ClearcutScarifyNatural
NC-3624.4151981Partial cutNoneNatural
NC-140-381.571982ClearcutScarifyNatural
NC-3955.1211983ClearcutNoneNatural
NC-4908.4321985ClearcutNoneNatural
NC-5566.6261986ClearcutNonePlant
NC-3053.5111987Partial cutScarifyPlant
NC-70511.0441989ClearcutScarifyPlant
NC-45420.4441991ClearcutScarifyPlant
NC-7401.981991ClearcutNonePlant
NC-70917.2351991ClearcutScarifyPlant
NC-8422.171992Partial cutNoneNatural
NC-73330.3441992ClearcutScarifyPlant
NC-7022.091993ClearcutNonePlant
NC-7478.0311994ClearcutNonePlant
NC-7509.8411995ClearcutScarifyPlant
NC-108522.6471996Partial cutScarifyPlant
NC-113713.5291997ClearcutNonePlant
NC-92722.5431998Partial cutNonePlant
NC-7603.4131998Partial cutNoneNatural
NC-11296.0221999Partial cutNonePlant
NC-10901.471999Partial cutNoneNatural
NC-113511.7492002Partial cutNonePlant
NC-11162.492003Partial cutScarifyNatural
NC-11436.7282004Partial cutNoneNatural
Table 2. List of response and predictor variables.
VariableDescriptionUnitData Source
Response variables
Presence/absencePresence/absence of white spruce, birch, and aspencategoryField sampling
Species dominanceSpecies dominance of white spruce, birch, and aspencategoryField sampling
Basal areaBasal area of white spruce (high ≥ 0.5 m3, low < 0.5 m3), birch (high ≥ 1 m3, low < 1 m3), and aspen (high ≥ 0 m3, low < 0 m3)categoryField sampling
BiomassBiomass accumulation (high ≥ 5 t, low < 5 t)categoryField sampling
Predictor variables
Harvest typeHarvest type: clearcut/partial cutcategoryAKDOF FMD
Site preparationGround treatment type: none/mechanical site preparationcategoryAKDOF FMD
ReforestationReforestation type: natural/planting white spruce seedlingscategoryAKDOF FMD
YearYear since harvest: 10–39continuousAKDOF FMD
SizeSize of harvest unithectareAKDOF FMD
EdgeDistance to edge of harvest unitkmAKDOF FMD
White spruceDistance to white spruce forestkmAKDOF vegetation map
BirchDistance to birch forestkmAKDOF vegetation map
AspenDistance to aspen forestkmAKDOF vegetation map
WaterDistance to waterkmAKDOF vegetation map
HighwayDistance to highwaykmAKDOF vegetation map
Forest roadDistance to forest roadkmAKDOF vegetation map
UrbanDistance to urban areakmAKDOF vegetation map
DevelopmentDistance to development (power line, mine etc.)kmAKDOF vegetation map
ElevationElevationmGINA DEM
SlopeSlopedegreeGINA DEM
AspectAspectcategoryGINA DEM
TPITopographic Position IndexcontinuousGINA DEM
SoilsSoil subgroupcategoryNRCS
May tempAverage temperature of May°CSNAP
June tempAverage temperature of June°CSNAP
July tempAverage temperature of July°CSNAP
Aug tempAverage temperature of August°CSNAP
May precipPrecipitation sum of MaymmSNAP
June precipPrecipitation sum of JunemmSNAP
July precipPrecipitation sum of JulymmSNAP
Aug precipPrecipitation sum of AugustmmSNAP
AKDOF = Alaska Division of Forestry; FMD = Forest Management Database; GINA DEM = Geographic Information Network of Alaska Digital Elevation Model; NRCS = Natural Resources Conservation Service; SNAP = Scenarios Network for Alaska + Arctic Planning.
Table 3. The model performances, including contingency table, specificity (true negative rates), sensitivity (true positive rate), mean accuracy (mean of sensitivity and specificity), and receiver operating characteristic (ROC) curve AUC.
PredictionsSpecificity SensitivityMean AccuracyAUC
“All Size” Group Presence/AbsenceAbsentPresent
AspenAbsent4919284.22%0.840.92
Present2212184.62%
BirchAbsent1769165.92%0.680.74
Present13832169.93%
White spruceAbsent1967472.59%0.730.78
Present12333373.03%
Saplings presence/absenceAbsentPresent
AspenAbsent6534393.82%0.940.98
Present22893.33%
BirchAbsent3948482.43%0.820.90
Present4720181.05%
White spruceAbsent42210879.62%0.790.88
Present4415277.55%
“All size” group dominanceLowHigh
AspenLow5807988.01%0.880.95
High95886.57%
BirchLow2968477.89%0.780.85
High7826877.46%
White spruceLow37711576.63%0.760.83
High5817675.21%
Sapling dominanceLowHigh
AspenLow6564493.71%0.940.97
High22492.31%
BirchLow4238383.60%0.840.90
High3618483.64%
White spruceLow47211180.96%0.810.88
High2711681.12%
Basal area LowHigh
AspenLow103694.50%0.940.98
High23294.12%
BirchLow1943086.61%0.860.93
High3320185.90%
White spruceLow1904381.55%0.810.88
High4517779.73%
Biomass LowHigh 0.780.85
Low3198778.57%
High7226178.38%

