Article

Using Fractal Analysis in Modeling the Dynamics of Forest Areas and Economic Impact Assessment: Maramureș County, Romania, as a Case Study

by
Radu-Daniel Pintilii
1,
Ion Andronache
1,
Daniel Constantin Diaconu
1,*,
Răzvan Cătălin Dobrea
2,
Martina Zeleňáková
3,
Rasmus Fensholt
4,
Daniel Peptenatu
1,
Cristian-Constantin Drăghici
1 and
Ana-Maria Ciobotaru
1
1
University of Bucharest—Research Center for Integrated Analysis and Territorial Management; 4-12, Regina Elisabeta Avenue; 030018 Bucharest, Romania
2
Bucharest University of Economic Studies—Faculty of Management; 6, Piața Romană Square; 010374 Bucharest, Romania
3
Institute of Environmental Engineering, Technical University of Kosice, Vysokoskolska 4, Kosice 04200, Slovakia
4
University of Copenhagen, Department of Geosciences and Natural Resource Management, Oster Voldgade 10, DK-1350 Copenhagen, Denmark
*
Author to whom correspondence should be addressed.
Forests 2017, 8(1), 25; https://doi.org/10.3390/f8010025
Submission received: 5 October 2016 / Revised: 10 January 2017 / Accepted: 10 January 2017 / Published: 14 January 2017

Abstract

:
This study uses fractal analysis to quantify the spatial changes of forest resources caused by an increase of deforested areas. The method introduced contributes to the evaluation of forest resources being under significant pressure from anthropogenic activities. The pressure on the forest resources has been analyzed for Maramureș County, one of the most deforested counties in Romania. In order to evaluate this, the deforested areas were calculated for the period of 2001–2014, by using the Global Forest Change 2000–2014 database. The Fractal Fragmentation Index (FFI) and Fixed Grid 2D Lacunarity (FG2DL) were used to quantify the degree of fragmentation and dispersion of the forested areas, and thereby the extent to which a forest area is affected by deforestation. The process of quantifying the pressure on forested areas included the creation of a database for the period of 2000–2014 containing economic activities (turnover) related to woody recourses, important indicators of forest exploitation. Taken together, the results obtained indicate a dramatic increase in deforested areas (over 19,122 ha in total for the period of analysis), in Maramureș County.

1. Introduction

Forest areas represent one of the most important and complex terrestrial ecosystems. In 2010, forested areas covered over 4 billion hectares globally, representing 31% of the total land area [1]. Management of forest areas is one of the greatest challenges for policy-makers, faced with significant pressure exerted on forest resources by various sectors of the economy, which require a growing wood volume [2]. The complexity of the effects of deforestation renders territorial management strategies more expensive. The forest, by its products, has several functions with implications for the economy, the environment, and society. This multi-functionality defines the key role forested areas play in the fight against pollution, poverty, and environmental protection. This role is recognized by a number of official documents both globally [3] and in the European Union [4]. According to these documents, the increase in deforested areas is a matter of general interest, and vigorous action is required to reduce their effects. In this context, reducing deforested areas is a priority for decision-makers, which may bring a number of important benefits to local communities, including reducing carbon emissions, watershed protection, biodiversity, and soil quality conservation [5,6,7,8,9,10,11]. The most important causes that determine the expansion of the deforested areas globally identified by several studies are the conversion of forested areas into farmland and the price of timber [12,13,14,15,16]. This causes overexploitation of forests, with negative consequences with respect to ecosystem functionality and economic revenue [17]. The analysis of the deforested areas’ evolution and the causal drivers becomes particularly important, especially from the economic point of view, by its implications on the sustainable development of local communities [18,19,20,21,22]. Expanding deforested surfaces causes this important resource to be increasingly reduced for local communities with direct consequences for livelihoods. Romania’s forested area is estimated at about 29% of the total area of the country, much below the average EU level of 40% [4]. Currently, it is subjected to increasing pressure from socio-economic factors, reflected by legal or illegal increases in logging of the forested areas. In this context, the study of the forest area dynamics plays a key role in developing and implementing strategies to ensure better forest monitoring [23,24,25].
After 1990, following the fall of communism, an increasing pressure was exerted on forest areas in Romania. The development of methods to analyze the dynamics of forested areas constitutes an immediate necessity, given that Romania is facing a reduction in forested areas each year. Additionally, mapping and quantification of illegal logging, which has escalated in recent years, requires the development of analysis methods based on the textural imaging analysis of the forest. Thus, fractal analysis can be used complementary to traditional Geographic Information Systems (GIS)-based analyses.
An innovative method in shaping the economic pressure on the forest’s resources is represented by the fractal analysis. The fractal dimension is a measure of complexity; the measure to which the fractal “fills” the space, quantifying the degree of irregularity and fragmentation of a geometrical structure or of an object of nature often having superior value as compared to the topological dimension [21]. The fractal theory was adopted in geography and has been applied in shoreline analysis, land relief appearance, the appearance of clouds, in river basin studies, and the distribution curves of the climatic and hydrological parameters [25]. Fractal analysis has also been applied for studying forest characteristics based on fractal analysis and remote sensing imagery covering different forest regions of the world [26,27,28].
Within this study, we aimed to determine if fractal analysis can be useful and whether it can provide additional information in the spatial analysis of the effects incurred by deforestation, imposed by the economic pressure (increasingly more intense) on the forest’s resources in a case study area (Maramureș County) located in the northernmost part of Romania.

2. Materials and Methods

2.1. Preprocessing of Satellite Imagery

To assess the deforested area, the Global Forest Change 2000–2014 database was used, provided by the Department of Geographical Sciences, Maryland University. The database is the result of the analysis of 654,178 Landsat 7 ETM + images characterizing global forest extent and change from 2000 through 2014 [29]. Remotely sensed images and GIS analyses can provide relevant forest change estimates at some scale and level of accuracy [29,30]. Based on this, the deforested area and the wooded land areas for the period of 2000–2014 was calculated for Maramureș County and five of the most deforested territorial administrative units (Borșa, Poienile, Repedea, Săpânța, and Vișeu de Sus). Initially, the Hansen_GFC2015 [29] maps of the forested and deforested areas were extracted in tiff format using the ArcGIS platform and the resolution chosen was 3509 × 2481 (170.72 km × 120.71 km). We selected this resolution because it provides sufficient spatial detail for a good fractal analysis. The used method started with a conversion of the initial projection of Hansen_GFC, into the Stereographic 70 coordinate system (EPSG 31700), specific for Romania.
Initially, the extent of the forested and the deforested areas were analyzed, over the 15 year period, both for the entire Maramureș County, and for the five territorial administrative units (TAUs) characterized by the highest forest cover of the county (Figure 1).

2.2. Data Analysis

All pixels were transformed into points, with the dimension of the pixels determining the area covered with vegetation. The change in number of forest pixels from year to year helped us to determine and to quantify the deforestation process, and its economic exploitation. The wood-related economic activities were analyzed in detail, by using a complex database of turnover. For this purpose, the NACE codes (statistical classification of economic activities in the European Community) related to (a) sylviculture and other forestry activities; (b) logging; (c) sawing and plantation of woods; (d) joinery installations; and (e) wholesale of woods, construction materials, and sanitary equipment were selected because these turnover values reflect the economic activity related to timber harvesting. Fractal analysis was used to derive other evidence, to corroborate our findings. The images, first obtained from the ArcGIS platform [31], were manually binarized, subsequently calculating the km2 areas using ImageJ 1.51 g software [32]. The resulting binarized images were subject to fractal analysis using IQM 3.3 software [33]. The method used to determine the fractal dimension was the Fractal Fragmentation Index (to determine the fractal fragmentation of forest areas as a result of deforestation) [34] and Fixed Grid 2D Lacunarity (to determine how heterogeneous the area taken up by deforestation is) [35].
The Fractal Fragmentation Index (FFI) quantifies, in a single value, the information obtained from the fractal analysis on mass concentration, but also on the tortuosity of the perimeters describing the fractal fragmentation which can be interpreted as a compaction index, as well [34]:
F F I = D A D P
where FFI is the fractal fragmentation index, DA is the fractal dimension of the summed-up areas, and DP is the fractal dimension of the summed up perimeters.
According to [34] FFI = 0, when DP = DA, which means that the forested areas are represented only in very small areas, characterized by punctual shapes. As the FFI is close to 0, the forested areas are highly fragmented, dispersed, smaller, and fewer, or of a tentacular and sprawling pattern. As the FFI tends to increase towards 1, the forested areas become larger and more compact, being arranged in clusters. FFI = 1 is recorded only when the forested areas are geometrically perfect and 100% compact, without any discontinuity (DP = 1 and DA = 2).
DP and DA were obtained using the Pyramid Dimension, implemented in IQM [36]. Fixed Grid 2D Lacunarity (FG2DL) was used to calculate the degree of heterogeneity by the variation of deforested areas distribution and it is determined using the following equation:
F G 2 D L = ( C V F G 2 D L ) 2
where C V F G 2 D L is the coefficient of variation [37,38].
As the deforestation process is more heterogenous and chaotic, the value F G 2 D L increases, and vice-versa.
The ArcGIS platform was used to graphically illustrate the geographical position and the distribution of the economic indicator. Finally, correlations between deforestation and the economic exploitation of wood were used to determine the impact of economic pressure on forested areas.

3. Results

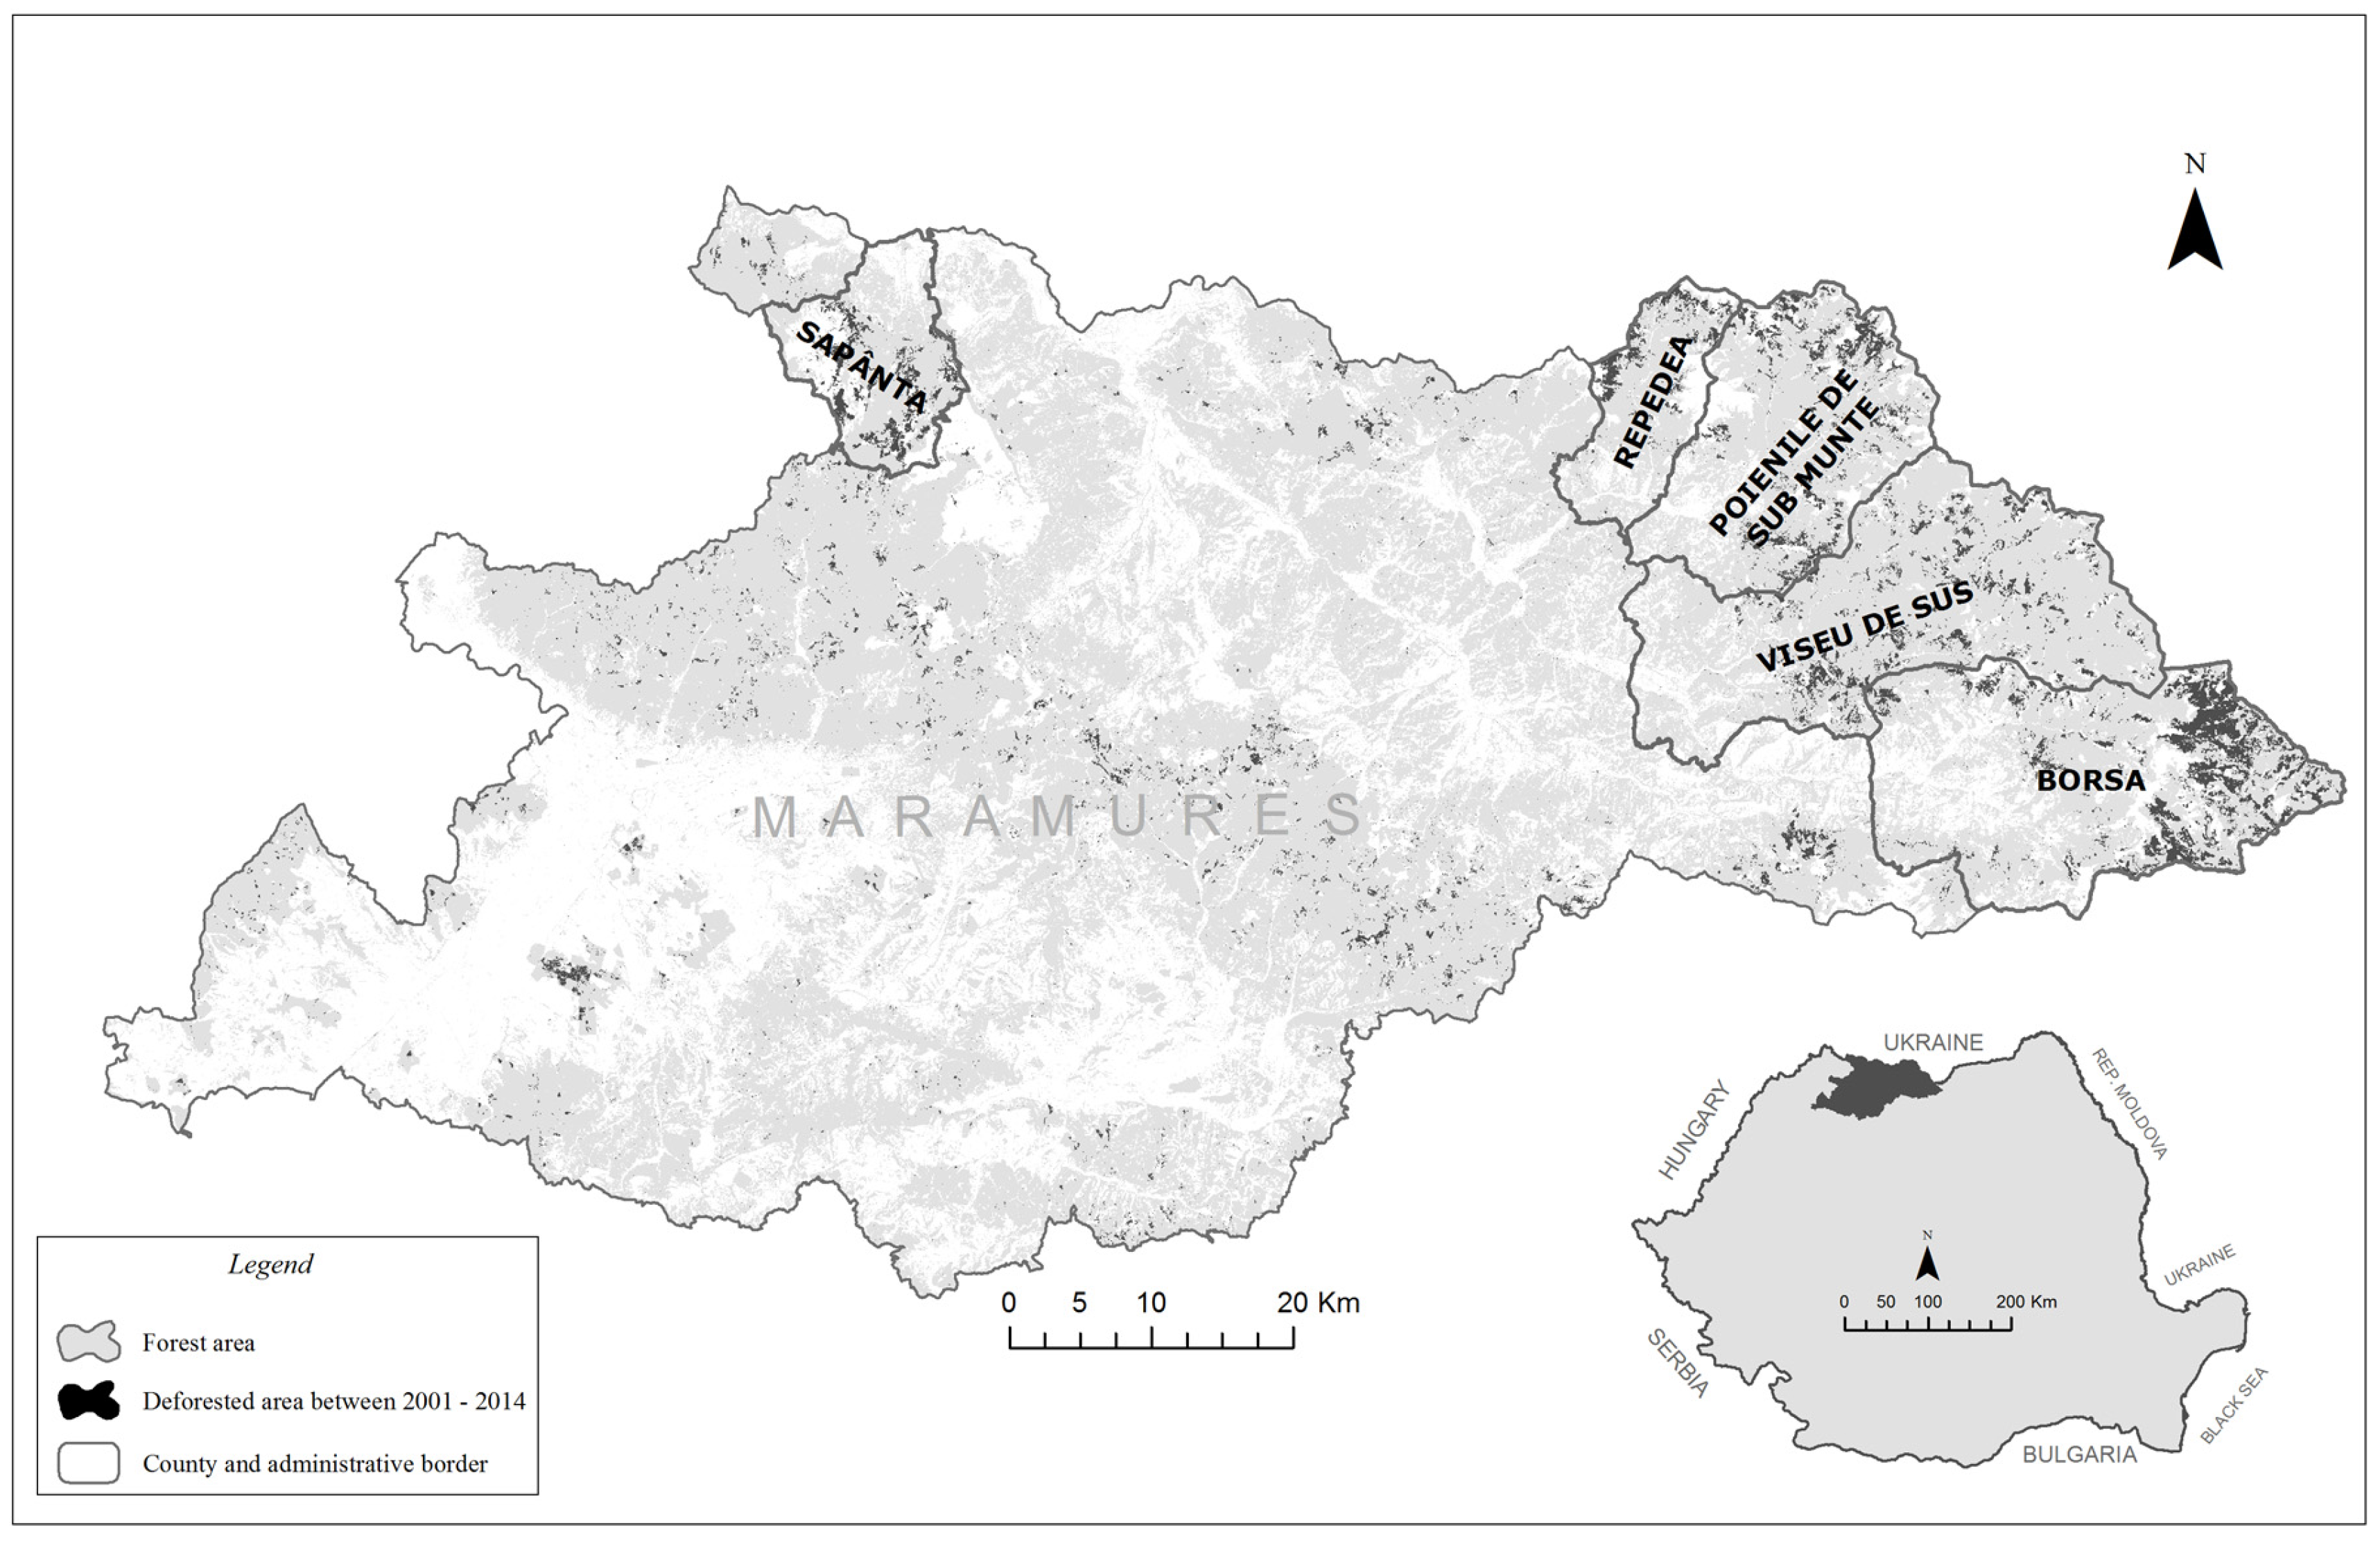
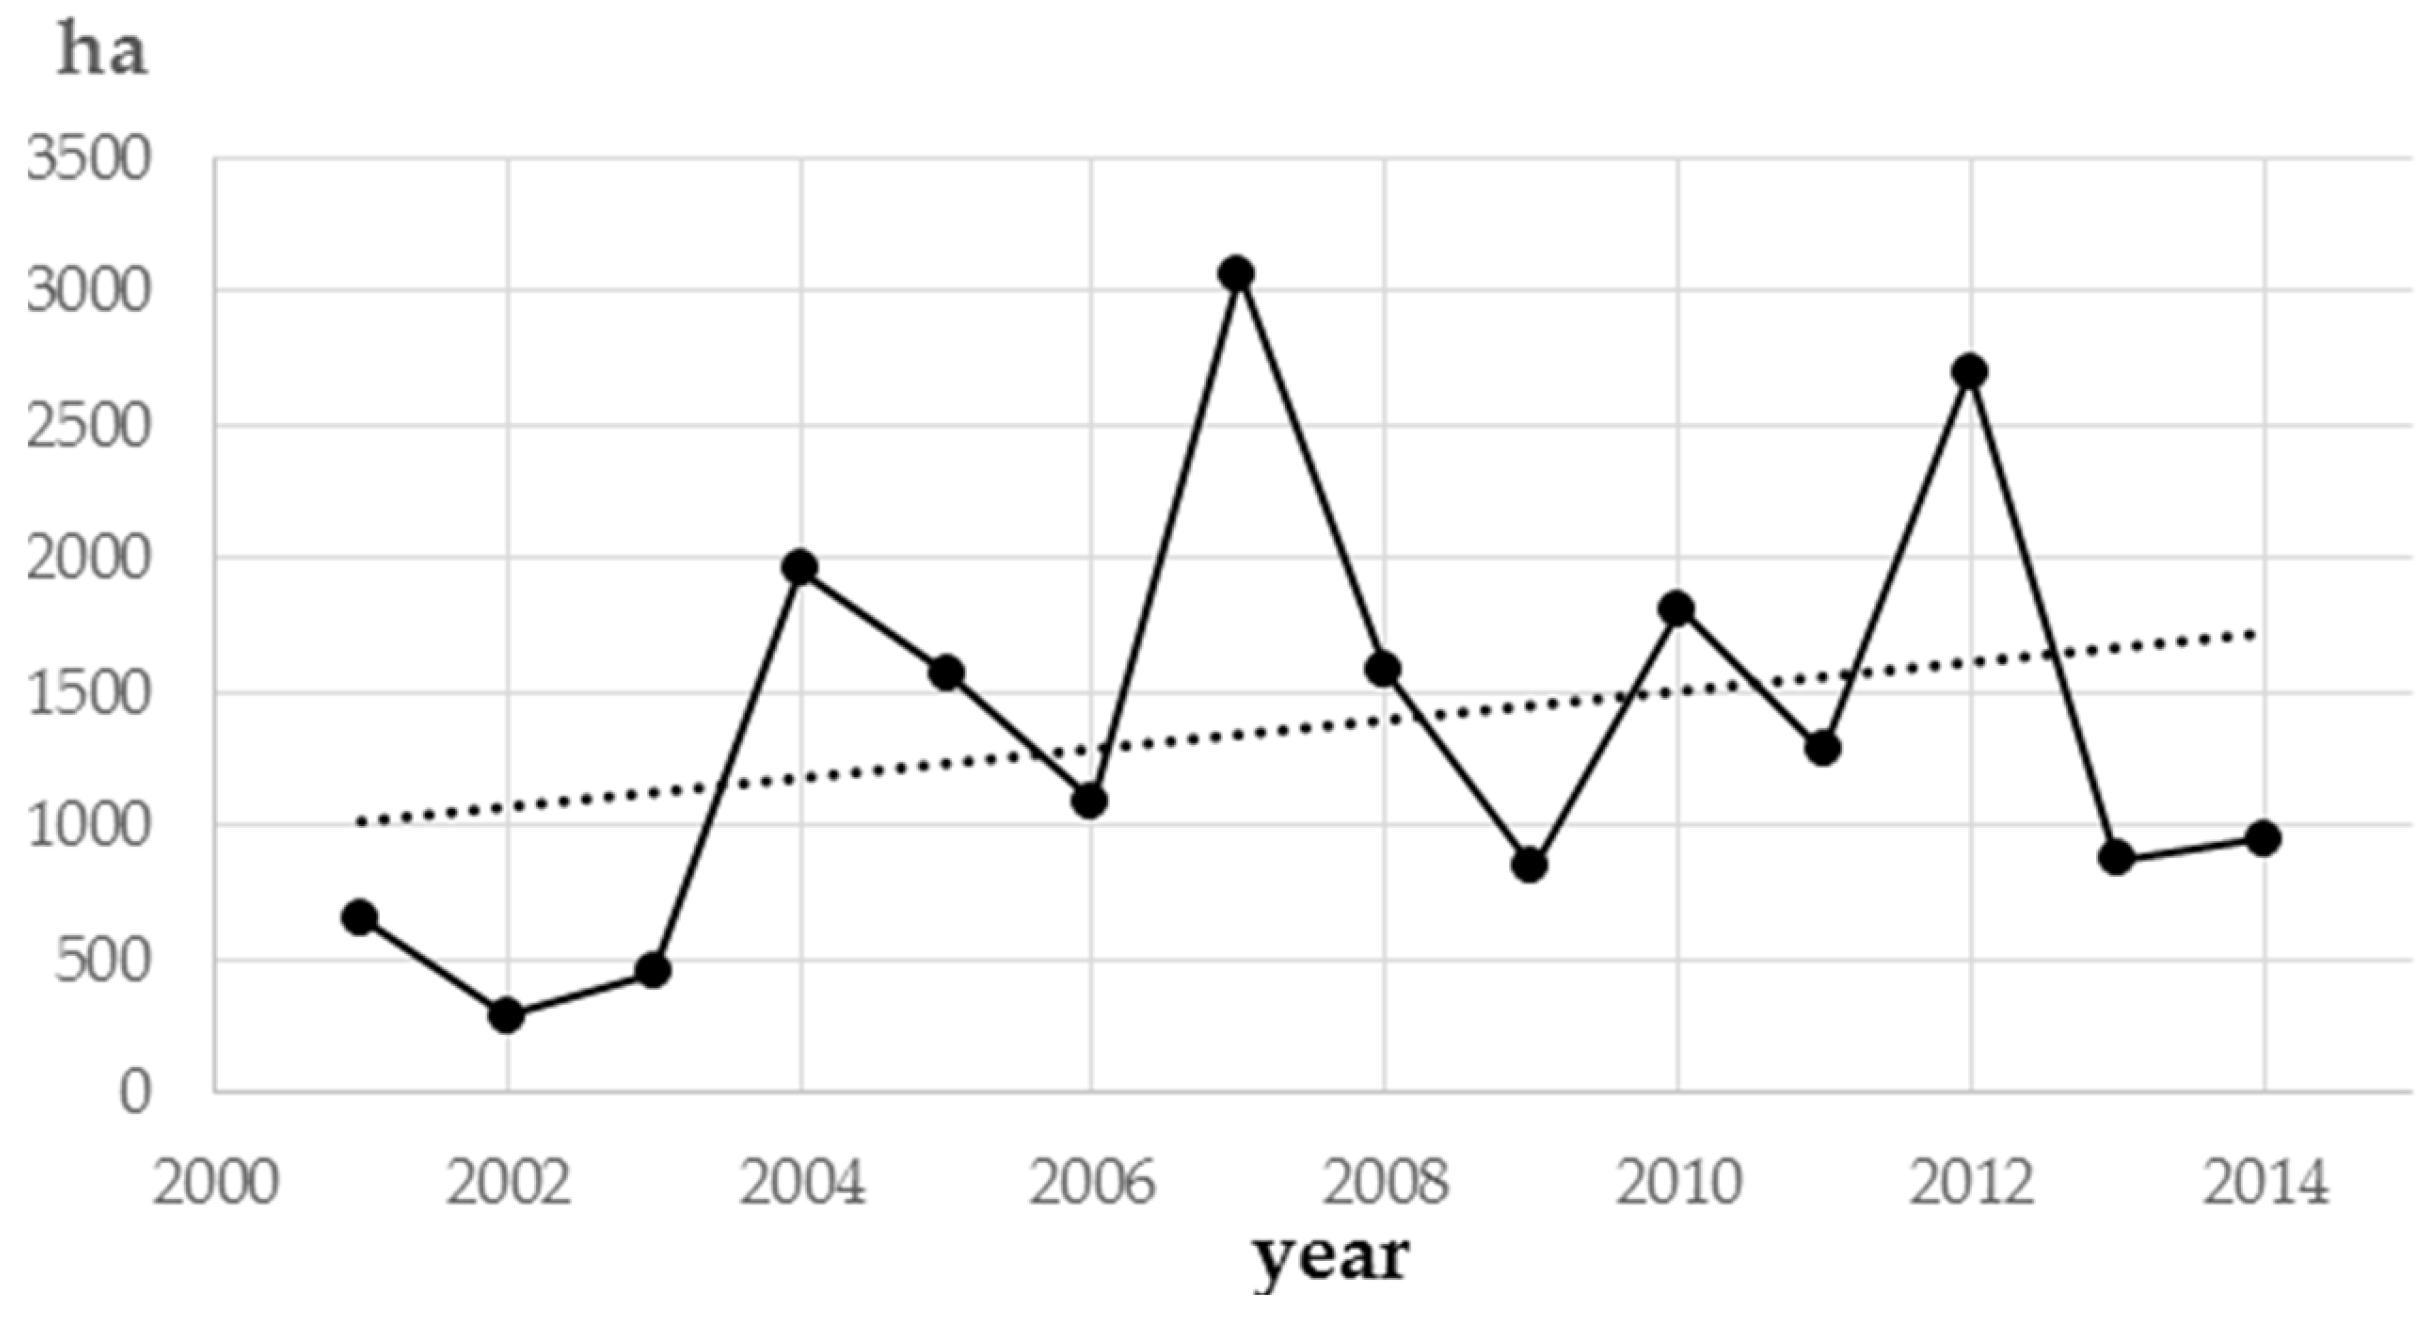
3.1. Spatio-Temporal Deforestation Rates

The forest-covered areas have generally decreased during the period of analysis, but at a variable rate, at the Maramureș County level (total deforested area is 19,122.8 ha), with maximum rates in 2004, 2007, and 2012 and minimum rates in 2001–2003 (Figure 2).
In four out of five TAUs, the analysis of deforestation indicates high levels in 2007 and 2012, except for the Săpânța TAU, where deforestation was at its maximum level in 2004. In all cases at county and territorial levels, deforestation was lowest in 2002–2003, except for the Săpânța TAU showing the lowest deforestation in 2014.
During the period from 2000 to 2014, 13,177.3 ha have been deforested in the five TAUs, representing 69% of the entire deforested area of Maramureș County. Borșa was the most deforested TAU (5,848.8 ha, corresponding to 41.32% of the entire deforested area of Maramureș County), whereas Repedea represented the TAU of lowest deforestation, with a decrease of 1,085.7 ha, corresponding to 8.23% of the deforested area of Maramureș County.

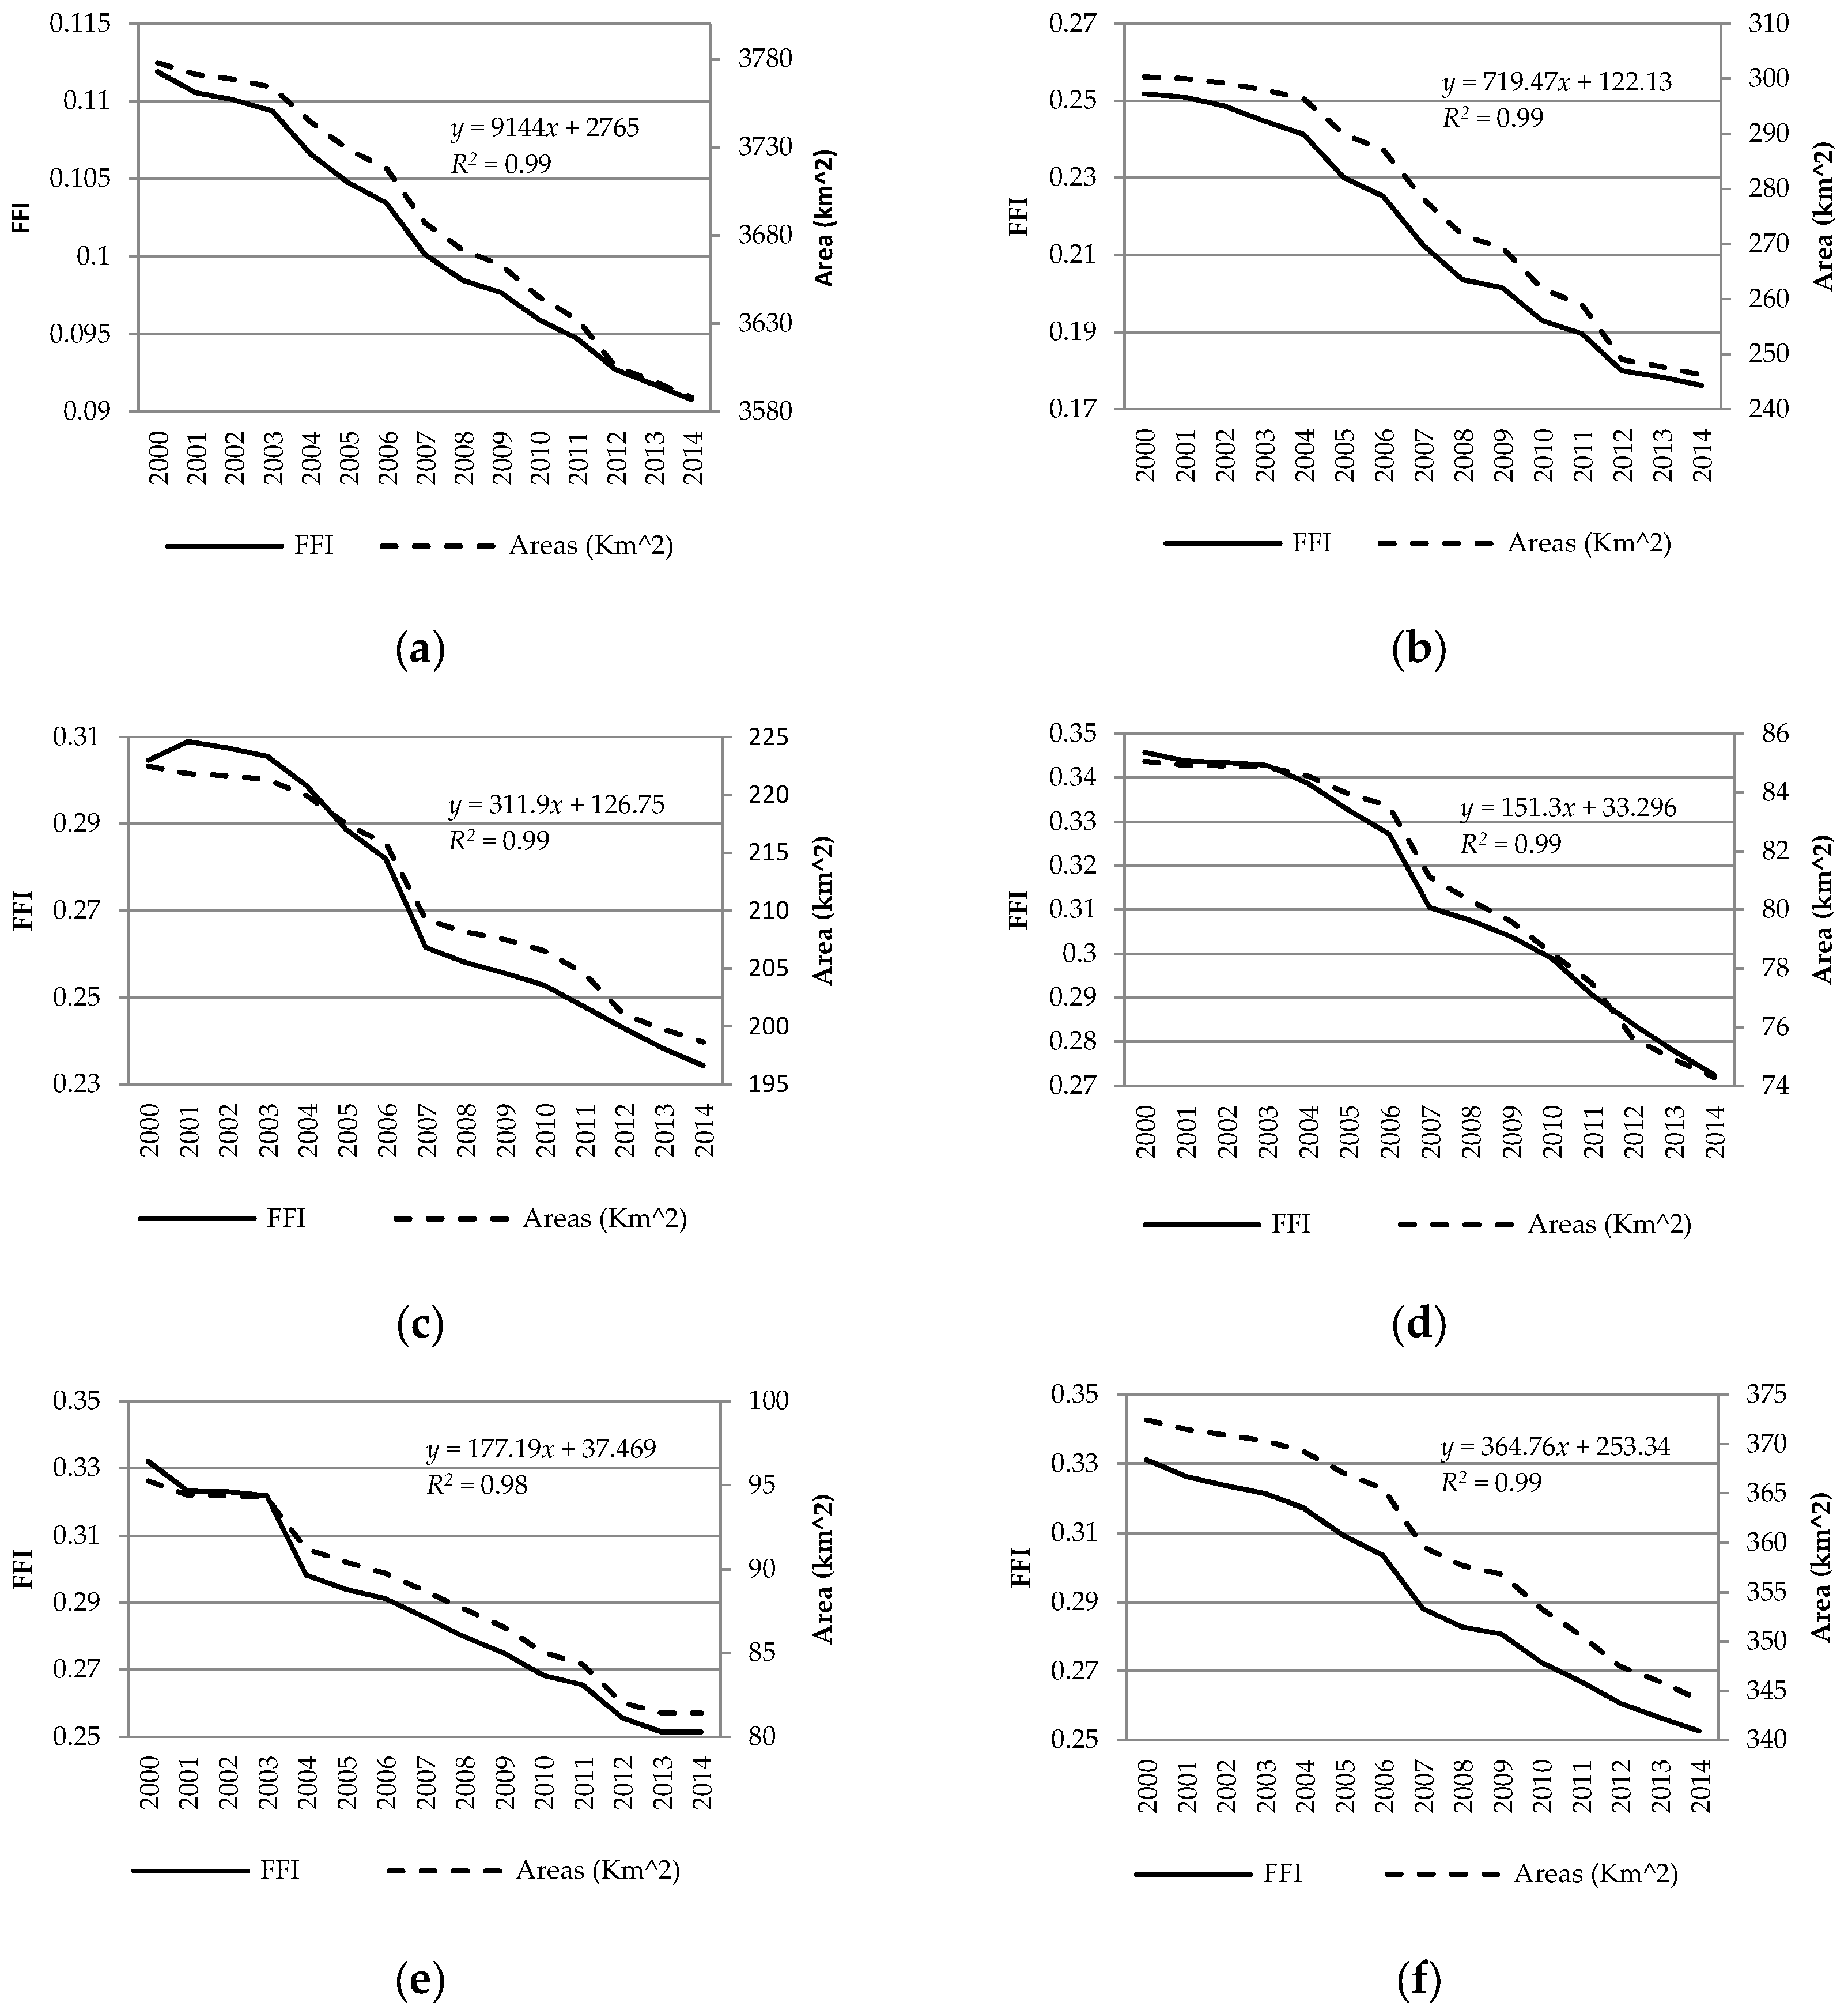
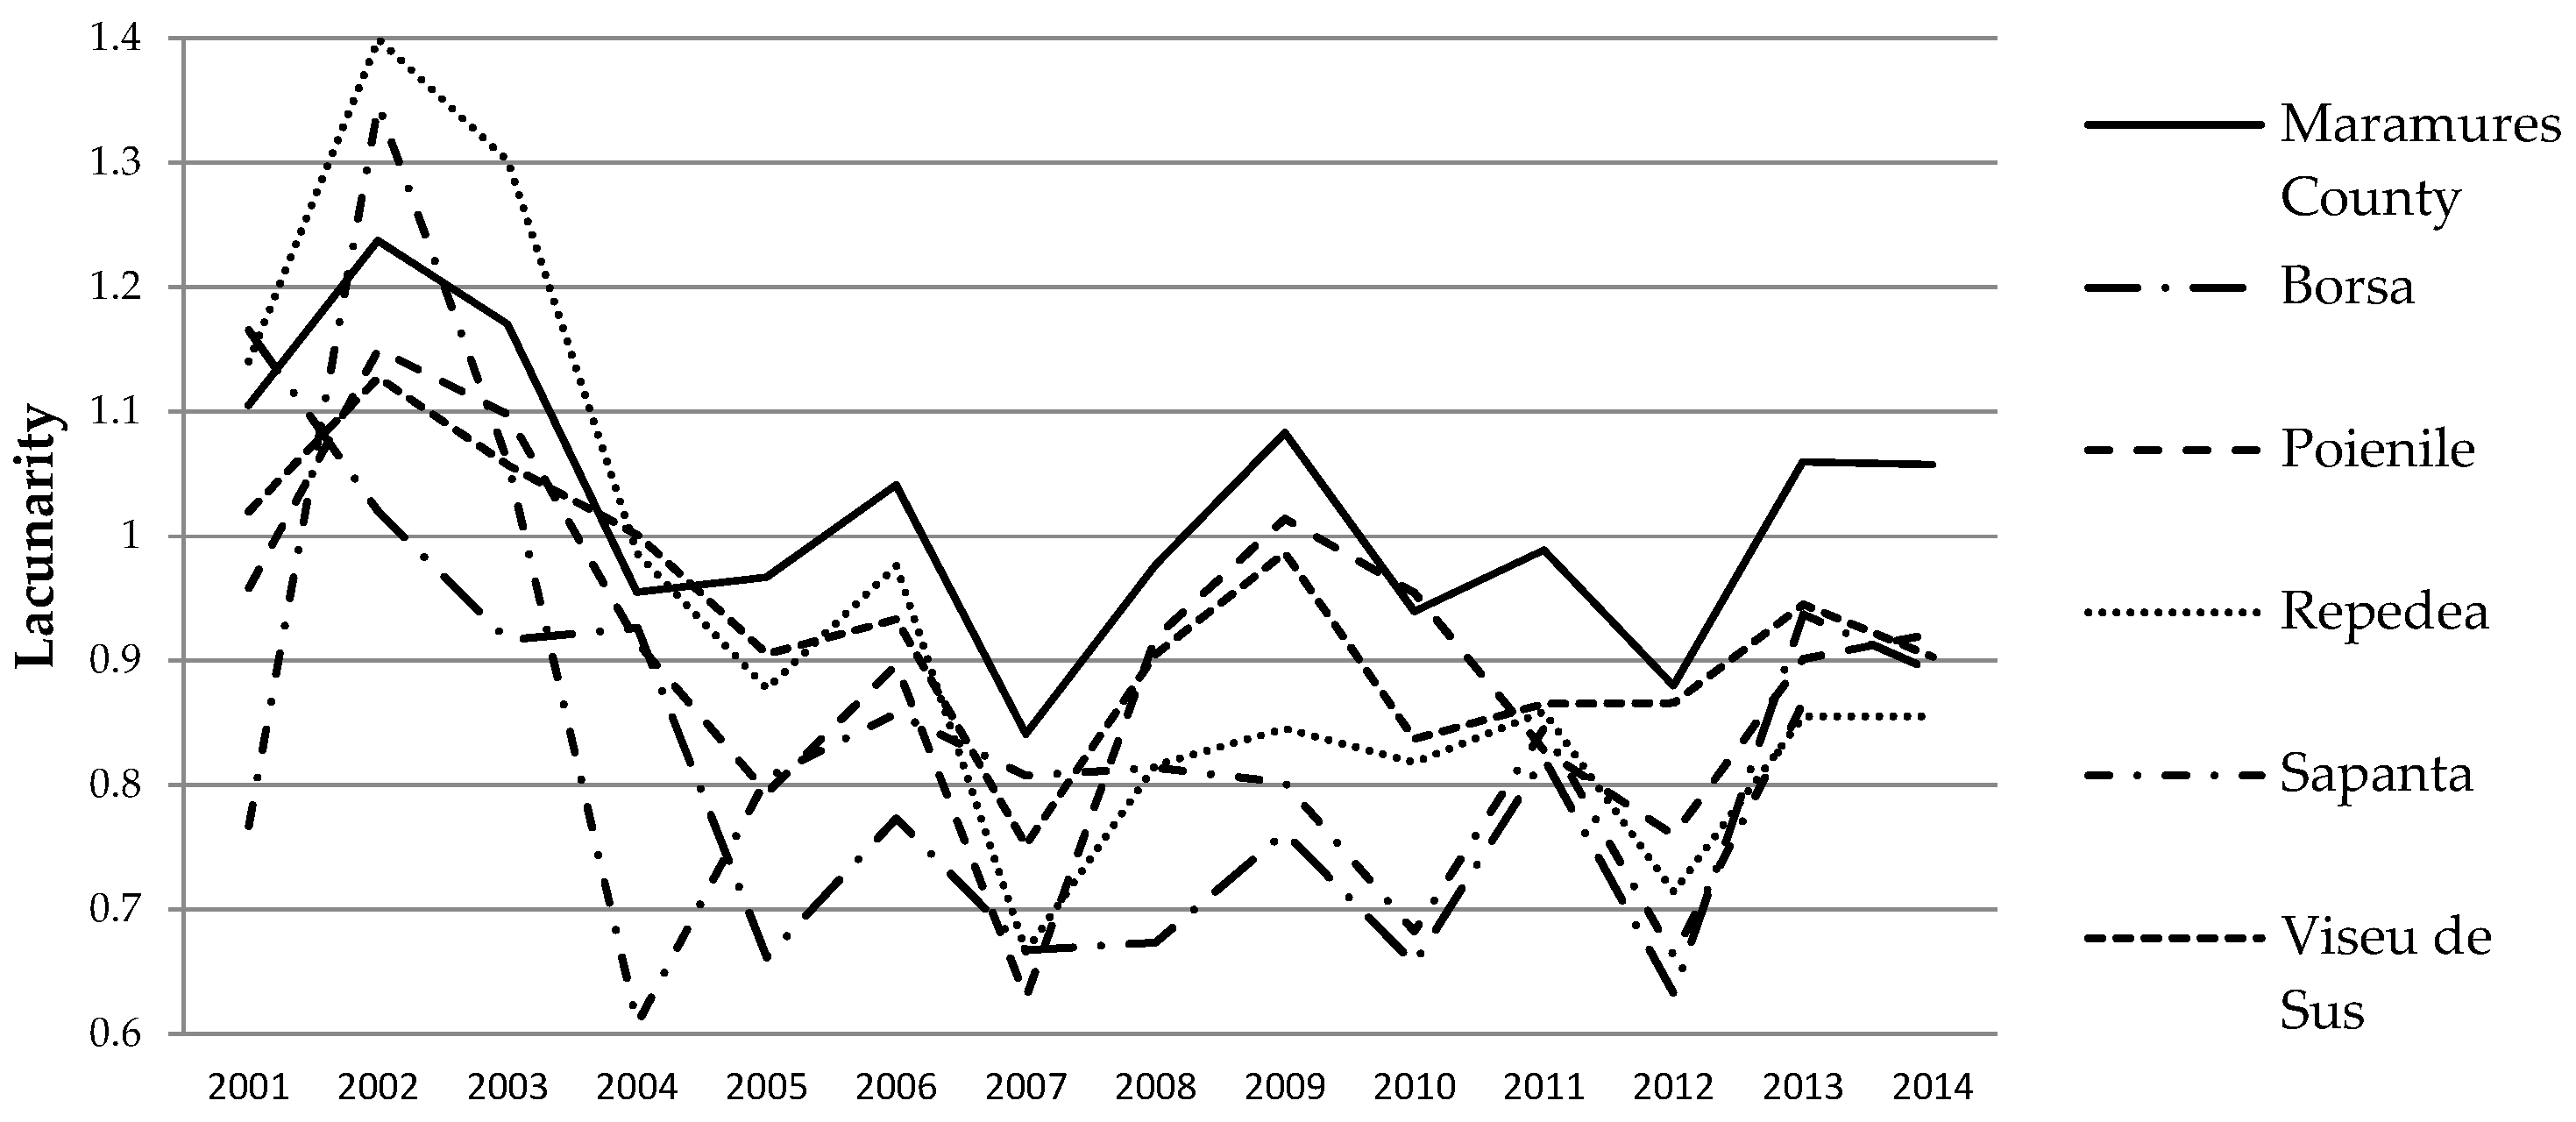
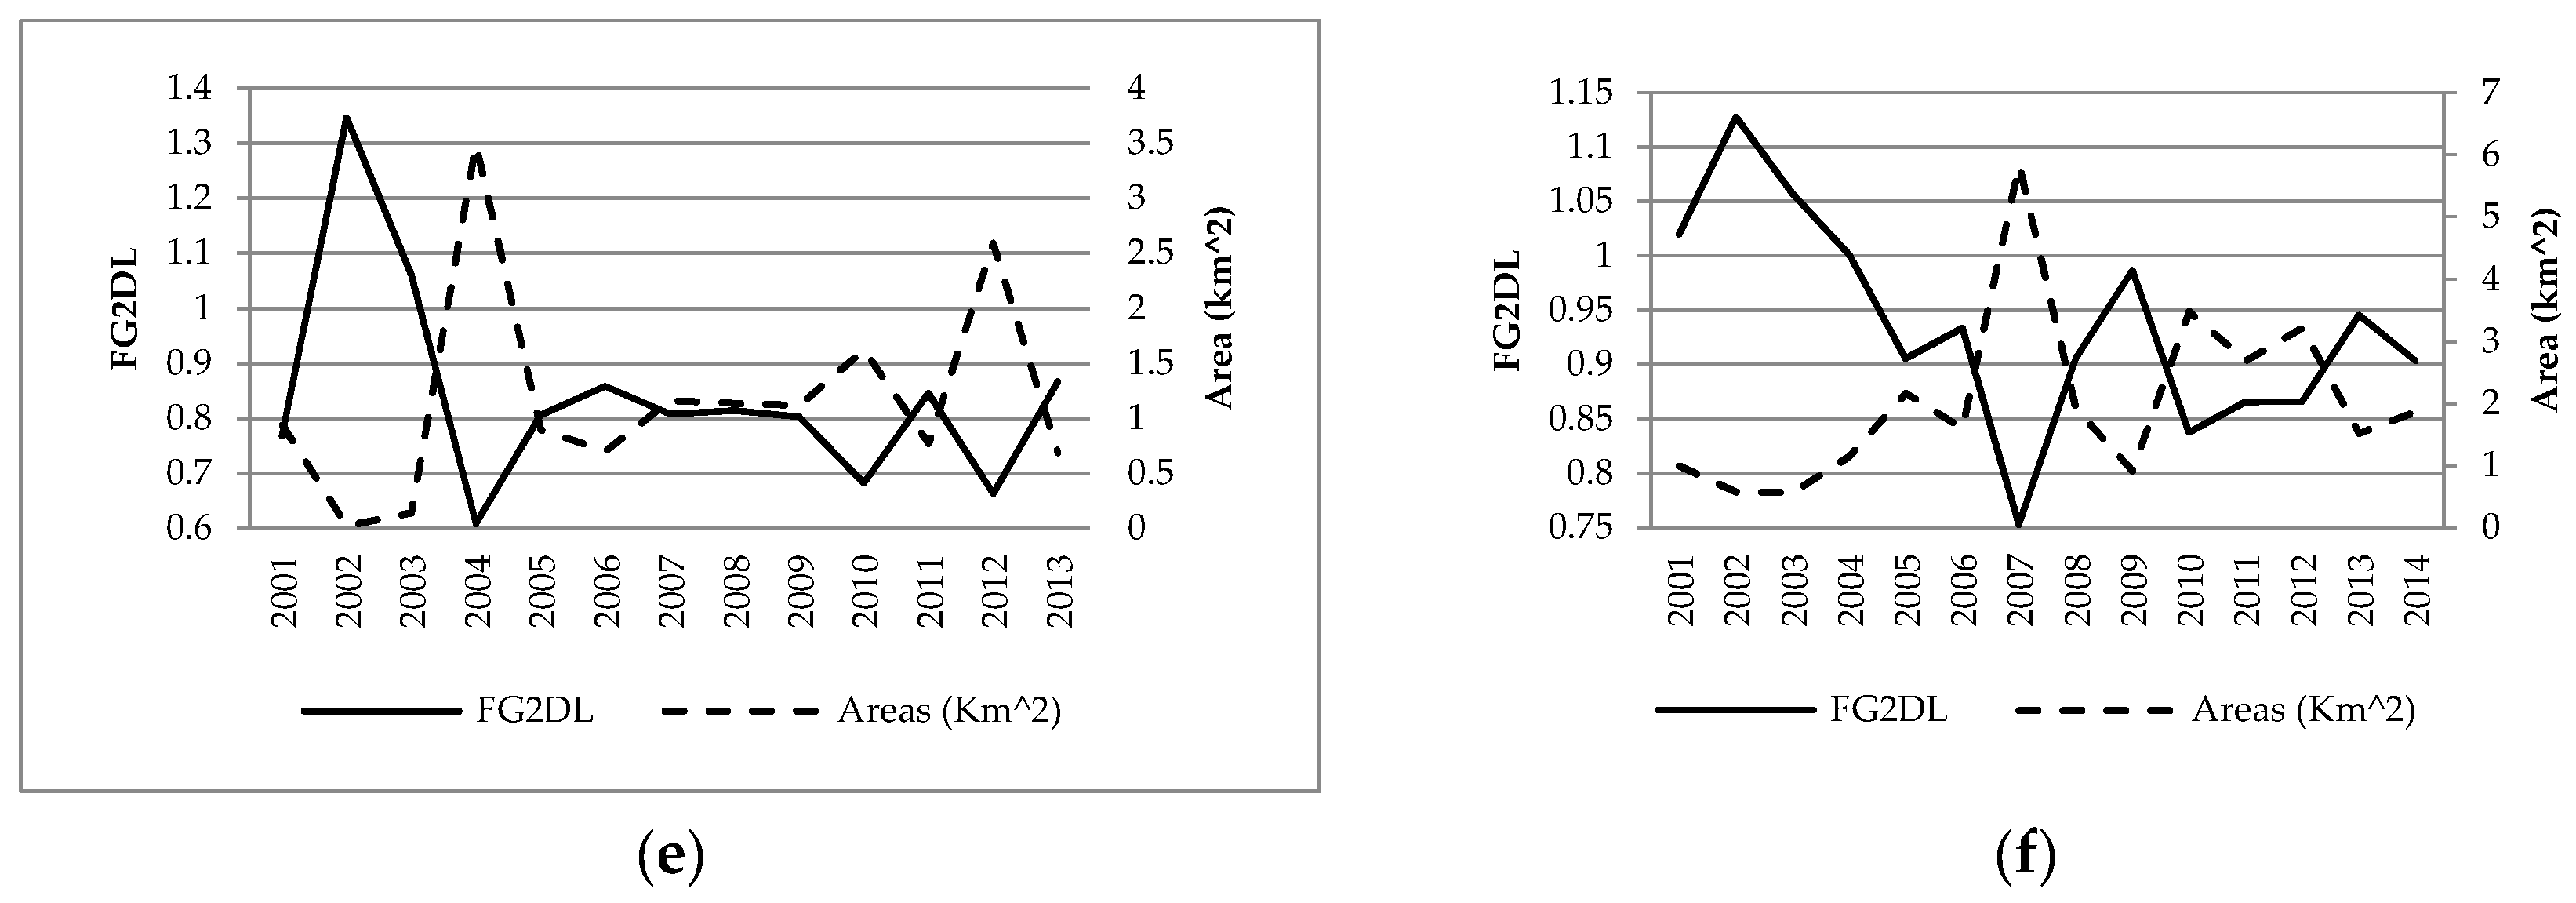
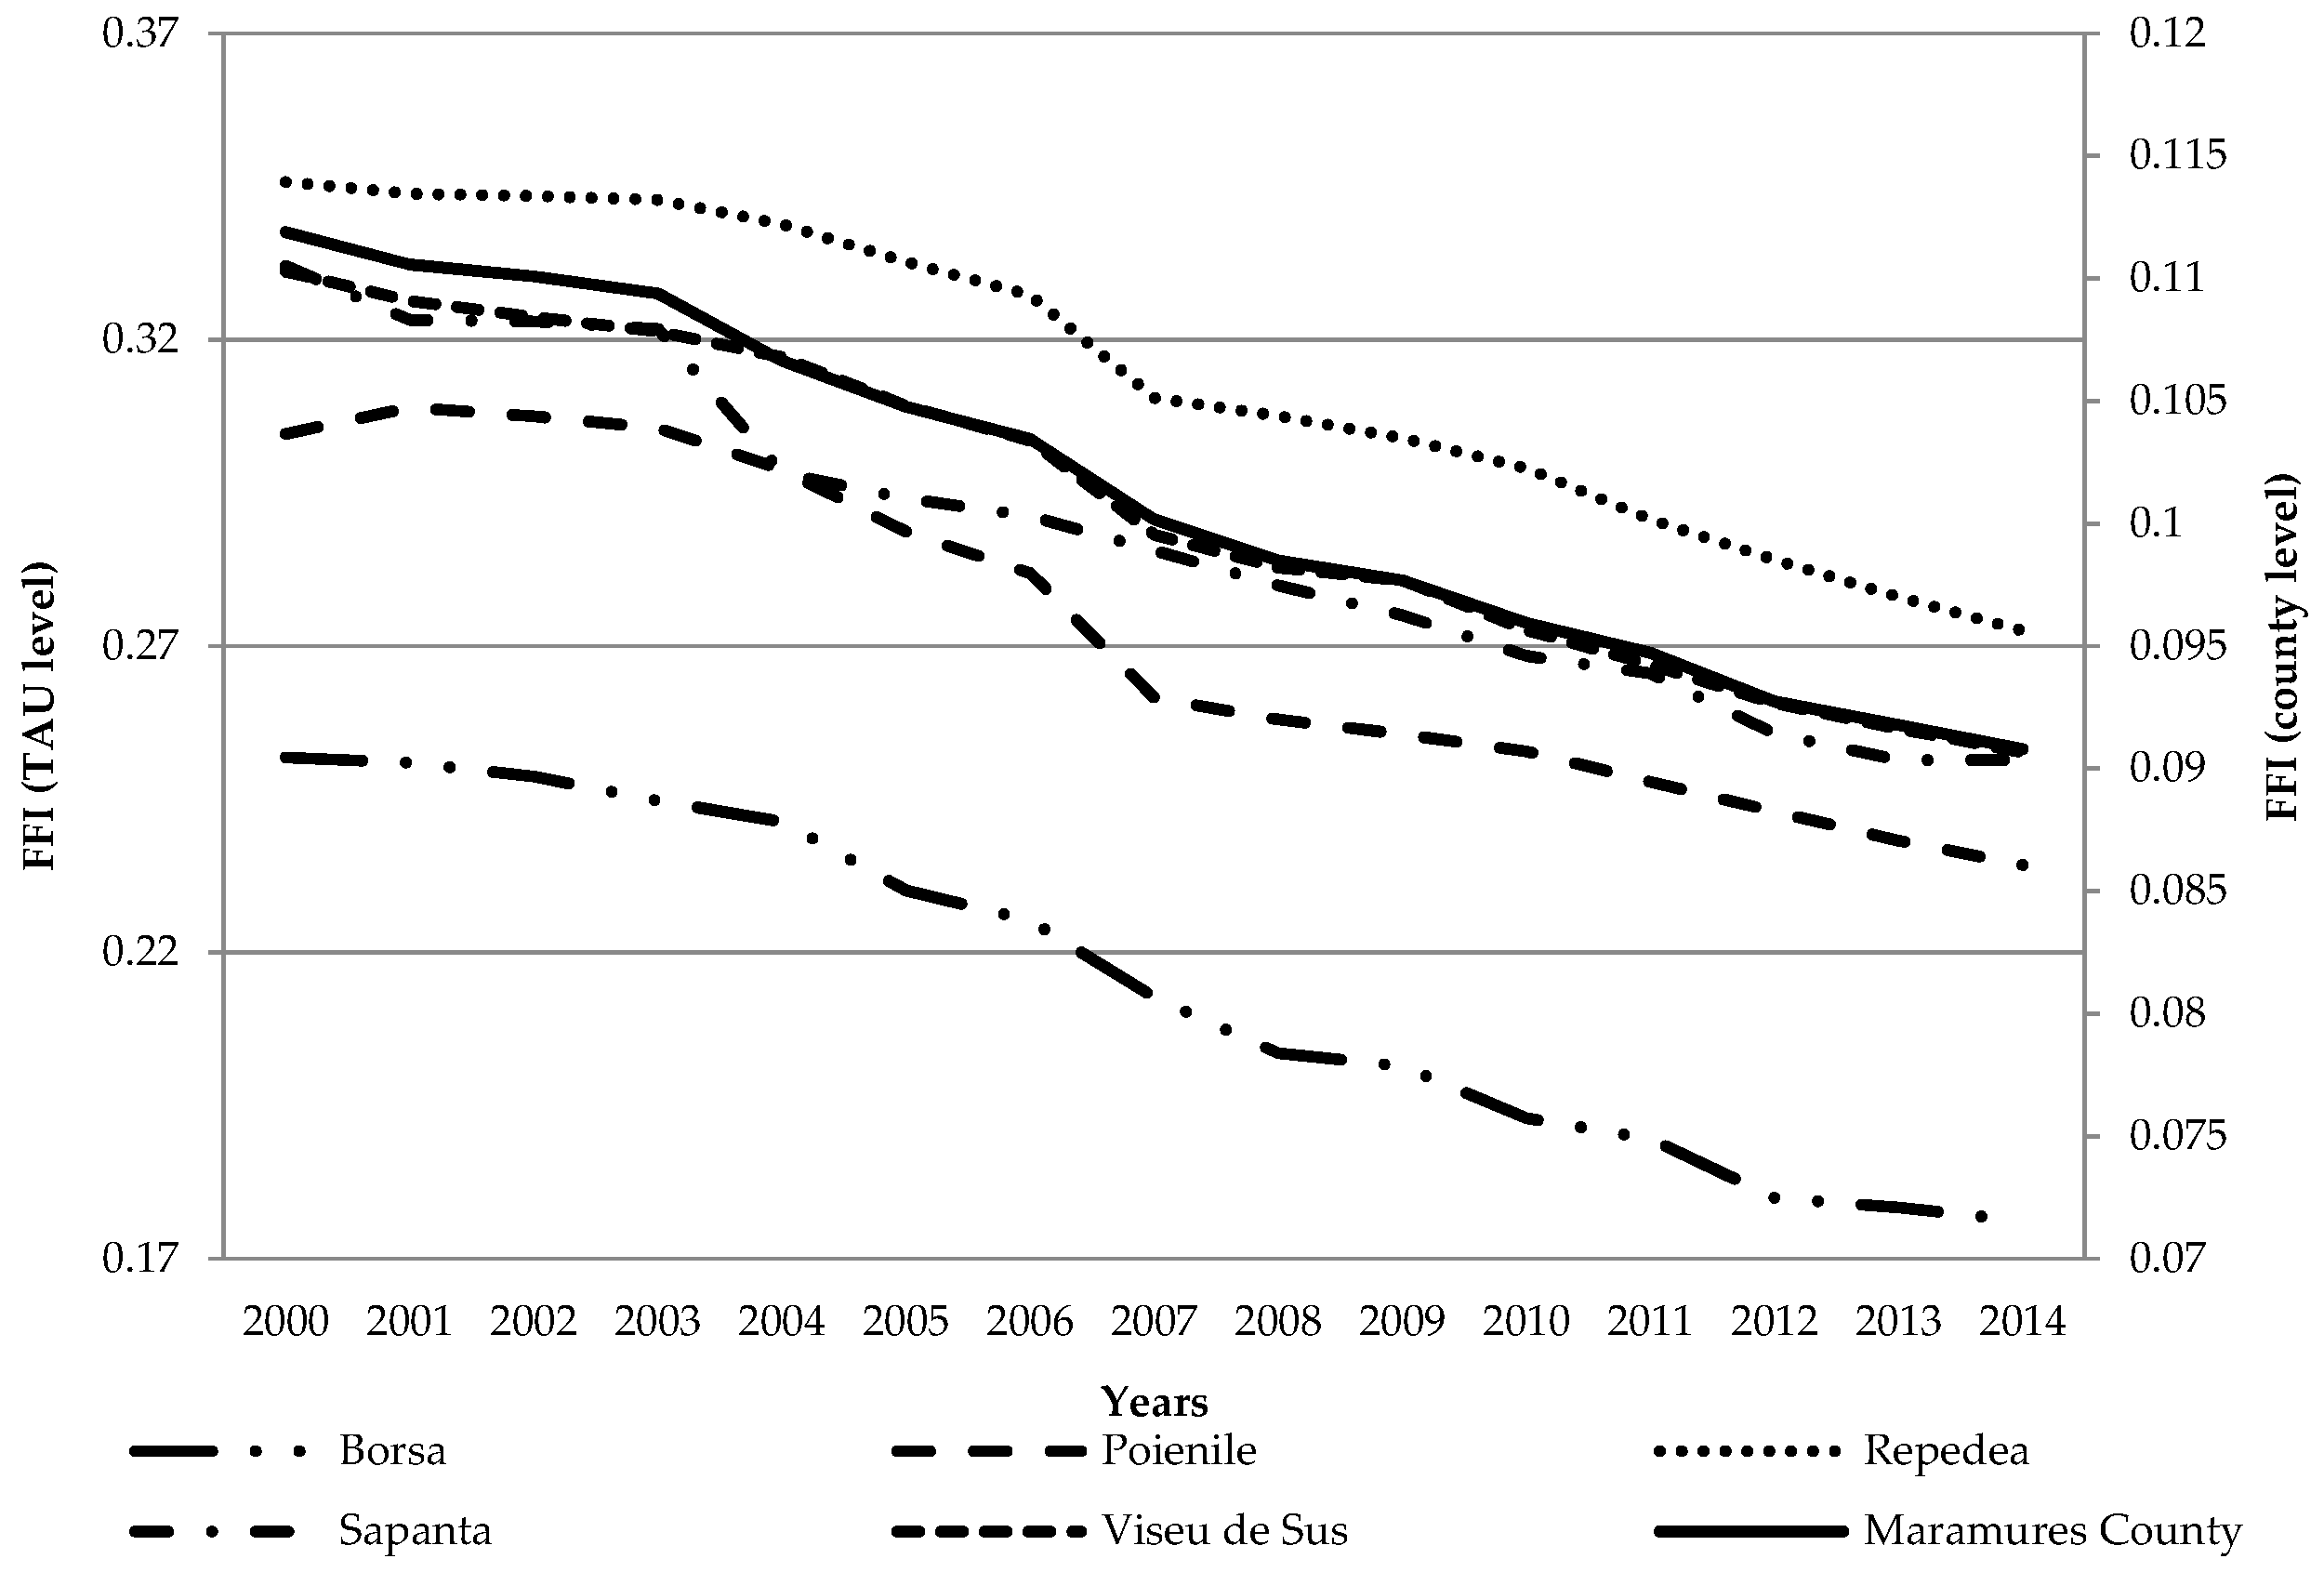
3.2. Spatio-Temporal Patterns of Forest Fragmentation

The low annual FFI values of the Maramureș County (all numbers below 0.12; Figure 3) indicate that the county is characterized by large fragmentation of forested area. Along with the expansion of deforestation in the period analyzed, the FFI of the forested areas of the Maramureș County decreased by 0.0211 (Figure 3), indicating a continued increase in the fragmentation of forested areas especially in the northwest (NW) of the county. The largest decreases of the FFI values were registered in 2004, 2007, and 2012 and the smallest reduction of the FFI occurred in 2002 (0.0005), corresponding to the years of highest and lowest deforestation rates. Out of the five most forested TAUs from the analyzed Maramureș County, Borșa had the lowest FFI in 2000, while Repedea (the TAU with the most compact forest of Maramureș County) had the highest FFI. Deforestation during the 2000–2014 period caused an increased fragmentation of the forested areas, with FFI declines ranging between 0.0704 (Poienile) and 0.0806 (Săpânța), which were the two TAUs showing the strongest fragmentation of the forested areas during the period of analysis. The largest fragmentation of forested areas was recorded in 2004 in Săpânța in the NW of the county, and in 2007 in the other four TAUs from the eastern part of the county. At the lower end, the smallest FFI declines were recorded in 2001 (Borșa and Poienile), 2002 (Repedea), 2009 (Vișeu de Sus), and 2014 (Săpânța, when the difference between FFI 2013 and FFI 2014 was 0).

3.3. Relationship between Deforestation and Fragmentation/Heterogeneity

We noted that the FFI achieved a very good quantification of the spatial effects of deforestation on forested areas. Thus, the evolution of FFI closely follows the evolution of the reduction in the forested areas with correlation coefficients (R2) ranging between 0.99 for Maramureș County and 0.98 for the Săpânța territorial administrative unit (Figure 4).
The FG2DL value (lacunarity) (Figure 5) allows for a quantification of the degree of the forested area’s heterogeneity, indicating whether deforestation occurred in a homogeneous or heterogeneous/dispersed manner. For Maramureș County, the highest FG2DL value was registered in 2002, when rather limited areas were deforested. In 2007, with larger areas of deforestation, the FG2DL had the lowest value. Thus, when deforestation was much higher in this area, it was more organized, and more compact.
At the TAU level, the same pattern is observed: when the deforested areas are more consistent, the lacunarity is lower, and vice versa. Thus, the largest deforestation dispersion was recorded in 2001 (Borșa) and 2002 (Poienile, Repedea, Săpânța, Vișeu de Sus). Deforestation occurred in the most compact manner in 2004 (Săpânța), in 2007 (Repedea, Poienile and Vișeu de Sus), and in 2012 (Borșa). The highest FG2DL value from the data analyzed was registered in 2002 in Poienile when only small areas were deforested. The lowest FG2DL value was recorded in Săpânța, coincides with relatively high rates of deforestation in 2004. At the time of maximum deforestation at the TAU level in Borșa 2012, (998.5 ha), an FG2DL value of 0.6327 was registered, indicating that deforestation in Borșa was made in compact and homogeneous clusters, but dispersed as compared to Săpânța.
At the county level, the correlation coefficient between FG2DL and the deforested areas is high (R2 value of 0.91), but it is lower at the TAU level: 0.61 in Săpânța and 0.83 in Vișeu de Sus, being the lowest and highest value. Hence, as R2 increases, there is a closer correlation between the deforested areas and FG2DL and, thus, the higher FG2DL values indicate that deforestations are in more compact and homogeneous clusters, but dispersed between each other.
The correlation coefficient (R2) between FFI and FG2DL has the highest values in Repedea (0.51), where the decrease of the FG2DL was more significant due to a lower FFI (more compact deforestation), and the lowest value in Poienile (0.20), where there are years when the lowering of the FFI involved higher values of the FG2DL (dispersed deforestation), like in 2009 (0.26 for FFI) and 1.01 for FG2DL) (Figure 6).

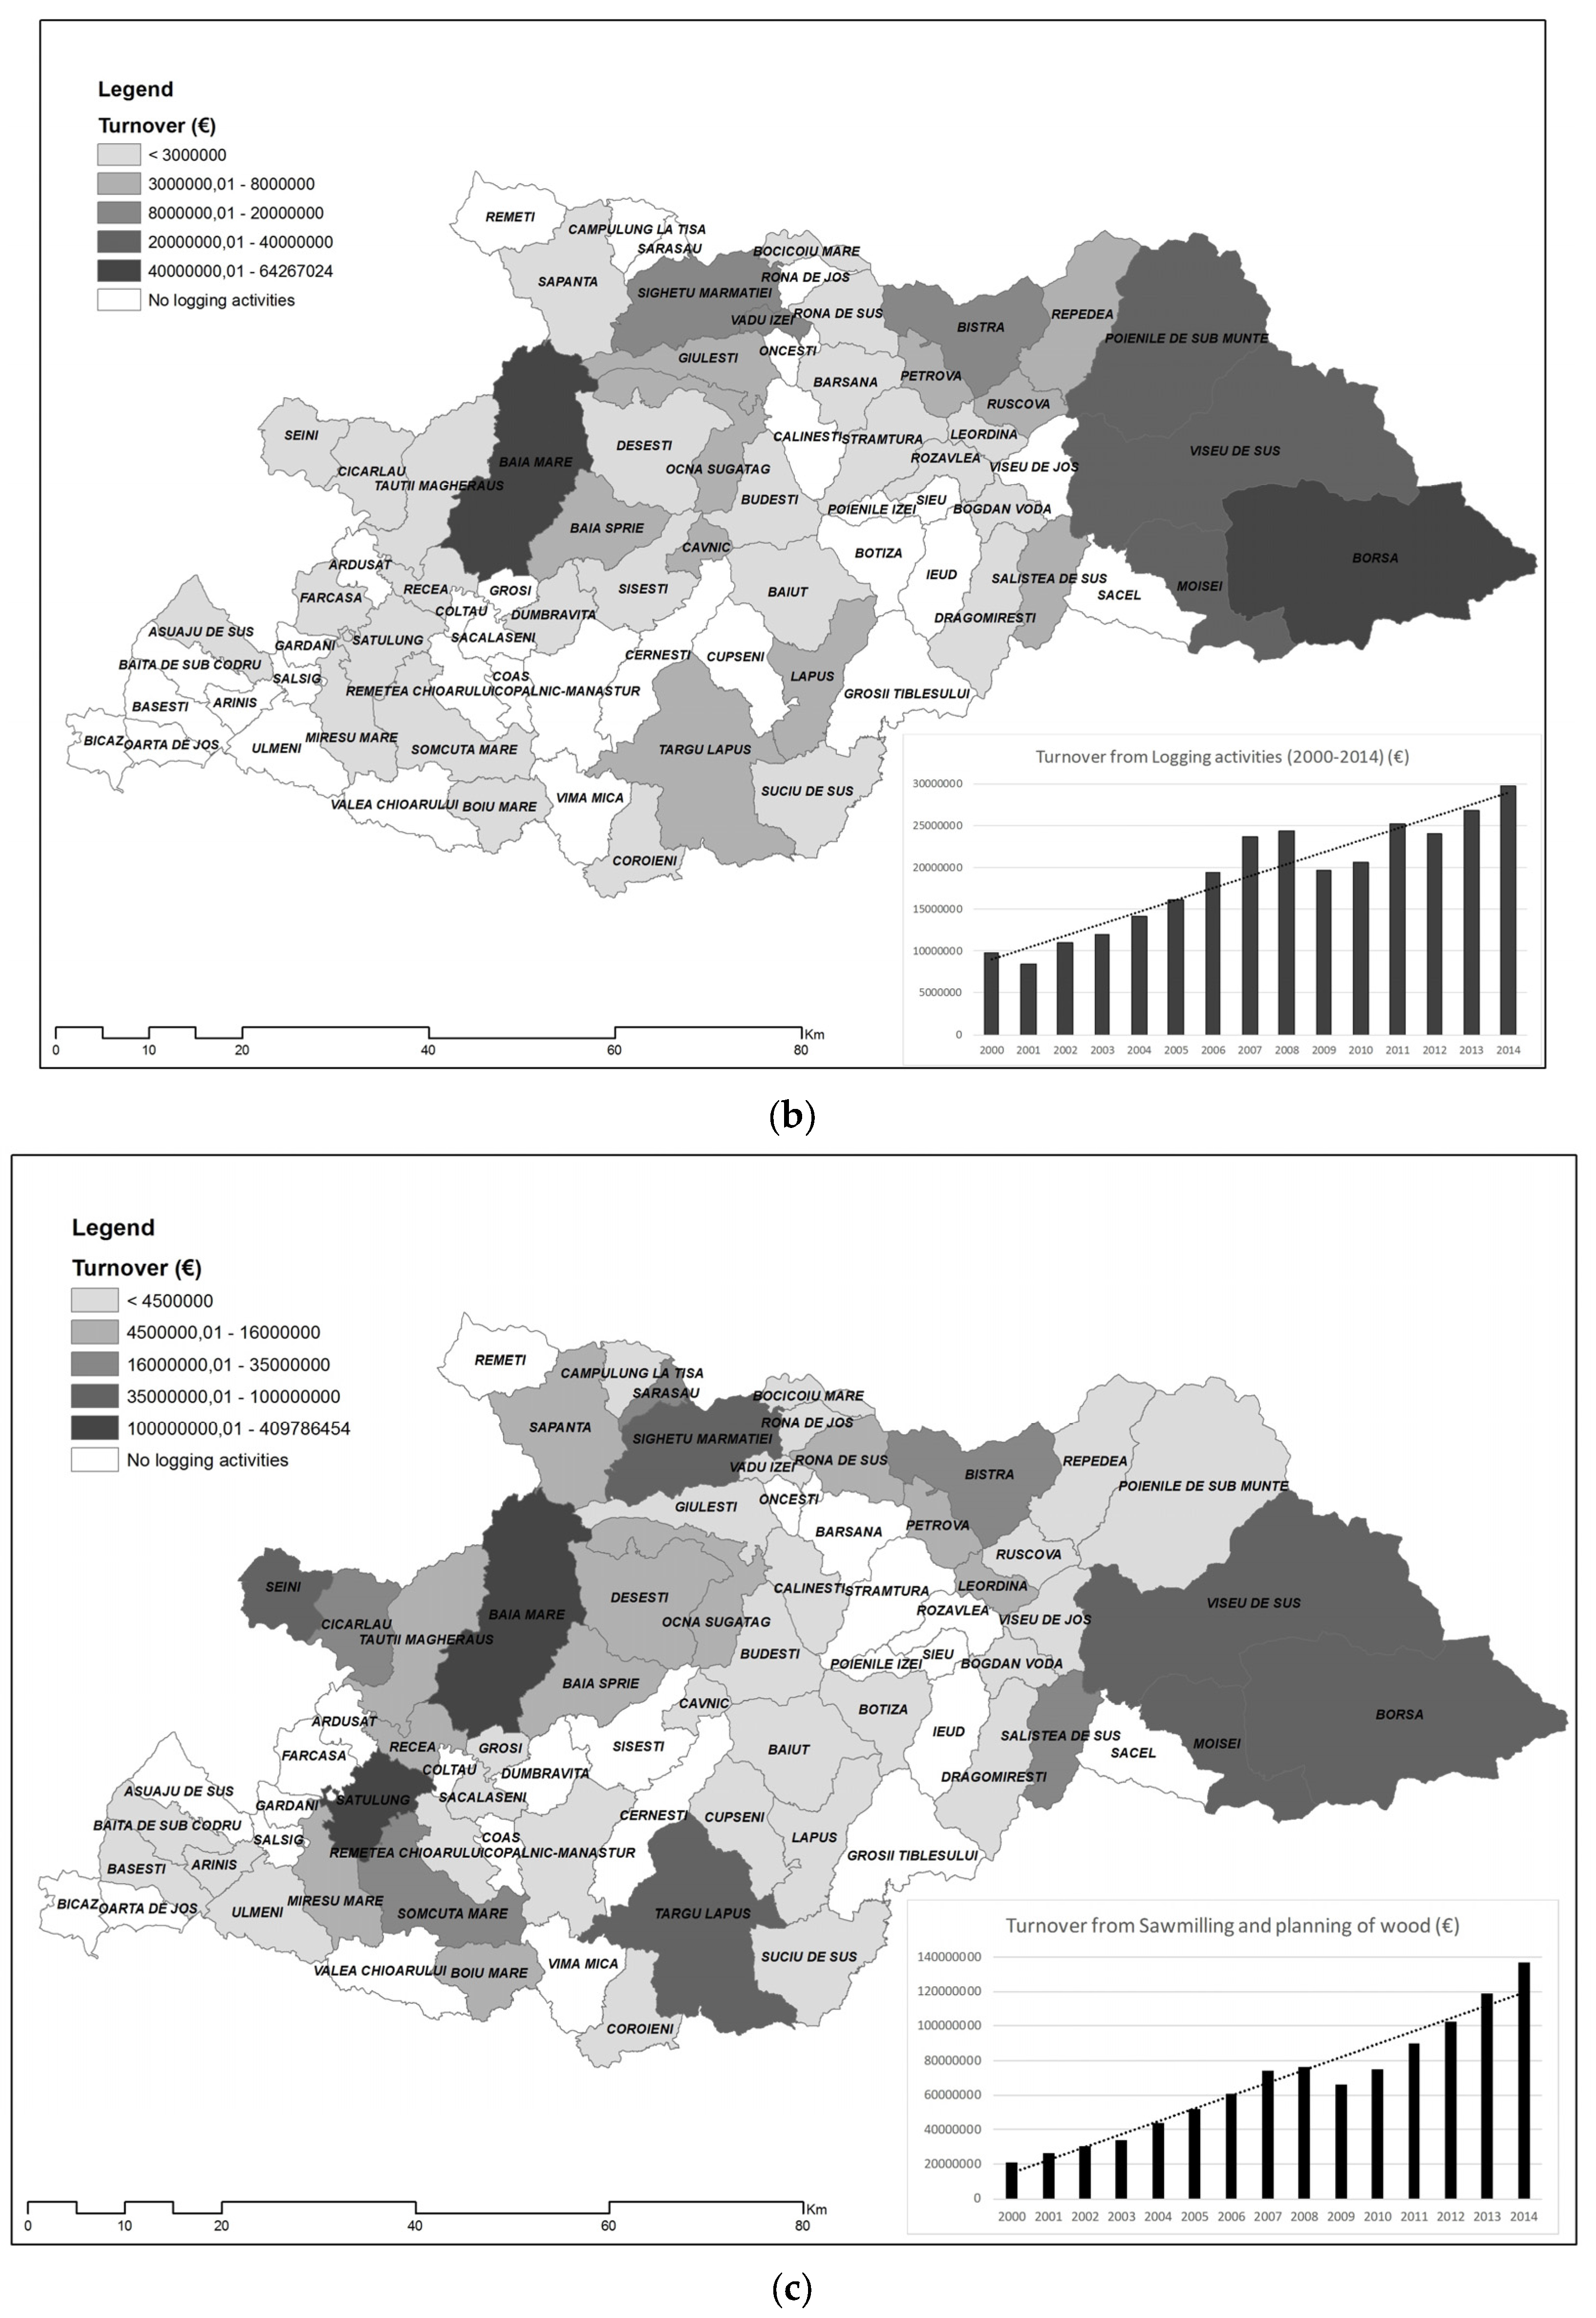
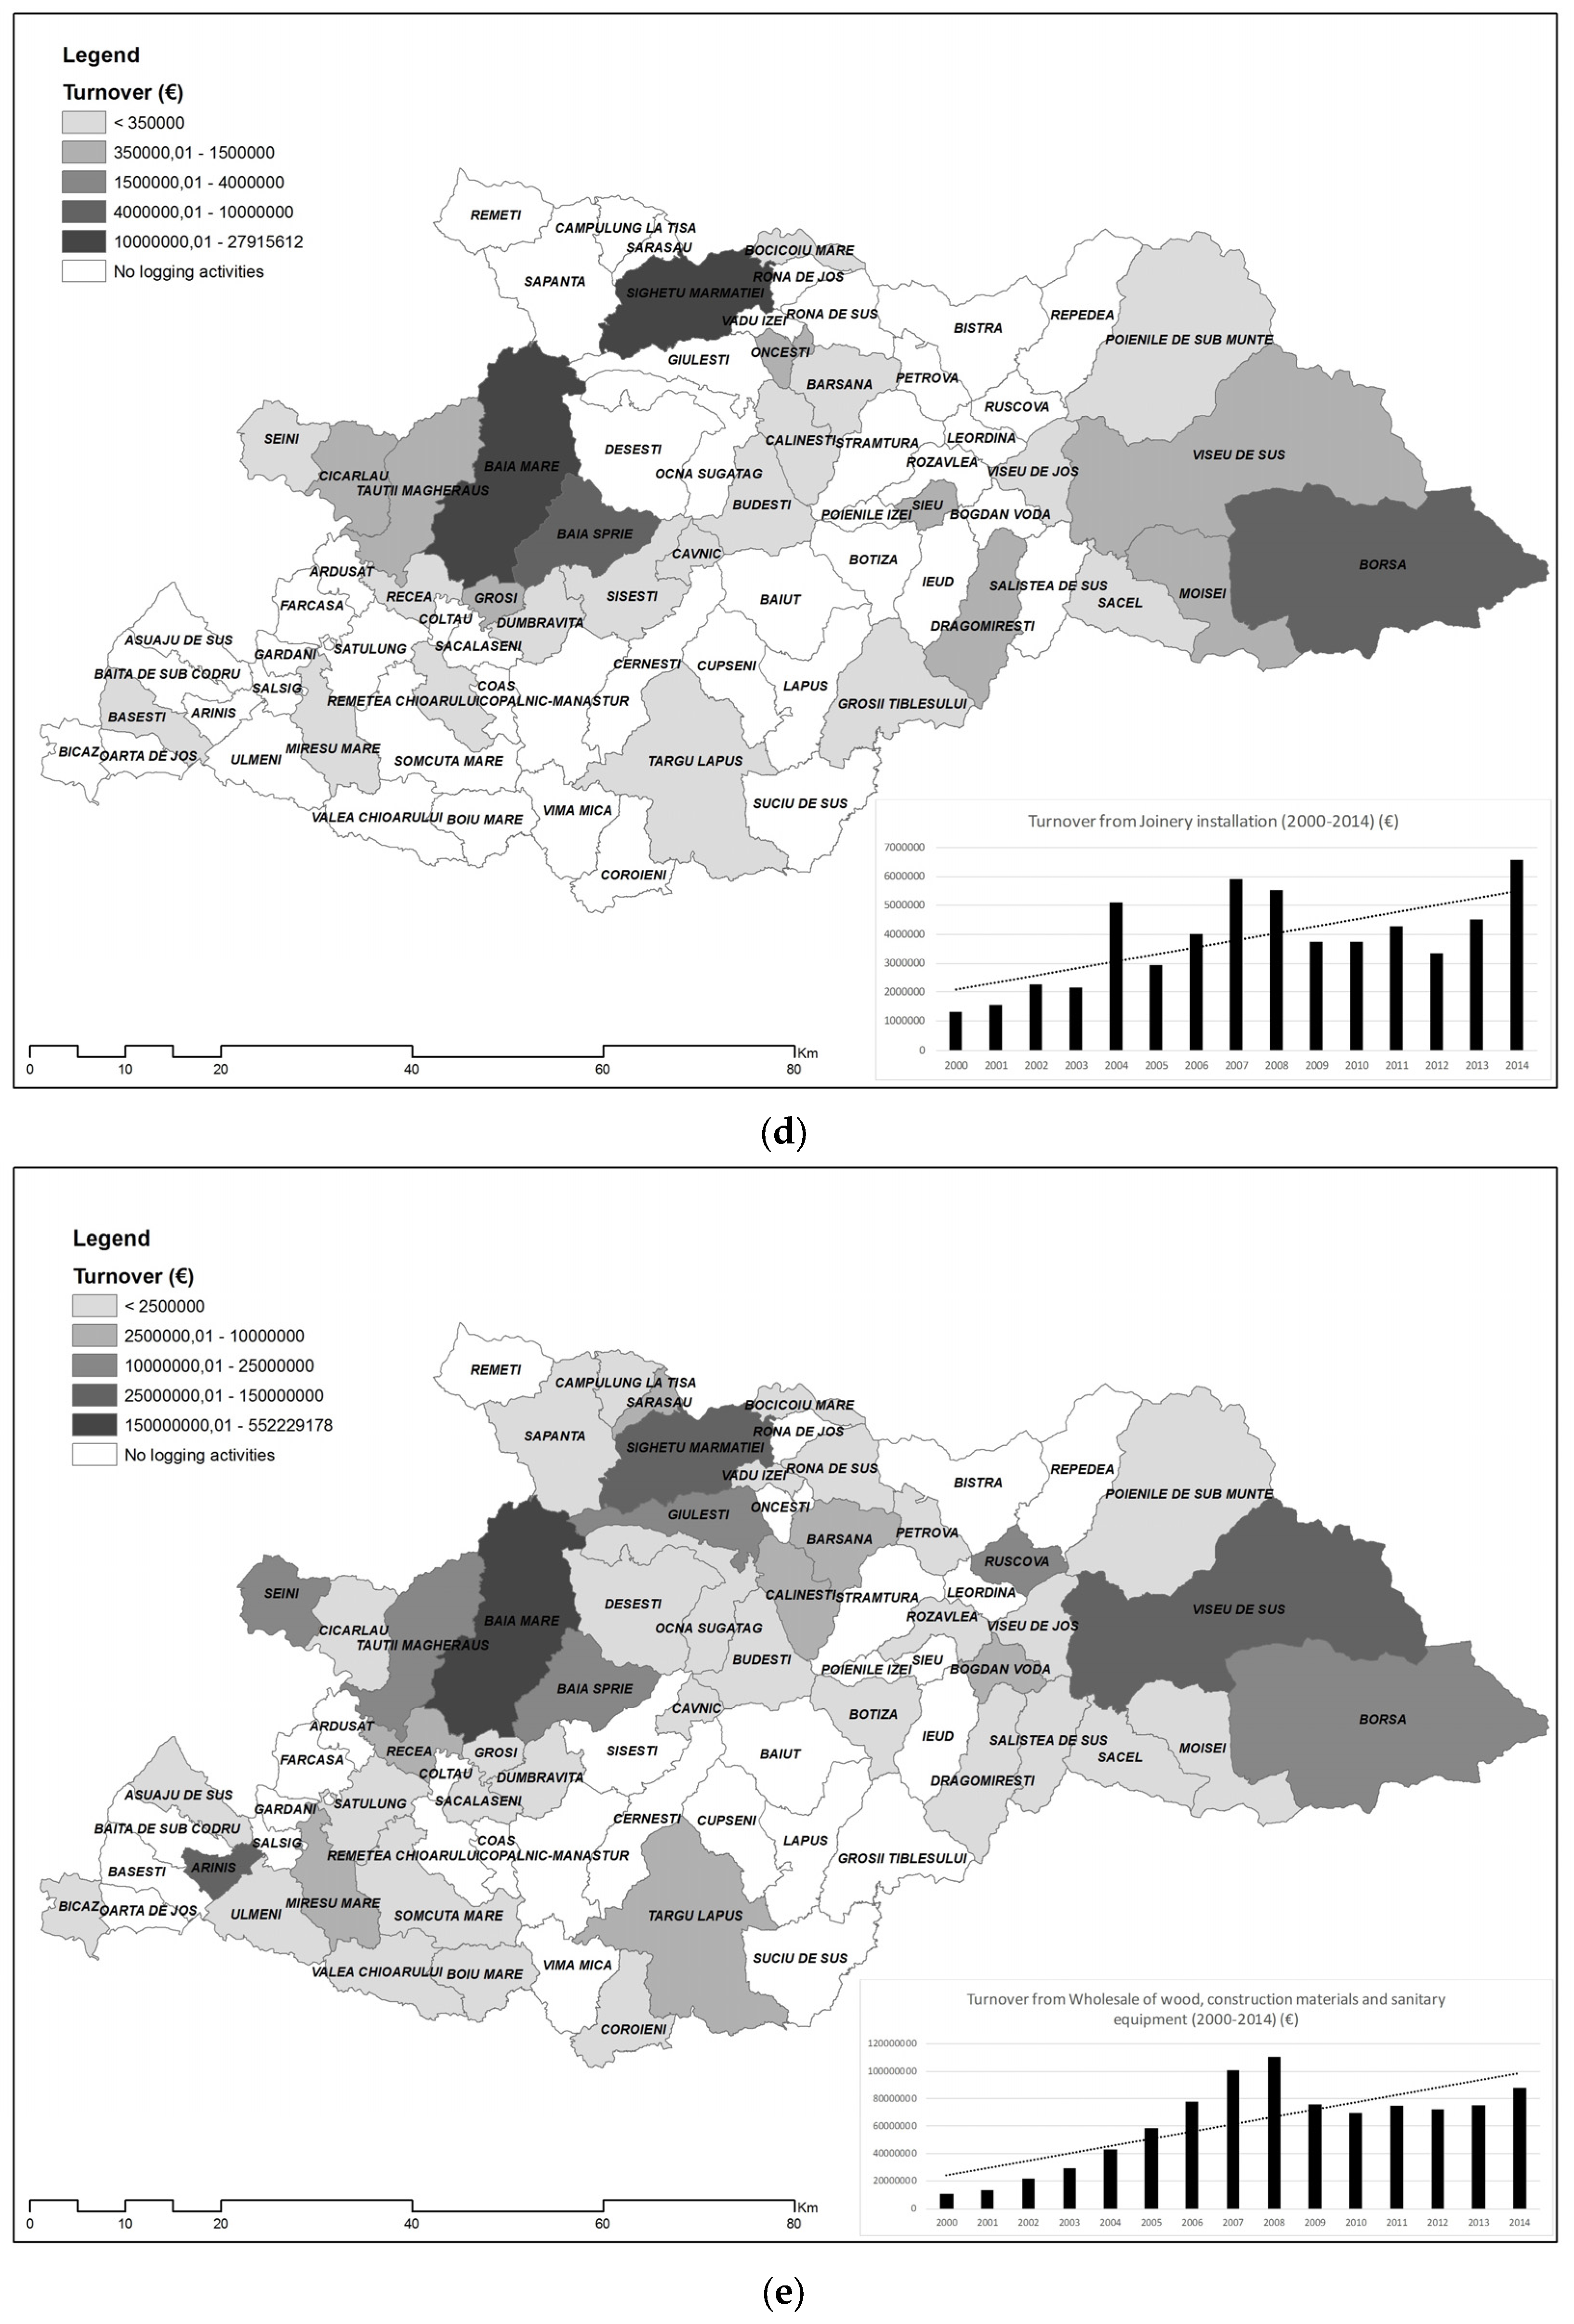
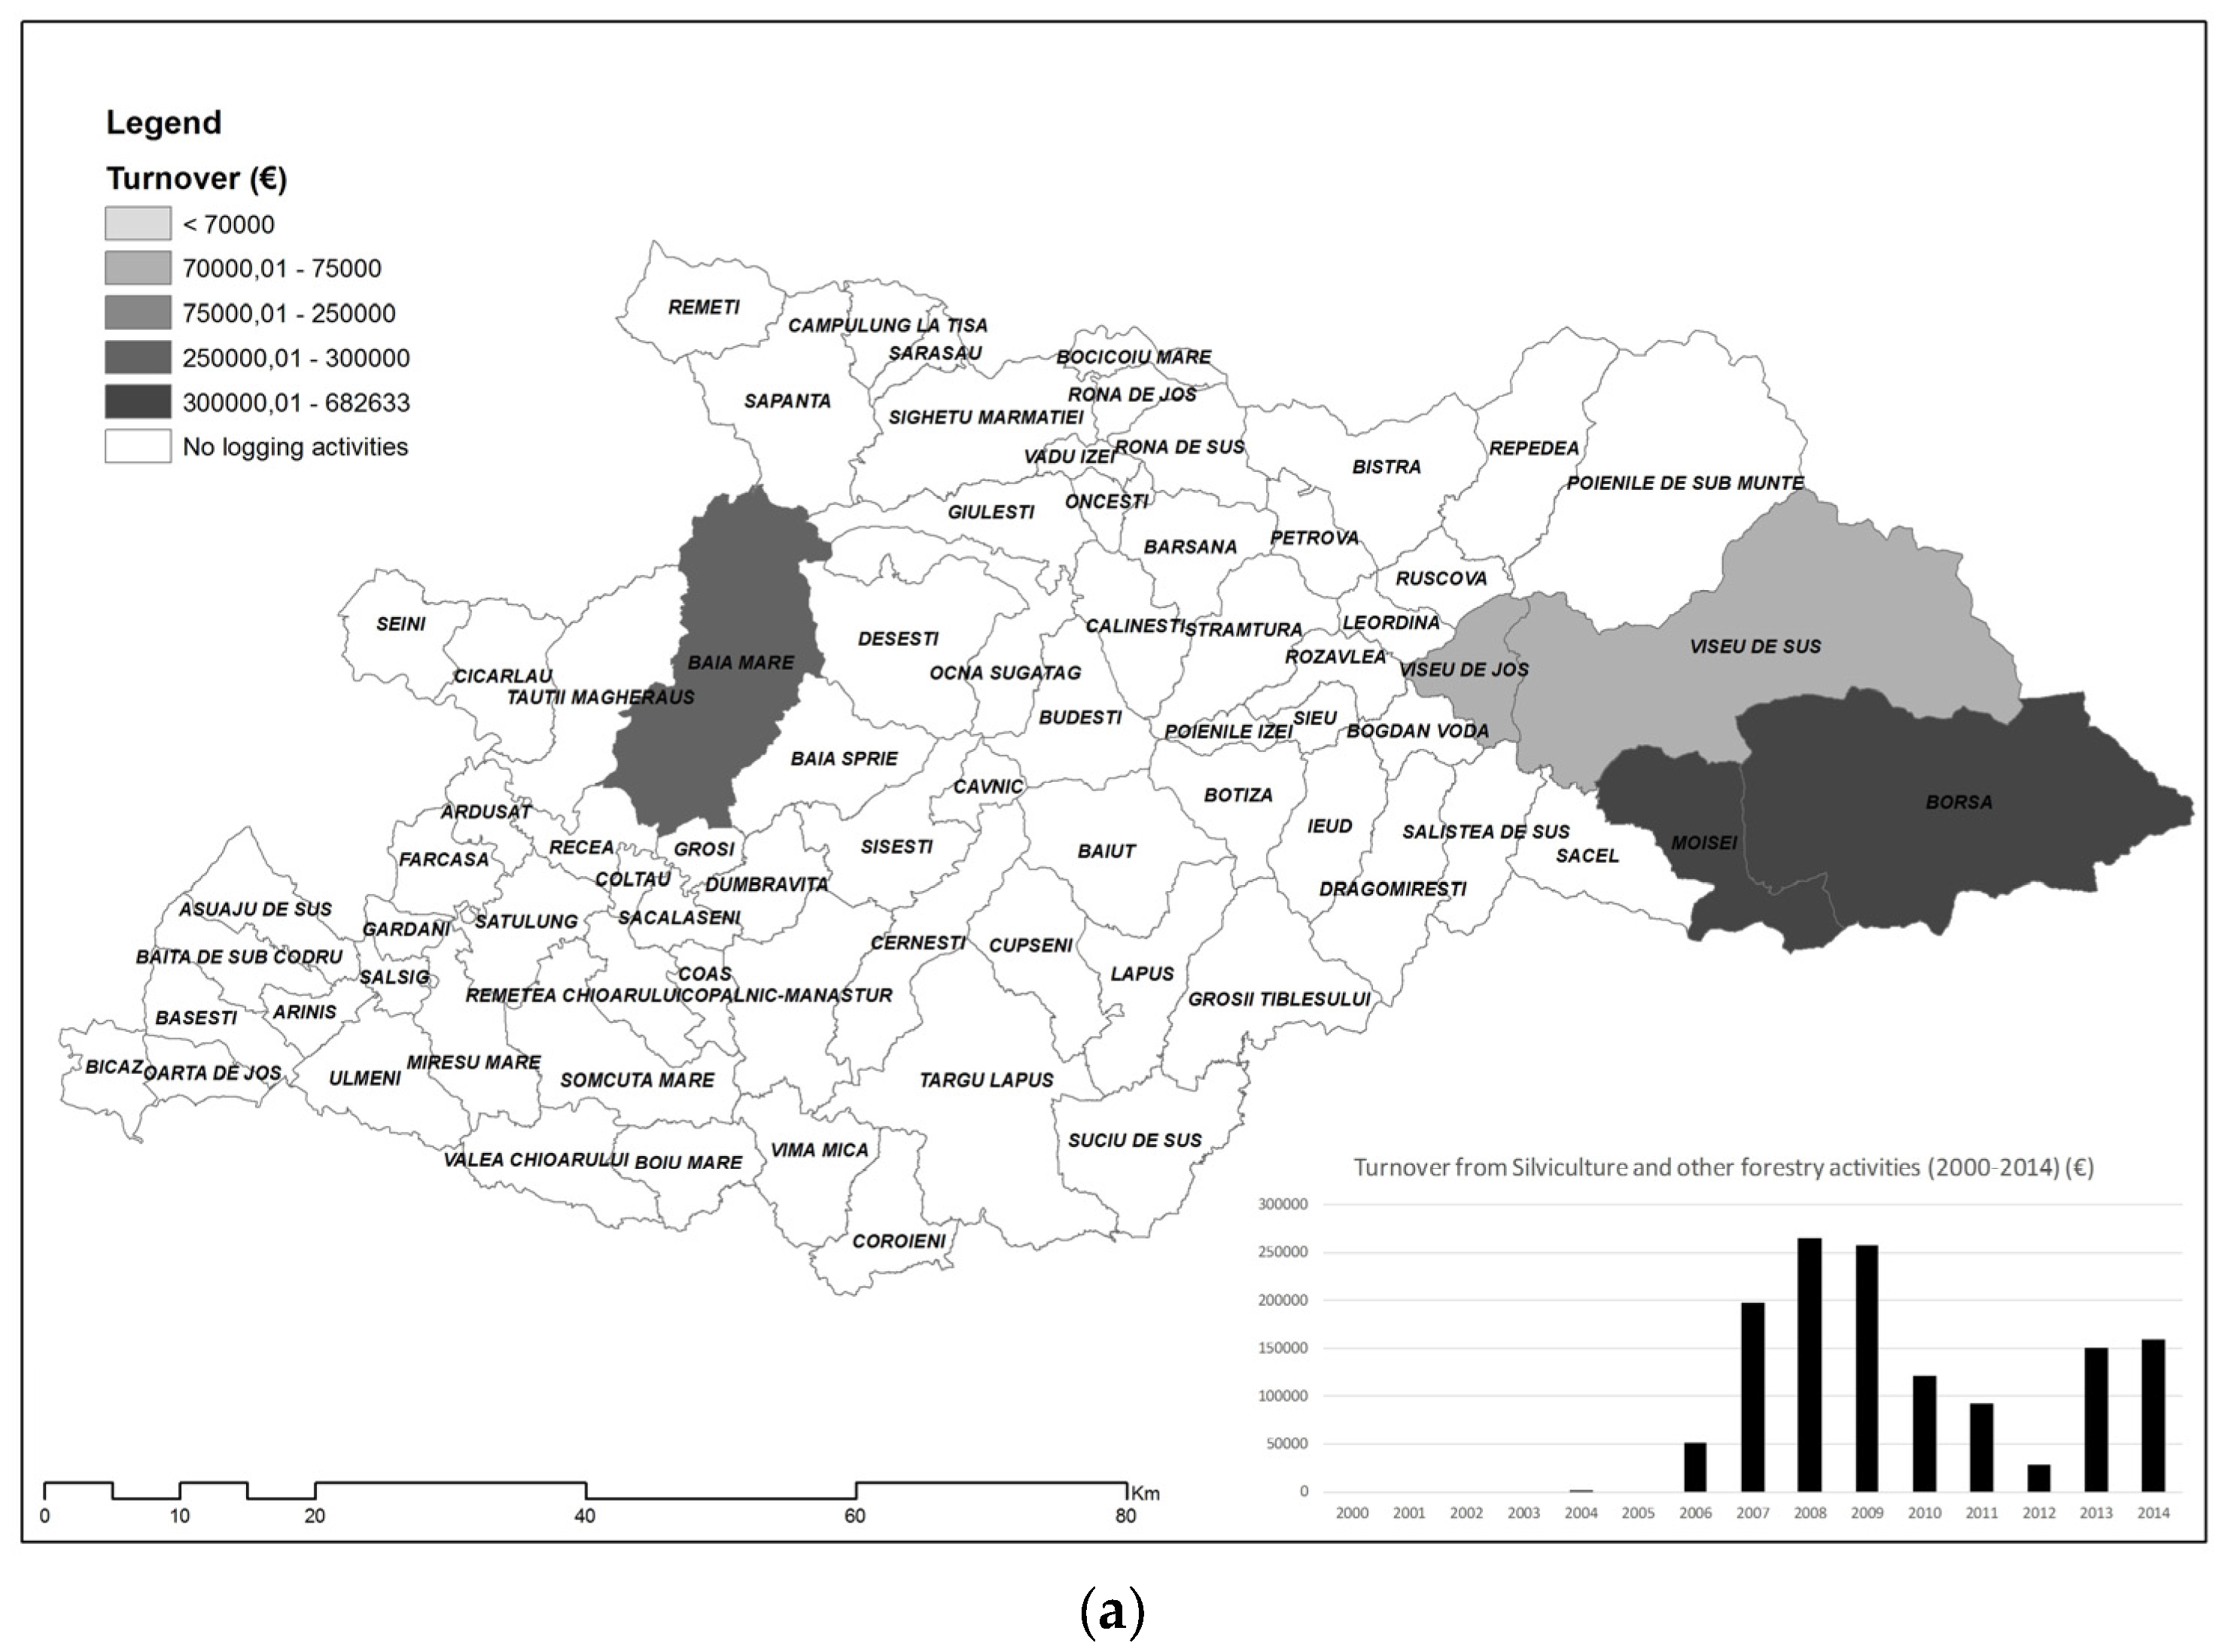
3.4. Spatio-Temporal Patterns of Economic Activity Related to Timber Harvesting

Figure 7a–e represents the distribution of the turnover of (a) sylviculture and other forestry activities; (b) logging; (c) sawing and plantation of woods; (d) joinery installations; and (e) wholesale of woods, construction materials, and sanitary equipment for all administrative units in the county of Maramureș. The spatial representation of these economic activities, for the county of Maramureș, is provided at the level of the TAU as given by the NACE codes (statistical classification of economic activities in the European Community). What can be seen is that an important part of the turnover reflecting the economic activity related to timber harvesting can be found in some municipalities that do not have large forested areas, but are rather centered nearby Baia Mare, Borșa and Vișeu de Sus. This pattern can be explained by the development of subsidiaries of multinational companies, which was conducted mainly in the county capital (Baia Mare) and other cities in the county of Maramureș (Vișeu de Sus, Baia Sprie, Sighetu Marmației, etc.).

4. Discussion

The evolution of the forested areas in the Maramureș County of Northern Romania in the period of 2000–2014 reveals a general downward trend. This is caused by an increasing exploitation through legal and illegal logging, reflected by the economic changes over this period (Figure 7a–e) to a large extent governed by changes in the legislation [39]. The box-counting method is generally used for the fractal analysis of the forested areas, to describe spatial patterns [26,34,40] and their dynamics in the deforestation process [27], or to describe root morphology [28]. Here we used fractal analyses to study the evolution of fragmentation related to the space occupied by forested areas and affected by deforestation, by means of the Fractal Fragmentation Index [34], using the Pyramid Dimension method, as well as the degree of heterogeneity and the dispersion of the deforested areas by Fixed Grid 2D Lacunarity [35]. In doing this, the Global Forest Change 2000–2014 database [29] was used, which is based on satellite remote sensing Landsat imagery. Our findings confirm our hypothesis, that the use of fractal analyses on Landsat imagery in a 30 m spatial resolution is very useful in providing quantitative information on the spatio-temporal patterns of deforestation.
In a previous study [34], the FFI was used to determine the fragmentation or compaction of forests. However, the deforested and regenerated areas were analyzed only at the county level, not at TAU’s level, without including the temporal dimension. In this paper, we determined changes in the FFI over a 15 year period and at a detailed spatial level of territorial administrative units (TAUs). By doing so, it can be noticed that the FFI can play an important role in quantifying the evolution of the fragmentation degree of the forested areas, indicating the mode and the extent to which deforestation spatially fragments forested areas. The correlation between the FFI and the absolute values of the forested areas provided us with valuable information. Overall, very high R2 were obtained, suggesting that FFI can accurately quantify deforestation. However, in some instances of massive deforestation, the R2 is reduced, as the FFI does not decrease correspondingly to deforestation rates, indicating that deforestation activities were compact in shape, and forested areas are not likely affected by fragmentation.
In the previous studies by Sengupta and Vinoy [34,40], lacunarity was used to underline the degree of heterogeneity of the deforested areas. In this study, we present another method to determine lacunarity, namely FG2DL, which is fast and efficient in processing time series of high-resolution image data from the Landsat archive and is expected to be a highly useful method in relation to the emerging data archives of Senitnel-2 data. The study demonstrates that the FG2DL can be valuable in quantifying the degree of homogeneity or spatial heterogeneity of the deforested areas, providing new quantitative information on the dispersion of deforestation.
The combined use of the FFI and the FG2DL (correlation analysis) provided us with complementary information regarding the impact of the dispersed or compact deforestation upon the fragmentation of the forested areas. The correlation between the absolute values of the deforested areas and the FG2DL provided useful information, as in most situations an increase in the deforested areas is characterized by a decrease in FG2DL. However, some important exceptions occur when the deforested areas are more compact and homogeneous than the county average. The FFI offers information about the fragmentation/compactation of the forest areas and, in addition, FG2DL offers information about the heterogeneity/homogeneity of deforestation in the forest areas. So, in some cases an increase in fragmentation is not associated with an increase in heterogeneity causing a rather low correlation coefficient; between 0.19 (Poienile) and 0.51 (Repedea). The present research is applied only at the Maramureș County level and at its five most deforested territorial administrative units (TAUs), only by using the Global Forest Change 2000–2014 database.
The observed spatial displacement between the highest turnovers from timber harvesting occurring in urbanized municipalities and the origin of the woody resources primarily in rural municipalities is likely to be driven by the development of subsidiaries of multinational companies. This situation occurred due to the general precariousness of the legislation in Romania (forest legislation) [41], being rather permissive, which stimulated and encouraged logging, which eventually stimulated economic growth in the region. The two main problems that arise from this are that the turnover is obtained from municipalities, which do not have forested areas. This can be termed areal migration of the turnover, which comes from municipalities with small budgets (but rich in forest mass) and is transferred to other urbanized municipalities. The other important aspect is that the forest activities that have developed in forested municipalities do not provide added value to the woody resources (e.g., logging activities in contrast to furniture production, which produces more value and implies more qualified employees) [42,43,44].
According to our findings, the analysis of the economic pressure on the forest resources in Maramureș County indicated that the forested areas are ranked fifth in Romania, out of 41 counties. However, when considering the fractal dimension, Maramureș County holds a ninth place due to the structuring/patterns of the forested areas into relatively compact areas (described by FG2DL), and also due to other strongly fragmented forest areas (described by FFI). As for deforested areas Maramureș County is ranked third, after Suceava and Harghita (located east and south east of Maramureș) in the period 2000–2014. In total, 19,122.8 hectares were deforested in the Maramureș County; a fact also reflected by the small value of the FFI: 0.09 in 2014.

5. Conclusions

Deforestation is an important phenomenon which may create major imbalances between territorial administrative units. These imbalances may cause development difficulties by multiplying their negative effects, which may affect the environment (floods, pollution, landslides) and the socio-economic components (labor force). The identification and research of the causes which determine the expansion of the deforested areas is a major concern both for researchers and for decision-makers, due to the complex relations established between forests and the other components of the territorial systems.
Fractal analysis is a tool (method) to assess the geographic space-time phenomena and therefore can be valuable improving our knowledge of the spatial organization of deforestation in forested areas. The FFI provides important information on the textural effect of deforestation on forested areas, quantifying the degree of fragmentation whereas lacunarity is a method for the FFI, deemed useful to quantify how deforestation is made in relation to the degree of heterogeneity/homogeneity. We show here that the individual, as well as combined, use of the two methods FFI and Lacunarity (FG2DL) provide new and complementary information to traditional deforestation rates, that can be relevant in developing strategies in forest management.
Among the causes having a primary impact on deforestation in Maramureș County, northern Romania, we specify the following: low income of the local communities, excessive development of the economic sectors based on wood exploitation and processing against the local capacity of support, and legislative gaps. Thus, the need becomes obvious for effective territorial management strategies to mitigate the imbalances generated by mass forest cutting, especially illegal cutting. This is especially important for those local systems that have their functional profile based on the resources offered by the forest.
The specific territorial management strategies must aim primarily at the decision-making process of institutional reorganization, so that the decisions taken may be effective.

Acknowledgments

This work was supported by a grant of the Romanian National Authority for Scientific Research and Innovation, CNCS-UEFISCDI, project number PN-II-RU-TE-2014-4-0835. The authors would like to thank Simion Adrian-Gabriel of the University of Bucharest, Romania, and George N. Zaimes, from the Eastern Macedonia & Thrace Institute, Greece, for their help.

Author Contributions

All authors have equal contribution to the preparation of this scientific paper.

Conflicts of Interest

The authors declare no conflict of interest.

References

  1. Food and Agriculture Organization. Global Forest Resources Assessment 2010, Main Report, FAO Forestry Paper. Available online: http://www.fao.org/docrep/013/i1757e/i1757e.pdf (accessed on 25 September 2016).
  2. Pravalie, R.; Sirodoev, I.; Peptenatu, D. Detecting climate change effects on forest ecosystems in Southwestern Romania using Landsat TM NDVI data. J. Geogr. Sci. 2014, 24, 815–832. [Google Scholar] [CrossRef]
  3. UNCED-Agenda 21 1992, United Nations Conference on Environment & Development Rio de Janerio, Brazil, 3–14 June 1992, Chapter 11. Available online: https://sustainabledevelopment.un.org/content/documents/Agenda21.pdf (accessed on 14 August 2016).
  4. The UE Forest Action Plan 2007–2011. Available online: http://ec.europa.eu/agriculture/fore/publi/2007_2011/brochure_en.pdf (accessed on 14 August 2016).
  5. Houghton, R.A. Tropical Deforestation as a Source of Green House Gas Emissions; Mountinho, P., Schwartzman, S., Eds.; Tropical Deforestation and Climate Change, IPAM: Belem, Brazil; Environmental Defense: Washington, DC, USA, 2005; pp. 13–21. [Google Scholar]
  6. Peptenatu, D.; Sirodoev, I.; Pravalie, R. Quantification of the aridity process in south-western Romania. J. Environ. Health Sci. Eng. 2013, 11, 1–5. [Google Scholar] [CrossRef] [PubMed]
  7. Stickler, C.M.; Nepstad, D.C.; Coe, M.T.; McGrath, D.G.; Rodrigues, H.O.; Walker, W.S.; Soares-Filho, B.S.; Davidson, E.A. The potential ecological costs and cobenefits of REDD: A critical review and case study from the Amazon region. Glob. Chang. Biol. 2009, 15, 2803–2824. [Google Scholar] [CrossRef]
  8. Murărescu, O.; Murătoreanu, G.; Frînculeasa, M. Agrometeorological drought in the Romanian plain within the sector delimited by the valleys of the Olt and Buzău Rivers. J. Environ. Health Sci. Eng. 2014, 12, 152. [Google Scholar] [CrossRef] [PubMed]
  9. Thu-Ha Dang, P.; Brouwer, R.; Davidson, M. The economic costs of avoided deforestation in the developing world: A meta-analysis. J. For. Econ. 2014, 20, 1–16. [Google Scholar]
  10. Lawrence, D.; Vandecar, K. Effects of tropical deforestation on climate and agriculture. Nat. Clim. Chang. 2015, 5, 27–36. [Google Scholar] [CrossRef]
  11. Parks, N. Deforestation-related climate impacts may vary by soil. Front. Ecol. Environ. 2014, 12, 204. [Google Scholar]
  12. Brown, S.; Ariel, E.; Lugo, A.E. Tropical secondary forests. J. Trop. Ecol. 1990, 6, 1–32. [Google Scholar] [CrossRef]
  13. Salam, M.A.; Noguchi, T. Factors influencing the loss of forest cover in Bangladesh: An analysis from socioeconomic and demographic perspectives. J. For. Res. 1998, 3, 145–150. [Google Scholar] [CrossRef]
  14. Ickowitz, A. Shifting cultivation and forest pressure in Cameroon. Agric. Econ. 2011, 42, 207–220. [Google Scholar] [CrossRef]
  15. Roy, P.; Murthy, M.; Roy, A.; Kushwaha, S.; Singh, S.; Jha, C.; Behera, M.; Joshi, P.; Jagannathan, C.; Karnatak, H.; et al. Forest fragmentation in India. Curr. Sci. 2013, 105, 774–780. [Google Scholar]
  16. Sasaki, N. Carbon emissions due to land-use change and logging in Cambodia: A modeling approach. J. For. Res. 2006, 11, 397–403. [Google Scholar] [CrossRef]
  17. Turner, M.G. Landscape Ecology: The Effect of Pattern on Process. Annu. Rev. Ecol. Syst. 1989, 20, 171–197. [Google Scholar] [CrossRef]
  18. Gios, G. Multifunctionality and the management of Alpine forest. In The Multifunctional Role of Forest—Policies. Methods and Case Studies; EFI Proceedings 55; Cesaro, L., Gatto, P., Pettenella, D., Eds.; European Forest Institute: Joensuu, Finland, 2008; pp. 47–54. [Google Scholar]
  19. Zhang, J.; Alavalapati, J.R.R.; Shrestha, R.K.; Hodges, A.W. Economic impacts of closing national forests for commercial timber production in Florida and Liberty County. J. For. Econ. 2005, 10, 207–223. [Google Scholar] [CrossRef]
  20. Goio, I.; Gios, G.; Pollini, C. The development of forest accounting in the province of Trento (Italy). J. For. Econ. 2008, 14, 177–196. [Google Scholar] [CrossRef]
  21. Paletto, A.; Ferretti, F.; Cantiani, P.; De Meo, I. Multi-functional approach in forest landscape management planning: An application in Southern Italy. For. Syst. 2012, 21, 68–80. [Google Scholar] [CrossRef]
  22. Daniels, S.E.; Hyde, W.F.; Wear, D.N. Distributive effects of forest service attempt to maintain community stability. For. Sci. 1991, 37, 245–260. [Google Scholar]
  23. Petrişor, A.I. Assessment of the green infrastructure of Bucharest using Corine and urban atlas data. Urban. Archit. Constr. 2015, 6, 19–24. [Google Scholar]
  24. Juutinen, A.; Kosenius, A.K.; Ovaskainen, V. Estimating the benefits of recreation-oriented management in state-owned commercial forests in Finland: A choice experiment. J. For. Econ. 2014, 20, 396–412. [Google Scholar] [CrossRef]
  25. Andronache, I.C. Integrated fractal analysis of the morpology and dynamics of the floodplain of the river Danube. In Fractal Analysis in the Fluvial Geomorphology; Ivanov, A.V., Pozdnyakov, A.V., Eds.; University Book: Moscow, Russia, 2013; pp. 114–132. (In Russian) [Google Scholar]
  26. Virkkala, R. Ranges of northern forest passerines—A fractal analysis. Oikos 1993, 67, 218–226. [Google Scholar] [CrossRef]
  27. Sun, J.; Southworth, J. Remote sensing-based fractal analysis and scale dependence associated with forest fragmentation in an Amazon Tri-National Frontier. Remote Sens. 2013, 5, 454–472. [Google Scholar] [CrossRef]
  28. Eamus, D.; Chen, X.; Kelly, G.; Hutley, L.B. Root biomass and root fractal analyses of an open Eucalyptus forest in a savannah of north Australia. Aust. J. Bot. 2002, 50, 31–41. [Google Scholar] [CrossRef]
  29. Hansen, M.C.; Potapov, P.V.; Moore, R.; Hancher, M.; Turubanova, S.A.; Tyukavina, A.; Thau, D.; Stehman, S.V.; Goetz, S.J.; Loveland, T.R.; et al. High-resolution global maps of 21st-century forest cover change. Science 2013, 342, 850–853. [Google Scholar] [CrossRef] [PubMed]
  30. Roesch, F.A. A simulation of image-assisted forest monitoring for national inventories. Forests 2016, 7, 1–23. [Google Scholar] [CrossRef]
  31. Malek, Ž.; Scolobig, A.; Schröter, D. Understanding land cover changes in the Italian Alps and Romanian Carpathians combining remote sensing and stakeholder interviews. Land 2014, 3, 52–73. [Google Scholar] [CrossRef]
  32. Sousa, P.Q. Decreasing deforestation in the Southern Brazilian Amazon—The role of administrative sanctions in Mato Grosso State. Forests 2016, 7, 66. [Google Scholar] [CrossRef]
  33. Schneider, C.A.; Rasband, W.S.; Eliceiri, K.W. NIH Image to ImageJ: 25 years of image analysis. Nat. Methods 2012, 9, 671–675. [Google Scholar] [CrossRef] [PubMed]
  34. Kainz, P.; Mayrhofer-Reinhartshuber, M.; Ahammer, H. IQM: An Extensible and Portable Open Source Application for Image and Signal Analysis. PLoS ONE 2015, 10, e0116329. [Google Scholar] [CrossRef] [PubMed]
  35. Andronache, I.C.; Ahammer, H.; Jelinek, H.F.; Peptenatu, D.; Ciobotaru, A.M.; Draghici, C.C.; Pintilii, R.D.; Simion, A.G.; Teodorescu, C. Fractal analysis for studying the evolution of forests. Chaos Solitons Fractals 2016, 91, 310–318. [Google Scholar] [CrossRef]
  36. Reiss, M. IQM Plugin frac2D. 2016. Available online: https://sourceforge.net/projects/iqm-plugin-frac2d/ (accessed on 17 September 2016).
  37. Ahammer, H.; Mayrhofer-Reinhartshuber, M. Image pyramids for calculation of the box counting dimension. Fractals 2012, 20, 281–293. [Google Scholar] [CrossRef]
  38. Karperien, A.; Ahammer, H.; Jelinek, H.F. Quantitating the subtleties of microglial morphology with fractal analysis. Front. Cell. Neurosci. 2013, 7. [Google Scholar] [CrossRef] [PubMed]
  39. Sedjo, R.A.; Wisniewski, J.; Sample, A.V.; Kinsman, J.D. The economics of managing carbon via forestry: Assessment of existing studies. Environ. Resour. Econ. 1995, 6, 139–165. [Google Scholar] [CrossRef]
  40. Pintilii, R.D.; Andronache, I.C.; Simion, A.G.; Draghici, C.C.; Peptenatu, D.; Ciobotaru, A.M.; Dobrea, R.C.; Papuc, R.M. Determining forest resources evolution by fractal analysis (Suceava-Romania). Urban. Archit. Constr. 2016, 7, 31–42. [Google Scholar]
  41. Romanian Government Decision 46/2008, Forestry Code. Available online: http://apepaduri.gov.ro/wp-content/uploads/2014/08/Legea-nr.-46-din-2008-Codul-Silvic-.pdf (accessed on 15 September 2016).
  42. Gounaridis, D.; Zaimes, G.N.; Koukoulas, S. Quantifying spatio-temporal patterns of forest fragmentation in Hymettus Mountain, Greece. Comput. Environ. Urban Syst. 2014, 46, 35–44. [Google Scholar] [CrossRef]
  43. Peptenatu, D.; Pintilii, R.D.; Draghici, C.; Merciu, C.; Mateescu, R.D. Management of environment risk within emergency territorial systems. Case study—The influence area of the Bucharest City. J. Environ. Prot. Ecol. 2012, 13, 2360–2370. [Google Scholar]
  44. Pravalie, R.; Sirodoev, I.; Peptenatu, D. Changes in the forest ecosystems in areas impacted by aridization in south-western Romania. J. Environ. Health Sci. Eng. 2014, 12. [Google Scholar] [CrossRef] [PubMed]
Figure 1. Geographical study area of Maramureș County and selected territorial administrative units (TAU), located in Northern Romania. Data Source: [29].
Forests 08 00025 g001
Figure 2. Deforestation rates in Maramureș County (2001–2014).
Forests 08 00025 g002
Figure 3. The temporal evolution of the FFI (Fractal Fragmentation Index) (2000–2014) at the county and TAU levels.
Forests 08 00025 g003
Figure 4. Temporal evolution of FFI (Fractal Fragmentation Index) and forested areas: (a) Maramureș County; (b) Borșa; (c) Poienile; (d) Repedea; (e) Săpânța; (f) Vișeu de Sus.
Forests 08 00025 g004
Figure 5. Temporal evolution of FG2DL (Fixed Grid 2D Lacunarity) (2000–2014) at the county and TAU levels.
Forests 08 00025 g005
Figure 6. Temporal evolution of FG2DL (Fixed Grid 2D Lacunarity) and deforested areas: (a) Maramureș County; (b) Borșa; (c) Poienile; (d) Repedea; (e) Săpânța; (f) Vișeu de Sus.
Forests 08 00025 g006aForests 08 00025 g006b
Figure 7. (a) Turnover from sylviculture and other forestry activities (NACE Code 0210). (b) Turnover from logging activities (NACE Code 0220). (c) Turnover from Sawmilling and planting of wood activities (NACE Code 1610). (d) Turnover from Joinery installation (NACE Code 4332). (e) Turnover from wholesale of wood, construction materials, and sanitary equipment (NACE Code 4673).
Forests 08 00025 g007aForests 08 00025 g007bForests 08 00025 g007c

