Article

Influence of Fuel Load Dynamics on Carbon Emission by Wildfires in the Clay Belt Boreal Landscape

by
Aurélie Terrier
1,*,
Mathieu Paquette
1,
Sylvie Gauthier
2,
Martin P. Girardin
2,
Sylvain Pelletier-Bergeron
3 and
Yves Bergeron
1,4
1
Chaire Industrielle en Aménagement Forestier Durable (NSERC-UQAT-UQAM), Université du Québec à Montréal; P.O. Box 8888, Stn. Centre-ville, Montréal, QC H3C 3P8, Canada
2
Natural Resources Canada, Canadian Forest Service, Laurentian Forestry Centre, 1055 du PEPS, P.O. Box 10380, Stn. Sainte-Foy, Québec, QC G1V 4C7, Canada
3
Département des Sciences du Bois et de la Forêt, Université Laval, 2405 de la Terrasse, Québec, QC G1V 0A6, Canada
4
Forest Research Institute, Université du Québec en Abitibi-Temiscamingue, 445 blvd de l’Université, Rouyn-Noranda, QC J9X 5E4, Canada
*
Author to whom correspondence should be addressed.
Forests 2017, 8(1), 9; https://doi.org/10.3390/f8010009
Submission received: 27 September 2016 / Revised: 6 December 2016 / Accepted: 18 December 2016 / Published: 24 December 2016

Abstract

:
Old-growth forests play a decisive role in preserving biodiversity and ecological functions. In an environment frequently disturbed by fire, the importance of old-growth forests as both a carbon stock as well as a source of emissions when burnt is not fully understood. Here, we report on carbon accumulation with time since the last fire (TSF) in the dominant forest types of the Clay Belt region in eastern North America. To do so, we performed a fuel inventory (tree biomass, herbs and shrubs, dead woody debris, and duff loads) along four chronosequences. Carbon emissions by fire through successional stages were simulated using the Canadian Fire Effects Model. Our results show that fuel accumulates with TSF, especially in coniferous forests. Potential carbon emissions were on average 11.9 t·ha−1 and 29.5 t·ha−1 for old-growth and young forests, respectively. In conclusion, maintaining old-growth forests in the Clay Belt landscape not only ensures a sustainable management of the boreal forest, but it also optimizes the carbon storage.

1. Introduction

Forest management that optimizes carbon storage in the boreal forest could be an effective tool to mitigate anthropogenic carbon emissions [1]. By storing more than one third of the global terrestrial carbon [2,3], the boreal biome is the world’s largest carbon stock. However, limited by the cold temperature and short growing season, boreal forests’ annual carbon uptake (0.004 Pg·C/m2·year) is low in comparison with the tropical forests (0.008 Pg·C/m2·year) or the temperate forests (0.009 Pg·C/m2·year) [4]. Fortunately, large amounts of carbon can accumulate on the boreal forest’s floor since the decomposition of dead material is also limited by the cold climate conditions that prevail therein [2]. Although disturbances emit large quantities of carbon, the boreal forest is a carbon sink since regeneration and time between disturbances allows total recovery of emitted carbon [5].
In Canada, the boreal forest represents approximately 60% of the economic resources for the forest industry [6]. In addition, boreal ecosystems provide a diverse range of habitats for wildlife [6]. During the last few decades, the expansion of intensive harvesting has prompted the need to find a compromise between preserving biodiversity, maintaining forest ecosystems resilience, and providing resources for the wood and paper industries [6]. Facing these needs, interests for a sustainable forest management approach based on natural fire dynamics has increased [7,8,9,10]. Natural fires shape landscape structures and composition by creating forests of various ages and by favoring the conservation of shade-intolerant species (e.g., jack pine, trembling aspen) in areas with high fire activity and of tolerant species (e.g., balsam fir) in landscapes rarely influenced by fire [6,7,8,9]. Forest management that recreates landscapes similar to those generated by natural fire preserves biodiversity and long-term ecosystem functionality [10,11,12,13].
A major challenge in sustainable management lies in maintaining forest structures the way they occur under natural conditions. Several studies have highlighted old-growth forests’ importance in preserving biodiversity and ecological functions [10,14,15], for example, by supporting the presence of specialized plant and animal species or by favoring forest resilience. While forest harvesting has resulted in the creation of younger landscapes in the eastern part of North America [14,16,17], sustainable forest management aims to promote silvicultural practices that maintain late-successional forests, or forests that have the same characteristics [10,16,17,18]. These strategies aim to ensure forest sustainability, but their relevance can be brought into question in a mitigation management context under climate change. In old boreal forests, carbon has had time to accumulate for several decades [17]; when disturbed by fire, 40% [19] to 60% [20] of the carbon accumulated in boreal forests is likely to be emitted back into the atmosphere [21]. This phenomenon is likely to be amplified over the next century under global warming owing to the more frequent and more severe drought conditions [22], which may directly increase wildfire activity (e.g., [23,24,25]) and reduce tree growth rates [26]. These changes will affect the time needed for forests to recover the carbon released [5]. Given their large carbon pools and the anticipated risks posed to these pools under climate change, maintaining old-growth forests, as opposed to restoring productivity through harvesting, could have adverse effects on the global climate. However, old-growth forests are characterized by a particular fuel structure that tends to maintain higher moisture levels in comparison with younger forest stands [27,28,29]. This fuel structure may provide old-growth forests with some resistance to fire regime changes.
This study estimates the potential amount of carbon released into the atmosphere by fire activity along successional stages for the dominant forests (trembling aspen (TA), jack pine (JP), and black spruce (BS) forests) of the Clay Belt boreal forest in eastern North America. The Clay Belt region constitutes one of the world‘s largest terrestrial carbon stocks, estimated at 201 to 250 t·ha−1, with a large proportion of forests reaching values of up to 1050 t·ha−1 [30]. Therefore, it is justified to assess carbon emissions caused by fire disturbance specifically in the Clay Belt forest. The notion of the impact of fuel accumulation with the time since the last fire (TSF) on fire behavior was first mentioned by Brown [31] for Pinus ponderosa ecosystems in the Interior West of the United States. The policy of fire exclusion has created a situation in which fuel accumulates, resulting into catastrophic and severe fire events [32], and induced higher carbon emissions. In 2001, Johnson et al. [33] showed that this notion is not valid for boreal ecosystems. Fire cycles (time required to burn an area equal in size to the study area) in these ecosystems are longer than those in Pinus ponderosa ecosystems. Fuel accumulates and does not constitute a limiting factor for fire events: large severe fires in these ecosystems occur under extreme climatic conditions whatever the forest. Studies conducted in Clay Belt BS forests show that peat mosses accumulate with the TSF, thereby inducing a decrease in tree productivity (tree fuel load) [34]. Organic layer accumulation leads to a rise in the water table [35] and creates high soil moisture conditions [34]. Depth of burn (i.e., the depth of the soil organic layer consumed during a fire) is consequently low [36,37,38,39] and the fire only burns surface fuel. However, these studies did not consider all fuel material and forest types. First, we wanted to address the hypothesis that fuel accumulates with TSF in the dominant Clay Belt boreal forests, considering all fuel material. Second, it can be postulated that the high soil moisture content and low depth of burn in BS forests may induce less carbon emissions, while the higher fuel availability in TA and JP forests could induce higher carbon emissions. From this hypothesis, we verified whether or not fuel accumulation could induce higher carbon emission by fires in late-successional TA and JP forests, and not in black spruce forests. To do so, we performed a complete fuel inventory (tree biomass, herbs and shrubs, dead woody debris (DWD), and duff loads) in 61 sites differing in their forest type and TSF. Empirical fuel loads were then used to calculate the carbon emitted by one single simulated fire at each sampling site using the Canadian Fire Effects Model (CanFIRE) [40,41].

2. Materials and Methods
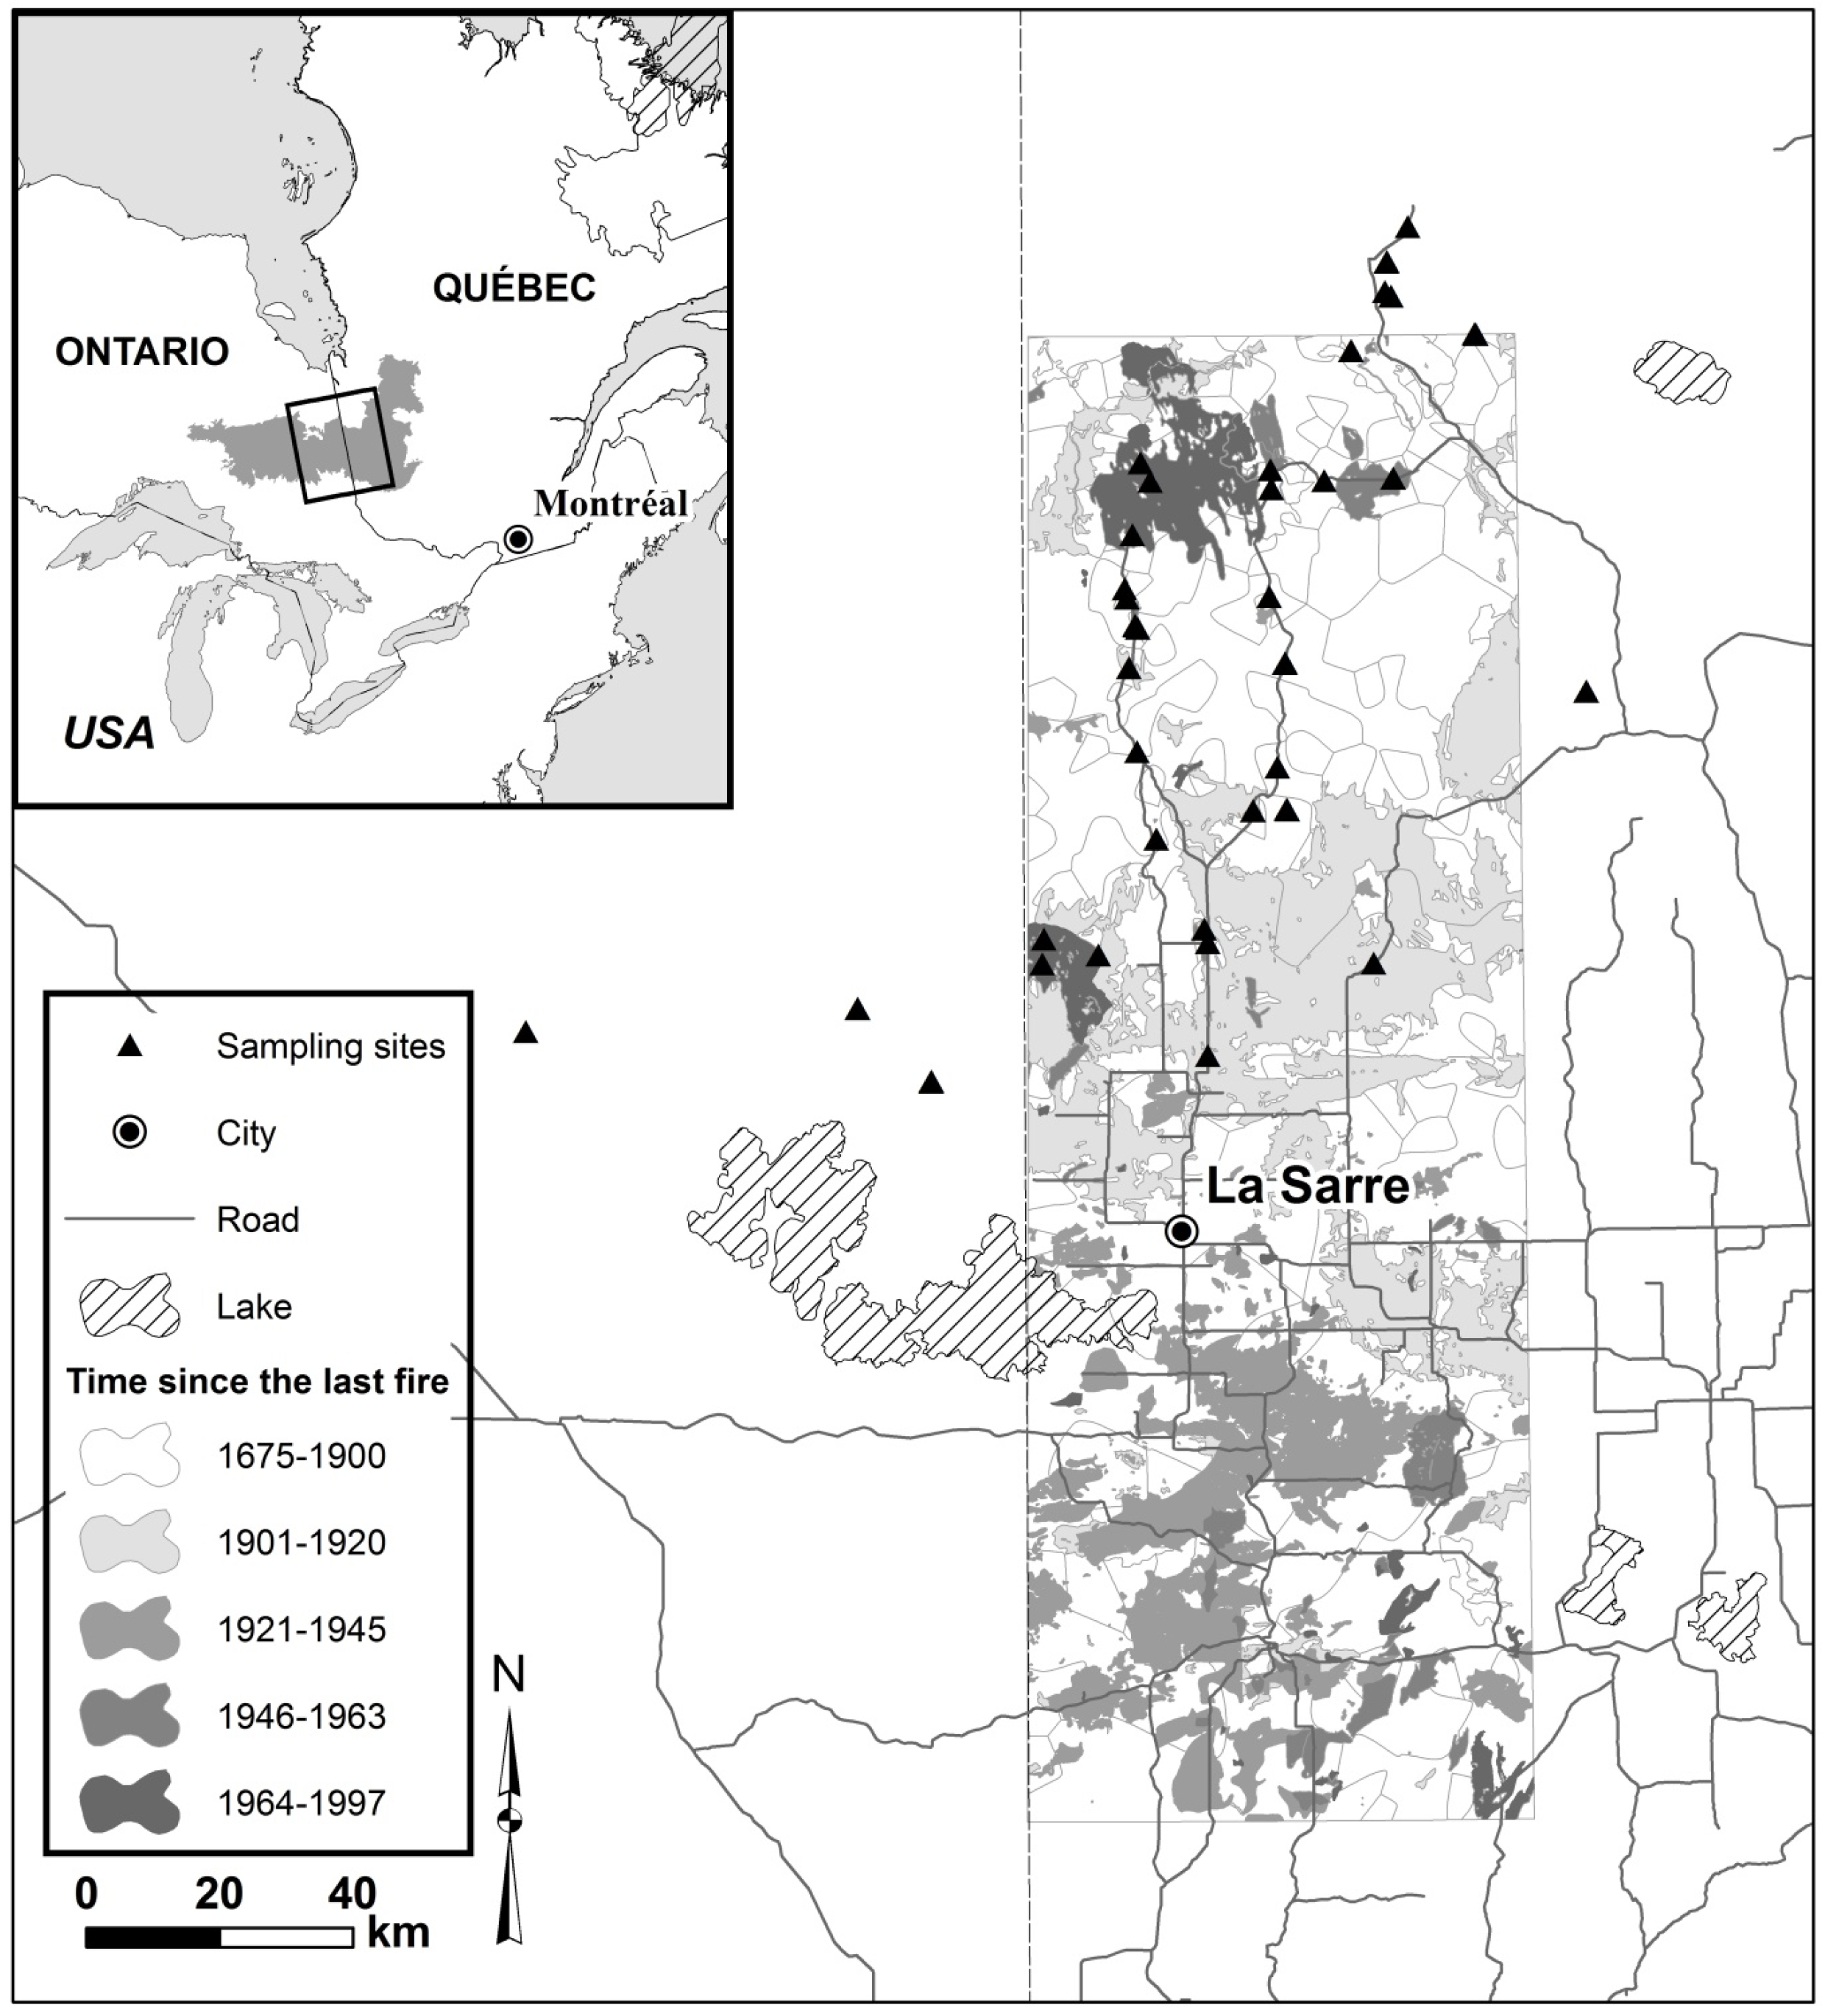
2.1. Study Area

The study area (49°00′–50°00′ N, 78°30′–80°00′ W) is located in the Clay Belt boreal forest in eastern North America, stretching across the Quebec and Ontario border (Figure 1).
A former proglacial lake (Lake Barlow-Ojibway) left a thick deposit of clay, forming the physiographic unit known today as the Clay Belt, which covers an area of approximately 145,470 km2 [42]. The current level of fire activity is low, with a fire cycle estimated at 398 years from 1959 to 1999 [43]. The climate is subpolar and subhumid continental, characterized by long, harsh, and dry winters and, short, hot, and humid summers [44]. Average annual temperature from 1971 to 2000 recorded at the closest weather station to the north (Matagami, 49°46′ N, 77°49′ W) and to the south (La Sarre, 48°46′ N, 79°13′ W) was −0.7 °C and 0.7 °C, respectively. Mean total annual precipitation was 906 and 890 mm, respectively [44]. The poor drainage conditions induced by the presence of an impermeable clay substrate, flat topography, historical low fire activity, and cold climate facilitated the accumulation of thick layers of organic soil, a process often described as paludification [45,46]. In parts of the region, peat mosses accumulate on initially mesic soils, independently of topography or drainage, and are related to forest succession [34]. Therefore, in the prolonged absence of fire, these forests tend to convert into less productive spruce-Sphagnum opened forests regardless of the initial species composition [34,47,48,49,50]. Burned area and residual organic layers (i.e., layers that are not consumed by fire) jointly control forest structure and composition [51]. Shallow residual organic layers on the ground lead to the establishment of dense forests composed of black spruce (Picea mariana (Mill.) BSP), trembling aspen (Populus tremuloïdes Michx.), or jack pine (Pinus banksiana Lamb.) on mesic sites [48,51,52,53]. In contrast, thick residual organic layers favor black spruce self-replacement [53,54] and accelerate the process of paludification [34,51].

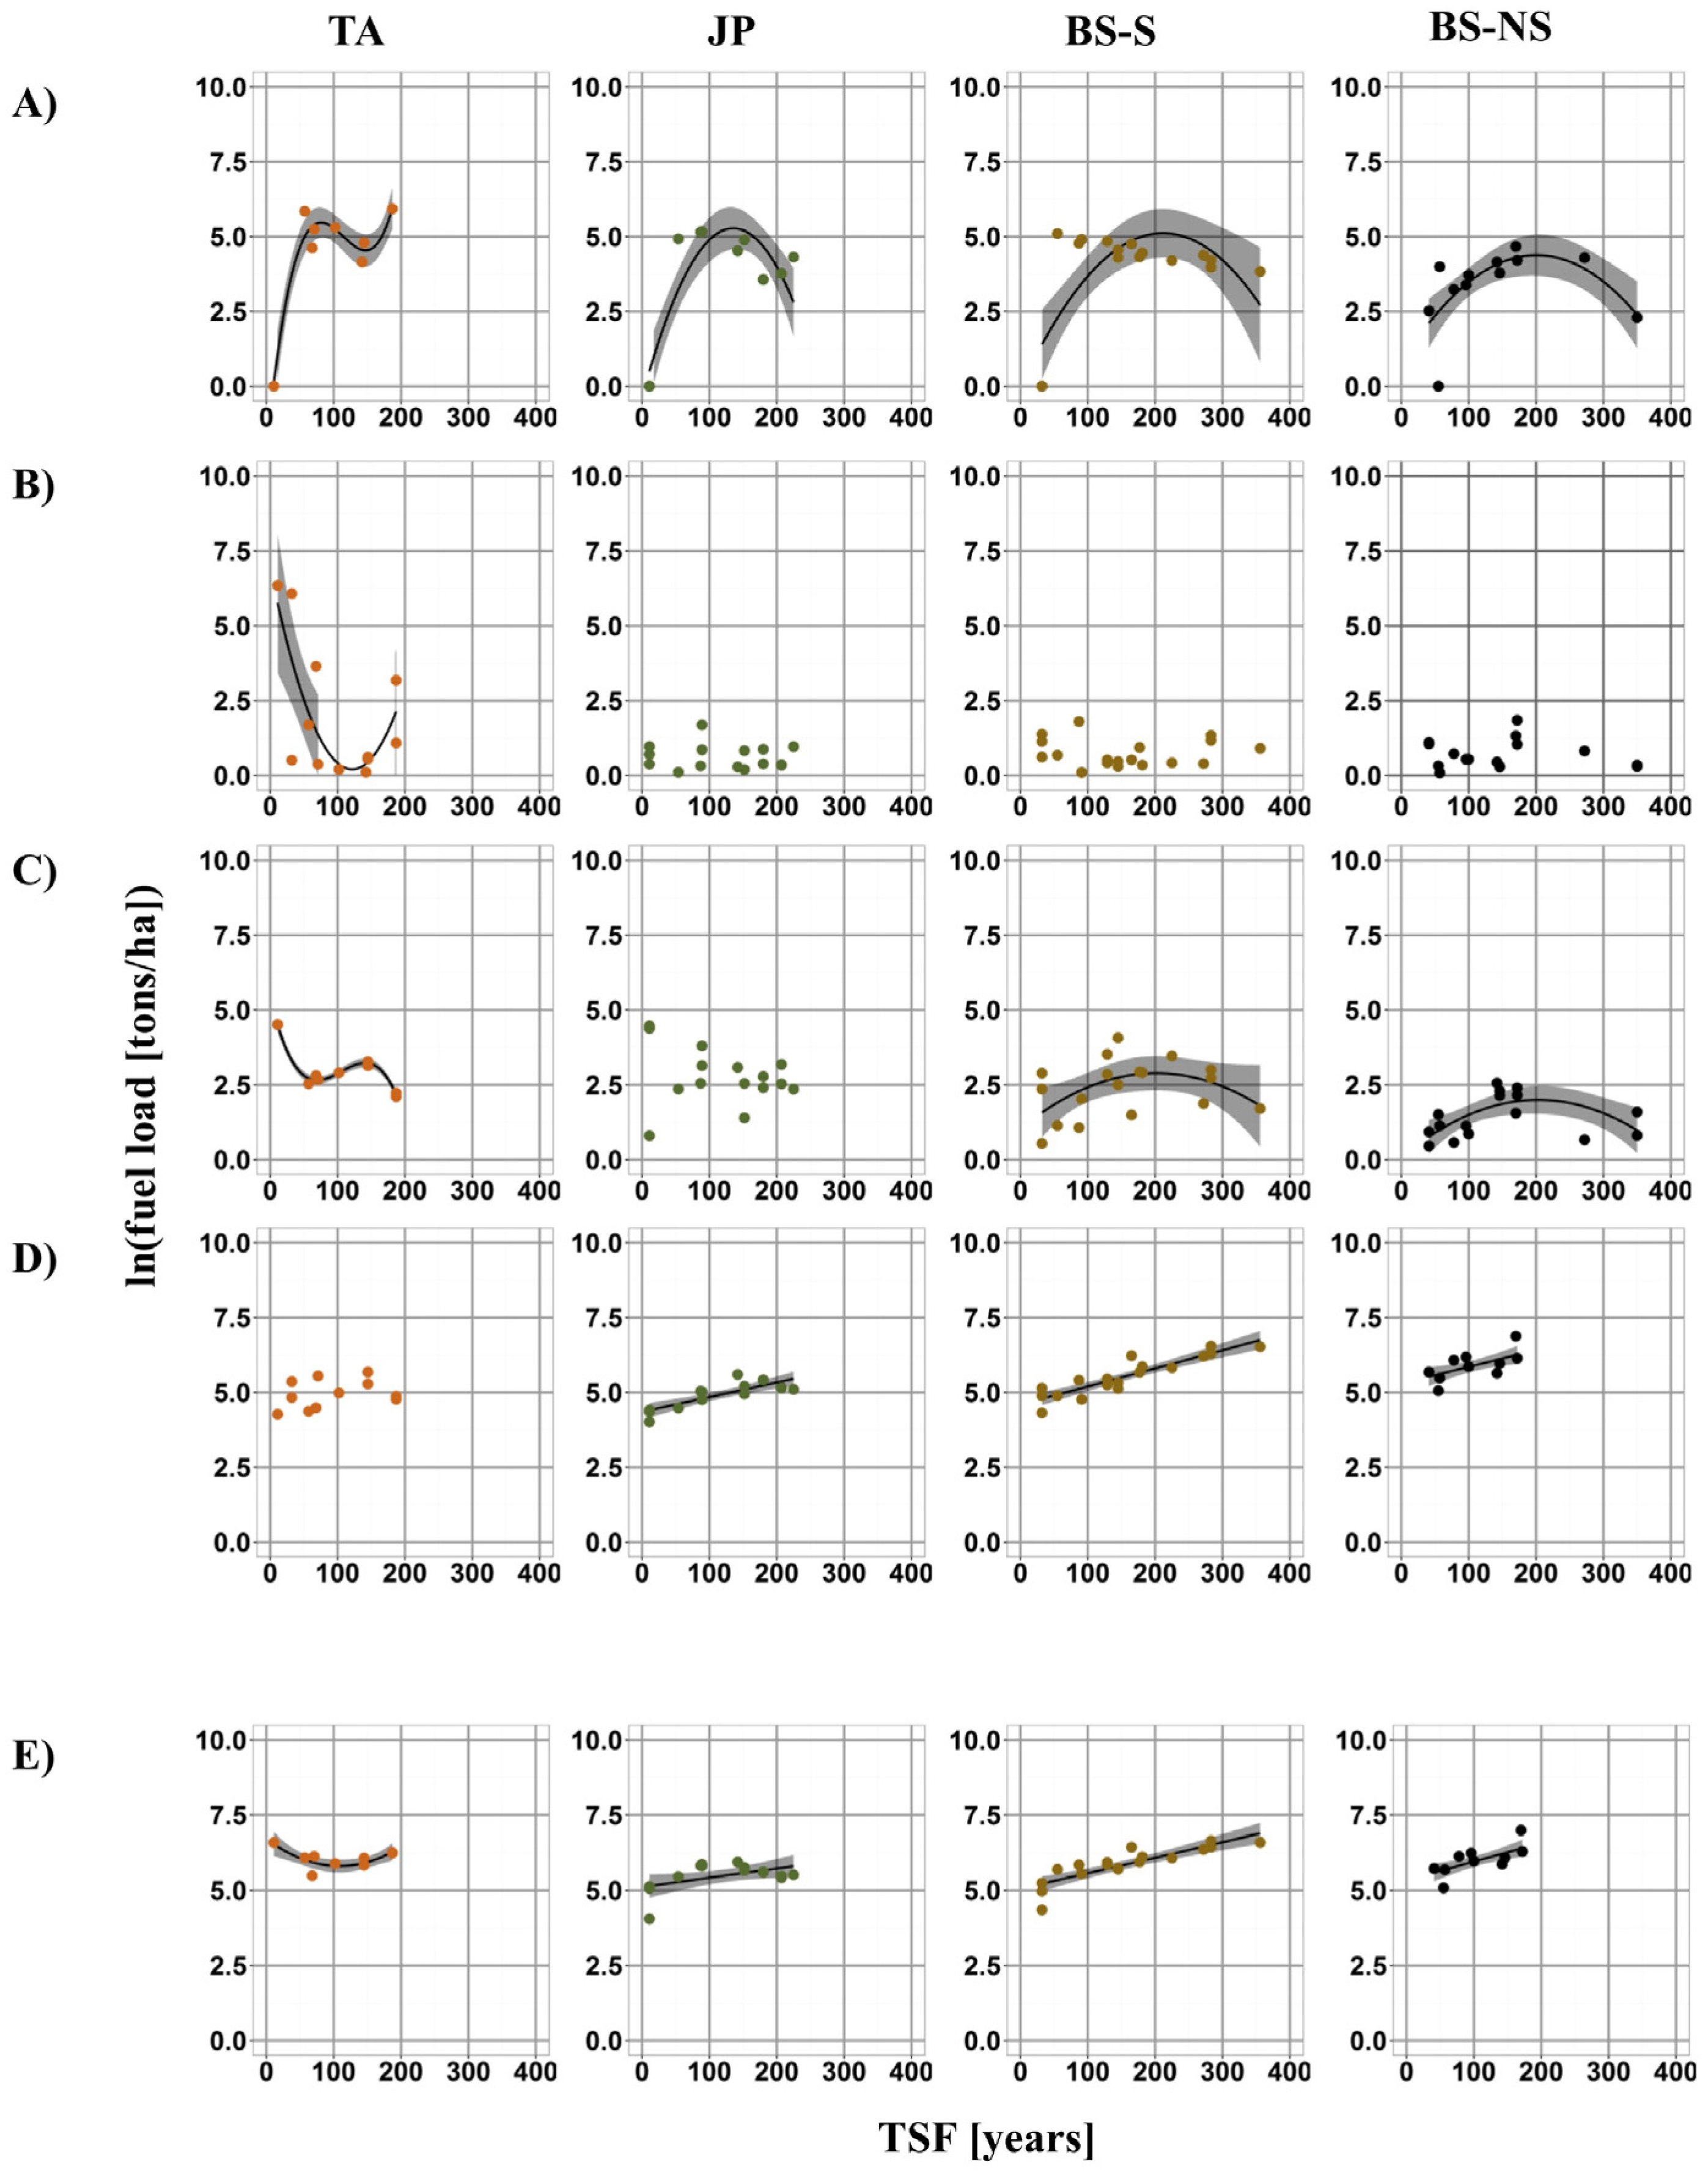
2.2. Fuel Load Dynamics with TSF

Data were collected to characterize trees, herbs, shrubs, DWD, and duff loads (t·ha−1) along the successional stages of the dominant Clay Belt forests (TA, JP, BS; see Figure 5 in [48]). Black spruce forests were separated into black spruce forests originating from severe fire (BS-S) and black spruce forests originating from non-severe fire (BS-NS), since fire severity influences tree and duff load dynamics in BS forests [34]. Successional stages were determined with TSF. We used information (tree basal area, organic layer depth, TSF) that was already available for 37 sites to calculate tree and duff loads [34,48,51]. We visited these sites to complete the inventory with information on DWD, shrubs, and herbs. We selected 24 additional sites to expand TSF variability for each forest type (Table 1). TSF was determined for these additional sites by overlaying a fire reconstruction map previously published for the study area [43]. A total of 61 sites were sampled. At each site, a 30-m-sided equilateral triangle was defined in which the fuel sampling protocol was performed.
Basal area for live trees larger than 3 cm in diameter at breast height (DBH) were sampled by species for the 24 additional sampling sites using the prism method (factor 2, metric). Tree loads were calculated using stand-level equations [55]. Shrub load was sampled using the method described in Brown et al. [56]. Nine 1-m2 plots were established evenly along the triangle transect. Shrub species were identified and stem basal diameters (cm) were measured. Loads were calculated using equations linking shrub species weight in grams with the stem diameter. Previously determined equations [57] were used for Lonicera canadensis Bartr., Ribes sp., Rosa acicularis Lindl., and Viburnum edule Raf. New equations were determined with additional shrub samples for Chamaedaphne calyculata (L.) Moench, Kalmia angustifolia L., Rhododendron groenlandicum (Oeder) K.A. Kron & Judd, and Vaccinium myrtilloides Michx. (see details in Appendix A, Table A1). We measured herb loads (all surface vegetation that is not woody (e.g., forbs and graminoids)) using a weighted-estimate approach [56]. We established four plot rectangles (0.5 m2), three at the center of each side and one in the middle of the triangle. We selected the plot with the most weight, which was identified as the base plot. Herbaceous vegetation was collected in this base plot and oven dried at 95 °C for 24 h for dry weight measurements. The weight of the three other plots was estimated as a fraction of the base plot and fuel load was calculated using Brown et al.’s equation [56]. Fuel load of DWD was sampled using the line intersect method [58] along the triangle sides. Pieces smaller than 7 cm were measured with a “go-no-go” gauge, and counted according to five diameter sizes (class I: 0–0.49 cm; class II: 0.5–0.99 cm, class III: 1–2.99 cm, class IV: 3–4.99 cm; class V: 5–6.99 cm). For pieces bigger than 7 cm, we measured the diameter size. DWD fuel loads were calculated for each size classes using McRae et al.’s equations [58]. Size-class specific coefficients values were extracted from Hély et al. [57] for white cedar, and from McRae et al. [58] for the other species (BS, JP, TA, WB). Finally, duff loads were calculated by multiplying total organic layer depth by bulk density. We used organic layer depths data from Simard et al. [34] for the 37 previously sampled sites. Additional organic layer depth was measured for the other 24 sites in parallel with shrub sampling in each of the nine 1-m2 plots and averaged by sites. We used previously published mean bulk density (kg·m−3) information [36] to convert organic layer depth into duff load (kg·m−2). Duff data were missing for old BS-NS sites because of technical problems.
The relationship between TSF and (i) the fuel load of each material separately and (ii) total fuel load was investigated by forest type. We performed polynomial regressions using the R freeware [59]. Herb and shrub fuel loads were combined into fine aerial vegetation. DWD corresponded to the sum of all classes. Loads were logarithmically transformed (ln + 1) to linearize the relationship. First- to third-order polynomial regressions were tested, and we promoted the significant minimum-order polynomial regressions (p-values ≤ 0.05) in accordance with the parsimony principle.

2.3. Simulation of Carbon Emissions by Fire

Potential carbon emission (tons/ha) was investigated using the Canadian Fire Effects Model (CanFIRE, formerly the Boreal Fire Effects Model, BORFIRE) [40,41], including the modified depth of burn equations for BS forests dominated by Sphagnum spp. in the Quebec Clay Belt boreal landscape [36,60]. CanFIRE is a collection of Canadian fire behavior models that are used to estimate first-order fire effects on physical characteristics, and to estimate ecological effects at the stand level. For any given fire, CanFIRE calculates fire behavior information (e.g., fire intensity, rate of spread) based on the pre-fire amount of fuel and components of the Canadian Forest Fire Weather Index (FWI) System [61]. Tree fuel consumption takes place only when CanFIRE predicts a crown fire. Values are estimated as the sum of foliage and bark using tree biomass algorithms [62] and are comparable to overstory fuel consumption data recorded on experimental burns in the Canadian Forest Fire Behavior Prediction (FBP) System database [63]. DWD and duff consumption follows McRae et al.’s [64] and de Groot et al.’s [65] equations, respectively. These algorithms are driven by the Buildup Index (BUI) and Drought Code (DC) values of the FWI System for DWD and duff consumption, respectively, and were built from empirical pre-burn and post-burn fuel data collected in prescribed fires.
Since simulation objectives were to analyze differences in carbon emission with fuel structure variations under similar climatic conditions, we simulated the potential carbon emitted by one single simulated fire, using the same fire weather conditions at each sampling site. Sensitivity analyses were made to ensure that fire weather values above average did not modify our conclusions (see details in Appendix B). We determined FWI System component values by averaging daily FWI System components for each natural fire start point encountered during the interval 1971–2000 period in the study area (FWI = 18) [60]. Forest cover was determined based on species’ empirical basal area as described in the previous section. Since basal area was sampled for trees with DBH larger than 3 cm, basal area, and, consequently, cover were 0 for all species in young sites. In this case, we attributed a value of 100% to the dominant species of the forest type (e.g., cover: 100% of jack pine in JP). Tree fuel load was directly estimated by CanFIRE using species’ basal area. To do so, species’ site index and age were used to calculate basal area with Plonski’s yield tables [65]. We used TSF for species age and the same site indexes as those used by Terrier et al. [60]. Prior to running simulations, we ensured that the use of Plonski’s yield tables instead of our empirical basal area data would not bring a bias to our conclusions (see details in Figure C1). DWD and duff loads were provided by our empirical data. Total duff was separated into duff-fibric and duff-humus using the fibric layer equations described in Terrier et al. [60]. Since the database was not complete for all sites (technical problems in duff sampling in old BS-NS sites), a subset of 55 sites was used for the simulations. Simulation results were averaged by forest types and successional stage classes (TSF < 90 years; TSF between 90 and 150 years; TSF > 150 years).
Some additional changes were also made to the model. In our study area, high soil moisture conditions in BS forests dominated by Sphagnum spp. resulted in lower depth of burn, and, consequently, in lower forest floor fuel consumption (FFFC) in comparison with other boreal forest types [36]. In the CanFIRE model, FFFC is a function of duff load and climate conditions [37], and does not consider the lower depth of burn for calculations. Therefore, FFFC equations had to be modified to reflect specific carbon emission in BS forests dominated by Sphagnum spp. We defined FFFC as a function of the potential depth of burn as Equation (1):
F F F C ( kg m 2 ) = depth   of   burn   ( m )   ×   bulk   density   ( kg m 3 )
Since bulk density varies with the organic layer depth [37], we came up with a model that linked measured bulk density with organic layer depth. To do so, we used a published dataset that comprised 103 peat measurements of bulk density at different organic layer depths sampled in 11 sites [34] (details are presented in Appendix D).

3. Results

3.1. Fuel Load Dynamics with TSF

TSF was significantly related to all fuel loads materials (trees, fine aerial vegetation, DWD, and duff) and total fuel loads for TA, JP, BS-S, and BS-NS boreal forests in the Clay Belt. Exceptions were observed for fine aerial vegetation in coniferous forests, duff load in TA forests, and DWD of JP forests (Figure 2, Table 2).
Tree fuel loads (Table 2; Figure 2A) were predicted to approximate 0 (t·ha−1) just after fire (exponential of the polynomial regression intercept ~0), except for BS-NS, where the intercept equals 0.79. Tree fuel loads for coniferous forests increased gradually before decreasing after 150 and 200 years in JP and BS forests, respectively (Figure 2A). Maxima reached 5.47, 4.75, and 4.39 for JP, BS-S, and BS-NS, respectively. In the case of TA forests, tree fuel loads increased particularly rapidly at early successional stages until around 75 years (logarithmic maximum = 6.46), followed by a slight decrease. Finally, tree fuel loads increased again at late successional stages.
Fine aerial vegetation load did not vary significantly with TSF in coniferous forests (Figure 2B); logarithmic values varied near 0 along the successional stages (Table E1). In contrast, the amount of fine aerial vegetation was particularly high at early successional stages in TA forests. A value of 570 tons/ha was observed for the younger site (TSF = 11 years) (Table E1). Fuel loads decreased significantly, reached 0 at 120 years old (Table E1), and increased rapidly at late-successional stages.
DWD load dynamics for BS forests, represented in Figure 2C, followed the same trend as those observed for the tree load: an increase was predicted at early successional stages, maxima logarithmic values of 2.79 and 1.86 for BS-S and BS-NS, respectively, were reached at 200 years, and were followed by a decrease in values. DWD load trend in TA forests was the opposite of tree load: a value of 90 t·ha−1 was estimated in the youngest site (TSF = 11 years) (Table E1). Values decreased for 75 years, then increased slightly, and finally decreased gradually at late successional stages. DWD load for JP forests showed no significant relationship with TSF. Values ranged from 1 to 86 t·ha−1 (Table E1).
Duff load showed a significant gradual increase with TSF in coniferous forests. Higher values were predicted for BS-NS (Figure 2D). Values were on average 70, 125, 292 t·ha−1 for JP, BS-S, and BS-NS, respectively, in sites younger than 50 years old (Table E1). The increase in duff load was faster in BS forests in comparison with JP forests (higher equation slope in Table 2). Variation in duff load was not significantly related to TSF in TA forests. Values averaged 150 all along the chronosequence.
Finally, variation in total fuel load with TSF was significant for all forest types (Figure 2E). Total fuel load gradually increased along successional stages in coniferous forests. Values varied from 57 t·ha−1 to 382 t·ha−1 in JP, from 77 t·ha−1 to 767 t·ha−1 in BS-S, and from 160 t·ha−1 1084 t·ha−1 in BS-NS (Table E1). Total fuel in TA forests decreased slightly at early successional stages, reaching a minimum at 140 years, and increased at late successional stages (Figure 2E). Values of total fuel ranged from 241 t·ha−1 to 730 t·ha−1 in TA forests (Table E1).

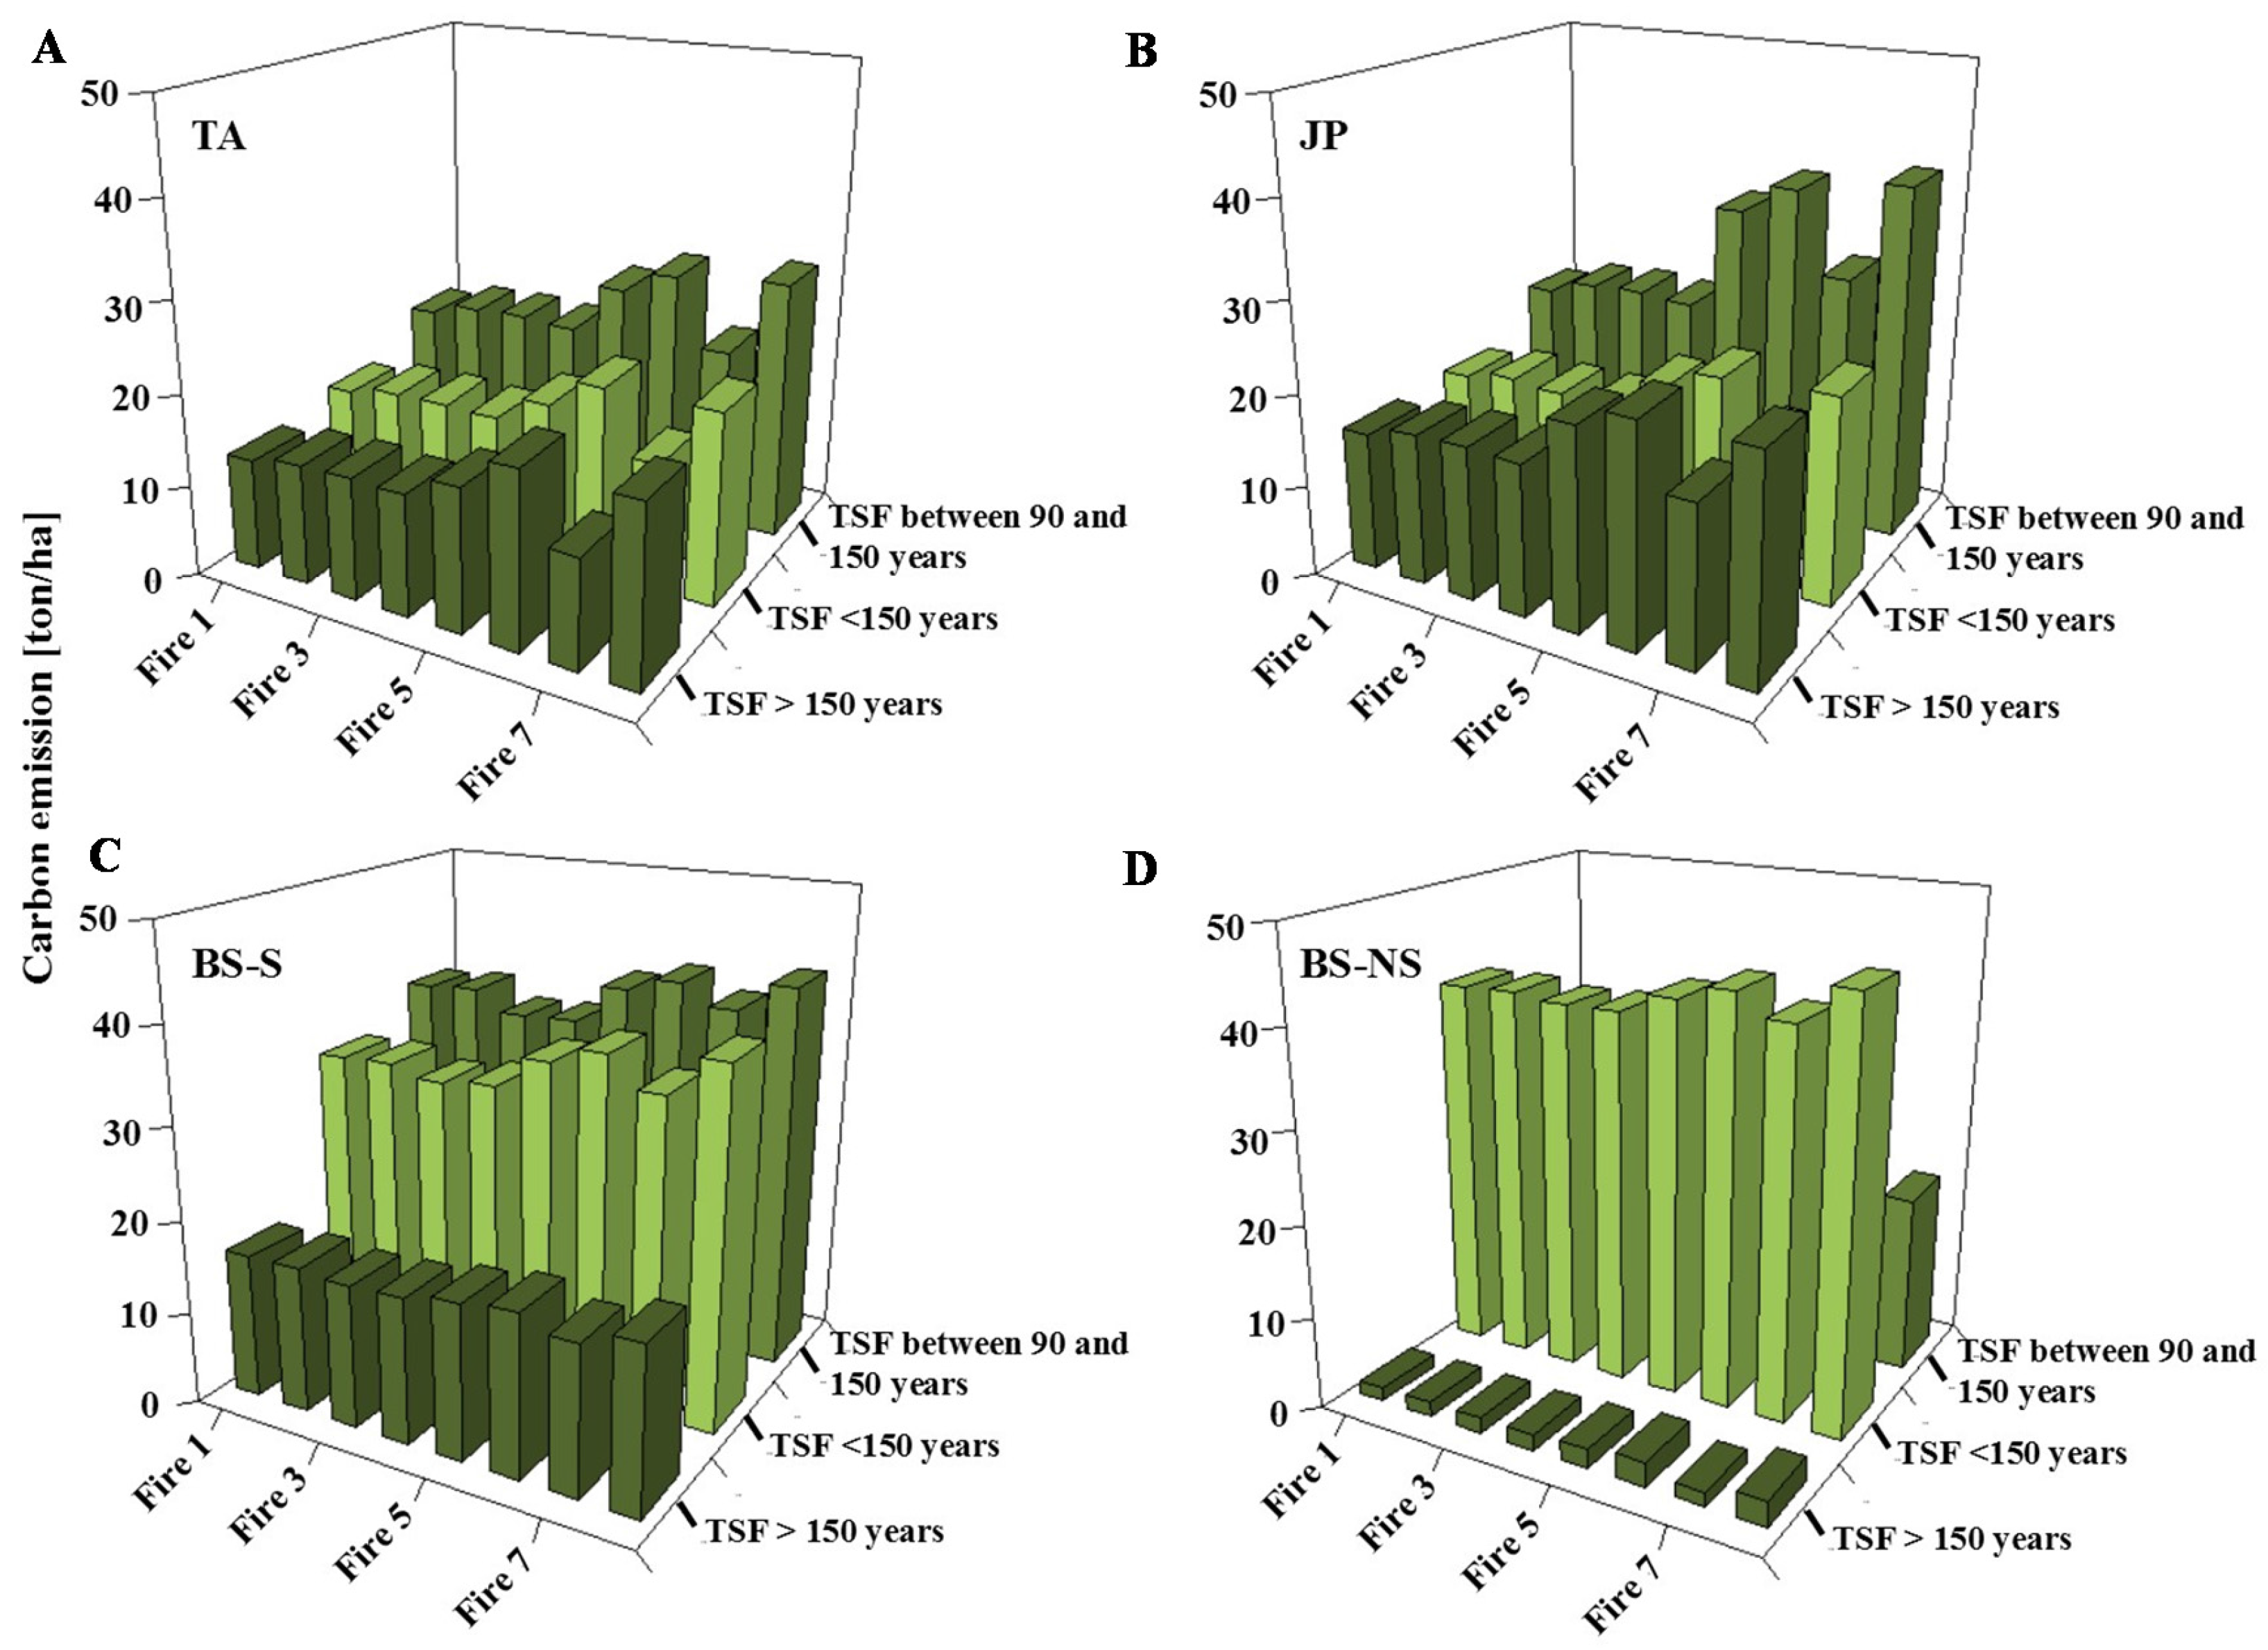
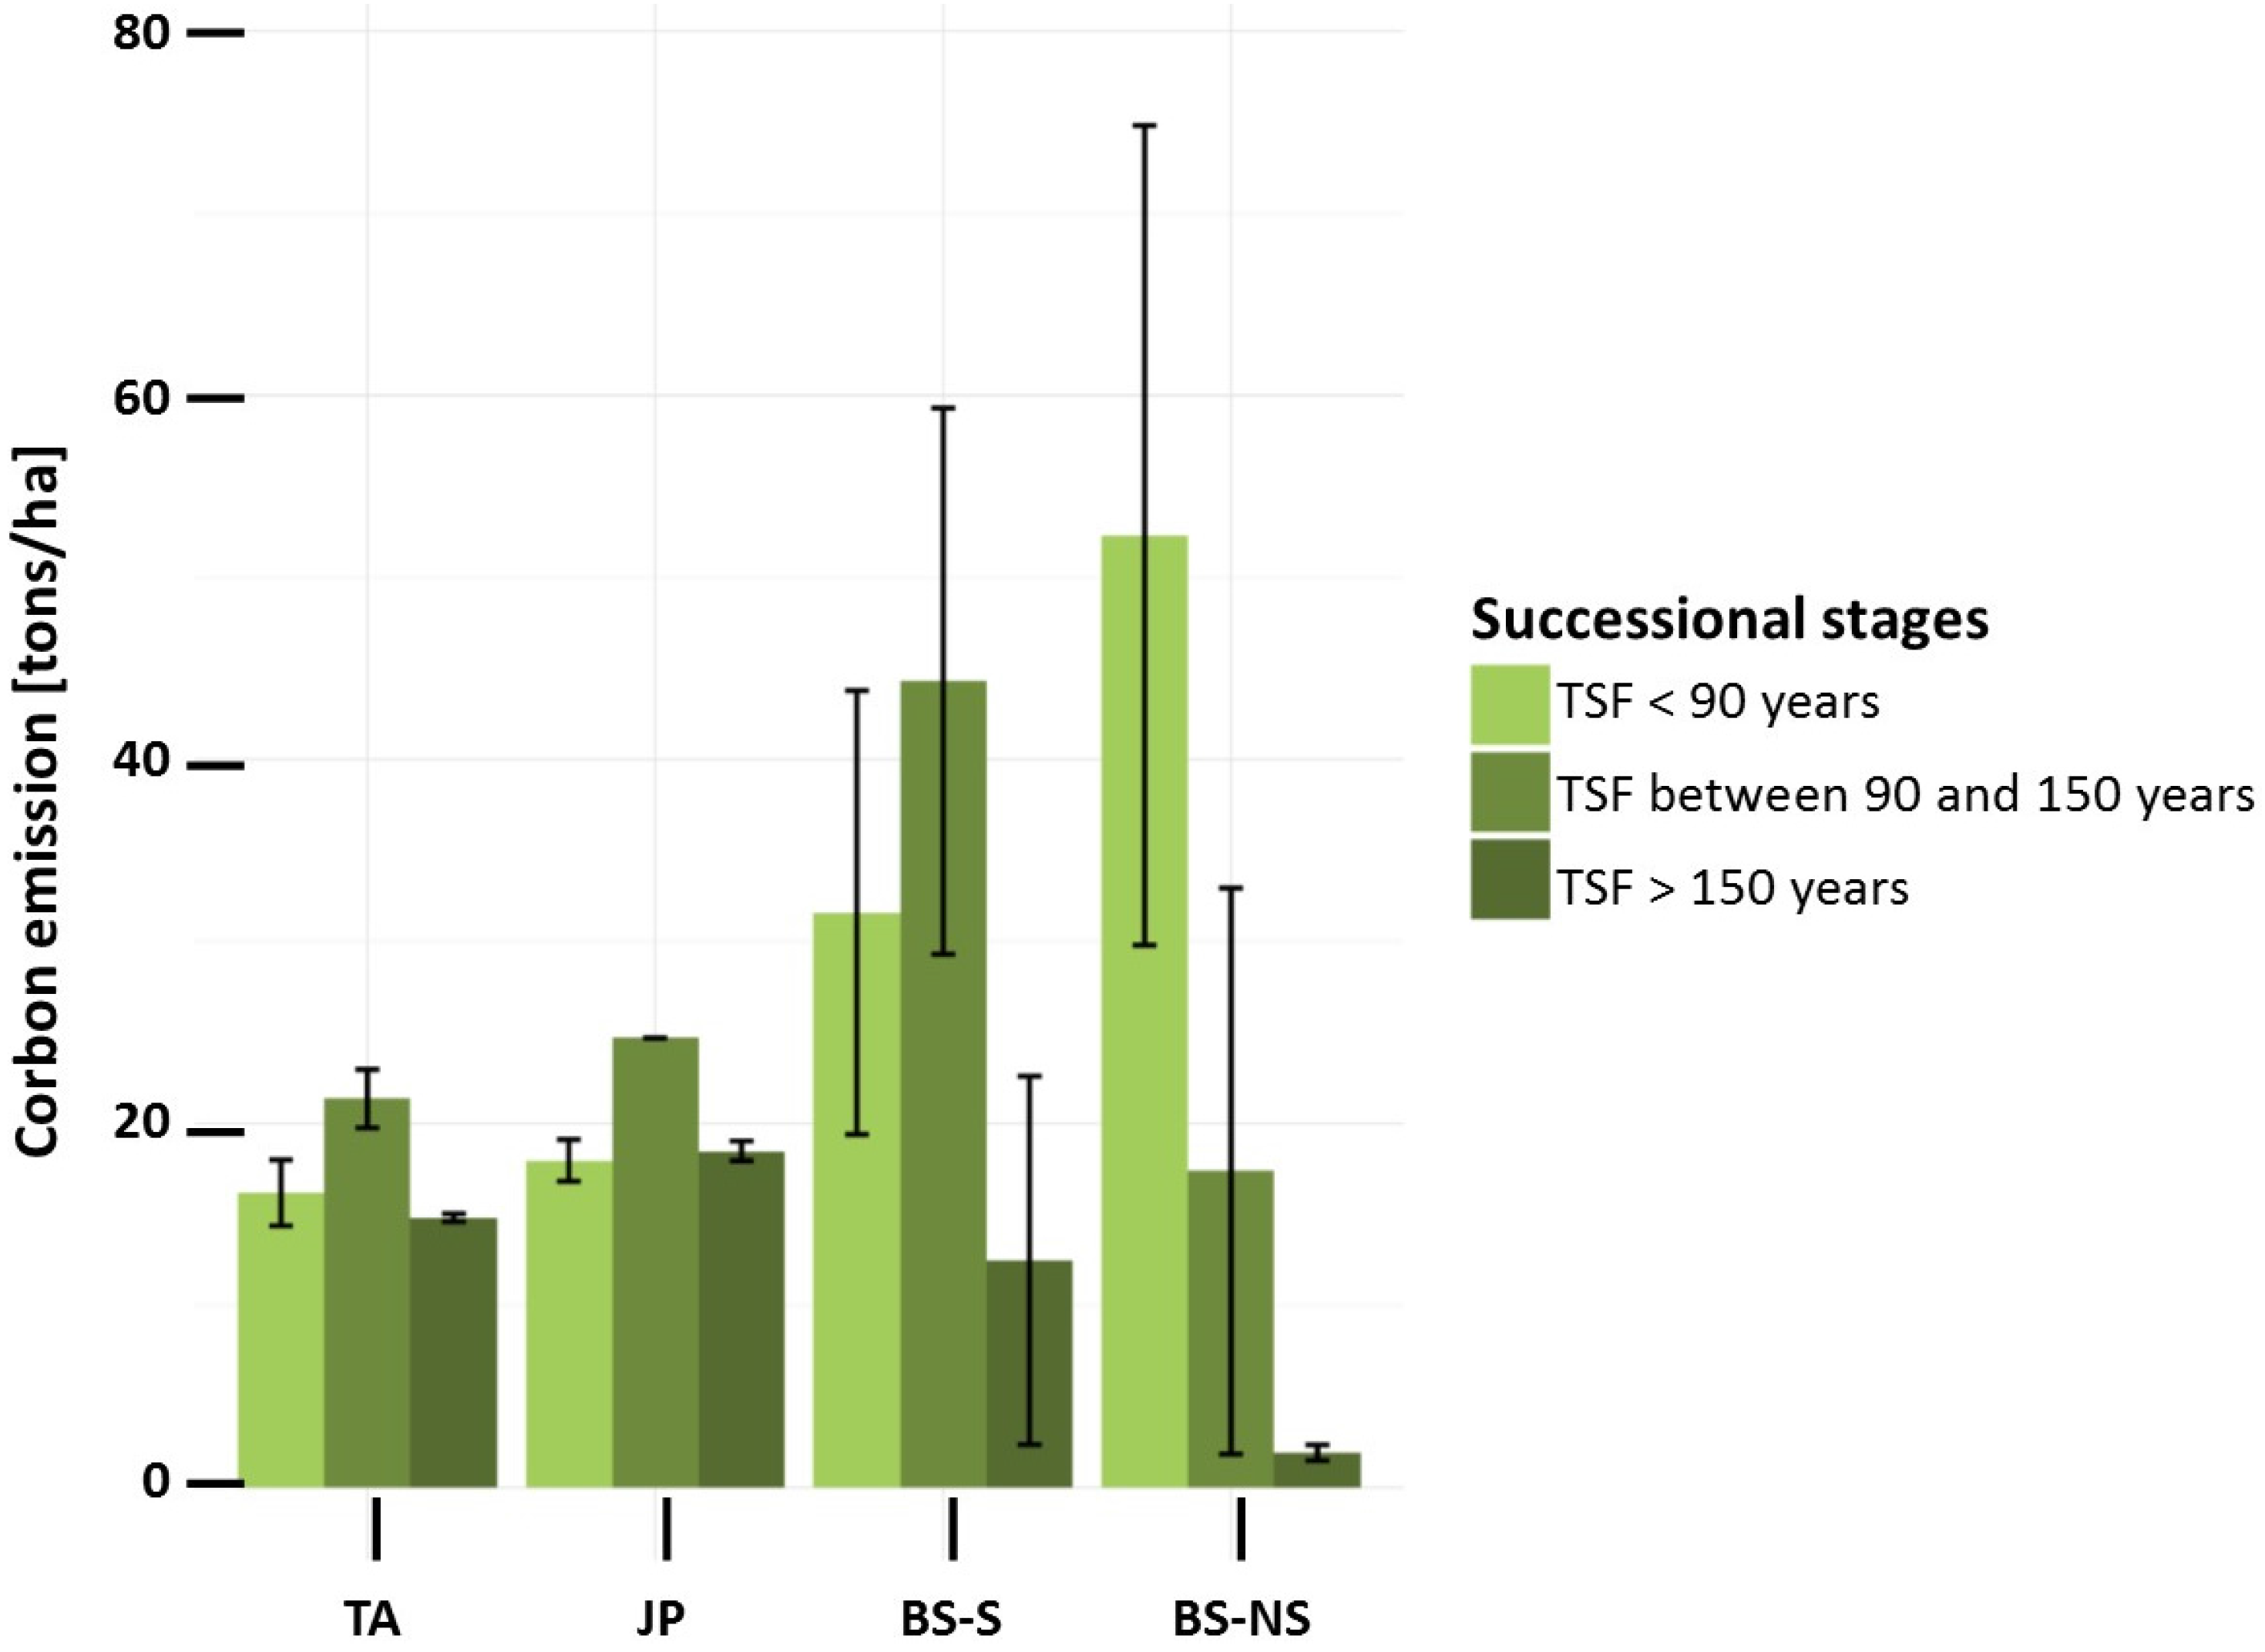
3.2. Simulation of Carbon Emission by Fire

The CanFIRE model was used to simulate carbon emissions during a single fire along the different successional stages of the four dominant forest types (TA, JP, BS-N, and BS-NS) of the Clay Belt boreal forest. Simulation results are presented in Figure 3.
Mean carbon emissions by fire were estimated to range from 14.83 to 21.37 t·ha−1 in TA, from 17.97 to 24.7 t·ha−1 in JP, from 12.48 to 44.3 t·ha−1 in BS-S, and from 1.92 to 52.31 t·ha−1 in BS-NS. Simulated carbon emissions were on average lower for sites older than 150 years, except for JP forests, where carbon emission estimates averaged 16 t·ha−1 for forests younger than 90 years and 19 t·ha−1 for forests older than 150 years. A maximum average of 53 t·ha−1 of carbon emitted was simulated for BS-NS with TSF < 90 years, while a particularly low value (2 tons/ha) was simulated for older BS-NS. Aside from BS old-growth forests, potential carbon emission values simulated were lower for TA. Table 3 presents the contribution in percentage of each fuel material to carbon emission by fire. Trees barely contribute to emission, which is mostly generated by duff and DWD combustion.

4. Discussion

4.1. Fuel Load Dynamics with TSF

Our results confirmed our first hypothesis that fuel accumulates with TSF in Clay Belt coniferous forests, despite variations in the dynamics of the different fuel materials. These variations were confirmed and explained by previous studies on fuel load dynamics.
Tree dynamics strongly affect variations in fuel material with TSF [66,67,68,69]. It is therefore important to first understand Clay Belt tree dynamics to discuss fine aerial, DWD, and duff dynamics. Light, nutrients, and space are abundant just after a fire event, and vegetation can rapidly colonize disturbed sites [70]. Trees grow more or less rapidly depending on the composition [65] or depth of the residual organic layer [51,71]. Consequently, it was not surprising to predict in our study an increase in tree biomass at early successional stages for all forest types. This increase was faster for TA and JP forests, because growth rates are faster for these trees [65,72] and the low residual organic layers required for TA and JP postfire recruitment lead to the establishment of productive and dense forests [49,52,53,54]. In contrast, BS-NS forests showed the slowest increase due to the thick residual organic layers left after fire which favor unproductive open BS self-replacement [34,48,52,53,54]. Following the growth influx, a decrease in tree loads [34,73] was predicted at 80, 110, and 200 years for TA, JP, and BS forests, respectively. Over time, tree mortality starts, gaps are created, and shade-tolerant species appear in the canopy [74,75]. Our predictions concur with previous observations: Pothier et al. [76] estimated tree productivity loss after about 60 years for TA forest in Quebec; Belleau et al. [50] estimated composition changes to occur in the Clay Belt region at around 70 to 120 years for JP and TA forests, respectively, and at around 100 to 200 years for BS forests. In our analysis, TA experienced a recovery in tree biomass after 150 years. Low organic layers observed at late successional stages in TA forests probably made this productivity recovery possible.
Fine aerial vegetation establishment and growth rates are primarily limited by the understory light availability that is created by the overstory canopy [67,68,69]. The shady understory environment provided by coniferous species [77] results in less abundant fine aerial vegetation in coniferous forests [68,70]. Forest openings induced by the establishment of the second cohort was not associated with the development of fine aerial vegetation in old-growth coniferous forests because the cold soil temperature and nitrogen limitation induced by organic layer accumulation at the late successional stage [34] probably acted to prevent herbs and shrubs development. Herbs and shrubs dynamics in TA forests reflect higher light transmission by the deciduous canopy. At early successional stages, light availability decreases in response to tree growth, and fine aerial vegetation declines in abundance and growth [64]. Tree mortality at intermediate successional stages increases light availability, allowing understory recolonization by herbs and shrubs [70,78,79]. Late successional stages were consequently characterized by an increase in fine aerial vegetation.
DWD variations with TSF can be explained by coarse woody debris (CWD) dynamics (pieces > 7 cm) since CWD constitute most of the DWD loads [29,66]. CWD dynamics in TA forests followed the traditional U-shaped distribution summarized by Brassard and Chen [68]. Pre-disturbance and disturbance-generated woody debris that were not consumed generated a high CWD quantity at early successional stages. As TSF increased this material decomposed and a decrease in CWD occurred. Tree mortality at intermediate successional stages provided high loads of woody debris. Old-growth forests were characterized by a low quantity of CWD, as new cohort growth did not generate dead woody supply [68]. DWD debris dynamics in BS forests corresponded closely to tree fuel load dynamics, with an absence of DWD high value at early successional stages, compared with what was observed in TA forests. Our data showed an absence or low quantity of CWD in young BS forests.Such a feature in coniferous forests has already been mentioned in previous studies [66,80,81]. It may be induced by a faster decay rate after fire and the absence of pre-fire large-diameter trees [66]. CWD could also be buried in the moss layer in BS-NS due to the rapid growth of Sphagnum species [31]. No trend in DWD was observed in JP forests, although Brais et al. [82] found that DWD dynamics followed a ‘U-shaped’ temporal pattern in pure Clay Belt JP forests. We explain these differences in observations by the facts that our data cover a larger variability of TSF and our forests were not pure JP forests. Few studies have compared CWD dynamics in different cover types [69]. Differences in DWD dynamics between coniferous forests and TA forests may be induced by the lower pre-fire tree productivity (Figure 2) and the presence of woody debris with higher flammability [83,84,85,86] in coniferous forests.
Decomposition rates were higher in TA than in coniferous forests [80,86]; consequently, organic layer accumulation did not occur in TA forests. Conversely, duff loads increased gradually in coniferous choronosequences, since the lower decomposition rates associated with the paludification process favor organic layer accumulation [34,45,46]. The most interesting fact is that despite a tree and DWD load loss with TSF in coniferous forests, total fuel loads increased with TSF.
Scharlemann et al. [30] provided a global map representing carbon stocks in tree biomass and soils. As mentioned in the introduction, they estimated a higher carbon amount in the Clay Belt boreal forests, with values ranging from 201 to 250 t·ha−1 (402–500 t·ha−1 of fuel load), and forests reaching values up to 1050 t·ha−1 (2100 t·ha−1 of fuel load). Our values are in accordance with the authors: we observed fuel loads ranging from around 60 to 1080 t·ha−1, with the majority of sites containing 200 to 500 t·ha−1. This study confirmed the importance of the region for global carbon stocks.

4.2. Simulation of Carbon Emission by Fire

This research is the first that we are aware of to use empirical data that include both spatial and temporal variations in fuel loads to quantify fire carbon emission in boreal ecosystems. Our approach differs from other studies [20,27,28,87,88], as fuel loads were approximated by fuel type and did not consider that the temporal changes [20,27] or amount of carbon emitted were a function of the burned area [28,88] or of the landscape’s total tree loads [87]. We estimated that mean carbon emission by fire ranged from 2 to 53 t·ha−1, depending on the forest type and age category. These results are consistent with values provided by previous studies. Harden et al. [87] estimated long-term average for C exchange in boreal forests near Thompson, Manitoba, Canada. The values ranged from 11 to 25 t·ha−1 for JP forests and from 14 to 70 t·ha−1 for BS-feathermoss forests. No observed data were offered for BS-Sphagnum forests, but the authors simulated an average of 20 t·ha−1. Simulated carbon emissions using the CanFIRE model in forests of Alberta, Canada, ranged from 11.3 to 42.6 t·ha−1, depending on the month during which fire occurred [19]. Amiro et al. [28] estimated a mean of 20.1 t·ha−1 of fuel consumed by individual fire (carbon emissions of around 100 (t·ha−1)) in the boreal east shield from 1959 to 1999.
The most interesting point to emerge from our simulations is that despite fuel accumulation with TSF, old-growth forests emitted less carbon by fire on average, whatever the forest type. Pre-fire fuel structure determined the amount of carbon emitted by fire [27,28,29] since total fuel consumption in CanFIRE was a function of the amount of each fuel material. More specifically, as previously observed [27], more than 85% of the carbon emissions were generated by duff and DWD combustion. It was not surprising to simulate a low tree contribution to carbon emission, since fire does not consume trees, it kills them [89]. Emissions are consequently generated after the fire, through dead wood decomposition [90]. However, this particularity does not influence the conclusions of this study since tree fuel load is as low in late-successional than in early-successional forests. Variations in carbon emission through BS successional stages were mainly influenced by duff dynamics. As mentioned previously, organic layer accumulation leads to a rise in the water table [35] and creates high soil moisture conditions [35]. Depth of burn is consequently low [36,37,38,39]. Duff loads in TA and JP forests present little variation across successional stages, as carbon emission was determined by DWD dynamics. Old-growth forests emitted less carbon because DWD loads were lower (even if DWD variations with TSF were not significant in JP forests, values were lower in old-growth forests).
These results have important implications for forest management in the context of climate change mitigation. Managers should consider practices that favor mature forests for harvesting but also increase potential forest vulnerability to higher carbon emission and decrease long-term carbon storage [36]. In fact, although the climatic conditions expected by the end of the 21st century may induce an increase in fire activity in the Clay Belt boreal region (e.g., [22,23,24]), expansion of old-growth BS forests in the landscape is projected [60]. If fire activity over the next three to four decades remains similar to current levels, an increase in the proportion of forests characterized by high soil moisture conditions will occur [60]. These moisture conditions may provide landscape resilience to increased fires. Fuel should consequently continue to accumulate without generating more emissions during fires. Peatland protection (such as reducing or preventing peatland drainage) could be an alternative in order to increase forest resistance to fire and reduce future fire carbon emissions in eastern Canadian forests.
Finally, it is important to note that the CanFIRE model does not include fine aerial consumption in its calculations. However, this omission would not change the findings of this study. Fine aerial load is low for coniferous forests all along the successional stages. High fine aerial load in TA forests at early and late successional stages may amplify our results as moisture contents of this fuel reduce fire intensity and, therefore, carbon emissions.

5. Conclusions

Empirical fuel structure dynamics were examined and potential carbon emissions by wildfire were simulated along four dominant chronosequences of the Clay Belt boreal forest in eastern North America. Fuel structure was an important factor influencing carbon emission by the simulated fire, while fuel availability was not a determining factor. Given our results, we argue that maintaining old-growth forests in the Clay Belt landscape not only promotes a sustainable management of the boreal forest, it also optimizes carbon sink.
A considerable effort was made in this study to sample covering a wide variability in TSF, and our results showed a low value for TA in the TSF > 150 years category and for JP in the TSF between 90 and 150 years category. However, these conclusions may apply only to the region studied, since the paludification process brings specific high moisture dynamics in old-growth forests [34]. Direct impacts of climatic change on fuel loads should also be investigated. This includes the potential increase in tree growth with the lengthening of the growing season [91,92] or decomposition [93]. However, the particularly high organic layer thickness and high soil moisture content may prevent such impacts by limiting tree growth and decomposition.

Acknowledgments

This project was financially supported by the Natural Sciences and Engineering Research Council of Canada (NSERC; Strategic Project; Discovery Grants Program), the Canada Chair in Forest Ecology and Management (Yves Bergeron), the Canadian Forest Service Tembec Inc. Danielle Charron and Marie-Hélène Longpré contributed to the field work logistics. We are particularly grateful to Mélanie Desrochers for her help with ARCGIS maps, to Rémi St-Amant for providing climate data and help with the BioSIM software, to Martin Simard and Nicolas Lecomte for providing their data and, finally, to Christelle Hély and Samira Ouarmim for their availability and helpful advice on fuel load fieldwork and calculations. We extend our thanks to Samira Ouarmim for reviewing the paper and providing helpful comments and to Isabelle Lamarre for technical editing. Finally, we are grateful to two anonymous reviewers for their helpful comments on an earlier version of the manuscript.

Author Contributions

S.G. and Y.B. conceived and coordinated the research project. M.P. and S.G. designed data collection. M.P. and S.P.-B. did the field work. M.P., A.T., and S.P.-B. performed fuel load calculations. A.T. and M.P.G. conceived modeling and simulations analyses. A.T. and M.P. analyzed the data. A.T. wrote the paper and all the authors revised it.

Conflicts of Interest

The authors declare no conflict of interest. The founding sponsors had no role in the design of the study; in the collection, analyses, or interpretation of data; in the writing of the manuscript; and in the decision to publish the results.

Abbreviations

The following abbreviations are used in this manuscript:
BSBlack spruce
BS-SBlack spruce forests originating from severe fire
BS-NSBlack spruce forests originating from non-severe fire
CWDCoarse woody debris
DBHDiameter at breast height
DWDDead woody debris
FFFCForest floor fuel consumption
FWIFire weather index
JPJack pine
TATrembling aspen
TSFTime since the last fire

Appendix A. Shrub Load Equations

Previously determined equations were used for load calculations of Lonicera canadensis Bartr., Ribes sp., Rosa acicularis Lindl., and Viburnum edule Raf [57].
New equations were determined with additional shrub samples for load calculations of Chamaedaphne calyculata (L.) Moench, Kalmia angustifolia L., Rhododendron groenlandicum (Oeder) K.A. Kron & Judd, and Vaccinium myrtilloides Michx. (Table A1). A total of 90 additional shrub samples were randomly collected in various triangle transects to determine equations linking species’ weight (g) with stem diameter (cm) for Chamaedaphne calyculata (sample size = 19), K. angustifolia (sample size = 28), R. groenlandicum (sample size = 28), and V. myrtilloides (sample size = 15). Efforts were made to collect a high variability in diameter size. Each sample was weighted and linked with basal diameter using linear regressions. Weight and diameter values were logarithmically transformed to normalize the relationship. Linear regressions were performed using R freeware [59].
Table A1. Equations and adjusted R2 from linear regressions analysis linking shrub weight (g) with stem basal diameter (cm) by species. All equations and coefficients were significant with a p-value ≤ 0.05.
SpeciesEquationsAdjusted R2
Kalmia angustifolia 2 ln ( w e i g h t ) = 2.13 + 2.5   ln ( D ) 0.91
Lonicera canadensis 1 ln ( w e i g h t ) = 2.33 + 2.64   ln ( D ) 0.82
Chamaedaphne calyculata 2 ln ( w e i g h t ) = 3.25 + 3.25   ln ( D ) 0.93
Rhododendron groenlandicum 2 ln ( w e i g h t ) = 2.4 + 2.52   ln ( D ) 0.94
Ribes sp. 1 ln ( w e i g h t ) = 2.18 + 2.33   ln ( D ) 0.79
Rosa acicularis 1 ln ( w e i g h t ) = 2.09 + 2.41   ln ( D ) 0.82
Vaccinium myrtilloides 1 ln ( w e i g h t ) = 1.93 + 1.92   ln ( D ) 0.65
Viburnum edule 2 ln ( w e i g h t ) = 2.55 + 2.62   ln ( D ) 0.84
1 Hély’s equations [57]; 2 New equations from additional shrub sample.

Appendix B. Sensitivity Analysis of the Influence of Fire Weather Variations on Potential Carbon Emissions across Successional Stages

Sensitivity analyses were made to ensure that fire weather values above average did not modify our conclusions. To do so, we performed simulations using daily FWI System components for each natural fire start point during the interval 1971–2000 period in the study area [60] (Table B1). A total of eight fires occurred during this period, burning a total of 56,080 ha.
Table B1. Daily FWI System components for each natural fire start point encountered during the interval 1971–2000 period.
NameFFMCDMCDCISIBUIFWI
Fire 18922168153324
Fire 2934285174130
Fire 3882216793317
Fire 49050125154929
Fire 583269953210
Fire 682241014308
Fire 788309983415
Fire 888318863313
FFMC: Fine Fuel Moisture Code; DMC: Duff Moisture Code; DC: Drought Code; ISI: Initial Spread Index; BUI: Buildup Index; FWI: Fire Weather Index.
Simulation results showed that potential carbon emission was the lowest for forests older than 150 years, regardless of the FWI System components (Figure B1).
Figure B1. CanFIRE potential carbon emissions averaged by early (TSF < 90 years), intermediate (TSF between 90 and 150 years) and late (TSF > 150 years) successional stages, and by dominant forest types of the Clay Belt boreal landscape ((A) trembling aspen (TA), (B) jack pine (JP), (C) black spruce originating from severe fire (BS-S), and (D) black spruce originating from non-severe fire (BS-NS) forests). Simulations were performed using FWI System components for each natural fire start from 1971 to 2000.
Forests 08 00009 g004

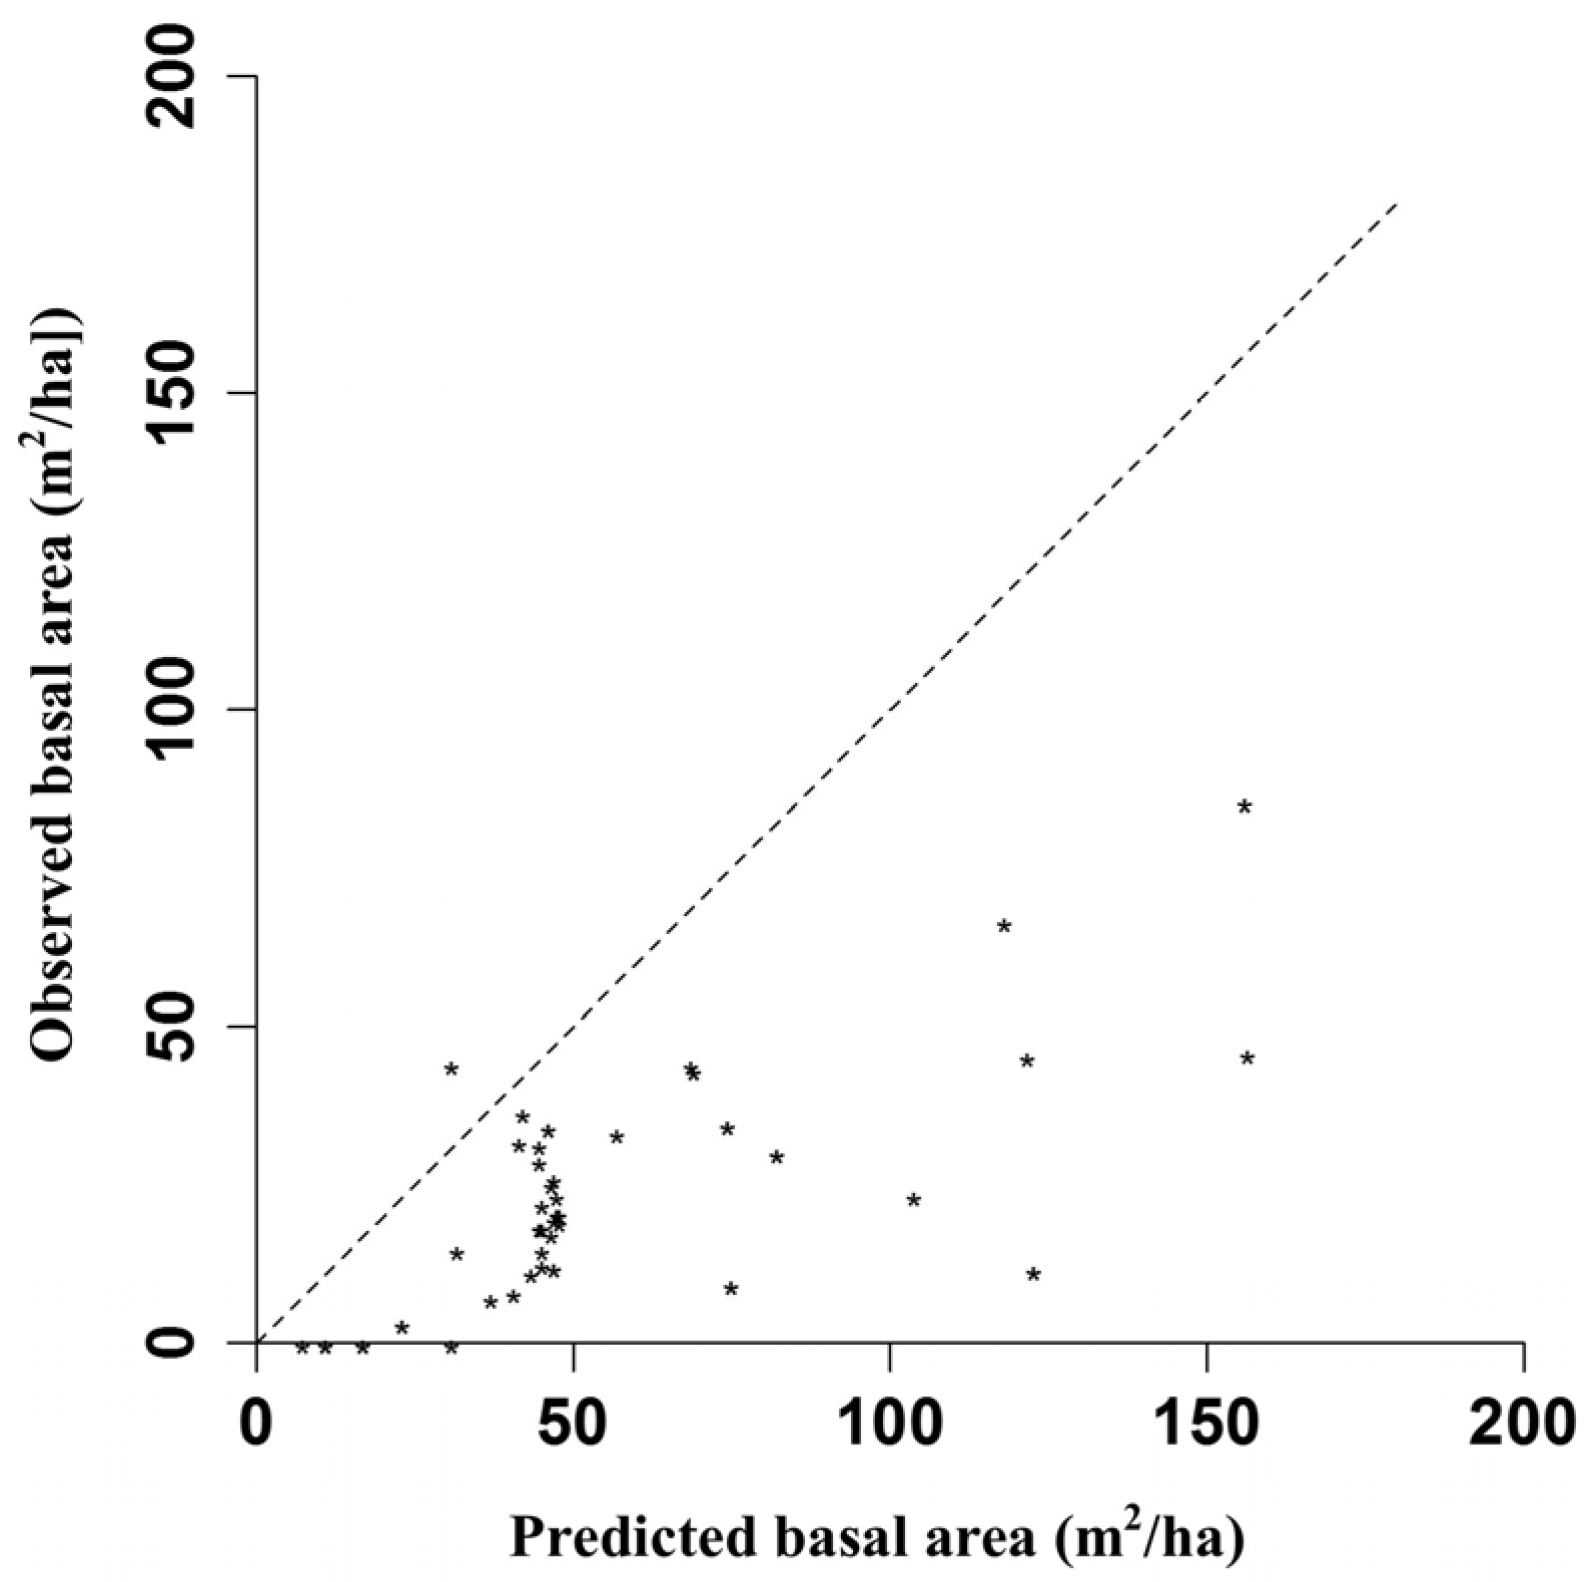
Appendix C. Comparison of Empirical Basal Area and Simulated Basal Area with Plonski’s Yield Table

Prior to simulations of carbon emission by fire, we ensured that the use of Plonski’s yield table [65] instead of our empirical basal area data would not bring a bias to our conclusions. We calculated Pearson’s correlation between tree basal areas extracted from Plonski’s tables and our empirical basal areas. Comparisons showed good predictive skills, with a Pearson correlation coefficient of 0.72 (Figure C1). Plonski’s tables, however, overestimated the basal area, but this difference does not change the conclusions of our study because trees contribute only slightly to the amount of carbon emitted during fire (Table 3) and simulated values are significantly similar to observed values.
Figure C1. Comparison of empirical basal area and simulated basal area using Plonski’s yield table.
Forests 08 00009 g005

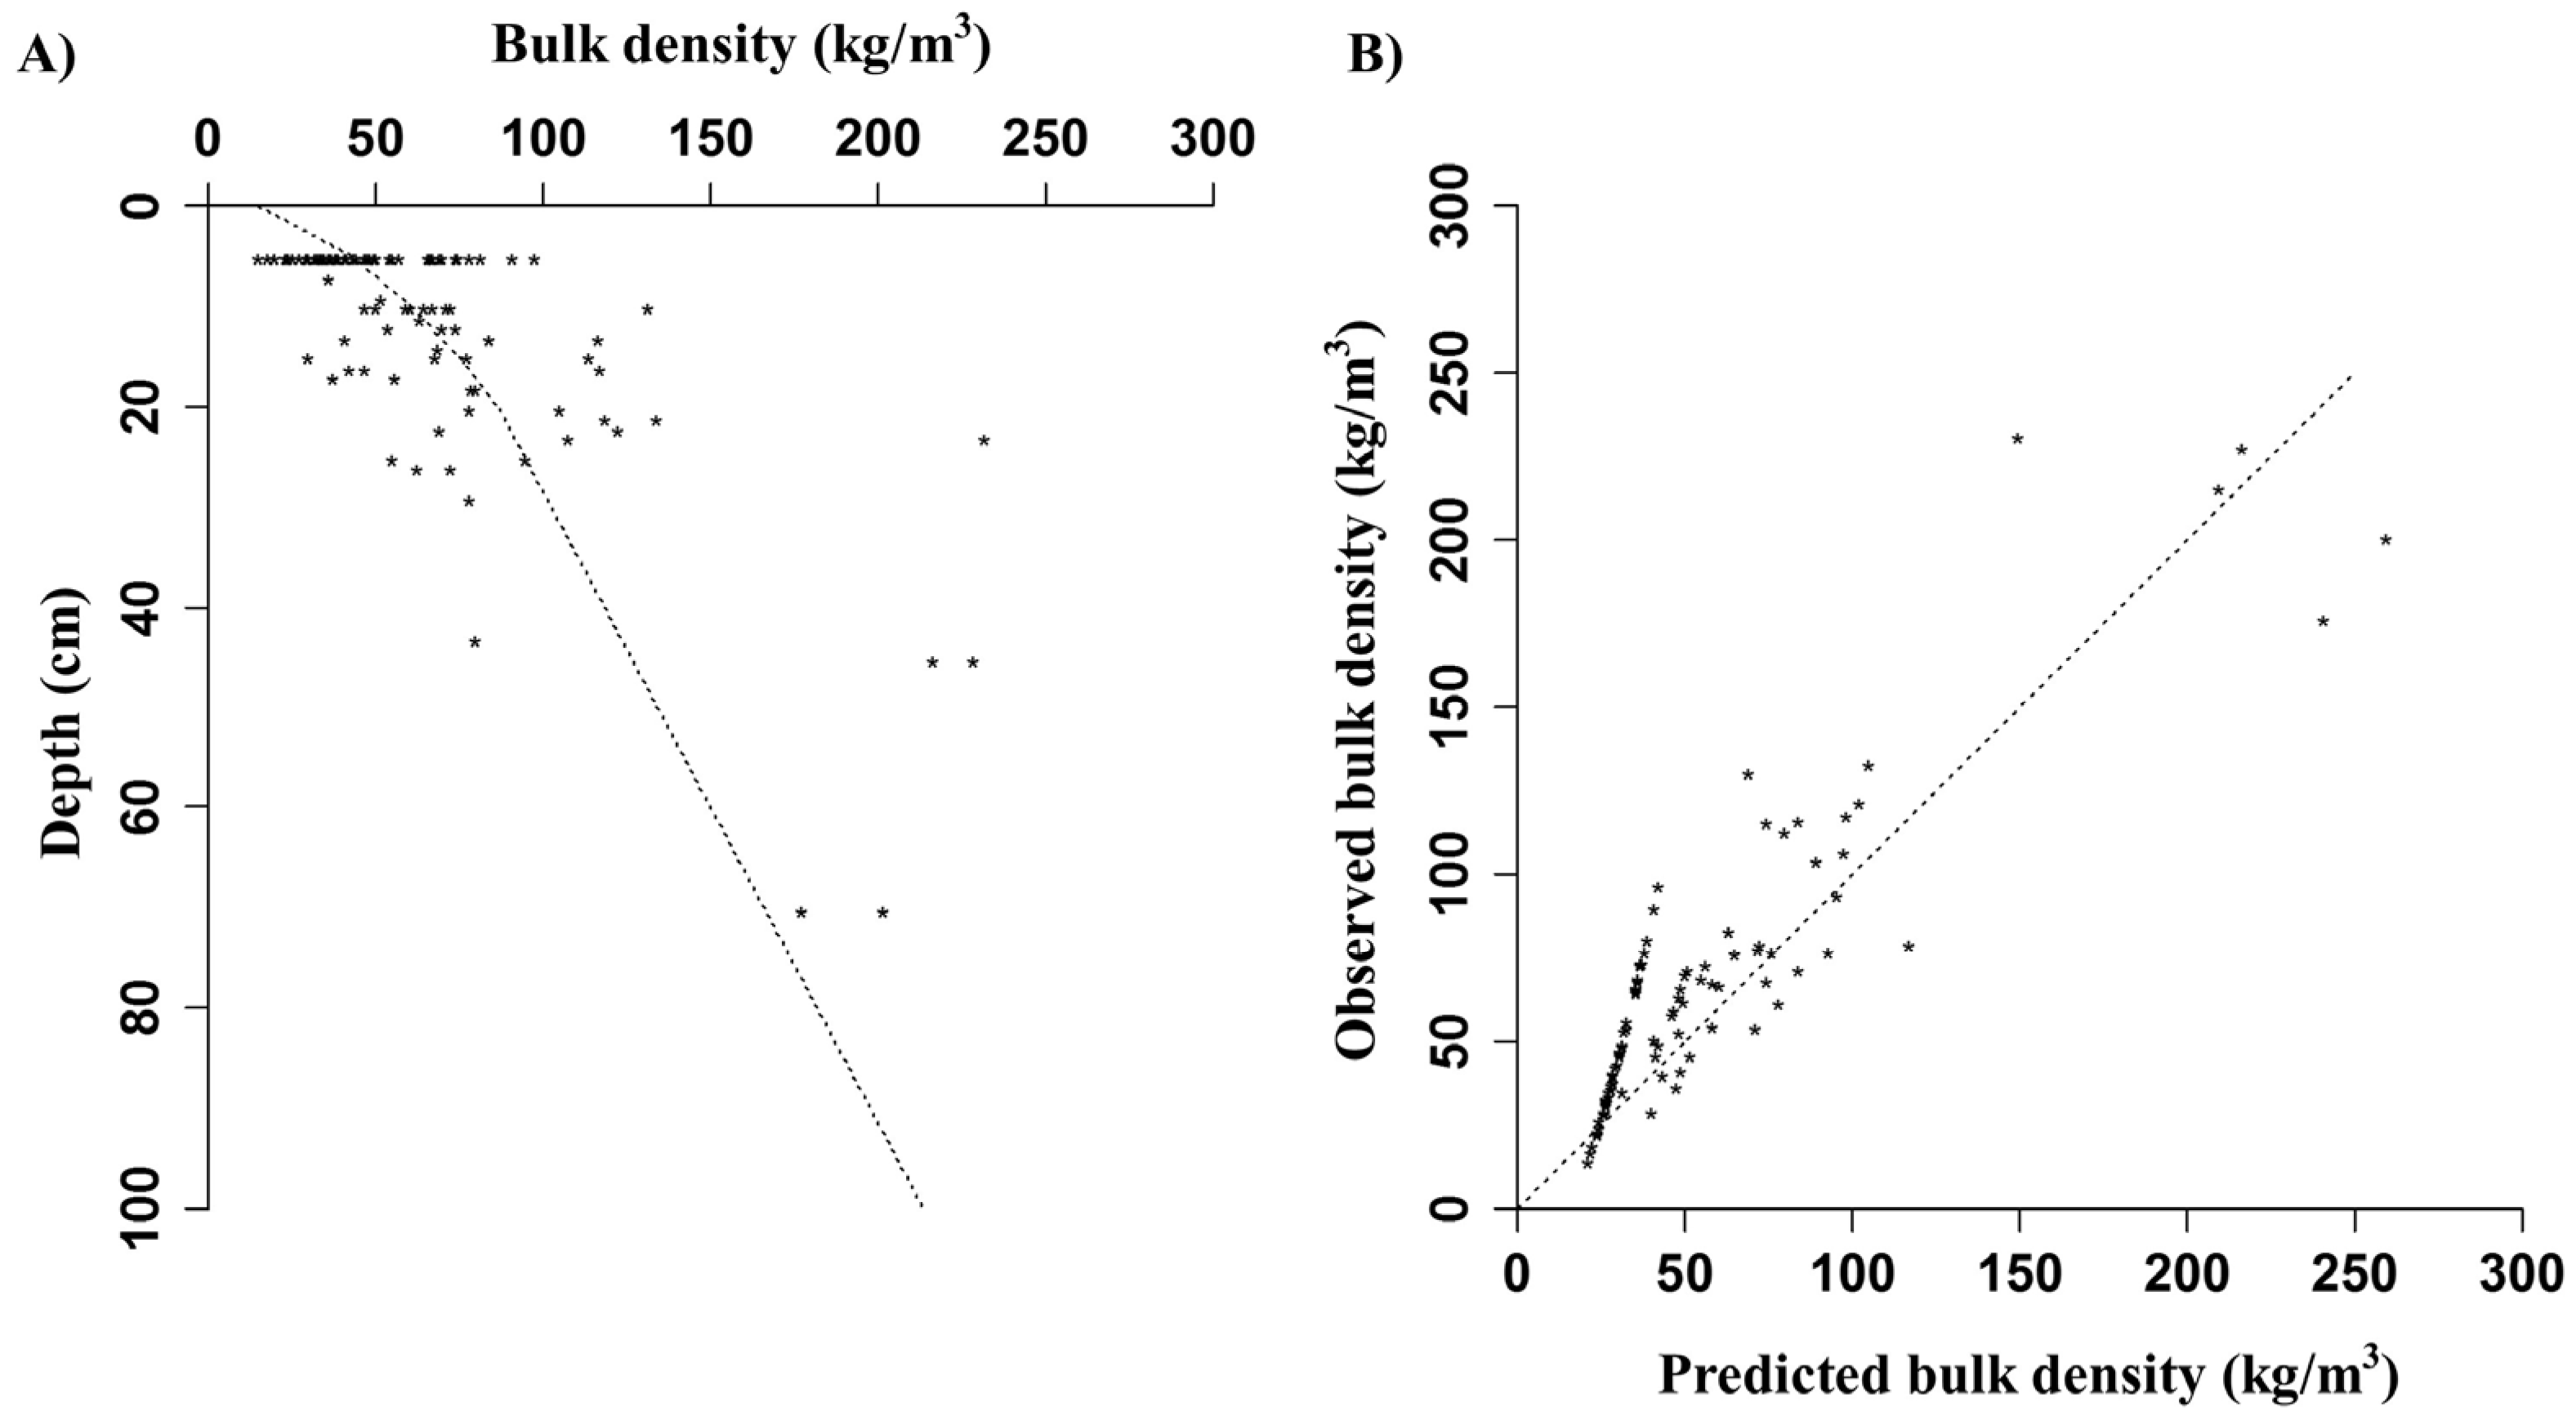
Appendix D. Calibration of Bulk Density with Duff Fuel Loads

We calibrated a model linking measured bulk density (kg·m−3) with organic layer depth (m) to consider heterogeneity in organic bulk density with the organic layer depth [37]. We made use of peat datasets comprising 103 measurements of bulk density at different organic layer depths selected from 11 sites in the Quebec Clay Belt boreal forest [34]. Bulk density and organic layer depths were logarithmically transformed to linearize the relationship. Linear regressions were performed using R freeware [59].
The resulting model explained 45% of the variance in bulk density (adjusted R2 = 0.45, p-value ≤ 0.001). The model took on the following form:
ln ( B u l k   D e n s i t y + 1 ) = 2.72 + 0.57 × ln ( O r g a n i c   L a y e r   D e p t h + 1 )
Therein bulk density progressively increases with organic layer depth (Figure D1A). Comparison of observed and predicted values indicated relatively good predictive skills, with a Pearson correlation coefficient of 0.73 (Figure D1B).
Figure D1. (A) Bulk density (kg/m3) variation with organic layer depth for forested peats in the Clay Belt boreal forests. Stars represent sampling data collected by Simard et al. [34]. The dotted line represents the regression relationship; (B) Predicted bulk density with regression analysis versus observed values.
Forests 08 00009 g006

Appendix E. Calibration of Bulk Density with Duff Fuel Loads

Table E1. Empirical TSF and fuel loads (tree, fine aerial vegetation, DWD, duff, and total) for TA, JP, BS-S, and BS-NS dominated forests.
Fuel Material
Forest TypeTSF (Years)Tree (t/ha)Fine Aerial (t/ha)DWD (t/ha)Duff (t/ha)Total (t/ha)
TA1105699070730
5734641278440
68100371688241
71190014257460
102200017145362
145120122292435
145120126197343
187375238117524
18737527129514
JP110115457
11008681168
11027977158
5413701087234
87173012154339
89175422152353
89175144115335
14291021270382
15213203182317
152132112140285
18034115225276
18034010225270
20742012171225
20742023173238
22574210163248
BS-S320117170188
320310131144
320217477
5516412131298
8711852223348
9113407117258
129127133190350
129127116232376
14572158169299
14594011204310
16511513506625
17774218289383
18185017350453
22566131338436
2727906496581
28352214698767
28366319541629
3564514682733
BS-NS411121292306
411122292307
411121292306
55004157160
575302239295
782411435461
962912483515
1004011351393
14263112281356
1464307389440
1464309389441
170106349721084
1726658464543
17266210464542

References

  1. Lemprière, T.C.; Kurz, W.A.; Hogg, E.H.; Schmoll, C.; Rampley, G.J.; Yemshanov, D.; McKenney, R.; Gilsenan, A.; Beatch, D.; Blain, J.S.; et al. Canadian boreal forests and climate change mitigation 1. Environ. Rev. 2013, 21, 293–321. [Google Scholar] [CrossRef]
  2. Lorenz, K.; Lal, R. Carbon Sequestration in Forest Ecosystems; Springer: Dordrecht, The Netherlands, 2010; pp. 5–11. [Google Scholar]
  3. Dixon, R.K.; Solomon, A.M.; Brown, S.; Houghton, R.A.; Trexler, M.C.; Wisniewski, J. Carbon pools and flux of global forest ecosystems. Science 1994, 263, 185–190. [Google Scholar] [CrossRef] [PubMed]
  4. Luyssaert, S.; Inglima, I.; Jung, M.; Richardson, A.D.; Reichstein, M.; Papale, D.; Piao, S.L.; Schulze, E.-D.; Wingate, L.; Matteucci, G.; et al. CO2 balance of boreal, temperate, and tropical forests derived from a global database. Glob. Chang. Biol. 2007, 13, 2509–2537. [Google Scholar] [CrossRef]
  5. Terrier, A.; Girardin, M.; Bergeron, Y. Les réservoirs de carbone en forêt boréale à l’est du Canada: Acquis et incertitudes dans la modélisation face aux changements climatiques. VertigO-la Revue Électronique Sci. L'environnement 2012, 11, 3. [Google Scholar] [CrossRef]
  6. Burton, P.J.; Messier, C.; Weetman, G.F.; Prepas, E.E.; Adamowicz, W.L.; Tittler, R. The current state of boreal forestry and the drive for change. In Towards Sustainable Management of the Boreal Forest; Burton, P.J., Messier, C., Smith, D.W., Adamowicz, W.L., Eds.; NRC Research Press: Ottawa, ON, Canada, 2003; pp. 1–40. [Google Scholar]
  7. Attiwill, P.M. The disturbance of forest ecosystems: The ecological basis for conservative management. For. Ecol. Manag. 1994, 63, 247–300. [Google Scholar] [CrossRef]
  8. Bergeron, Y.; Harvey, B. Basing sylviculture on natural ecosystems dynamics: An approach applied to the southern boreal mixedwood forest of Quebec. For. Ecol. Manag. 1997, 92, 235–242. [Google Scholar] [CrossRef]
  9. Angelstam, P.K. Maintaining and restoring biodiversity in European boreal forests by developing natural disturbance regimes. J. Veg. Sci. 1998, 9, 593–602. [Google Scholar] [CrossRef]
  10. Gauthier, S.; Vaillancourt, M.-A.; Leduc, A.; de GrandPré, L.; Kneeshaw, D.; Morin, H.; Drapeau, P.; Bergeron, Y. Ecosystem Management in the Boreal Forest; Presses de l’Uniersité du Québec: Québec, QC, Canada, 2009. [Google Scholar]
  11. Franklin, J.F. Preserving biodiversity: Species, ecosystems, or landscapes? Ecol. Appl. 1993, 3, 202–205. [Google Scholar] [CrossRef] [PubMed]
  12. Gauthier, S.; Leduc, A.; Bergeron, Y. Forest dynamics modelling under natural fire cycles: A tool to define natural mosaic diversity for forest management. Environ. Monit. Assess. 1996, 39, 417–434. [Google Scholar] [CrossRef] [PubMed]
  13. Perera, A.H.; Buse, L.J. Emulating Natural Disturbance in Forest Management. In Emulating Natural Forest Landscape Disturbances; Perera, A.H., Buse, L.J., Weber, M.G., Eds.; Columbia University Press: New York, NY, USA, 2004; pp. 3–7. [Google Scholar]
  14. Niemela, È.J. Management in relation to disturbance in the boreal forest. For. Ecol. Manag. 1999, 115, 127–134. [Google Scholar] [CrossRef]
  15. Bergeron, Y.; Fenton, N.J. Boreal forests of eastern Canada revisited: Old growth, nonfire disturbances, forest succession, and biodiversity. Botany 2012, 90, 509–523. [Google Scholar] [CrossRef]
  16. Bergeron, Y.; Harvey, B.; Leduc, A.; Gauthier, S. Forest management guidelines based on natural disturbances dynamics: Stand- and forest-level considerations. For. Chron. 1999, 75, 49–54. [Google Scholar] [CrossRef]
  17. Cyr, D.; Gauthier, S.; Bergeron, Y.; Carcaillet, C. Forest management is driving the eastern North American boreal forest outside its natural range of variability. Front. Ecol. Environ. 2009, 7, 519–524. [Google Scholar] [CrossRef]
  18. Luyssaert, S.; Schulze, E.D.; Börner, A.; Knohl, A.; Hessenmöller, D.; Law, B.E.; Ciais, P.; Grace, J. Old-growth forests as global carbon sinks. Nature 2008, 455, 213–215. [Google Scholar] [CrossRef] [PubMed]
  19. Amiro, B.D.; Cantin, A.; Flannigan, M.D.; de Groot, W.J. Future emissions from Canadian boreal forest fires. Can. J. For. Res. 2009, 39, 383–395. [Google Scholar] [CrossRef]
  20. De Groot, W.J.; Cantin, A.S.; Flannigan, M.D.; Soja, A.J.; Gowman, L.M.; Newbery, A. A comparison of Canadian and Russian boreal forest fire regimes. For. Ecol. Manag. 2013, 294, 23–34. [Google Scholar] [CrossRef]
  21. Chapin, F.; Woodwell, G.; Randerson, J.; Rastetter, E.; Lovett, G.; Baldocchi, D.; Clark, D.; Harmon, M.; Schimel, D.; Valentini, R.; et al. Reconciling carbon-cycle concepts, terminology, and methods. Ecosystems 2006, 9, 1041–1050. [Google Scholar] [CrossRef]
  22. Yang, G.; Di, X.-Y.; Guo, Q.-X.; Shu, Z.; Zeng, T.; Yu, H.-Z.; Wang, C. The impact of climate change on forest fire danger rating in China’s boreal forest. J. For. Res. 2011, 22, 249–257. [Google Scholar] [CrossRef]
  23. Flannigan, M.D.; Logan, K.A.; Amiro, B.D.; Skinner, W.R.; Stocks, B.D. Future area burned in Canada. Clim. Chang. 2005, 72, 1–16. [Google Scholar] [CrossRef]
  24. Bergeron, Y.; Cyr, D.; Girardin, M.P.; Carcaillet, C. Will climate change drive 21st century burn rates in Canadian boreal forest outside of its natural variability: Collating global climate model experiments with sedimentary charcoal data. Int. J. Wildl. Fire 2010, 19, 1127–1139. [Google Scholar] [CrossRef]
  25. Boulanger, Y.; Gauthier, S.; Burton, P.J.; Vaillancourt, M.A. An alternative fire regime zonation for Canada. Int. J. Wildl. Fire 2012, 21, 1052–1064. [Google Scholar] [CrossRef]
  26. Girardin, M.P.; Hogg, E.H.; Bernier, P.Y.; Kurz, W.A.; Guo, X.J.; Cyr, G. Negative impacts of high temperatures on growth of black spruce forests intensify with the anticipated climate warming. Glob. Chang. Boil. 2016, 22, 627–643. [Google Scholar] [CrossRef] [PubMed]
  27. De Groot, W.J. Modeling Canadian wildland fire carbon emissions with the Boreal Fire Effects (BORFIRE) model. For. Ecol. Manag. 2006, 234, S224. [Google Scholar] [CrossRef]
  28. Amiro, B.D.; Todd, J.B.; Wotton, B.M.; Logan, K.A.; Flannigan, M.D.; Stocks, B.J.; Mason, J.A.; Martell, K.G.; Hirsch, K.G. Direct carbon emissions from Canadian forest fires, 1959–1999. Can. J. For. Res. 2001, 31, 512–525. [Google Scholar] [CrossRef]
  29. Johnston, D.C.; Turetsky, M.R.; Benscoter, B.W.; Wotton, B.M. Fuel load, structure, and potential fire behaviour in black spruce bogs. Can. J. For. Res. 2015, 45, 888–899. [Google Scholar] [CrossRef]
  30. Scharlemann, J.P.; Hiederer, R.; Kapos, V.; Ravilious, C. Updated Global Carbon Map; UNEP-WCRC & EU-JRC: Cambridge, UK, 2009. [Google Scholar]
  31. Brown, J.K. Unatural Fuel Buildup Issue. In Proceedings of the Symposium and Workshop on Wilderness Fire, Missoula, MT, USA, 15–18 November 1983.
  32. Ryan, K.C.; Knapp, E.E.; Varner, J.M. Prescribed fire in North American forests and woodlands: History, current practice, and challenges. Front. Ecol. Environ. 2013, 11, e15–e24. [Google Scholar] [CrossRef]
  33. Johnson, E.A.; Miyanishi, K.; Bridge, S.R.J. Wildfire regime in the boreal forest and the idea of suppression and fuel buildup. Conserv. Biol. 2001, 15, 1554–1557. [Google Scholar] [CrossRef]
  34. Simard, M.; Lecomte, N.; Bergeron, Y.; Bernier, P.Y.; Paré, D. Forest productivity decline caused by successional paludification of boreal soils. Ecol. Appl. 2007, 17, 1619–1637. [Google Scholar] [CrossRef] [PubMed]
  35. Fenton, N.J.; Bergeron, Y. Facilitative succession in a boreal bryophyte community driven by changes in available moisture and light. J. Veg. Sci. 2006, 17, 65–76. [Google Scholar] [CrossRef]
  36. Terrier, A.; de Groot, W.J.; Girardin, M.P.; Bergeron, Y. Dynamics of moisture content in spruce-feather moss and spruce–Sphagnum organic layers during an extreme fire season and implications for future depths of burn in Clay Belt black spruce forests. Int. J. Wildl. Fire 2014, 23, 490–502. [Google Scholar] [CrossRef]
  37. Benscoter, B.W.; Thompson, D.K.; Waddington, J.M.; Flannigan, M.D.; Wotton, B.M.; de Groot, W.J.; Turetsky, M.R. Interactive effects of vegetation, soil moisture and bulk density on depth of burning of thick organic soils. Int. J. Wildl. Fire 2011, 20, 418–429. [Google Scholar] [CrossRef]
  38. Benscoter, B.W.; Wieder, R.K. Variability in organic matter lost by combustion in a boreal bog during the 2001 Chisholm fire. Can. J. For. Res. 2003, 33, 2509–2513. [Google Scholar] [CrossRef]
  39. Shetler, G.; Turetsky, M.R.; Kane, E.; Kasischke, E. Sphagnum mosses limit total carbon consumption during fire in Alaskan black spruce forests. Can. J. For. Res. 2008, 38, 2328–2336. [Google Scholar] [CrossRef]
  40. De Groot, W.J.; Bothwell, P.M.; Carlsson, D.H.; Logan, K.A. Simulating the effects of future fire regimes on western Canadian boreal forests. J. Veg. Sci. 2003, 14, 355–364. [Google Scholar] [CrossRef]
  41. De Groot, W.J.; Landry, R.; Kurz, W.A.; Anderson, K.R.; Englefield, P.; Fraser, R.H.; Hall, R.J.; Banfield, E.; Raymond, D.A.; Decker, V.; et al. Estimating direct carbon emissions from Canadian wildland fires. Int. J. Wildl. Fire 2007, 16, 593–606. [Google Scholar] [CrossRef]
  42. Vincent, J.S.; Hardy, L. L’évolution et l’extension des lacs glaciaires Barlow et Ojibway en territoire québécois. Géogr. Phys. Quat. 1977, 31, 357–372. [Google Scholar] [CrossRef]
  43. Bergeron, Y.; Gauthier, S.; Flannigan, M.D.; Kafka, V. Fire regimes at the transition between mixedwoods and coniferous boreal forest in northwestern Quebec. Ecology 2004, 85, 1916–1932. [Google Scholar] [CrossRef]
  44. Environment Canada. National Climate Data and Information Archive. 2016. Available online: http://climate.weatheroffice.gc.ca/ (accessed on 7 June 2016).
  45. Fenton, N.; Lecomte, N.; Légaré, S.; Bergeron, Y. Paludification in black spruce (Picea mariana) forests of eastern Canada: Potential factors and management implications. For. Ecol. Manag. 2005, 213, 151–159. [Google Scholar] [CrossRef]
  46. Lavoie, M.; Paré, D.; Fenton, N.; Groot, A.; Taylor, K. Paludification and management of forested peatlands in Canada: A literature review. Environ. Rev. 2005, 13, 21–50. [Google Scholar] [CrossRef]
  47. Harper, K.; Boudreault, C.; de Grandpré, L.; Drapeau, P.; Gauthier, S.; Bergeron, Y. Structure, composition and diversity of old-growth black spruce boreal forest of the Clay Belt region in Québec and Ontario. Environ. Rev. 2003, 11, S79–S98. [Google Scholar] [CrossRef]
  48. Lecomte, N.; Bergeron, Y. Successional pathways on different surficial deposits in the coniferous boreal forest of the Quebec Clay Belt. Can. J. For. Res. 2005, 35, 1984–1995. [Google Scholar] [CrossRef]
  49. Fenton, N.J.; Béland, C.; de Blois, S.; Bergeron, Y. Sphagnum establishment and expansion in black spruce (Picea mariana) boreal forests. Can. J. Bot. 2007, 85, 43–50. [Google Scholar] [CrossRef]
  50. Belleau, A.; Leduc, A.; Lecomte, N.; Bergeron, Y. Forest succession rate and pathways on different surface deposit types in the boreal forest of northwestern Quebec. Ecoscience 2011, 18, 329–340. [Google Scholar] [CrossRef]
  51. Lecomte, N.; Simard, M.; Bergeron, Y. Effects of fire severity and initial tree composition on stand structural development in the coniferous boreal forest of northwestern Québec, Canada. Ecoscience 2006, 13, 152–163. [Google Scholar] [CrossRef]
  52. Greene, D.F.; Macdonald, S.E.; Haeussler, S.; Domenicano, S.; Noël, J.; Jayen, K.; Charron, I.; Gauthier, S.; Hunt, S.; Gielau, E.T.; et al. The reduction of organic-layer depth by wildfire in the North American boreal forest and its effect on tree recruitment by seed. Can. J. For. Res. 2007, 37, 1012–1023. [Google Scholar] [CrossRef]
  53. Johnstone, J.F.; Chapin, F.S., III; Hollingsworth, T.N.; Mack, M.C.; Romanovsky, V.; Turetsky, M. Fire, climate change, and forest resilience in interior Alaska. Can. J. For. Res. 2010, 40, 1302–1312. [Google Scholar] [CrossRef]
  54. Van Cleve, K.; Oliver, L.; Schlentner, R.; Viereck, L.A.; Dyrness, C. Productivity and nutrient cycling in taiga forest ecosystems. Can. J. For. Res. 1983, 13, 747–766. [Google Scholar] [CrossRef]
  55. Paré, D.; Bernier, P.; Lafleur, B.; Titus, B.D.; Thiffault, E.; Maynard, D.G.; Guo, X. Estimating stand-scale biomass, nutrient contents, and associated uncertainties for tree species of Canadian forests. Can. J. For. Res. 2013, 43, 599–608. [Google Scholar] [CrossRef]
  56. Brown, J.K.; Oberheu, R.D.; Johnston, C.M. Handbook for Inventorying Surface Fuels and Biomass in the Interior West; General Technical Report INT-GTR-129; U.S. Department of Agriculture, Forest Service, Intermountain Forest and Range Experimental Station: Ogden, UT, USA, 1982; p. 48.
  57. Hély, C.; Université de Montpellier 2, Montpellier, France. Personal communication, 2001.
  58. McRae, D.J.; Alexander, M.E.; Stocks, B.J. Measurement and Description of Fuels and Fire Behavior on Prescribed Burns: A Handbook; Great Lakes Forest Research Centre: Sault Ste Mary, ON, Canada, 1979. [Google Scholar]
  59. R Development Core Team. R: A Language and Environment for Statistical Computing, R Development Core Team: Vienna, Austria, 2010.
  60. Terrier, A.; Girardin, M.P.; Cantin, A.; Groot, W.J.; Anyomi, K.A.; Gauthier, S.; Bergeron, Y. Disturbance legacies and paludification mediate the ecological impact of an intensifying wildfire regime in the Clay Belt boreal forest of eastern North America. J. Veg. Sci. 2015, 26, 588–602. [Google Scholar] [CrossRef]
  61. Van Wagner, C.E. Development and Structure of the Canadian Forest Fire Weather Index System; Technical Report No. 35; Canadian Forestry Service: Ottawa, ON, Canada, 1987.
  62. Lambert, M.C.; Ung, C.H.; Raulier, F. Canadian national tree aboveground biomass equations. Can. J. For. Res. 2005, 35, 1996–2018. [Google Scholar] [CrossRef]
  63. Forestry Canada Fire Danger Group. Development and Structure of the Canadian Forest Fire Behavior Prediction System; Information Report ST-X-3; Forestry Canada Fire Danger Group: Ottawa, ON, Canada, 1992. [Google Scholar]
  64. De Groot, W.J.; Pritchard, J.M.; Lynham, T.J. Forest floor fuel consumption and carbon emissions in Canadian boreal forest fires. Can. J. For. Res. 2009, 39, 367–382. [Google Scholar] [CrossRef]
  65. Plonski, W.L. Normal Yield Tables (Metric) for Major Forest Species of Ontario; Ontario Ministry of Natural Resources: Toronto, ON, Canada, 1974; p. 40.
  66. Hély, C.; Bergeron, Y.; Flannigan, M.D. Coarse woody debris in the southeastern Canadian boreal forest: Composition and load variations in relation to stand replacement. Can. J. For. Res. 2000, 30, 674–687. [Google Scholar] [CrossRef]
  67. Légaré, S.; Bergeron, Y.; Paré, D. Influence of forest composition on understory cover in boreal mixedwood forests of western Quebec. Silva Fenn. 2002, 36, 353–366. [Google Scholar] [CrossRef]
  68. Brassard, B.W.; Chen, H.Y. Stand structural dynamics of North American boreal forests. Crit. Rev. Plant Sci. 2006, 25, 115–137. [Google Scholar] [CrossRef]
  69. Hart, S.A.; Chen, H.Y. Understory vegetation dynamics of North American boreal forests. Crit. Rev. Plant Sci. 2006, 25, 381–397. [Google Scholar] [CrossRef]
  70. Greene, D.F.; Zasada, J.C.; Sirois, L.; Kneeshaw, D.; Morin, H.; Charron, I.; Simard, M.-J. A review of the regeneration dynamics of North. American boreal forest tree species. Can. J. For. Res. 1999, 29, 824–839. [Google Scholar] [CrossRef]
  71. Johnstone, J.F.; Chapin, F.S., III. Effects of soil burn severity on post-fire tree recruitment in boreal forest. Ecosystems 2006, 9, 14–31. [Google Scholar] [CrossRef]
  72. Pothier, D.; Savard, F. Actualisation des Tables de Production Pour les Principales Espèces du Québec; RN98-3054; Gouvernement du Québec, Ministère des Ressources Naturelles, Bibliothèque Nationale du Québec: Québec, QC, Canada, 1998.
  73. Wardle, D.A.; Walker, L.R.; Bardgett, R.D. Ecosystem properties and forest decline in contrasting long-term chronosequences. Science 2004, 305, 509–513. [Google Scholar] [CrossRef] [PubMed]
  74. Kneeshaw, D.D.; Bergeron, Y. Canopy gap characteristics and tree replacement in the southeastern boreal forest. Ecology 1998, 79, 783–794. [Google Scholar] [CrossRef]
  75. Chen, H.Y.; Popadiouk, R.V. Dynamics of North American boreal mixedwoods. Environ. Rev. 2002, 10, 137–166. [Google Scholar] [CrossRef]
  76. Pothier, D.; Raulier, F.; Riopel, M. Ageing and decline of trembling aspen stands in Quebec. Can. J. For. Res. 2004, 34, 1251–1258. [Google Scholar] [CrossRef]
  77. Messier, C.; Parent, S.; Bergeron, Y. Effects of overstory and understory vegetation on the understory light environment in mixed boreal forests. J. Veg. Sci. 1998, 9, 511–520. [Google Scholar] [CrossRef]
  78. Grandpré, L.; Gagnon, D.; Bergeron, Y. Changes in the understory of Canadian southern boreal forest after fire. J. Veg. Sci. 1993, 4, 803–810. [Google Scholar] [CrossRef]
  79. Pham, A.T.; Grandpré, L.D.; Gauthier, S.; Bergeron, Y. Gap dynamics and replacement patterns in gaps of the northeastern boreal forest of Quebec. Can. J. For. Res. 2004, 34, 353–364. [Google Scholar] [CrossRef]
  80. Pedlar, J.H.; Pearce, J.L.; Venier, L.A.; McKenney, D.W. Coarse woody debris in relation to disturbance and forest type in boreal Canada. For. Ecol. Manag. 2002, 158, 189–194. [Google Scholar] [CrossRef]
  81. Bond-Lamberty, B.; Gower, S.T. Decomposition and fragmentation of coarse woody debris: Re-visiting a boreal black spruce chronosequence. Ecosystems 2008, 11, 831–840. [Google Scholar] [CrossRef]
  82. Brais, S.; Paré, D.; Lierman, C. Tree bole mineralization rates of four species of the Canadian eastern boreal forest: Implications for nutrient dynamics following stand-replacing disturbances. Can. J. For. Res. 2006, 36, 2331–2340. [Google Scholar] [CrossRef]
  83. Päätalo, M.-L. Factors influencing occurrence and impacts of fires in northern European forests. Silva Fenn. 1998, 32, 185–202. [Google Scholar] [CrossRef]
  84. Hély, C.; Flannigan, M.; Bergeron, Y.; McRae, D. Role of vegetation and weather on fire behavior in the Canadian mixedwood boreal forest using two fire behavior prediction systems. Can. J. For. Res. 2001, 31, 430–441. [Google Scholar] [CrossRef]
  85. Arienti, M.C.; Cumming, S.G.; Boutin, S. Empirical models of forest fire initial attack success probabilities: The effects of fuels, anthropogenic linear features, fire weather, and management. Can. J. For. Res. 2006, 36, 3155–3166. [Google Scholar] [CrossRef]
  86. Krawchuk, M.A.; Cumming, S.G.; Flannigan, M.D.; Wein, R.W. Biotic and abiotic regulation of lightning fire initiation in the mixedwood boreal forest. Ecology 2006, 87, 458–468. [Google Scholar] [CrossRef] [PubMed]
  87. Harden, J.W.; Trumbore, S.E.; Stocks, B.J.; Hirsch, A.; Gower, S.T.; O’neill, K.P.; Kasischke, E.S. The role of fire in the boreal carbon budget. Glob. Chang. Biol. 2000, 6, 174–184. [Google Scholar] [CrossRef]
  88. Turetsky, M.R.; Kane, E.S.; Harden, J.W.; Ottmar, R.D.; Manies, K.L.; Hoy, E.; Kasischke, E.S. Recent acceleration of biomass burning and carbon losses in Alaskan forests and peatlands. Nat. Geosci. 2011, 4, 27–31. [Google Scholar] [CrossRef]
  89. Whelan, R.J. The Ecology of Fire; Cambridge University Press: Cambridge, UK, 1995. [Google Scholar]
  90. Fleming, R.A.; Candau, J.-N.; McAlpine, R.S. Landscape-Scale Analysis of Interactions between Insect Defoliation and Forest Fire in Central Canada. Clim. Chang. 2002, 55, 251–272. [Google Scholar] [CrossRef]
  91. Gignac, L.D.; Vitt, D.H. Responses of northern peatlands to climate change: Effects on bryophytes. Hattori Shokubutsu Kenkyujo Hokoku 1994, 75, 119–132. [Google Scholar]
  92. Breeuwer, A.; Robroek, B.J.; Limpens, J.; Heijmans, M.M.; Schouten, M.G.; Berendse, F. Decreased summer water table depth affects peatland vegetation. Basic Appl. Ecol. 2009, 10, 330–339. [Google Scholar] [CrossRef]
  93. Wickland, K.P.; Neff, J.C. Decomposition of soil organic matter from boreal black spruce forest: Environmental and chemical controls. Biogeochemistry 2008, 87, 29–47. [Google Scholar] [CrossRef]
Figure 1. Geographic location of the sampling sites in the Clay Belt boreal forest, eastern North America.
Forests 08 00009 g001
Figure 2. Changes in loads of (A) tree; (B) fine aerial vegetation (herbs and shrubs); (C) dead woody debris (DWD); (D) duff; and (E) total fuel (A + B + C + D) with TSF for TA, JP, BS-S, and BS-NS dominated forests. Fuel loads were logarithmically transformed and are represented by color points. The black line expresses the significant relationship (p-value ≤ 0.05) in the polynomial regression analysis and the grey shape corresponds to the regression standard error.
Forests 08 00009 g002
Figure 3. CanFIRE potential carbon emissions averaged by early (TSF < 90 years), intermediate (TSF between 90 and 150 years), and late (TSF > 150 years) successional stages, and by dominant forest types of the Clay Belt boreal landscape (trembling aspen (TA), jack pine (JP), black spruce originating from severe fire (BS-S), and black spruce originating from non-severe fire (BS-NS) forests). Error bars represent the mean standard error.
Forests 08 00009 g003
Table 1. Distribution of study sites in different successional stages and forest types.
TSF (Years)Forest Type
TAJPBS-SBS-NS
<906755
90–1504155
>1502786
Total12151816
Values express the number of sites. TSF: time since the last fire; TA: trembling aspen; JP: jack pine; BS-S: black spruce originating from severe fire; BS-NS: black spruce originating from non-severe fire.
Table 2. p-value, adjusted R2 and equations extracted from the regression polynomial analysis of tree, fine aerial vegetation (shrubs + herbs), DWD, duff, and total fuel loads with TSF for TA, JP, BS-S, and BS-NS dominated forests. NS stands for a non-significant relationship.
Fuelp-ValueR2Model
TATrees≤0.0050.92 ln ( l o a d ) = 2.21 + 0.23 × TSF 0.002 × TSF 2 + 0.000006 × TSF 3
Fine aerial≤0.050.47 ln ( l o a d ) = 6.91 0.11 × TSF + 0.00045 × TSF 2
DWD≤0.0010.84 ln ( l o a d ) = 5.31 0.093 × TSF + 0.00099 × TSF 2 0.000003 × TSF 3
DuffNSNSNS
Total≤0.050.49 ln ( l o a d ) = 6.72 0.017 × TSF + 0.00008 × TSF 2
JPTrees≤0.005 10.78 ln ( l o a d ) = 0.38 + 0.084 × TSF 0.0003 × TSF 2
Fine aerialNSNSNS
DWDNSNSNS
Duff≤0.0010.65 ln ( l o a d ) = 4.35 + 0.0049 × TSF
Total≤0.050.19 ln ( l o a d ) = 5.1 + 0.003 × TSF
BS-STrees≤0.001 10.52 ln ( l o a d ) = 0.049 + 0.048 × TSF 0.00012 × TSF 2
Fine aerialNSNSNS
DWD≤0.05 10.16 ln ( l o a d ) = 1.03 + 0.018 × TSF 0.000046 × TSF 2
Duff≤0.0010.81 ln ( l o a d ) = 4.59 0.006 × TSF
Total≤0.0010.71 ln ( l o a d ) = 5.06 + 0.0052 × TSF
BS-NSTrees≤0.001 10.48 ln ( F u e l   l o a d ) = 0.79 + 0.036 × TSF 0.00009 × TSF 2
Fine aerialNSNSNS
DWD≤0.05 10.34 ln ( F u e l   l o a d ) = 0.06 + 0.019 × TSF 0.00005 × TSF 2
Duff≤0.050.38 ln ( F u e l   l o a d ) = 5.3 + 0.0055 × TSF
Total≤0.0050.48 ln ( F u e l   l o a d ) = 5.34 + 0.006 × TSF
1 Non-significant intercept.
Table 3. Values of total potential carbon emission by forest type and successional stage, and contribution of each fuel category to the total emission.
Forest TypeSuccessional StageTotal (t/ha)Contribution of Fuel Category
Tree (%)DWD (%)Duff (%)
TATSF < 90 years16.202080
TSF between 90 and 150 years21.401189
TSF > 150 years14.801090
JPTSF < 90 years17.9142165
TSF between 90 and 150 years24.70991
TSF > 150 years18.50694
BS-STSF < 90 years31.66391
TSF between 90 and 150 years44.36589
TSF > 150 years12.521286
BS-NSTSF < 90 years52.33196
TSF between 90 and 150 years17.43691
TSF > 150 years1.905347

