Article

Sequential Management of Commercial Rosewood (Aniba rosaeodora Ducke) Plantations in Central Amazonia: Seeking Sustainable Models for Essential Oil Production

by
Pedro Medrado Krainovic
1,*,
Danilo Roberti Alves de Almeida
2,
Diego Desconci
1,
Valdir Florêncio da Veiga-Júnior
3 and
Paulo De Tarso Barbosa Sampaio
1
1
National Institute of Amazonian Research—INPA, Manaus 69067-375, Brazil
2
Forest Sciences Department, University of São Paulo—USP, Piracicaba 13418-000, Brazil
3
Federal University of Amazonas—UFAM, Manaus 69067-005, Brazil
*
Author to whom correspondence should be addressed.
Forests 2017, 8(12), 438; https://doi.org/10.3390/f8120438
Submission received: 14 August 2017 / Revised: 24 October 2017 / Accepted: 7 November 2017 / Published: 28 November 2017
(This article belongs to the Special Issue Forest Sustainable Management)

Abstract

:
Rosewood (Aniba rosaeodora Ducke) is an endangered tree that produces essential oil of high commercial value. However, technical-scientific knowledge about cultivation is scarce and studies are needed to examine the management viability. The current study evaluated rosewood aboveground biomass management, measuring the export of nutrients resulting from harvesting and testing sustainable management models. The crown of 36 rosewood trees were pruned and 108 trees cut at 50 cm above the soil in two regions in Central Amazonia. Post-harvest performance of sprouting shoots was evaluated and after, sprouting shoots were pruned so that the development of two, three and all shoots was permitted. Nutrient stock estimation was calculated as the product of mass and nutrient concentration, which allowed nutritional replacement to be estimated. The pruning facilitates regrowth by 40.11% of the initial mass while by cut regrow 1.45%. Chemical attributes of regrowth biomass differed significantly prior to management and regrowth had a significant correlation with the reserves in root tissues and with the pre -management status of the individual tree. Driving sprouts resulted in significantly larger growth increments and may provide a form of management that can viably be adopted. Biomass sequential management resulted in high nutrient exports and the amount of fertilizer needed for replenishment depended on the intensity and frequency of cropping. Compared with the cut of the tree, pruning the canopy reduces fertilizers that are required to replenish amount by 44%, decreasing to 26.37% in the second rotation. The generated knowledge contributes to this silvicultural practice as it becomes ecologically and economically viable.

1. Introduction

Rosewood (Aniba rosaeodora Ducke, Lauraceae) is a commercially valuable tree, whose essential oil is in much demand industrially [1,2]. The species is, however, in danger of extinction [3,4,5] and cultivation in plantations is beginning to be seen as a financially-viable commercial option [6,7]. In addition, plantations may be a means to reducing the pressure of exploitation of natural rosewood populations [8]. Management of planted trees is the only way to meet the demand for this forest product and guarantee the conservation of this species in its natural habitat [9].
In Brazil, the criteria for development for rosewood management are covered by legal statutes [10,11,12,13], but the scientific basis required for the practical and sustainable development of the species is almost non-existent [14]. Accordingly, there is a need for studies that explore the methods to be used for viable management of harvesting rotations, the means by which harvesting occurs, and the nutritional requirements of trees during the period of biomass regrowth. Currently, harvesting occurs via removal of 100% of the crown [15,16,17], or of the entire tree, after cutting the trunk 50 cm above the soil [10,17], and then extracting the essential oil from all parts of the tree [18,19,20,21]. Clearly, at the moment of harvest, all nutrients assimilated from the soil by the plant are lost to future biogeochemical cycles at the growth site [22,23,24,25], leading to an export of nutrients that can compromise ecosystem productivity during future crop rotations [26,27,28].
As a result, biomass accumulation under such management may be limited by negative impacts on soil fertility [28,29]. In consequence, interactions between such tree crops and nutrient cycling need to be studied if sustainable forest management is to be guaranteed. Replacing exported nutrients is one method by which sustainable use of production sites can be achieved [30,31], but to do this effectively for rosewood it is necessary to know the nutrient profile of its commercializable biomass.
The post-harvest regrowth capacity of a tree is influenced by such factors as pre-disturbance condition [32,33], initial capacity to acquire post-disturbance resources, genetic predisposition [34], as well the dormant seedbank [35]. In rosewood, vigorous regrowth of managed trees has been reported [6,7,36]. Such regrowth is of great importance to the essential oil trade, as productivity is directly proportional to production, so favoring management by coppicing. However, such developments require a knowledge of the limits of this technique if sustainable management of rosewood plantations is to occur [37,38,39].
Biomass management of rosewood regrowth requires increasing knowledge about speed of regeneration formulating technical criteria that justify additional harvesting rotations [17]. Post-harvest plants have no immediate photosynthetic capacity and therefore require nutrient stocks in their underground organs to meet the demands of respiration and the regrowth process until leaves appear on regrown shoots [34,40]. Additionally, several authors [33,41,42,43] have associated photosynthetic characteristics with the nutritional status of sprouting. Clearly, in the case of plants such as rosewood that are of commercial interest, these sprout (issued after harvest) must have the characteristics that meet the market requirements. Thus, an understanding of the mechanisms underlying rosewood biomass regrowth can help both decision makers considering the management of the species in commercially-productive systems, and those planning governmental guidelines on the use and conservation of the species.
For this reason, we performed the largest rosewood sampling to date in commercial plantations aiming to describe the nutritional changes associated with management of rosewood above-ground biomass and the regeneration of biomass by regrowth, and to document the extent and nature of shoot growth under different forms of management. In addition, the study quantified nutrient export during sequential harvesting and assessed the need for replenishment by fertilization under the different types of management already occurring in commercial Central Amazonian rosewood plantations.

2. Materials and Methods

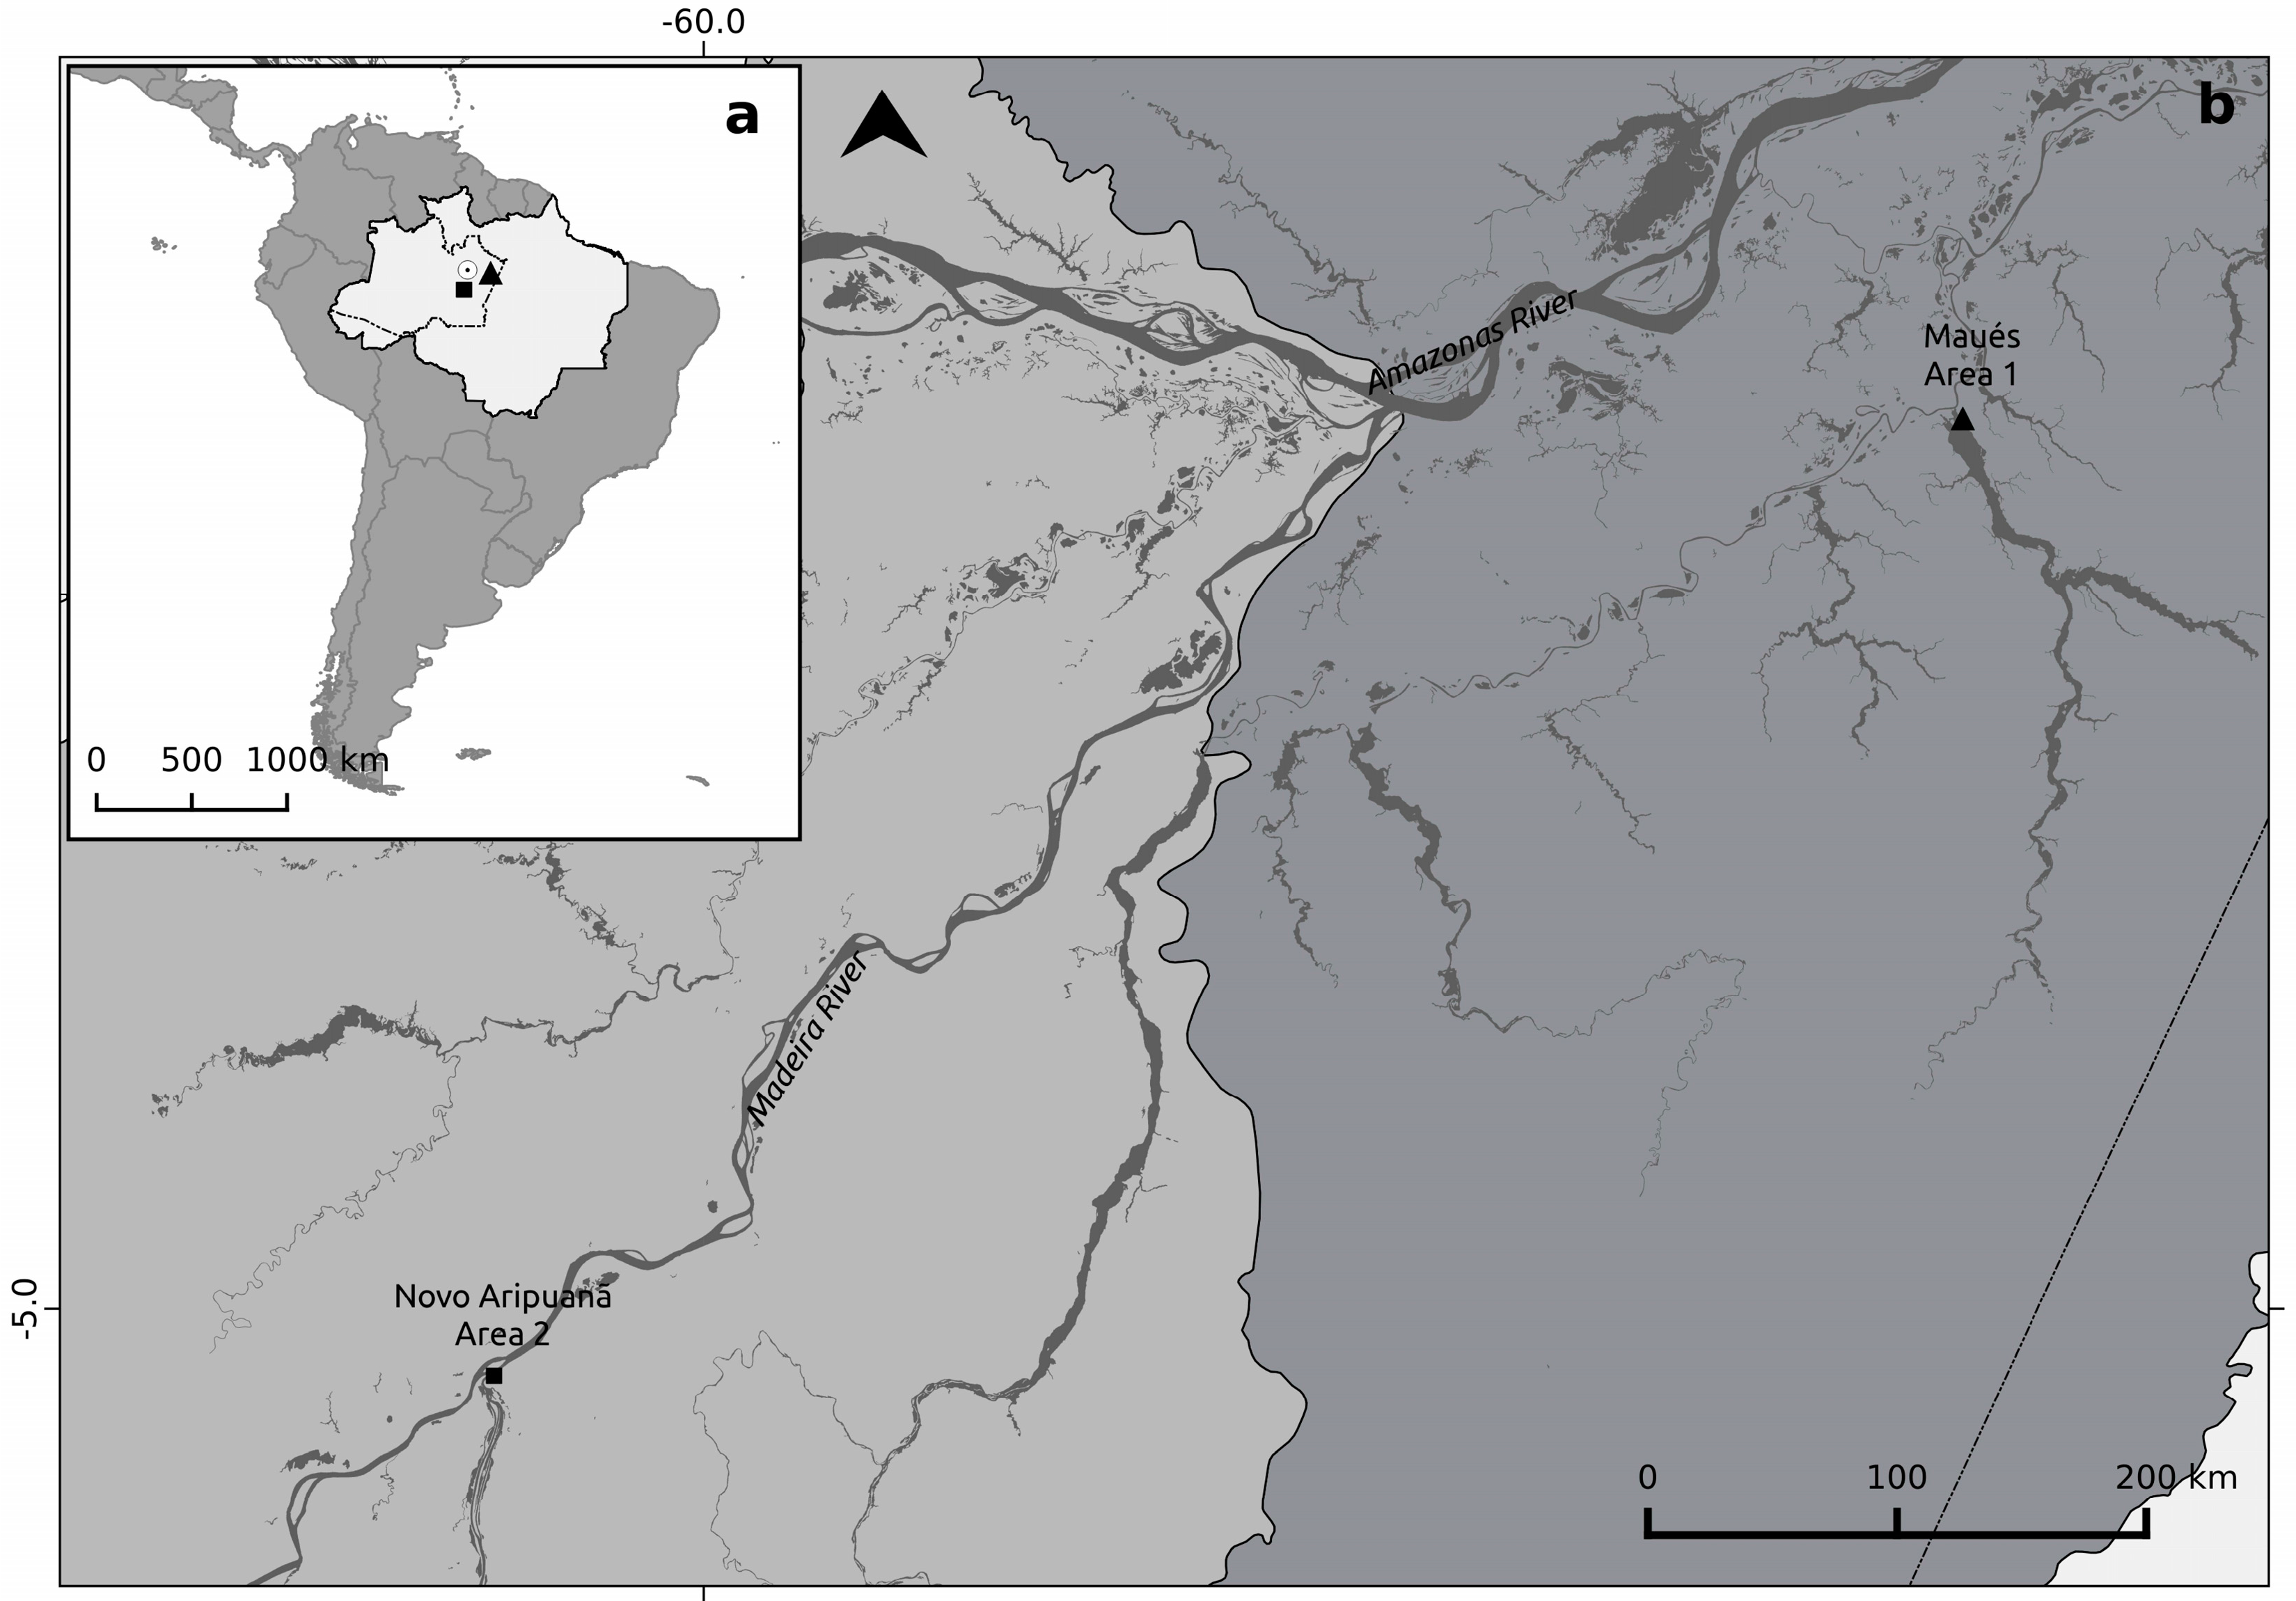
2.1. Study Sites Descripions

The study was conducted in three areas: One located in municipality of Novo Aripuanã (17-year-old culture—C17), and the other two in the municipality of Maués (10 and 12 year old culture—C10 and C12, respectively), both in the state of Amazonas, Brazil (Figure 1), Central Amazonia [44]. The climate of Novo Aripuanã is also classified as type Af, hot and humid according to Küppen-Geiger, with an annual average rainfall of 2444 mm and an annual mean temperature of 26.9 °C [45,46] The soils of the region are predominantly classified as yellow poor oxisols saturated by oxidized iron and aluminum with low pH [47]. The climate in Maués is hot and humid, with regular and abundant rainfall (annual rainfall of 2101 mm) and an annual mean temperature of 27.2 °C. Following Köppen-Geiger, the climate is type Amazonia Af. The soil under rosewood plantations is classified as dystrophic yellow red latosol [16].
In Novo Aripuanã the original forest was removed via slash-and-burn then lines were opened in subsequent natural regeneration for the planting of rosewood seedlings. Seedlings were grown from seeds collected from natural populations in the middle Madeira interfluve. After one year in the nursery seedlings were taken to the field and planted within the naturally regenerating vegetation. Annual removal of the non-rosewood vegetation from the planting line was carried out until the eighth year and again after the 15th year At Maués, in the 1950’s, the native forest vegetation of the region was slash-burned to make way for commercial cultivation of guarana (Paullinia cupana Kunth, Sapindaceae), using conventional farming methods. In the 1970s, these plantations were converted to pastures of Brachiaria (Train.) Griseb (Poaceae). Rosewood cultivation began in the 1990s. Seedlings were grown from seeds collected from a variety of different natural populations near to the planned plantations. Once the seedlings were established in the field, management began. This consisted of an annual removal by mowing of regenerated understory vegetation within the rosewood plantations. New areas for planting rosewood were prepared by cutting and burning the existing vegetation, a method practiced widely within the Amazon basin [48] (see Table A1 for more details about study sites).

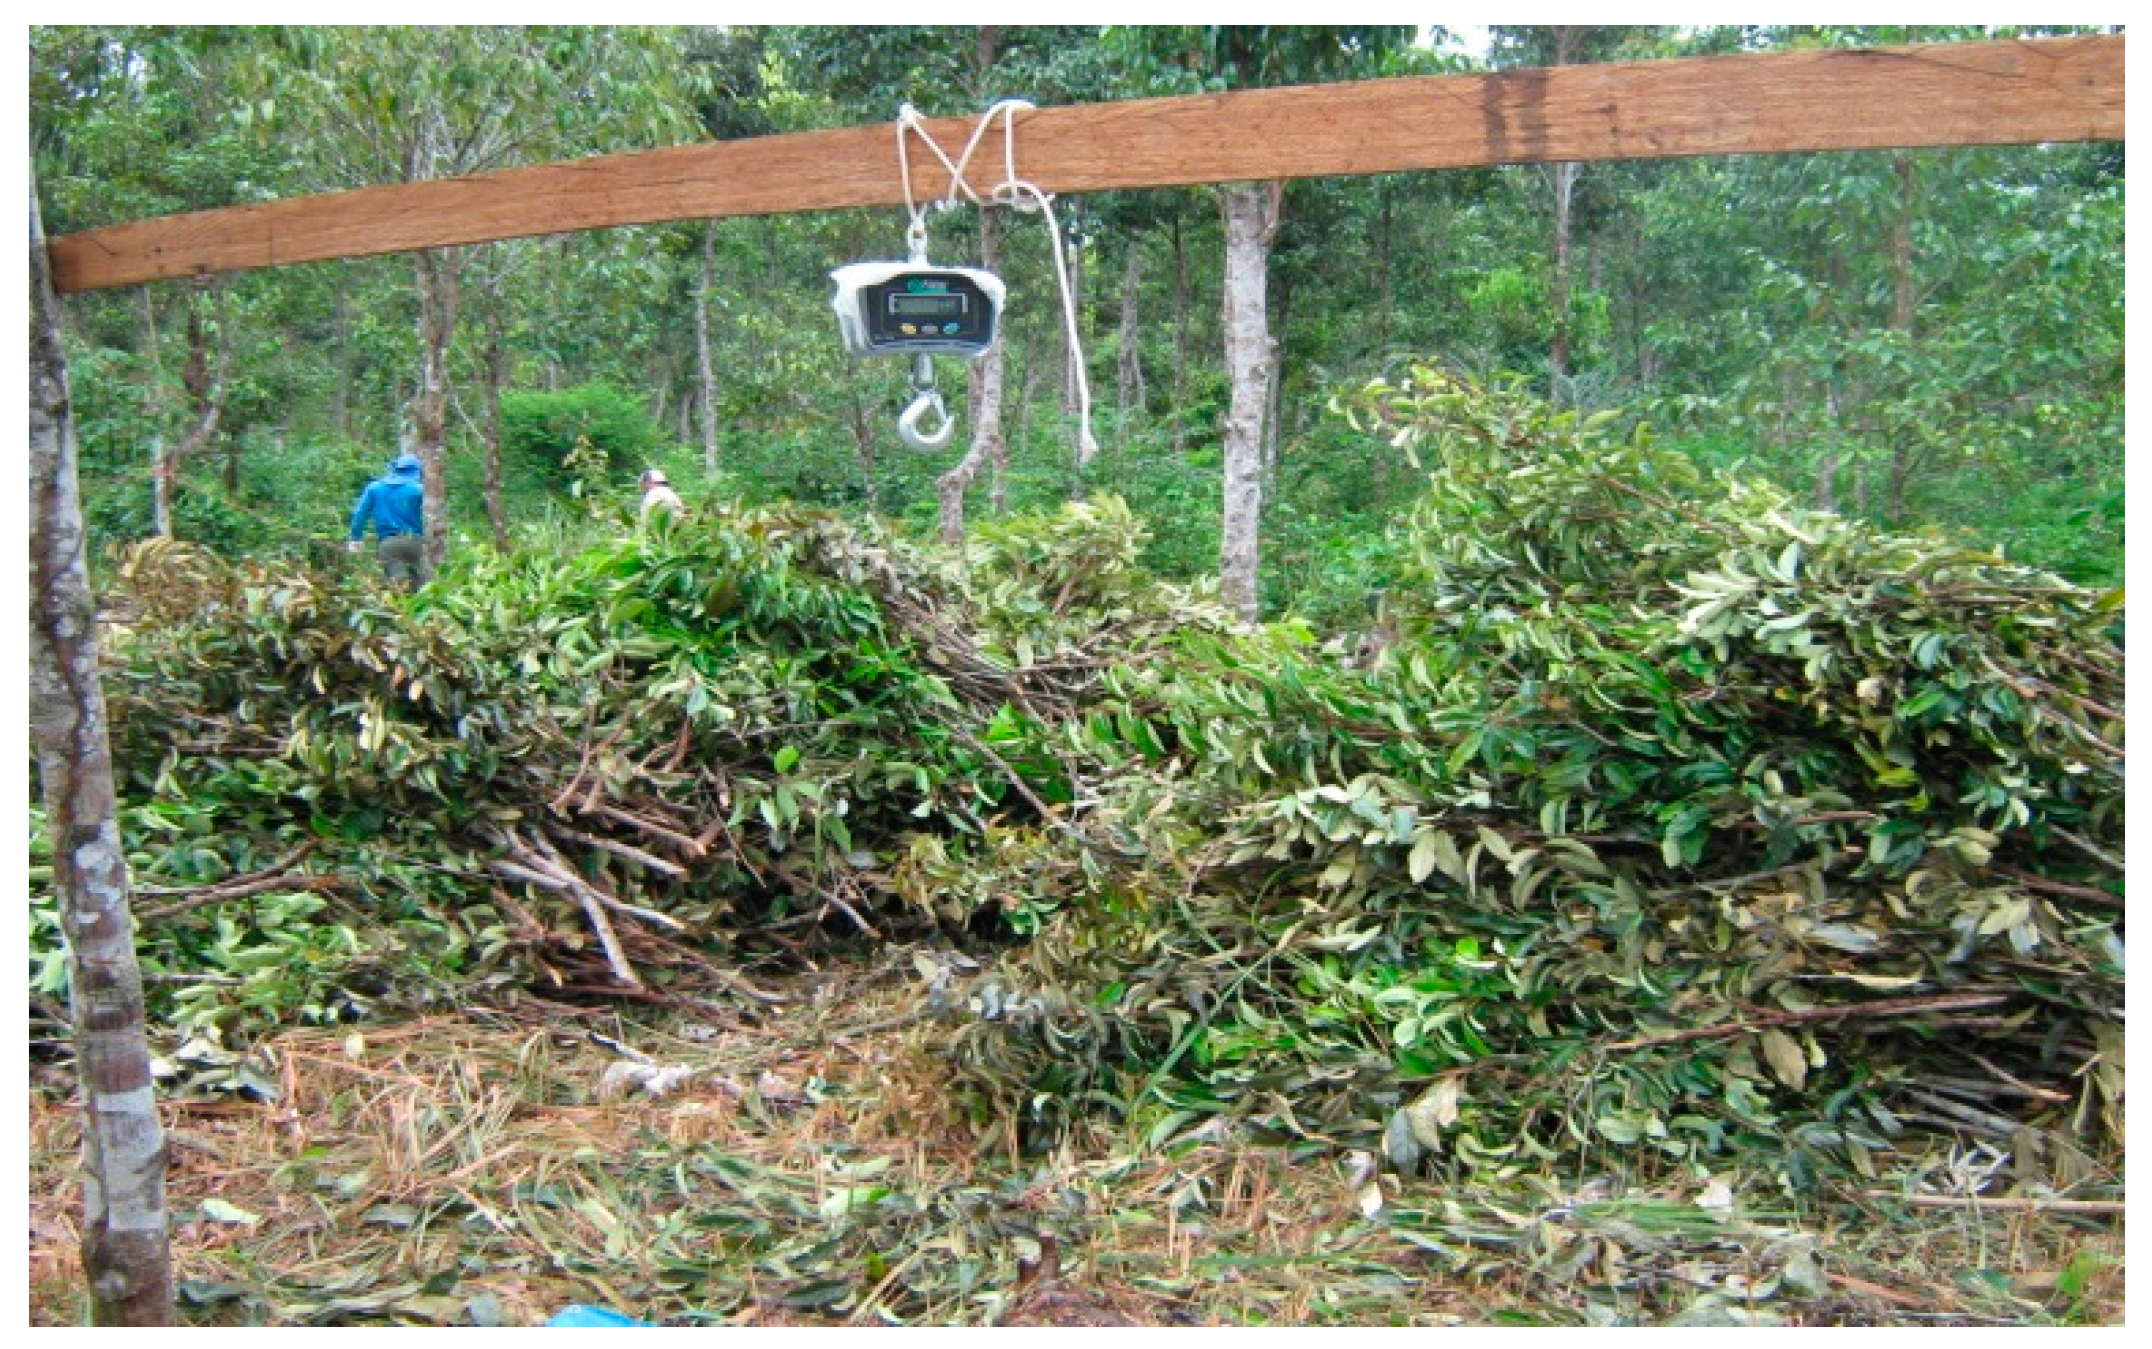
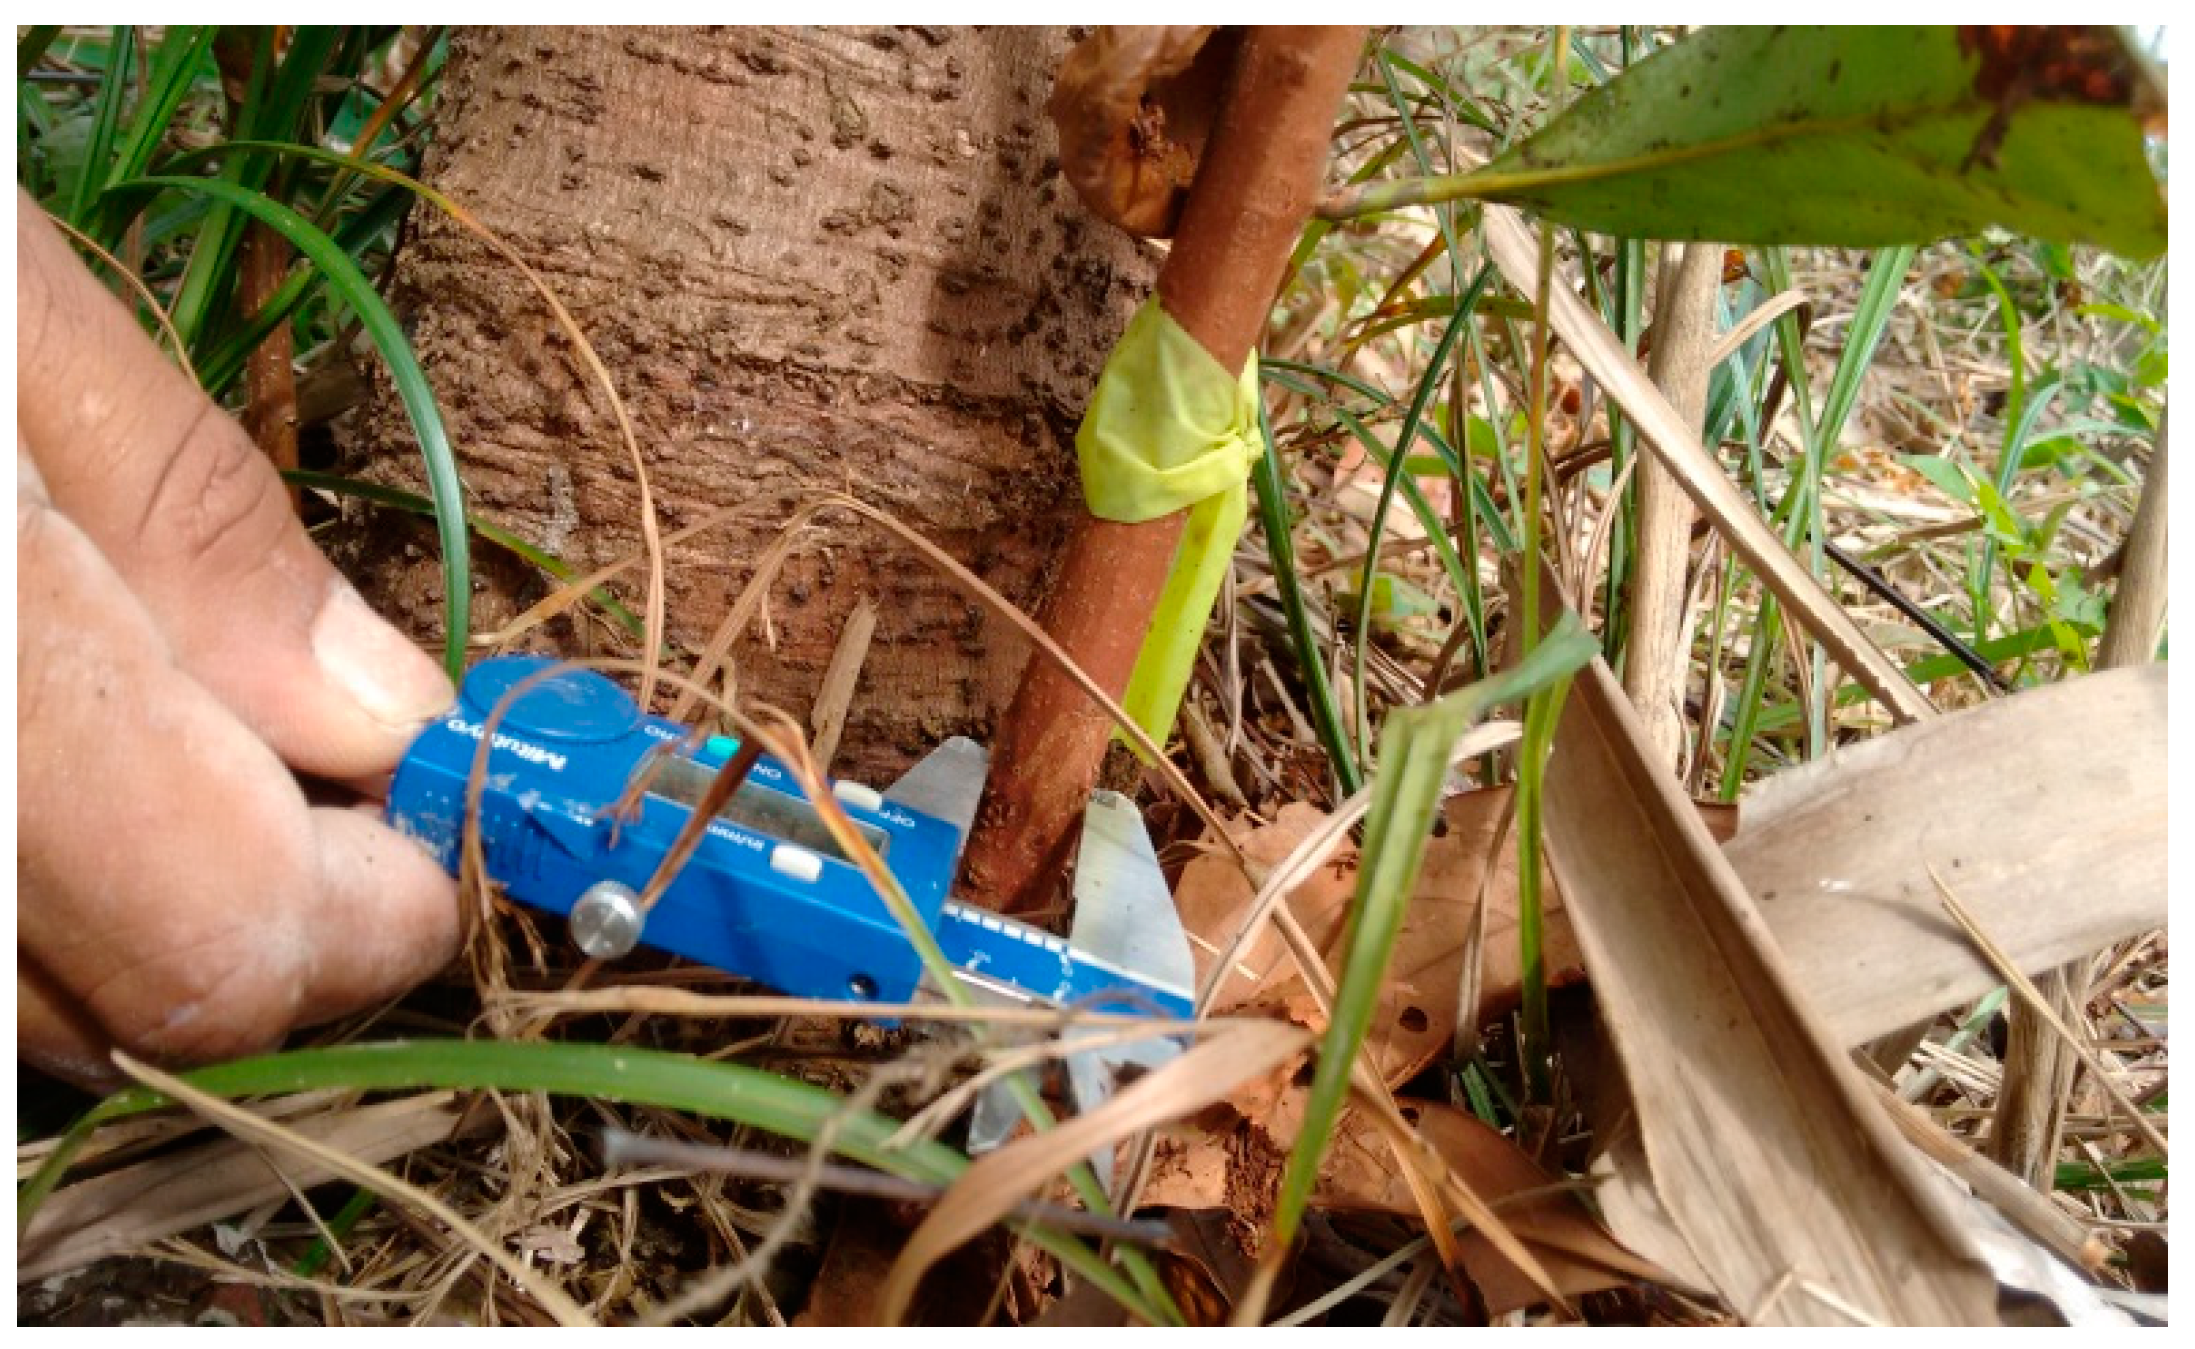
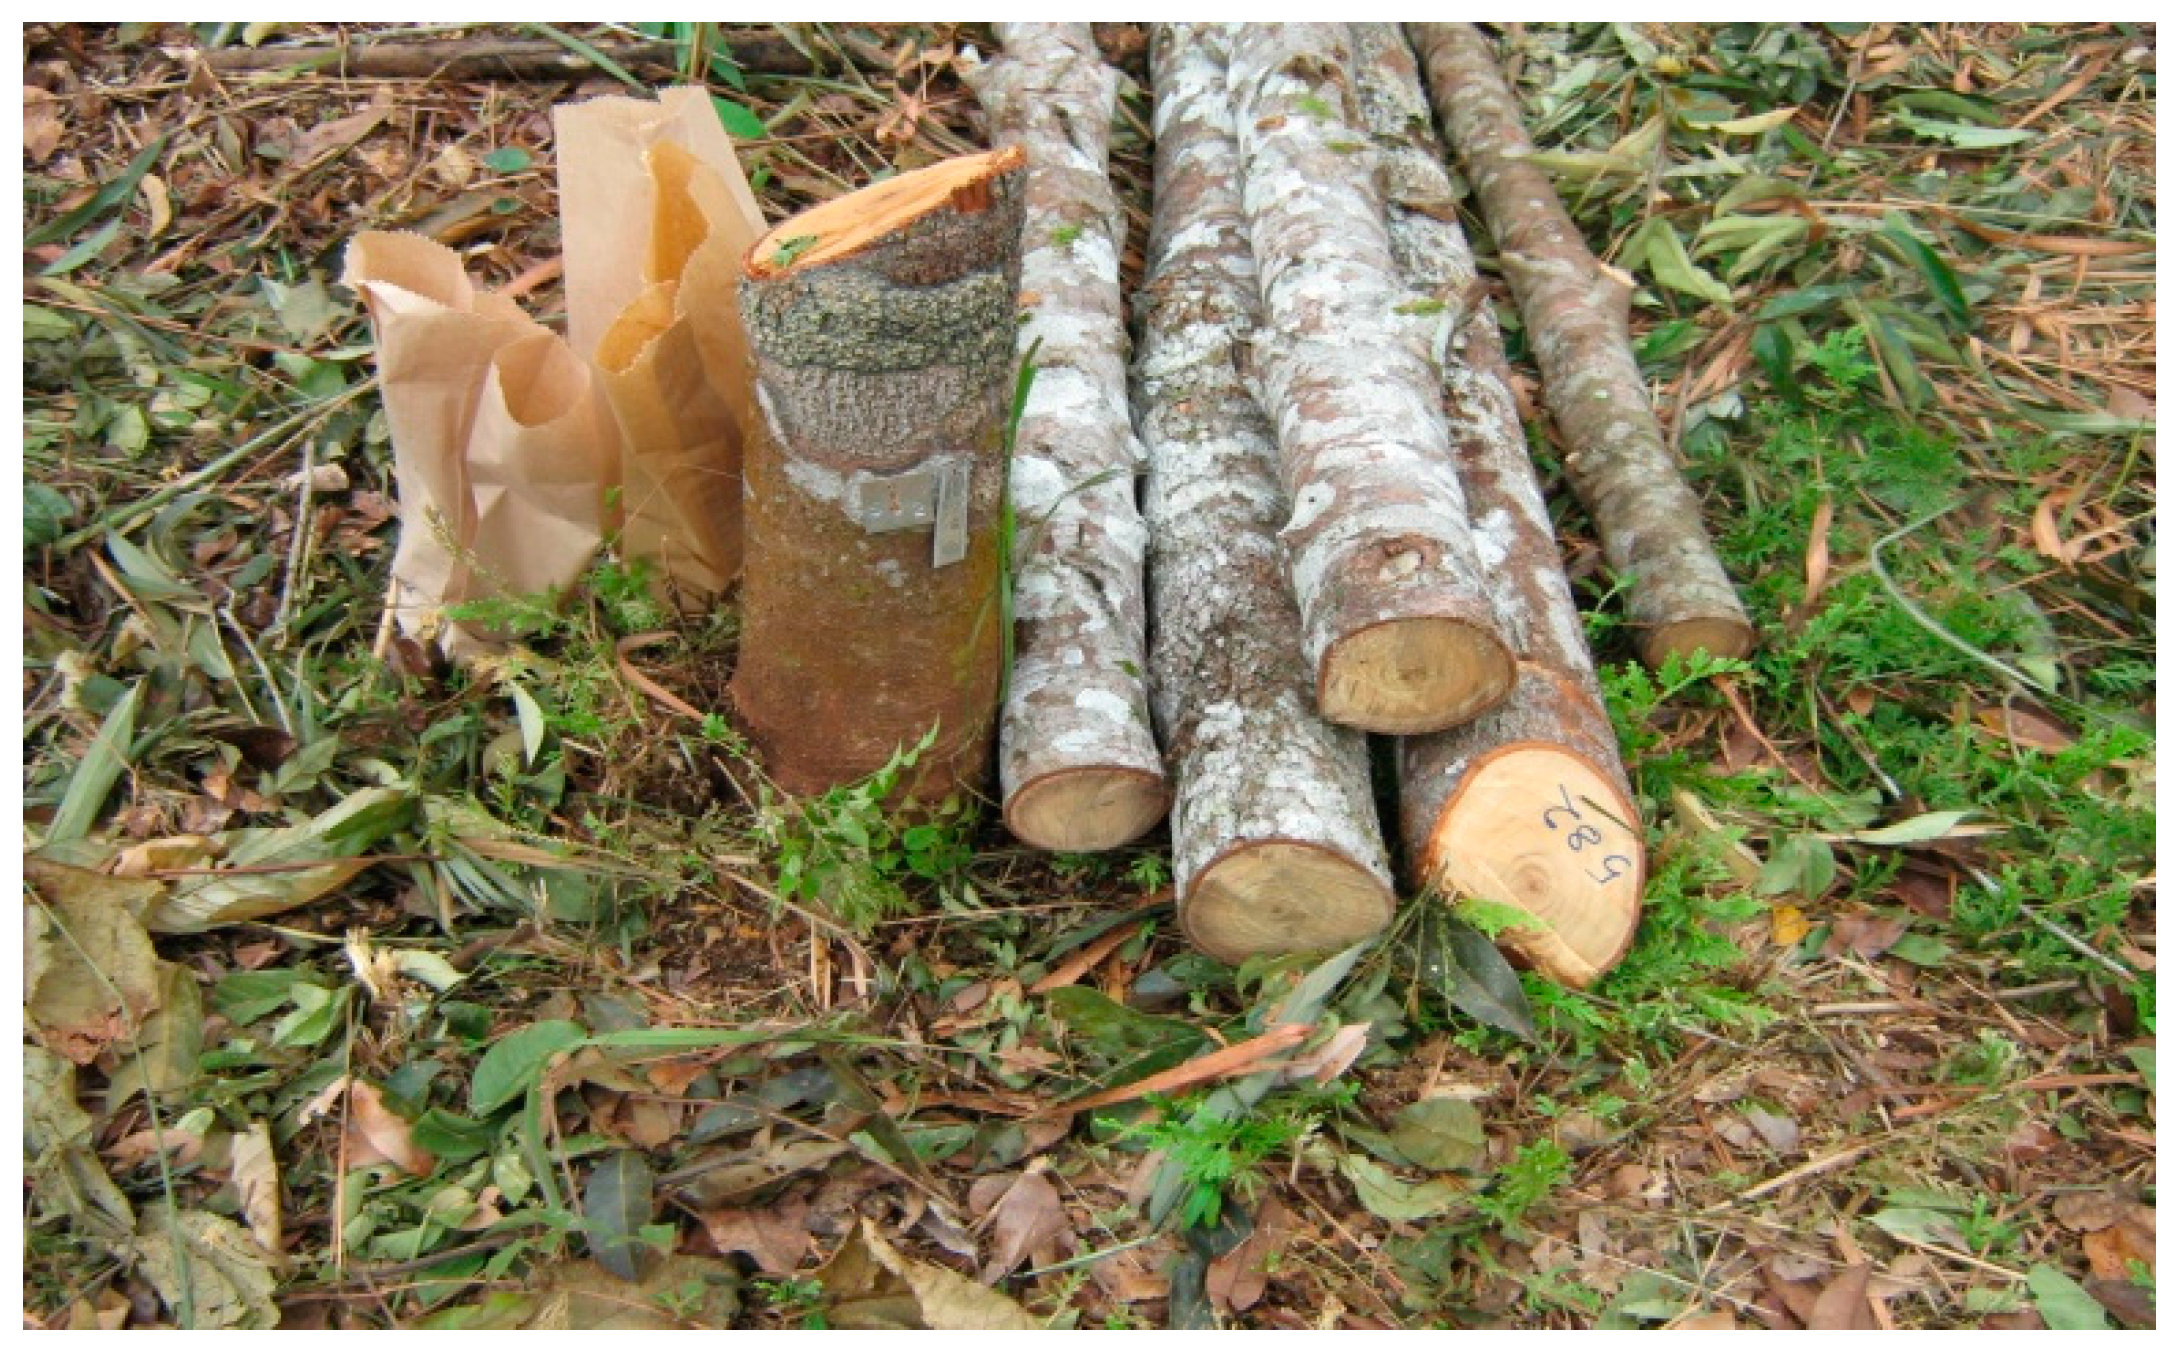
2.2. Field Sampling and Laboratory Methods

The first field measurements were performed in February and June 2015 in Maués and Novo Aripuanã, respectively. To avoid edge-effects, harvesting occurred in eight adjacent subplots within each planting. Each subplot contained six trees (48 trees per planting, a total of 144 trees). Trunks of 108 trees were cut at 50 cm above ground [10,17], and 100% of the leaves and branches removed from the crowns of 12 trees per planting (Figure A12 and Figure A13 respectively ) (a total of 36 trees). Diameter at breast height (DBH—1.30 m above ground), diameter at stump height (DSH), were measured with a diametric tape and the height of the trees (H) using a 50 m track. The fresh trunk and crown masses (branches + leaves) were measured using a 500 kg capacity digital suspension scale (Figure A14. Diameter sampling obtained DBH values between 5.8 and 19 cm, and a frequency histogram of tree DBH followed a normal distribution (as assayed by a Shapiro-Wilk normality test, p = 0.58; Figure A1), presented previously in Krainovic et al. [17].
To measure mass, the trunk of each cut tree was sectioned with a chainsaw, and mass of sawdust and other material were also measured (Figure A15-Left). To determine tree biomass mean water content, discs (3 to 6 cm thick) were taken at 0%, 50% and 100% of the total trunk height (Figure A15-Right) [17,49], along with 4 kg of leaves and branches collected from the four cardinal points in the middle third of the crown. Collected samples were weighed fresh in-field with a precision balance, then transported to the laboratory and oven dried at 65 °C until constant mass was reached. For wood samples the temperature used was 108 °C. Percentage water content was then calculated by comparing weight values for dry and fresh material.
Samples of lateral roots were collected by careful excavation of the first few centimeters of soil adjacent to the base of sample trees (Figure A16-Left and Right). Concentrations of nitrogen (N), phosphorus (P), potassium (K), calcium (Ca), magnesium (Mg), iron (Fe), zinc (Zn) and manganese (Mn) in the tissues of the leaves, stems, trunk and roots were measured. Additionally, concentrations in root tissues of total soluble sugars (TSS) and starch were assayed.
N was determined by sulfuric digestion (H2SO4 + H2O2) by the Kjeldahl method. P was assayed using the ammonium molybdate method and measured calorimetrically with a spectrophotometer (Shimizu UV-VIS 1240) at a wavelength of 725 nm [50]. Macronutrients K, Ca and Mg, and the micronutrients Mn, Fe and Zn were extracted by nitro-perchloric digestion [51] and determined by atomic absorption spectrophotometry (Perkin Elmer 1100B) from extracts with 20-fold dilutions.
Root tissue carbohydrates were extracted using a methodology adapted from Black et al. [52]; 200 mg samples were homogenized in 1 mL of 80% (v/v) ethyl alcohol and incubated at 75 °C for 30 min, then centrifuged at 10,000 rpm for five minutes at 10 °C. This procedure was repeated two more times. After extraction, supernatants and precipitate were oven dried at 45 °C for 48 h. Residual supernatant was resuspended in 1 mL distilled water for TSS analysis. Starch was extracted from 50 mg of precipitate, to which 1 mL of 35% (v/v) perchloric acid was added for 15 min at room temperature (24 ± 3 °C), with samples then centrifuged at 10,000 rpm for five minutes. Soluble sugars and starch were quantified at 490 nm with a Biosystems Spectrum SP-2000 UV spectrophotometer, using glucose as the standard [53].

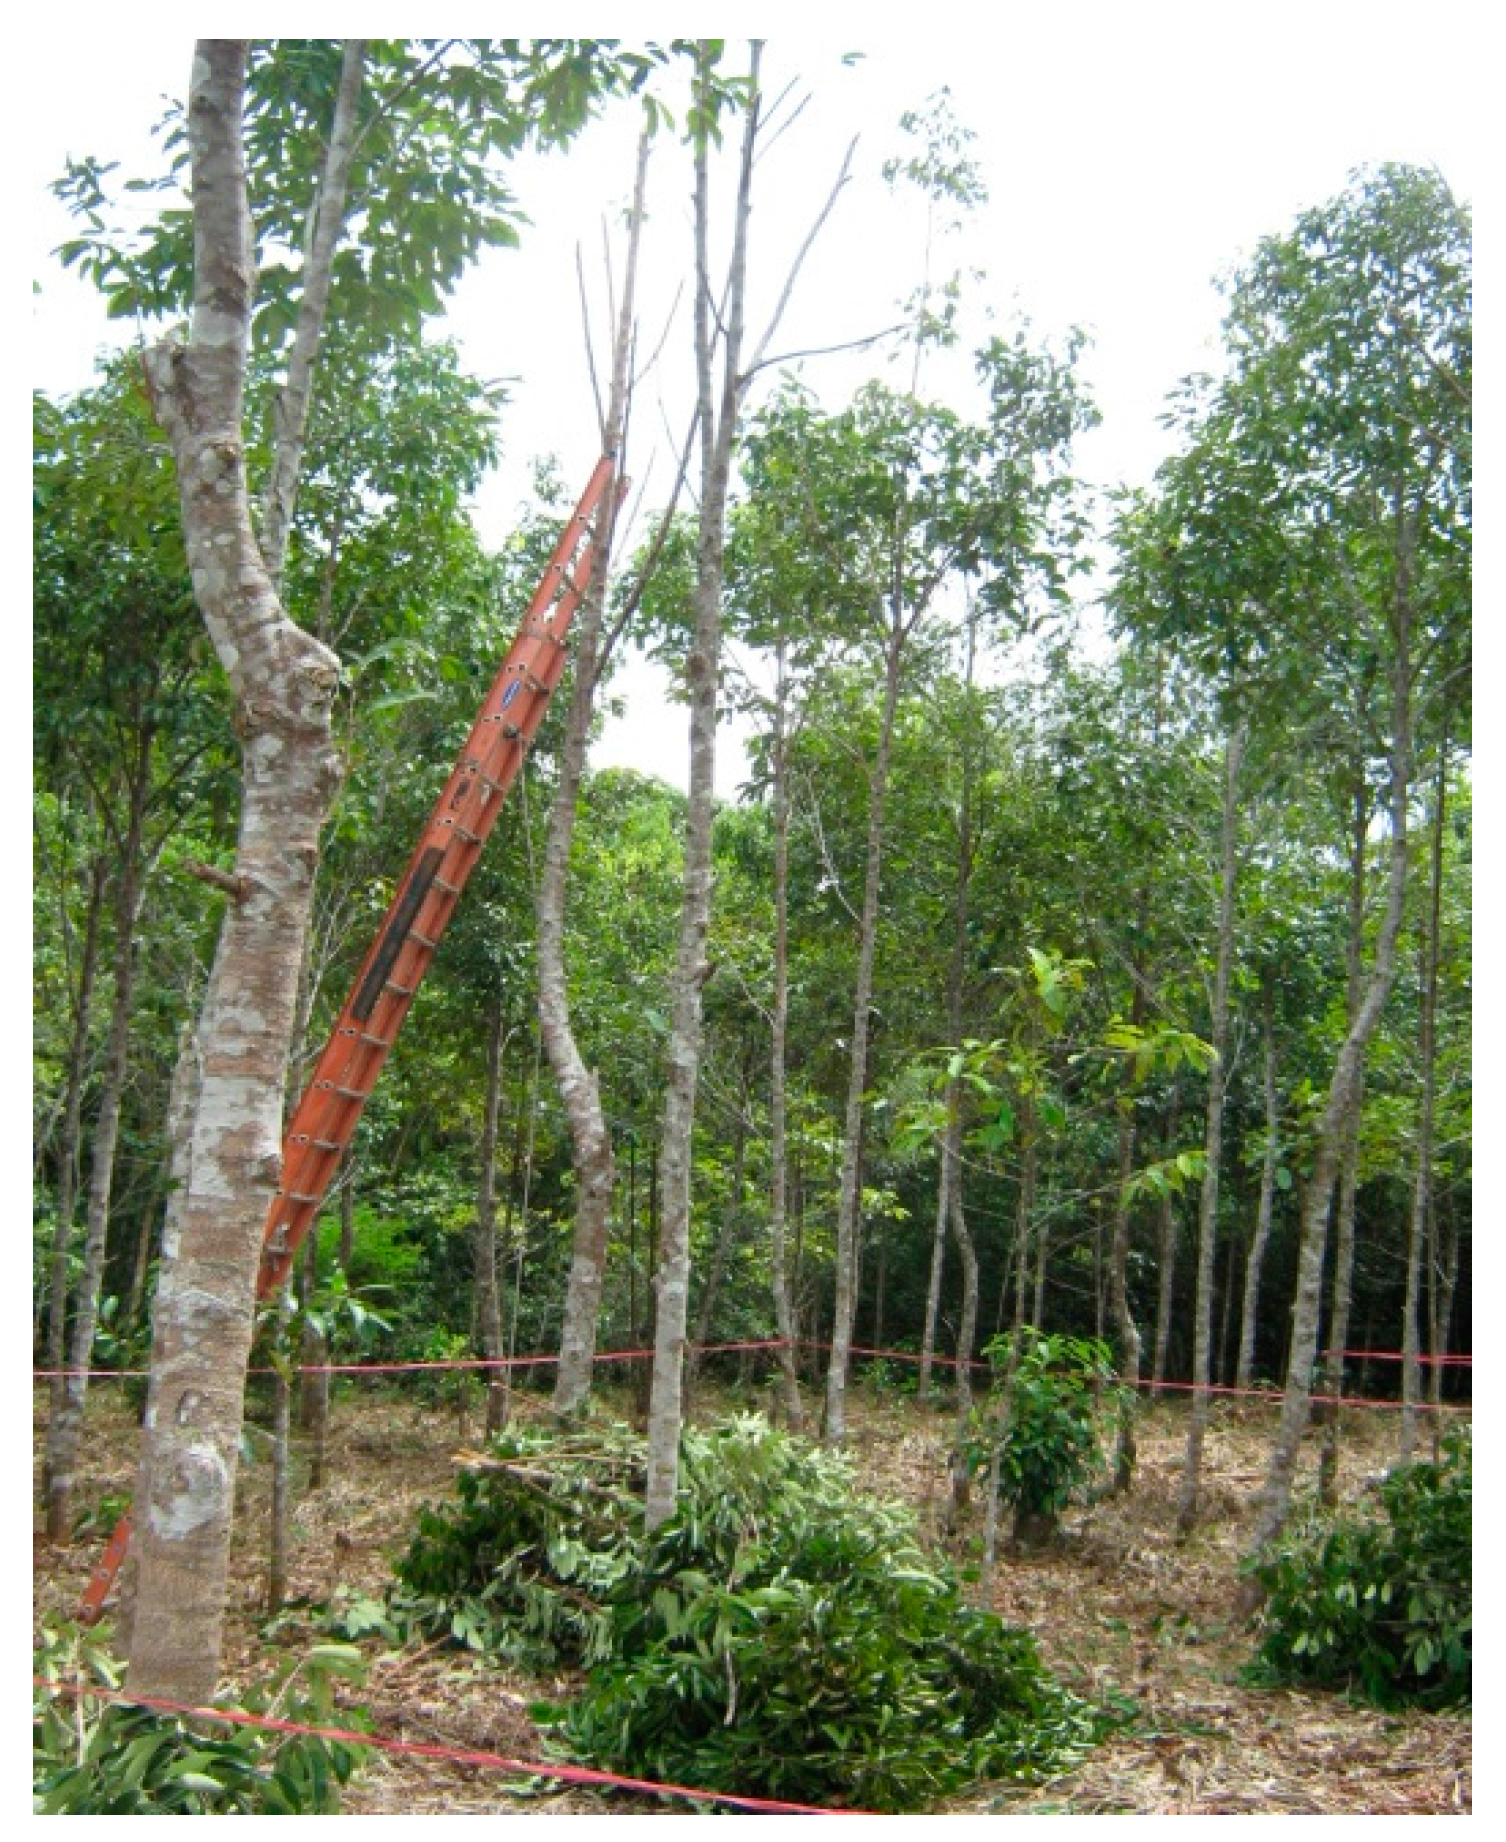
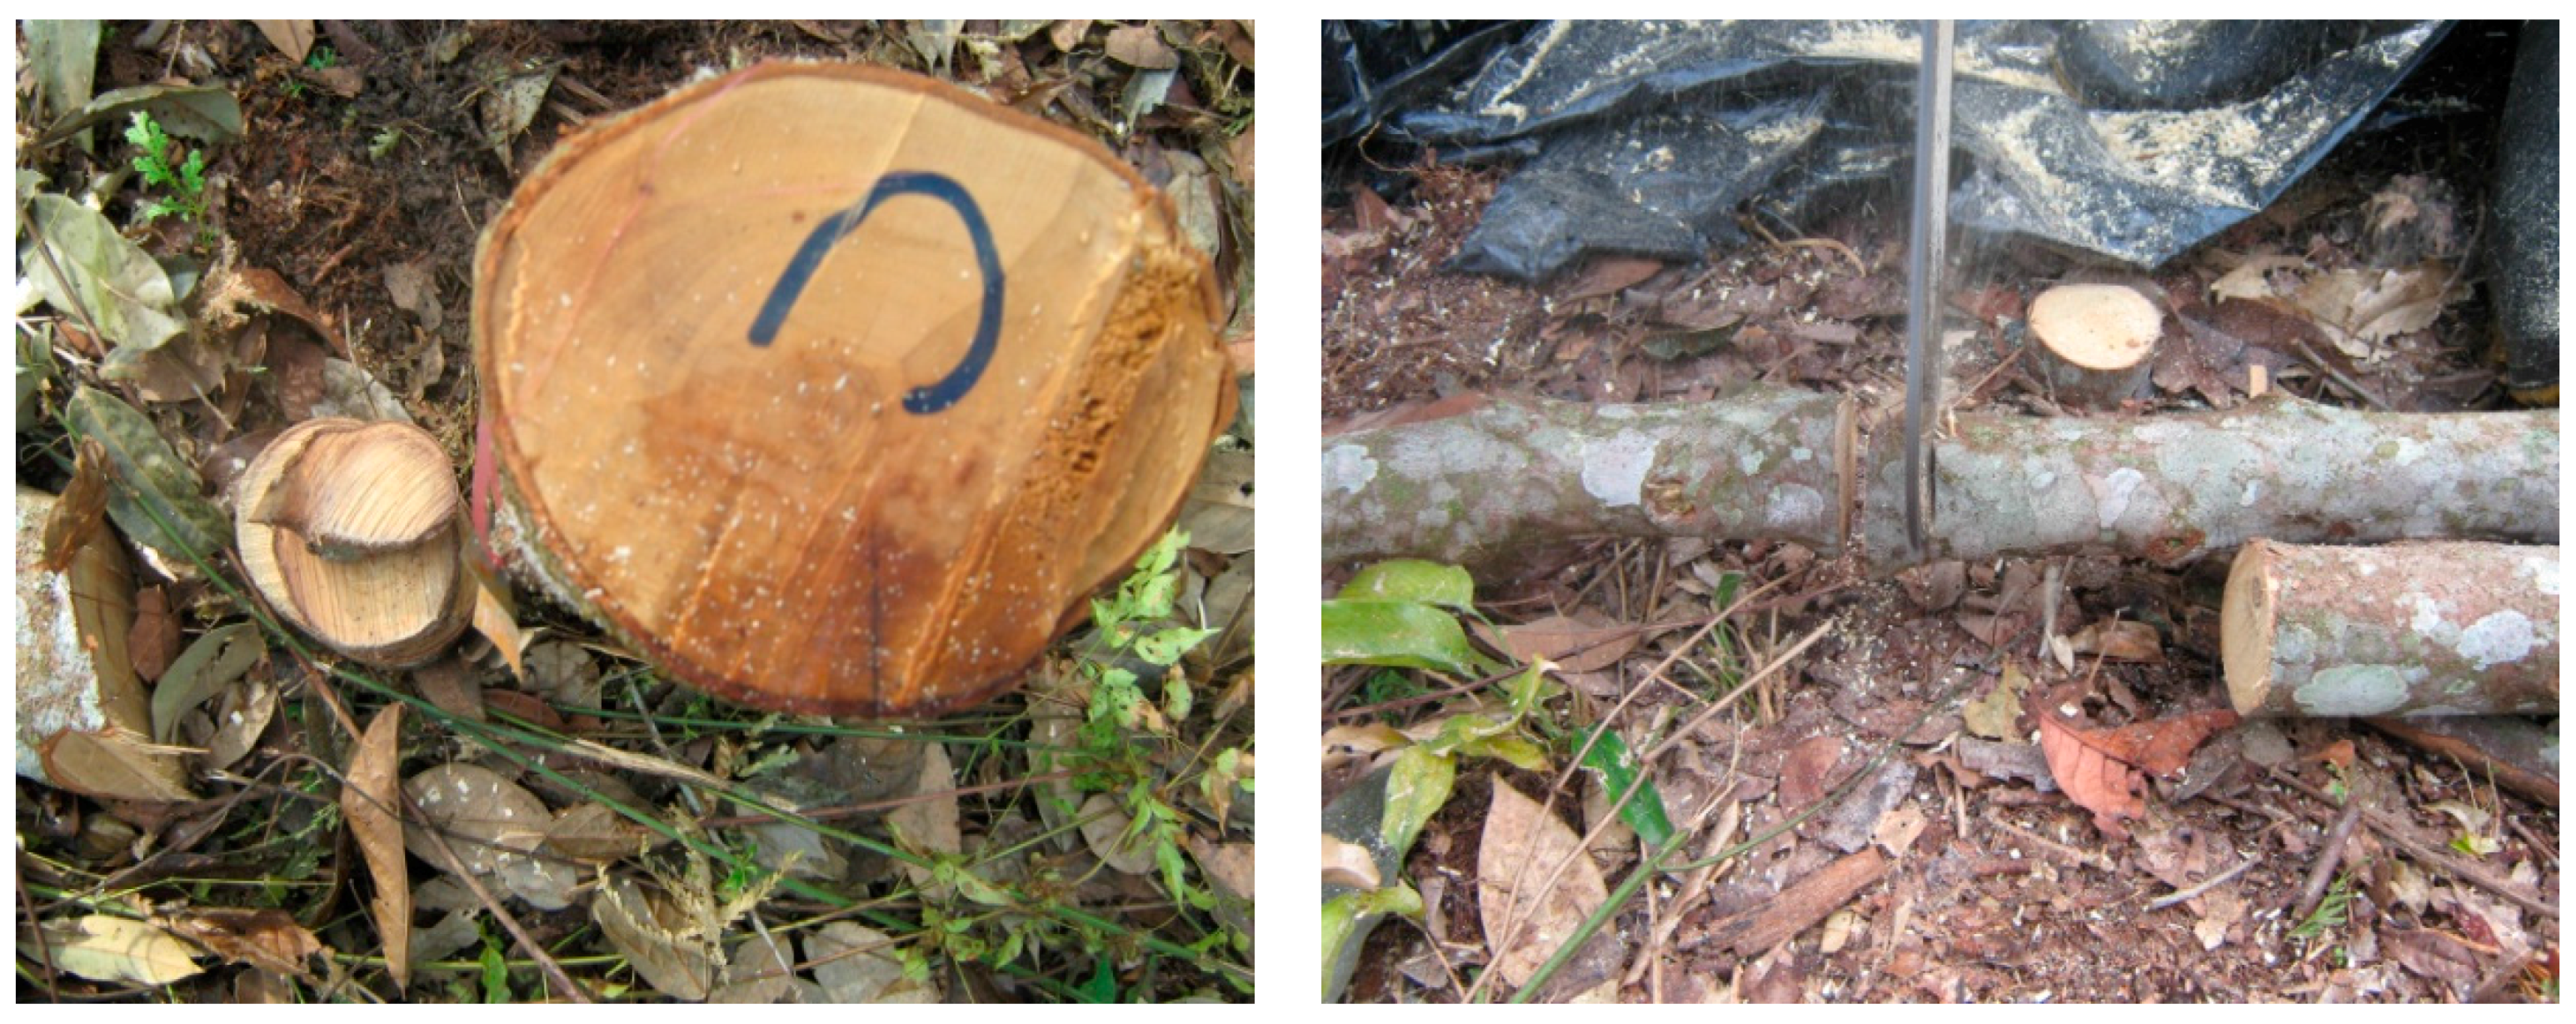
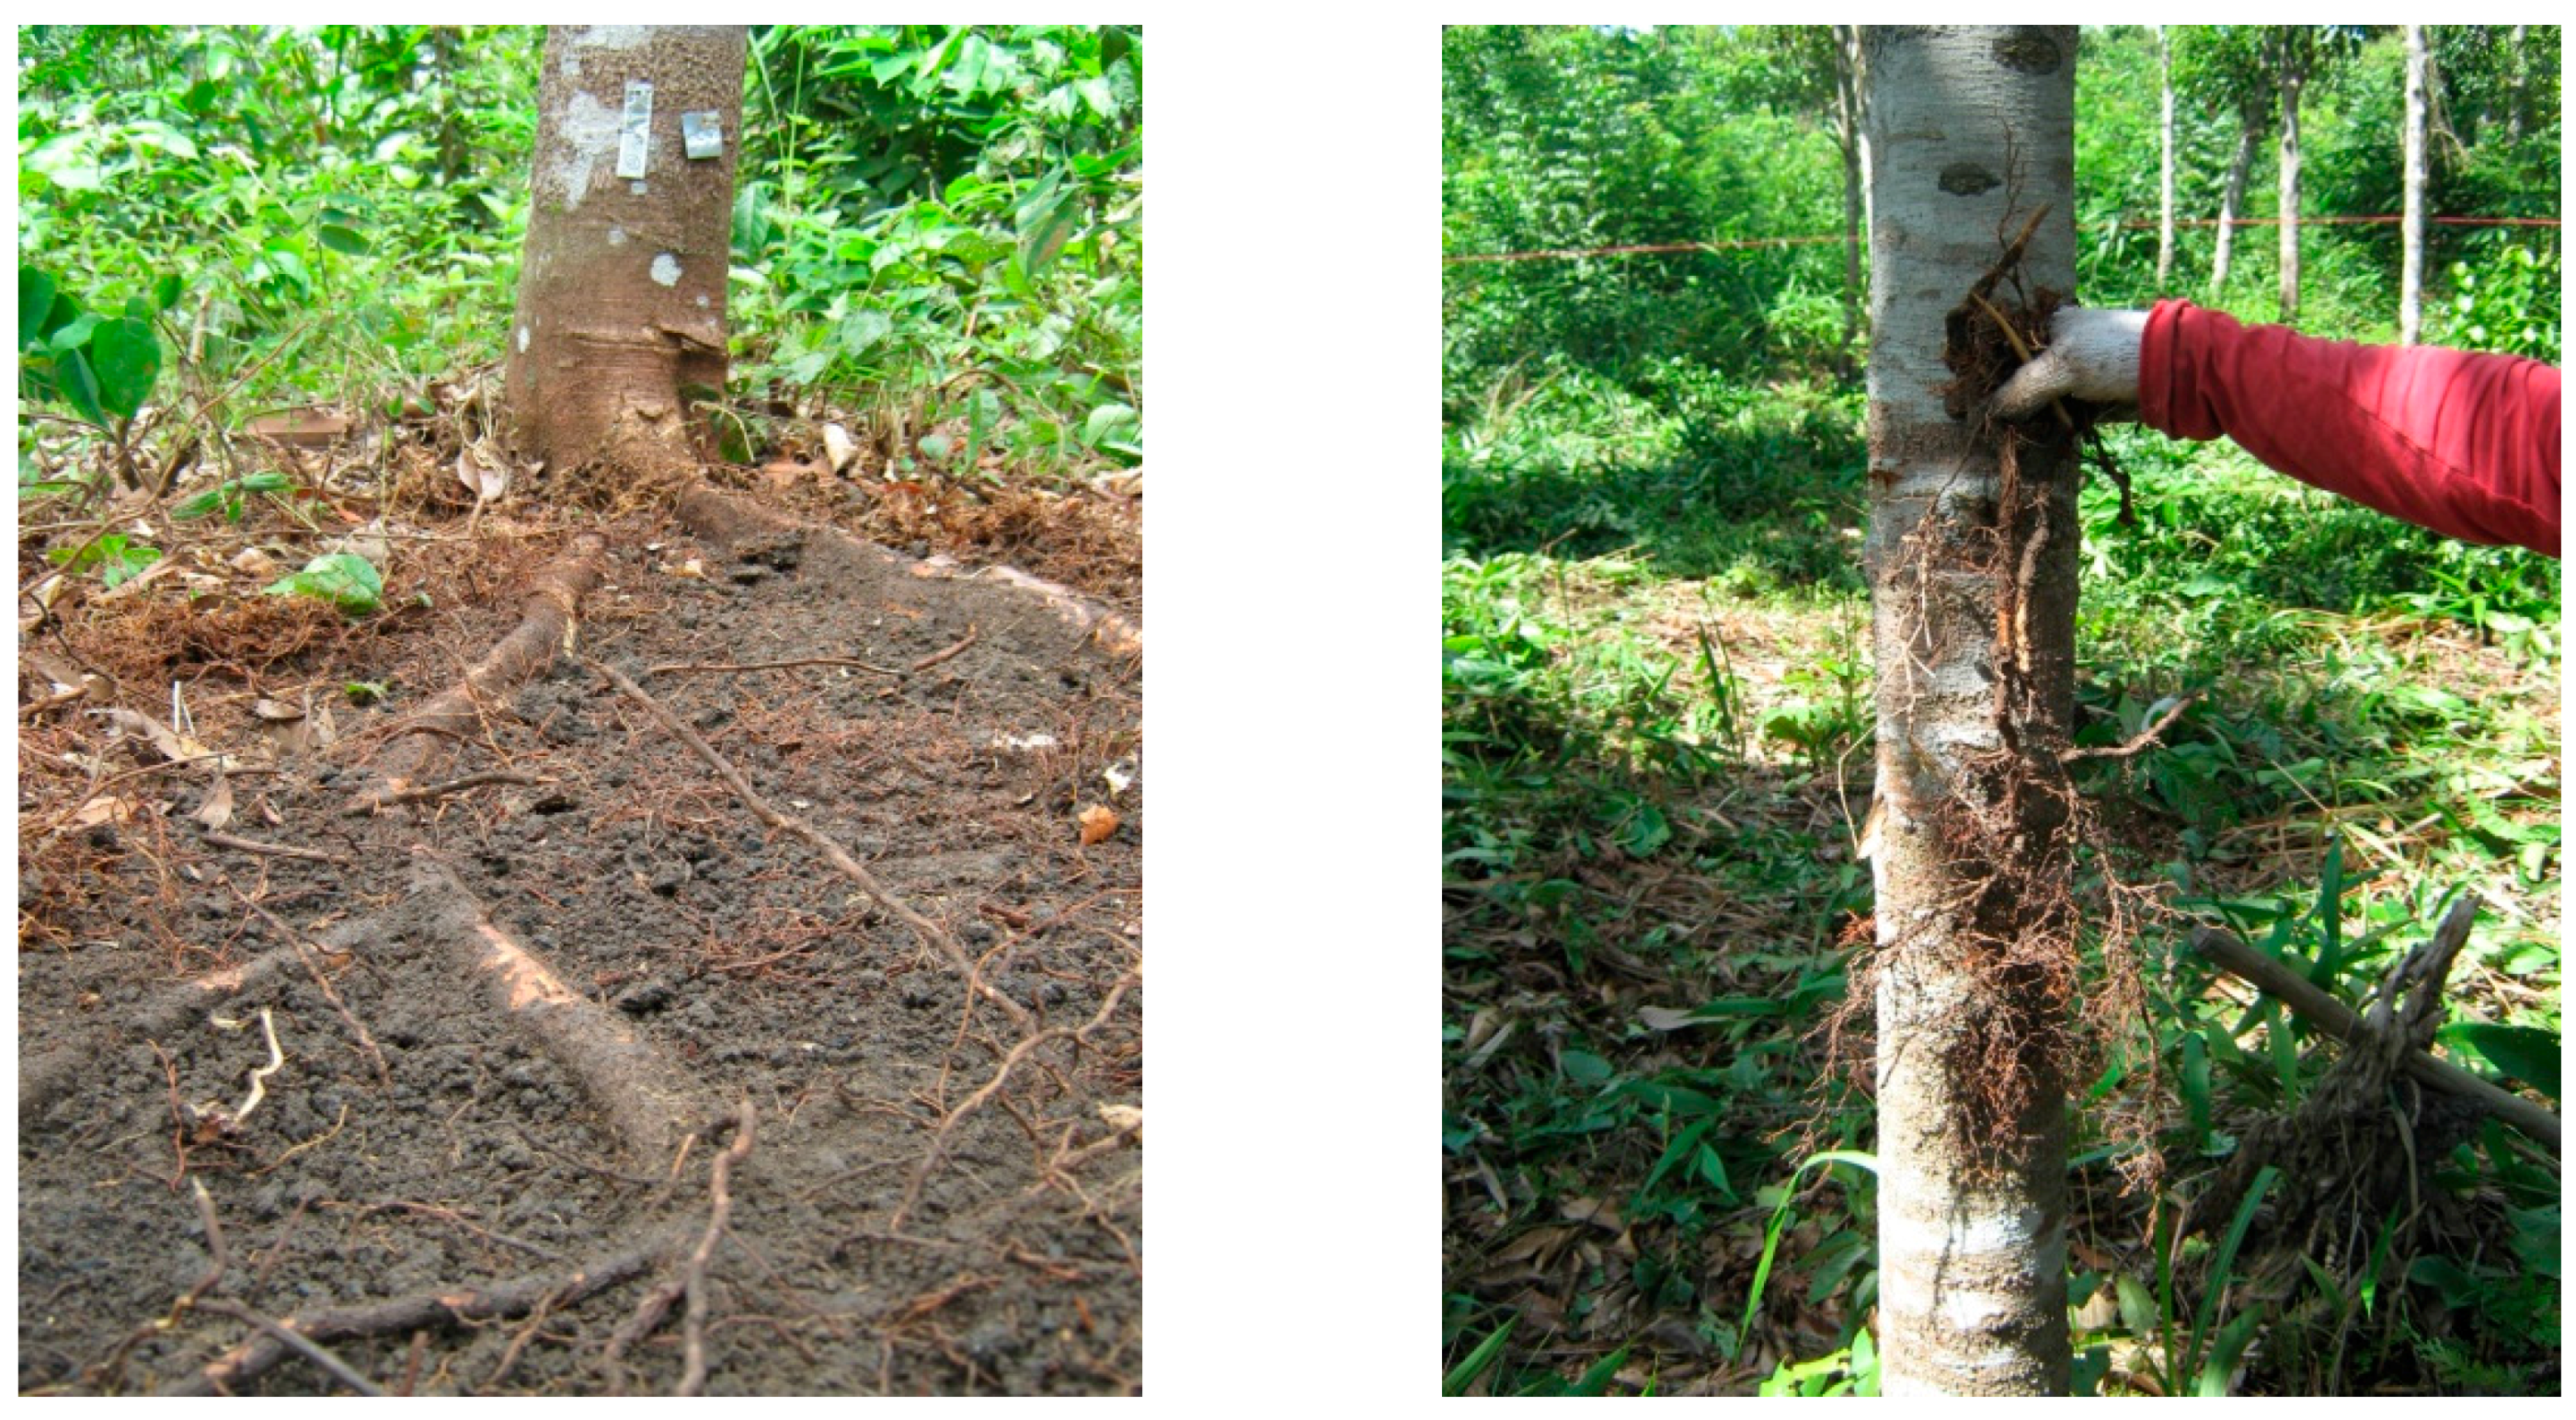
2.3. Management of Sprouted Above-Ground Biomass

Monitoring occurred six months after harvesting, when regrowth measurement and management was undertaken. At that time, a ground fire occurred at the Novo Aripuanã site, making it impossible to evaluate regrowth. At the two sites in Maués mortality of managed trees, number of shoots per stump and the diameter and height of shoots were measured. Diameter of each shoot was measured at its base using digital calipers (Figure A17). Shoot height was obtained with a measuring tape run from the base of each shoot to its apex.
There were three regrowth treatments, involving shoot removal that allowed the subsequent development of: (i) two; (ii) three and (iii) all shoots per stump, being 12 individuals in each treatment in each area (total per area = 36). For the management of two or three shoots, removal of all small other shoots occurred. All shoot-related treatments occurred within a single week.
Plants that started to grow back, even if they died later, were considered as possessing an initial capacity to regrow. Those that died before research ended were categorized as having suffered post-regrowth mortality, defined as when all shoots on one individual had died. Regrowth was considered successful when a plant that started post-treatment regrowth survived the entire study period.
At the end of the 12-month sprout monitoring period, all individuals were harvested again, by removing all sprouting shoots and 100% of the crowns. Methods for field measurement of fresh mass, sample collection for moisture determination and measurement of the nutritional chemical attributes were repeated as described above.

2.4. Statistical Methods and Data Analysis

Due to the multivariate nature of the chemical attributes data set, biplot principal component analysis (PCA) was used to characterize the nutritional status of the leaves and shoots before (reference) and after management (regrowth). Concentrations of elements N, P, K, Ca, Mg, Fe, Zn and Mn were the variables used in the PCA. Subsequently, paired means tests were performed using the scores of the first two PCA components. To confirm multivariate statistic results, paired mean tests were run separately for elements. Due to data parameterization, tests of means with PC 1 scores and concentrations of N, K, Mg and Zn were done via a paired t-test, while for tests using PC 2 scores and concentrations of P, Ca, Fe and Mn, paired Wilcoxon tests (non-parametric statistics) were used.
Analyses were complemented with hierarchical grouping analysis, using Euclidean distance as a measure of data dispersal and the Ward method for grouping analysis [54]. To aid the identification of homogeneity associations within groups and heterogeneity between them, results were formatted as a dendrogram [55]. To test the robustness of the generated dendrogram, a correlation coefficient [56] was calculated between resulting groups.
Nutrient stock was calculated as the product of dry mass and the nutrient content of each analyzed sample. Using the proportions required under Brazilian Law [13] between thick branches and thin branches + leaves, the nutrient stock of the crown was calculated as the product of average nutrient concentration of branches and leaves and of crown dry mass. To calculate nutrient export under sequential cutting management (coppice), were used biomass values from trees lacking shoot management (all shoots treatment-control). By quantifying nutrient export under sequential management, the amount of nutrients needed to be replaced through fertilization were simulated, based on the local availability of different nutrients sources.
For the three shoot management treatments, mean periodic increments in shoot diameter and height were calculated. Together with the sum of regrowth dry mass, these were subjected to analysis of variance (ANOVA) and a Tukey test. To identify possible factors influencing the sprouting process, a Pearson correlation matrix containing regrowth variables (total number of shoots, shoot height, shoot diameter and shoot dry mass), and biophysical variables (concentrations of N, P, K, Ca, Mg, Fe, Zn and Mn, starch, and soluble sugars) was tested for pre-management tree characteristics (height, DBH, DSH, dry mass and age). For canopy management, root tissue variables were correlated with post-management harvested dry mass and tree biophysical variables. Dead individuals were not included in the regrowth process analyzes. All analyzes and graphing were conducted using R software (Version 3.4.1, the R foundation for statistical compunting, Vienna, Austria) [57].

3. Results

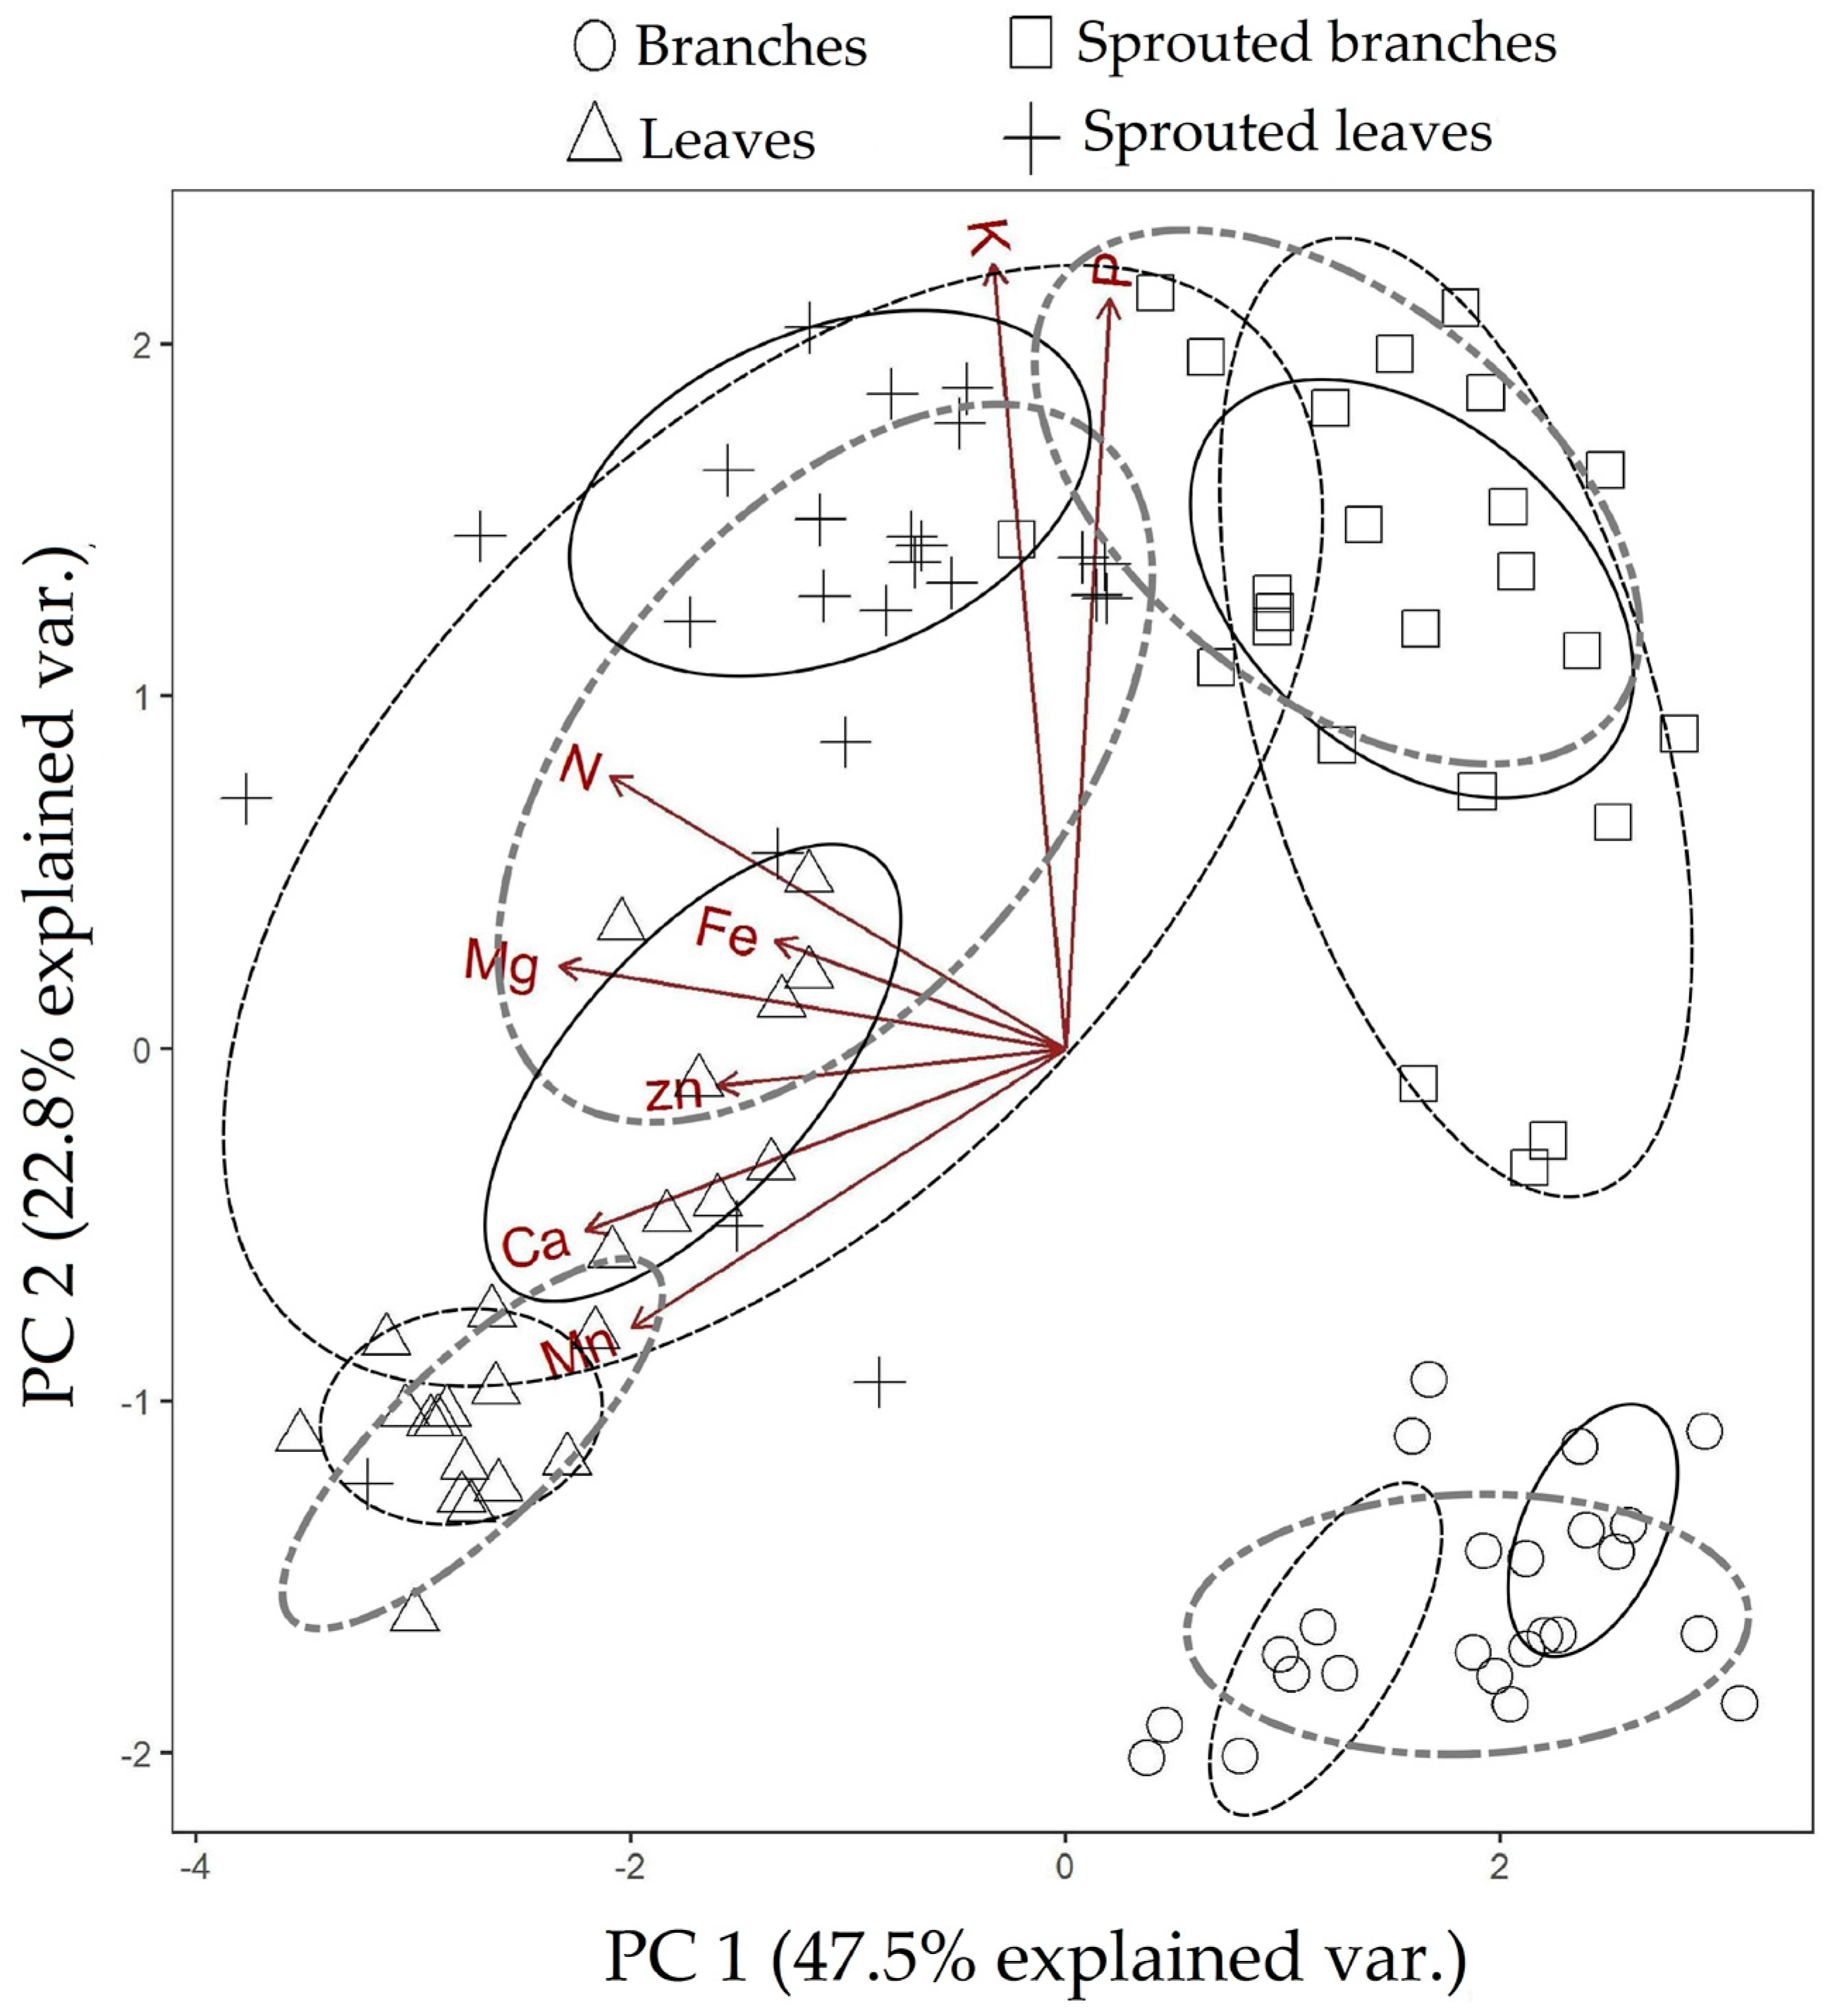
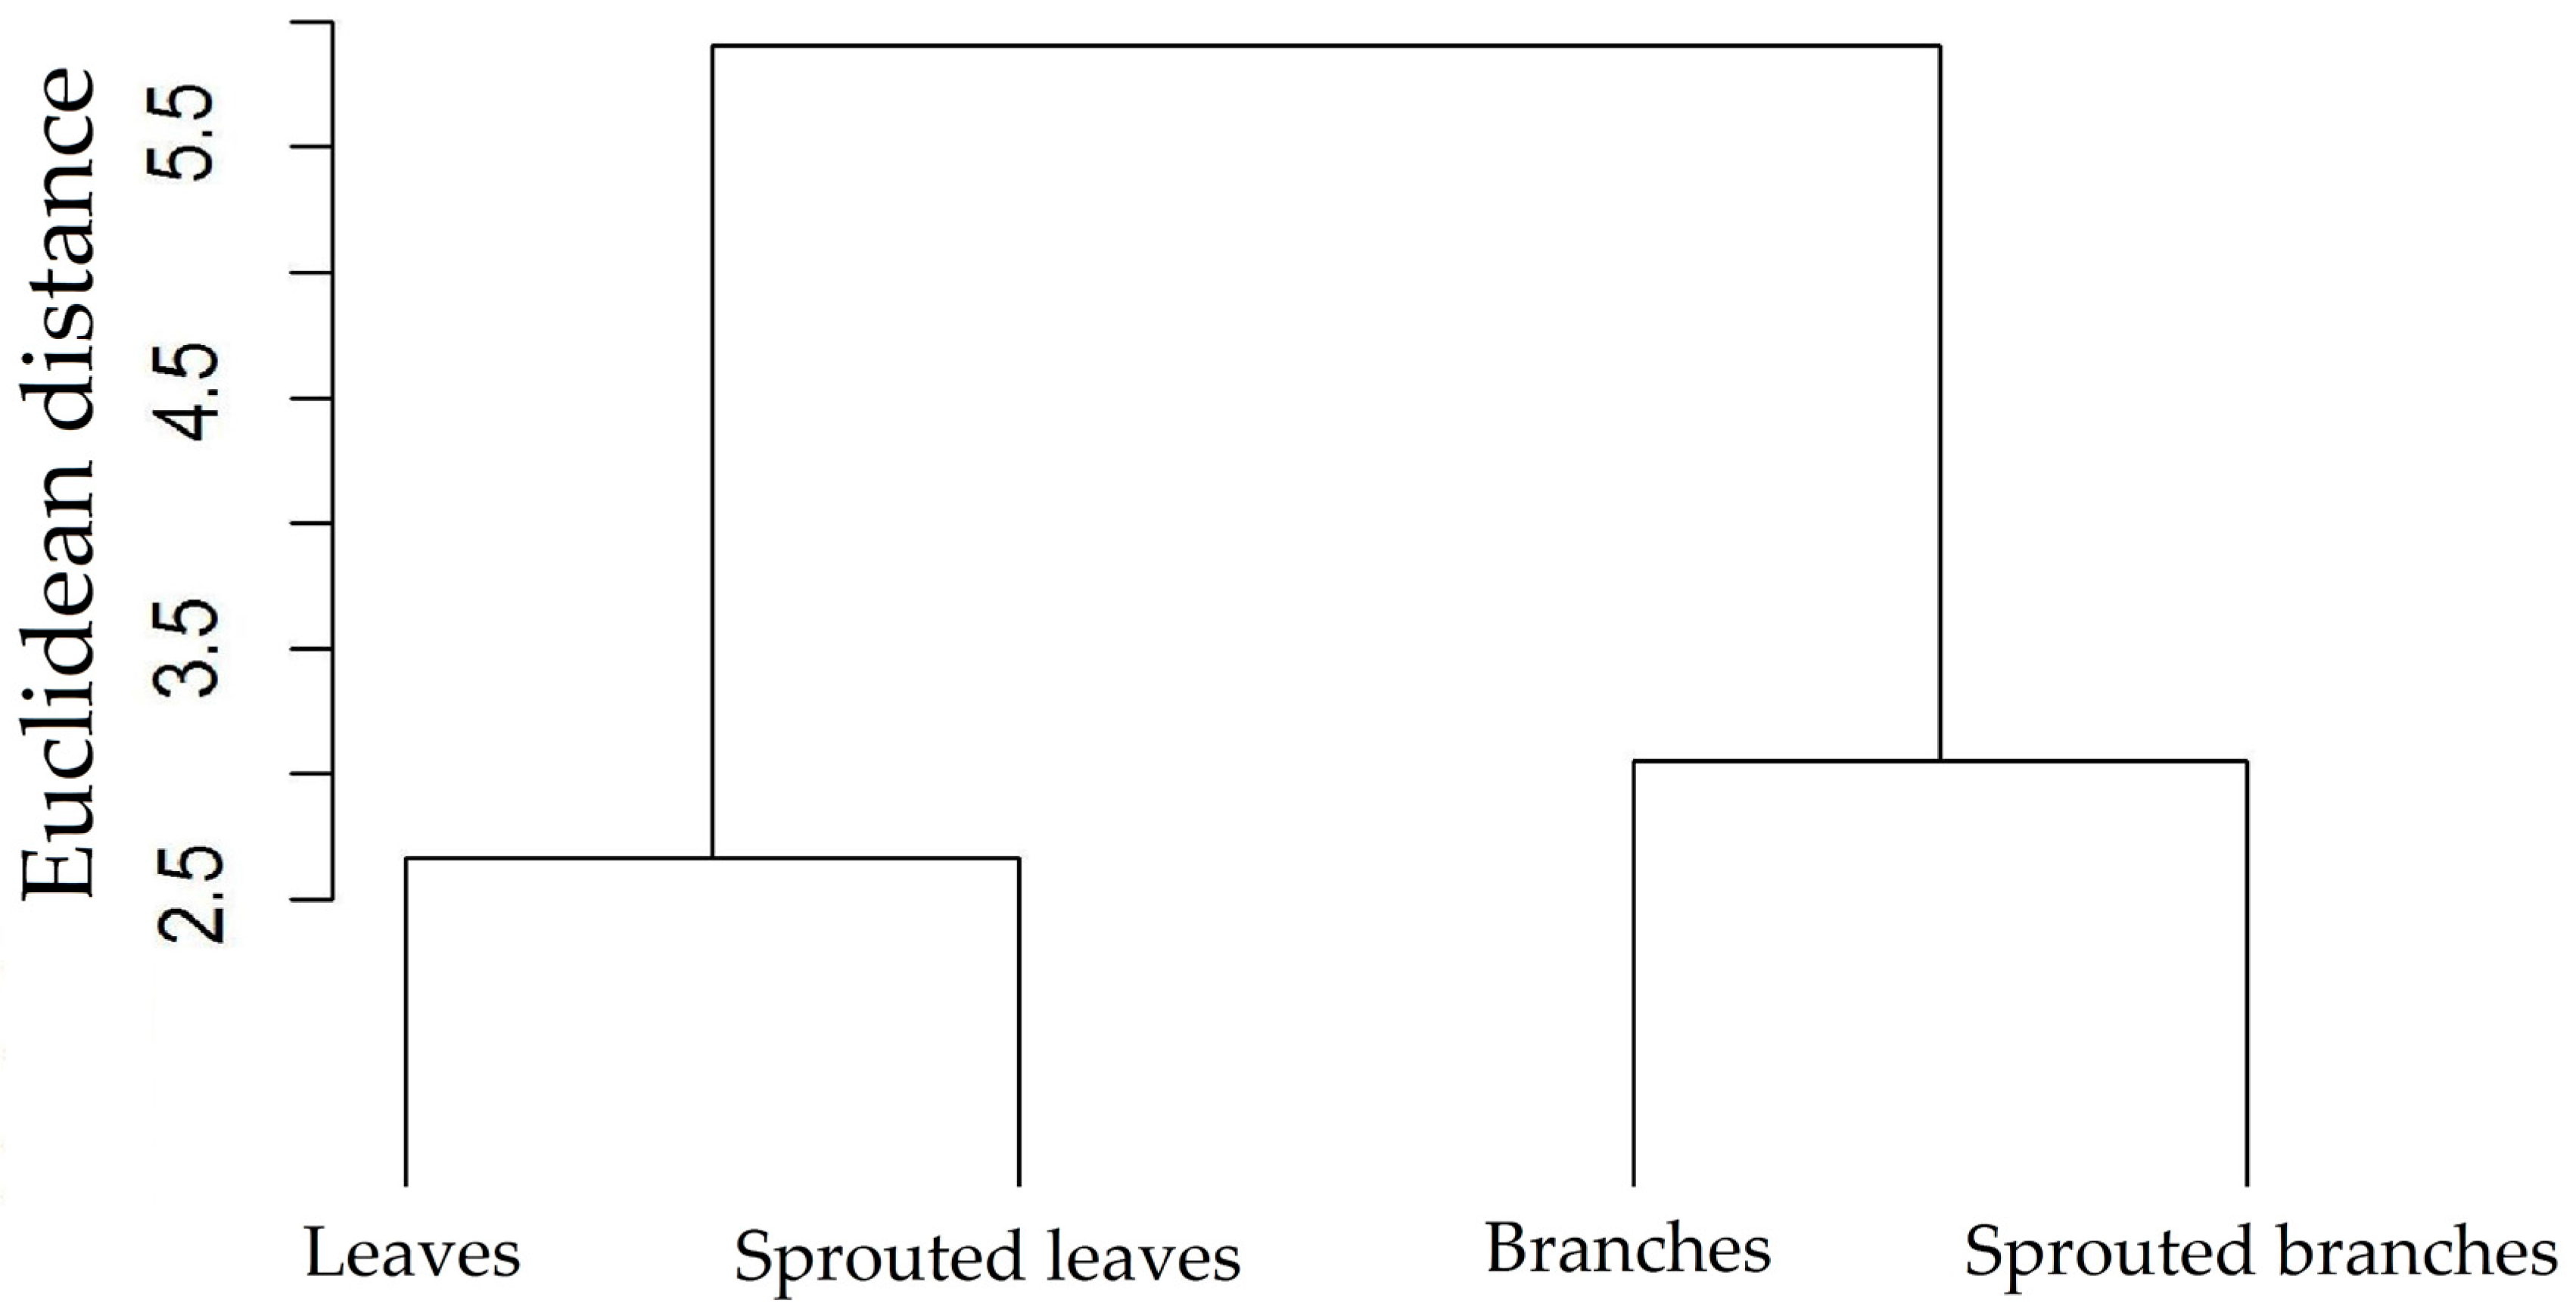
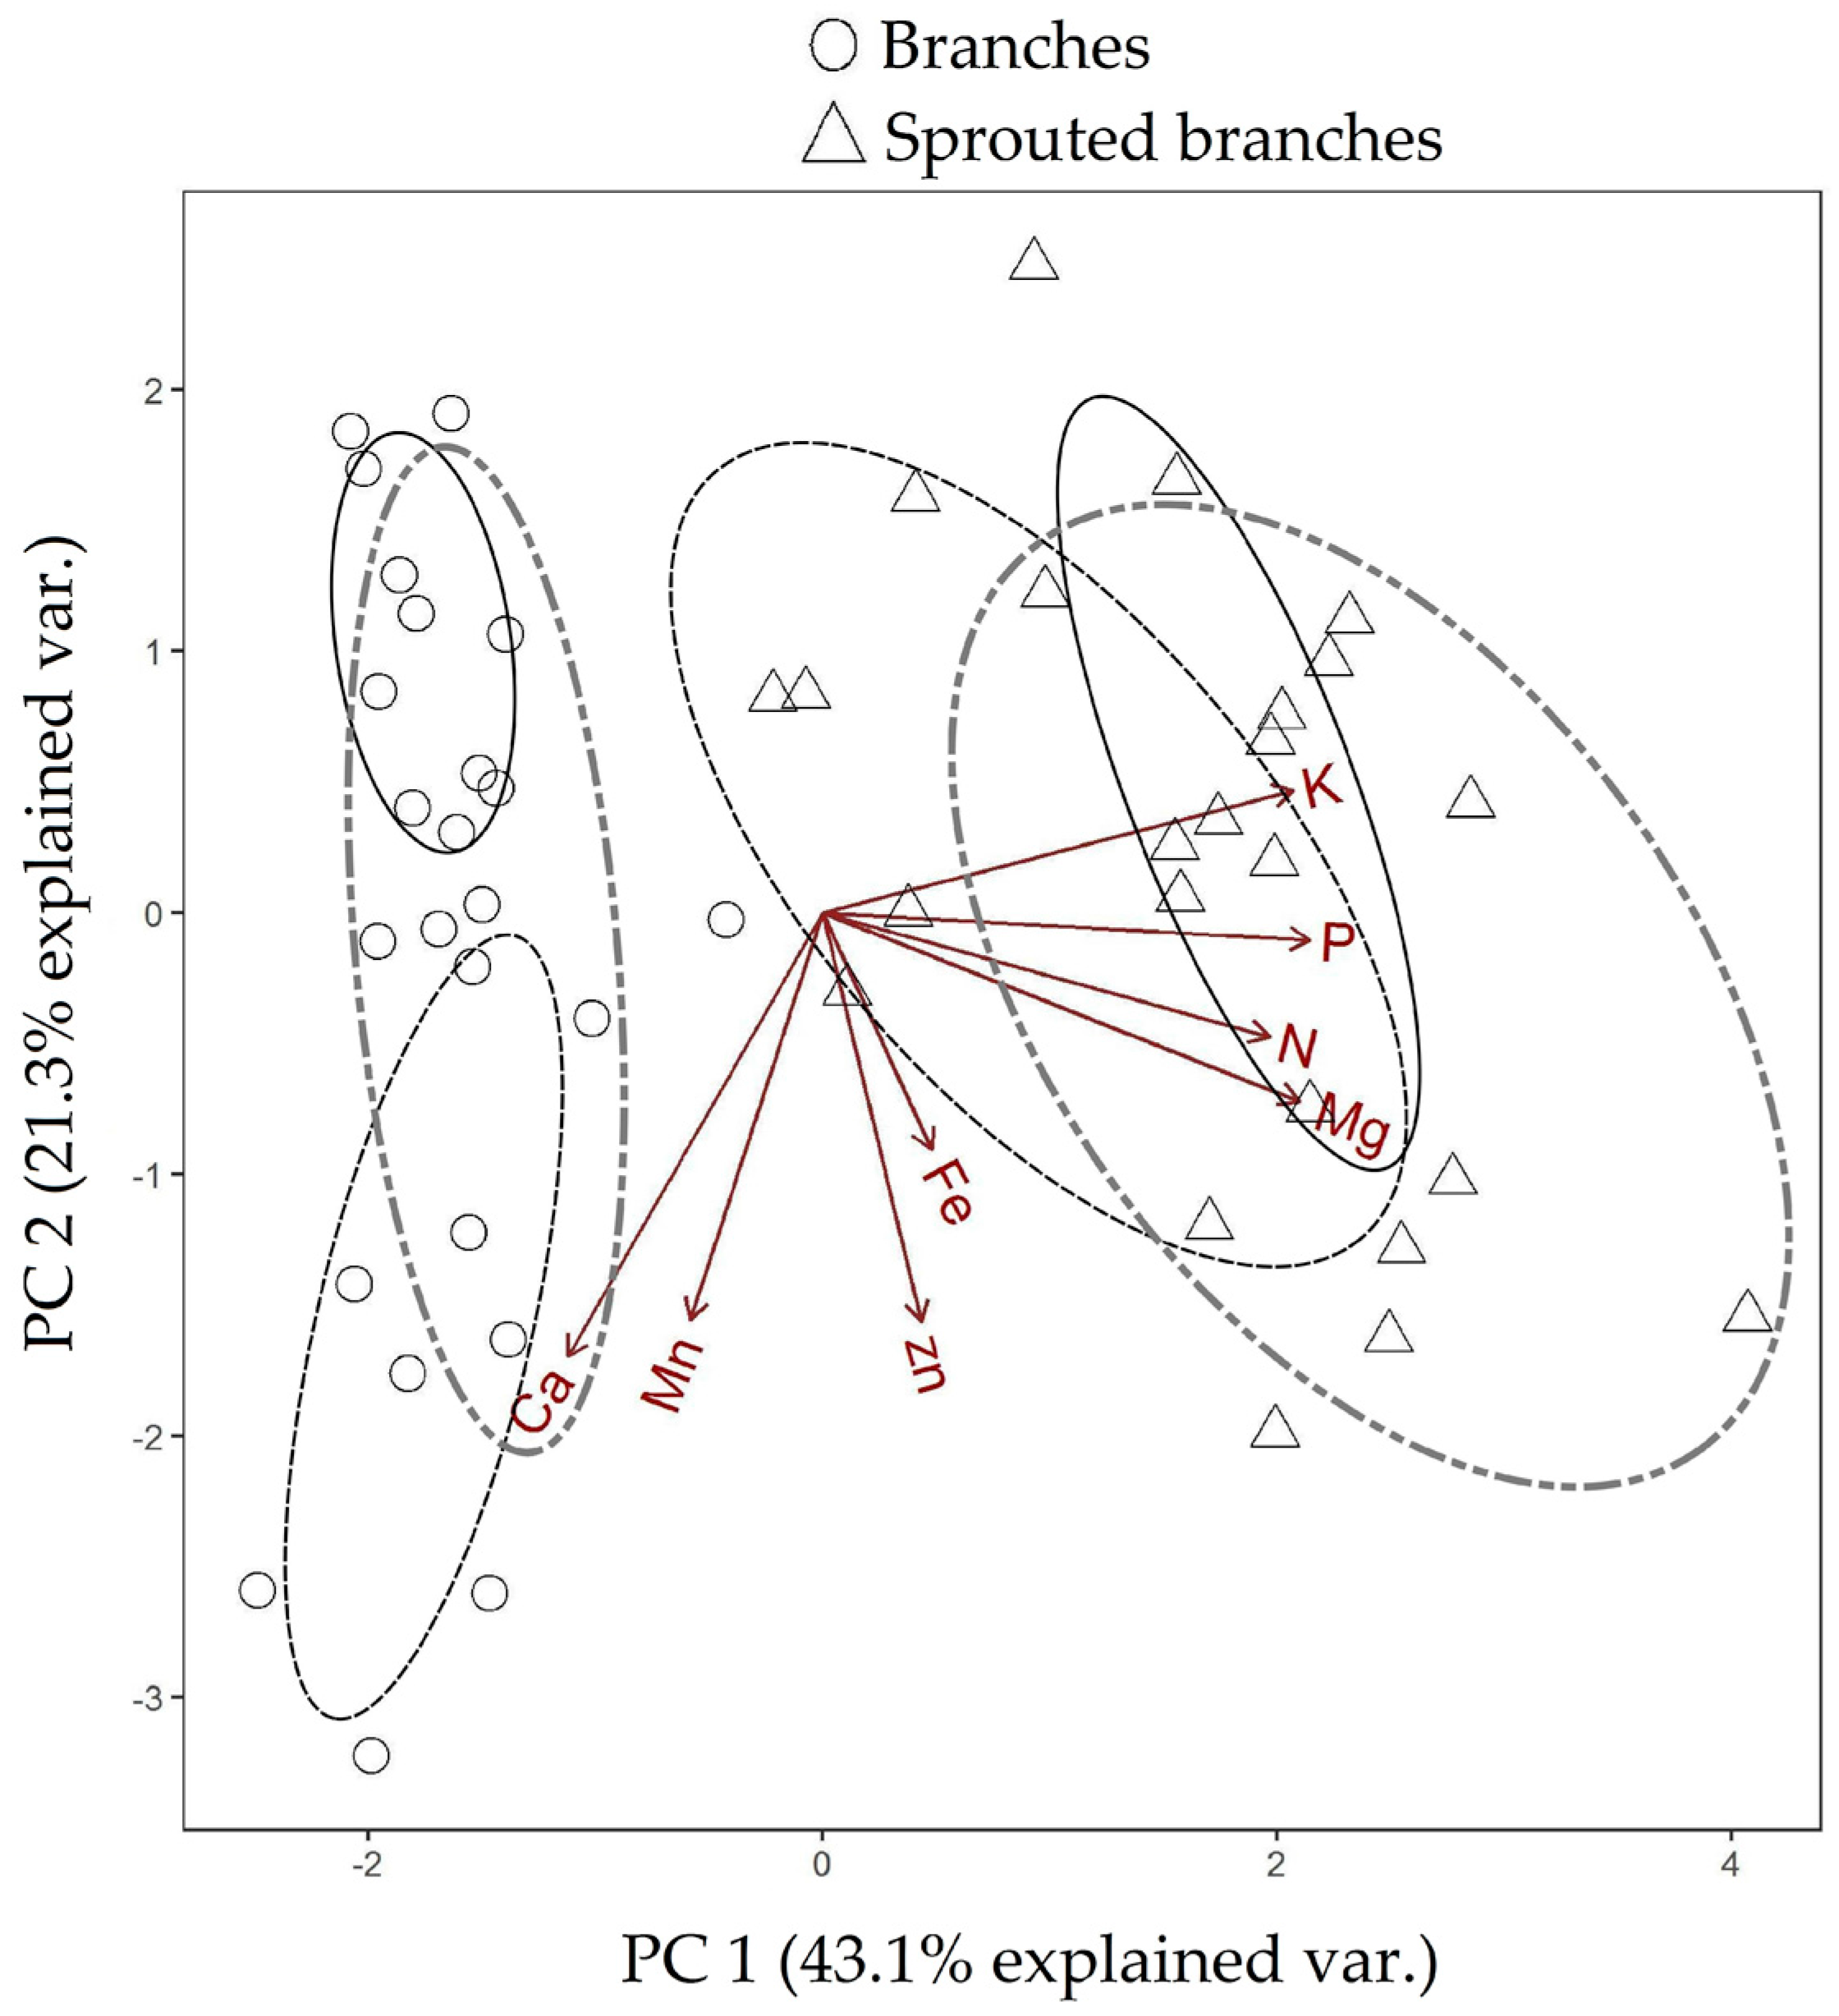
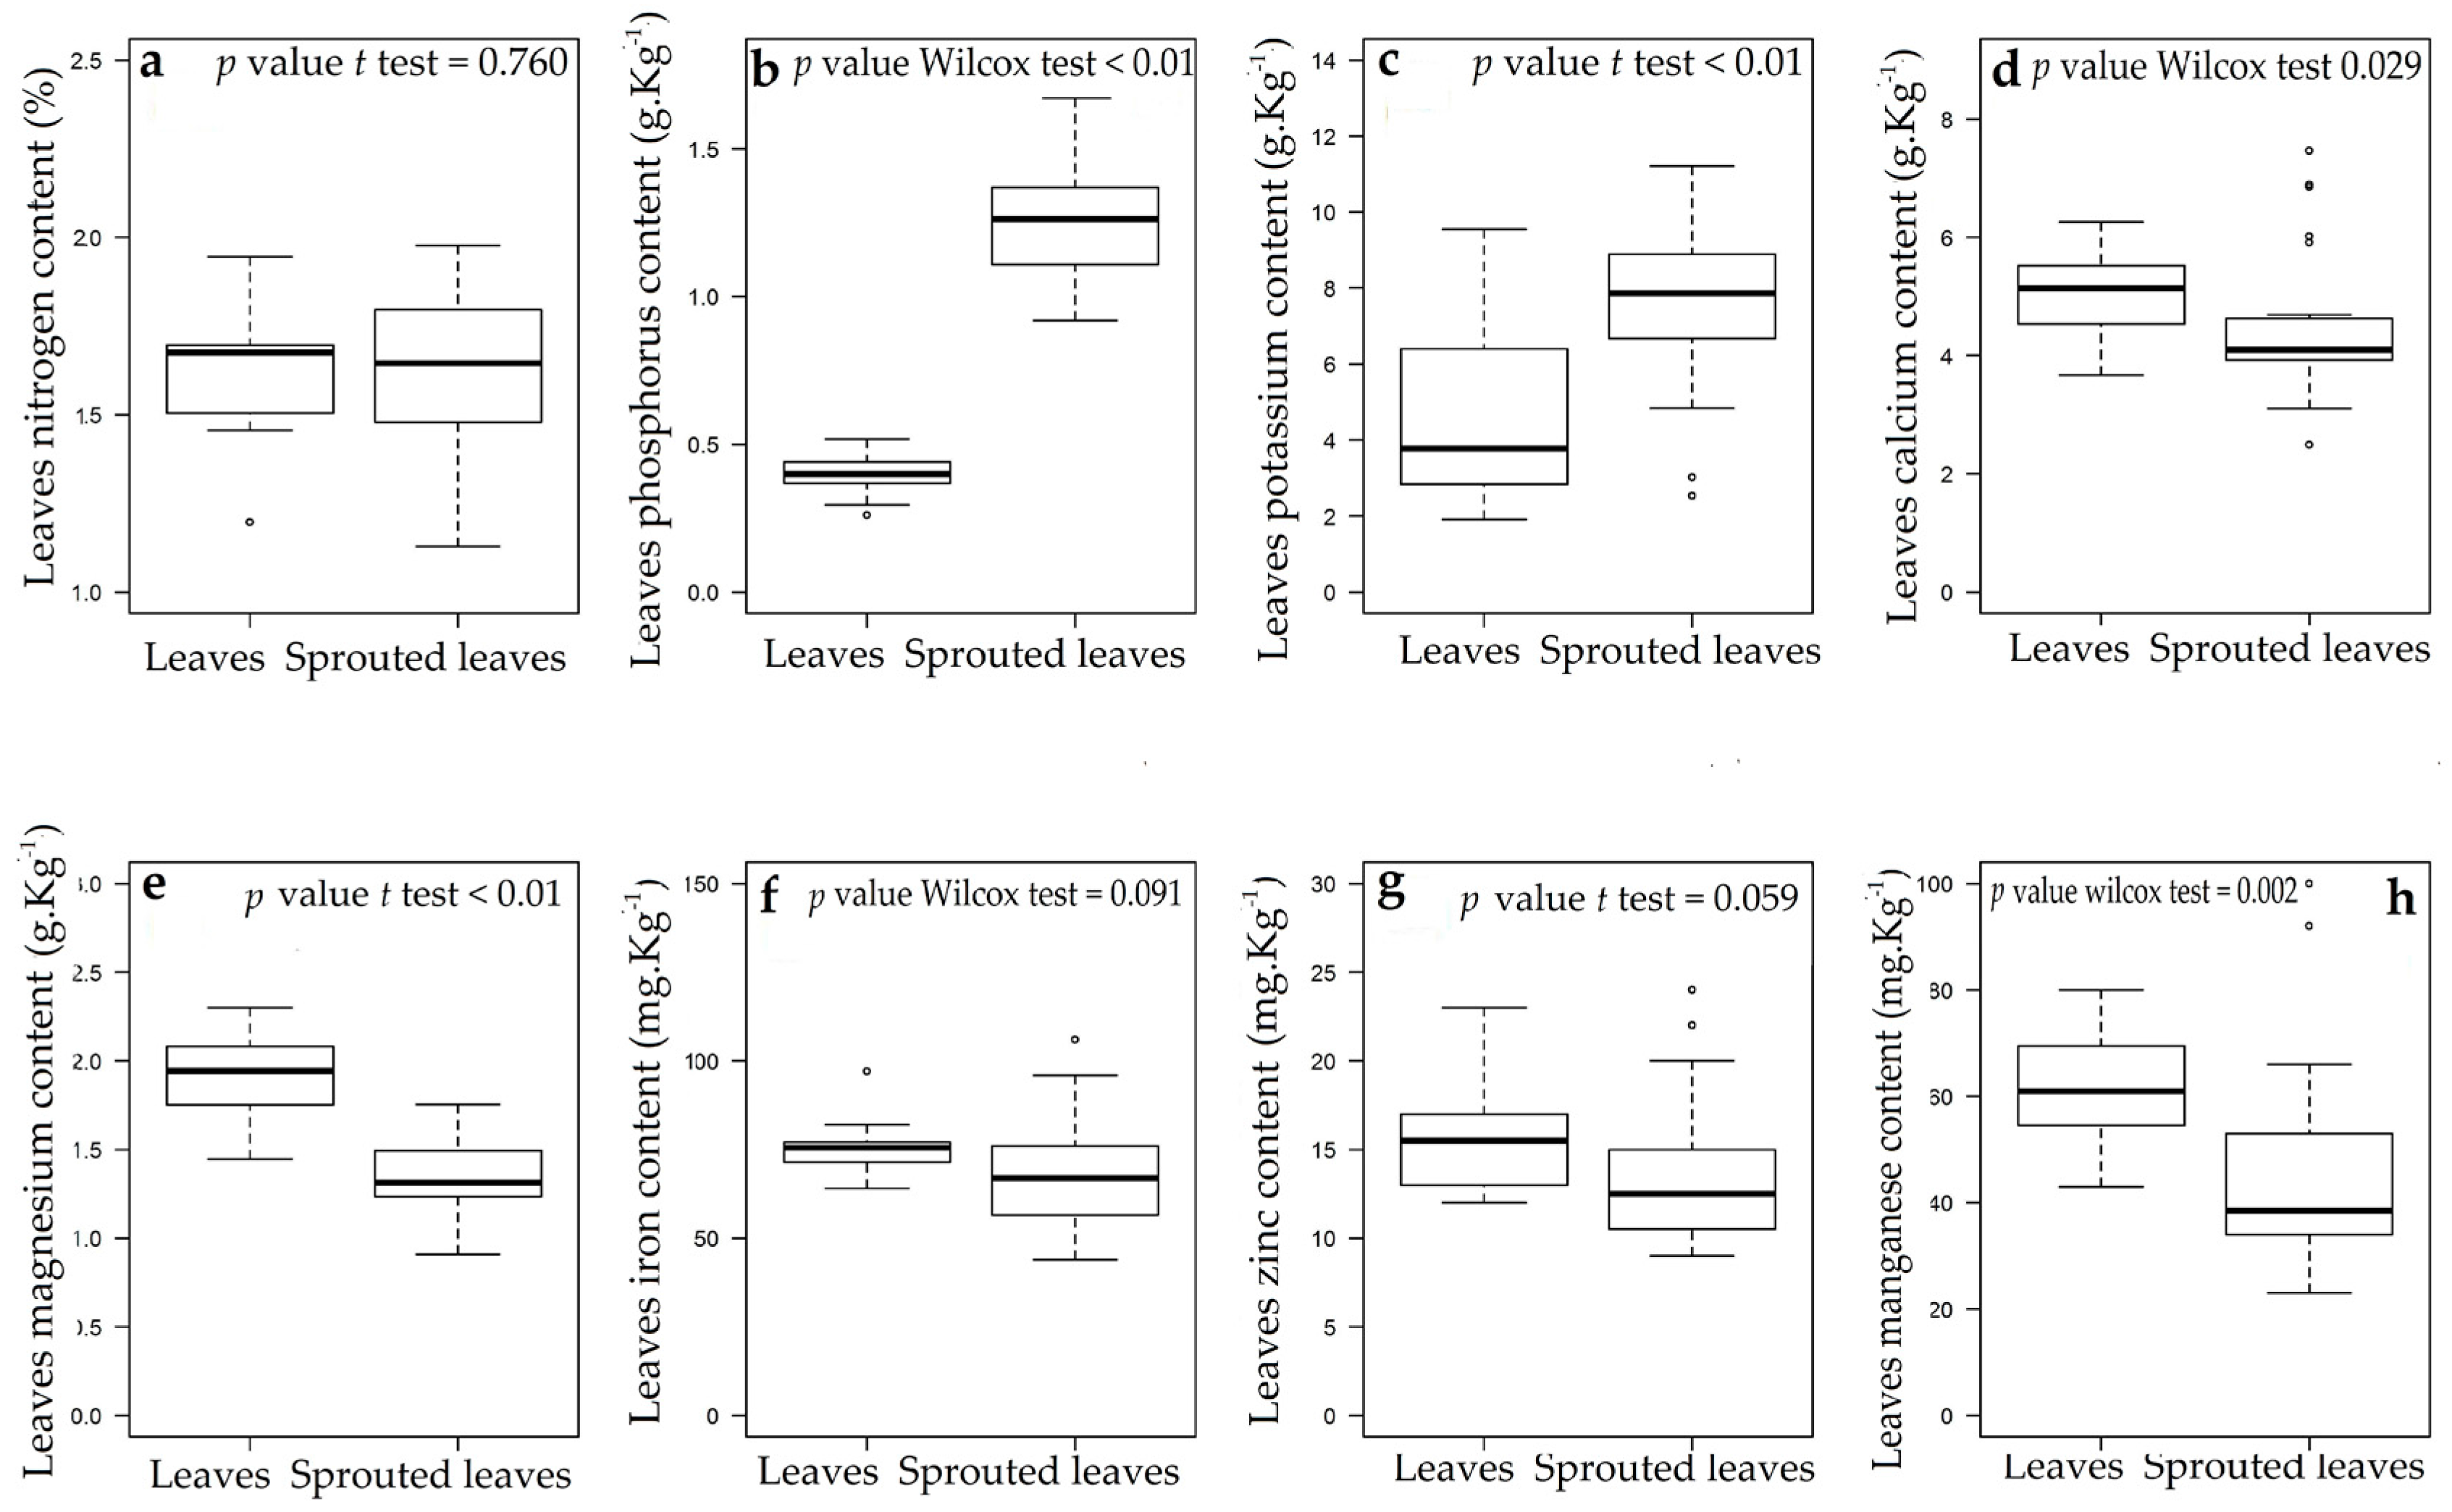
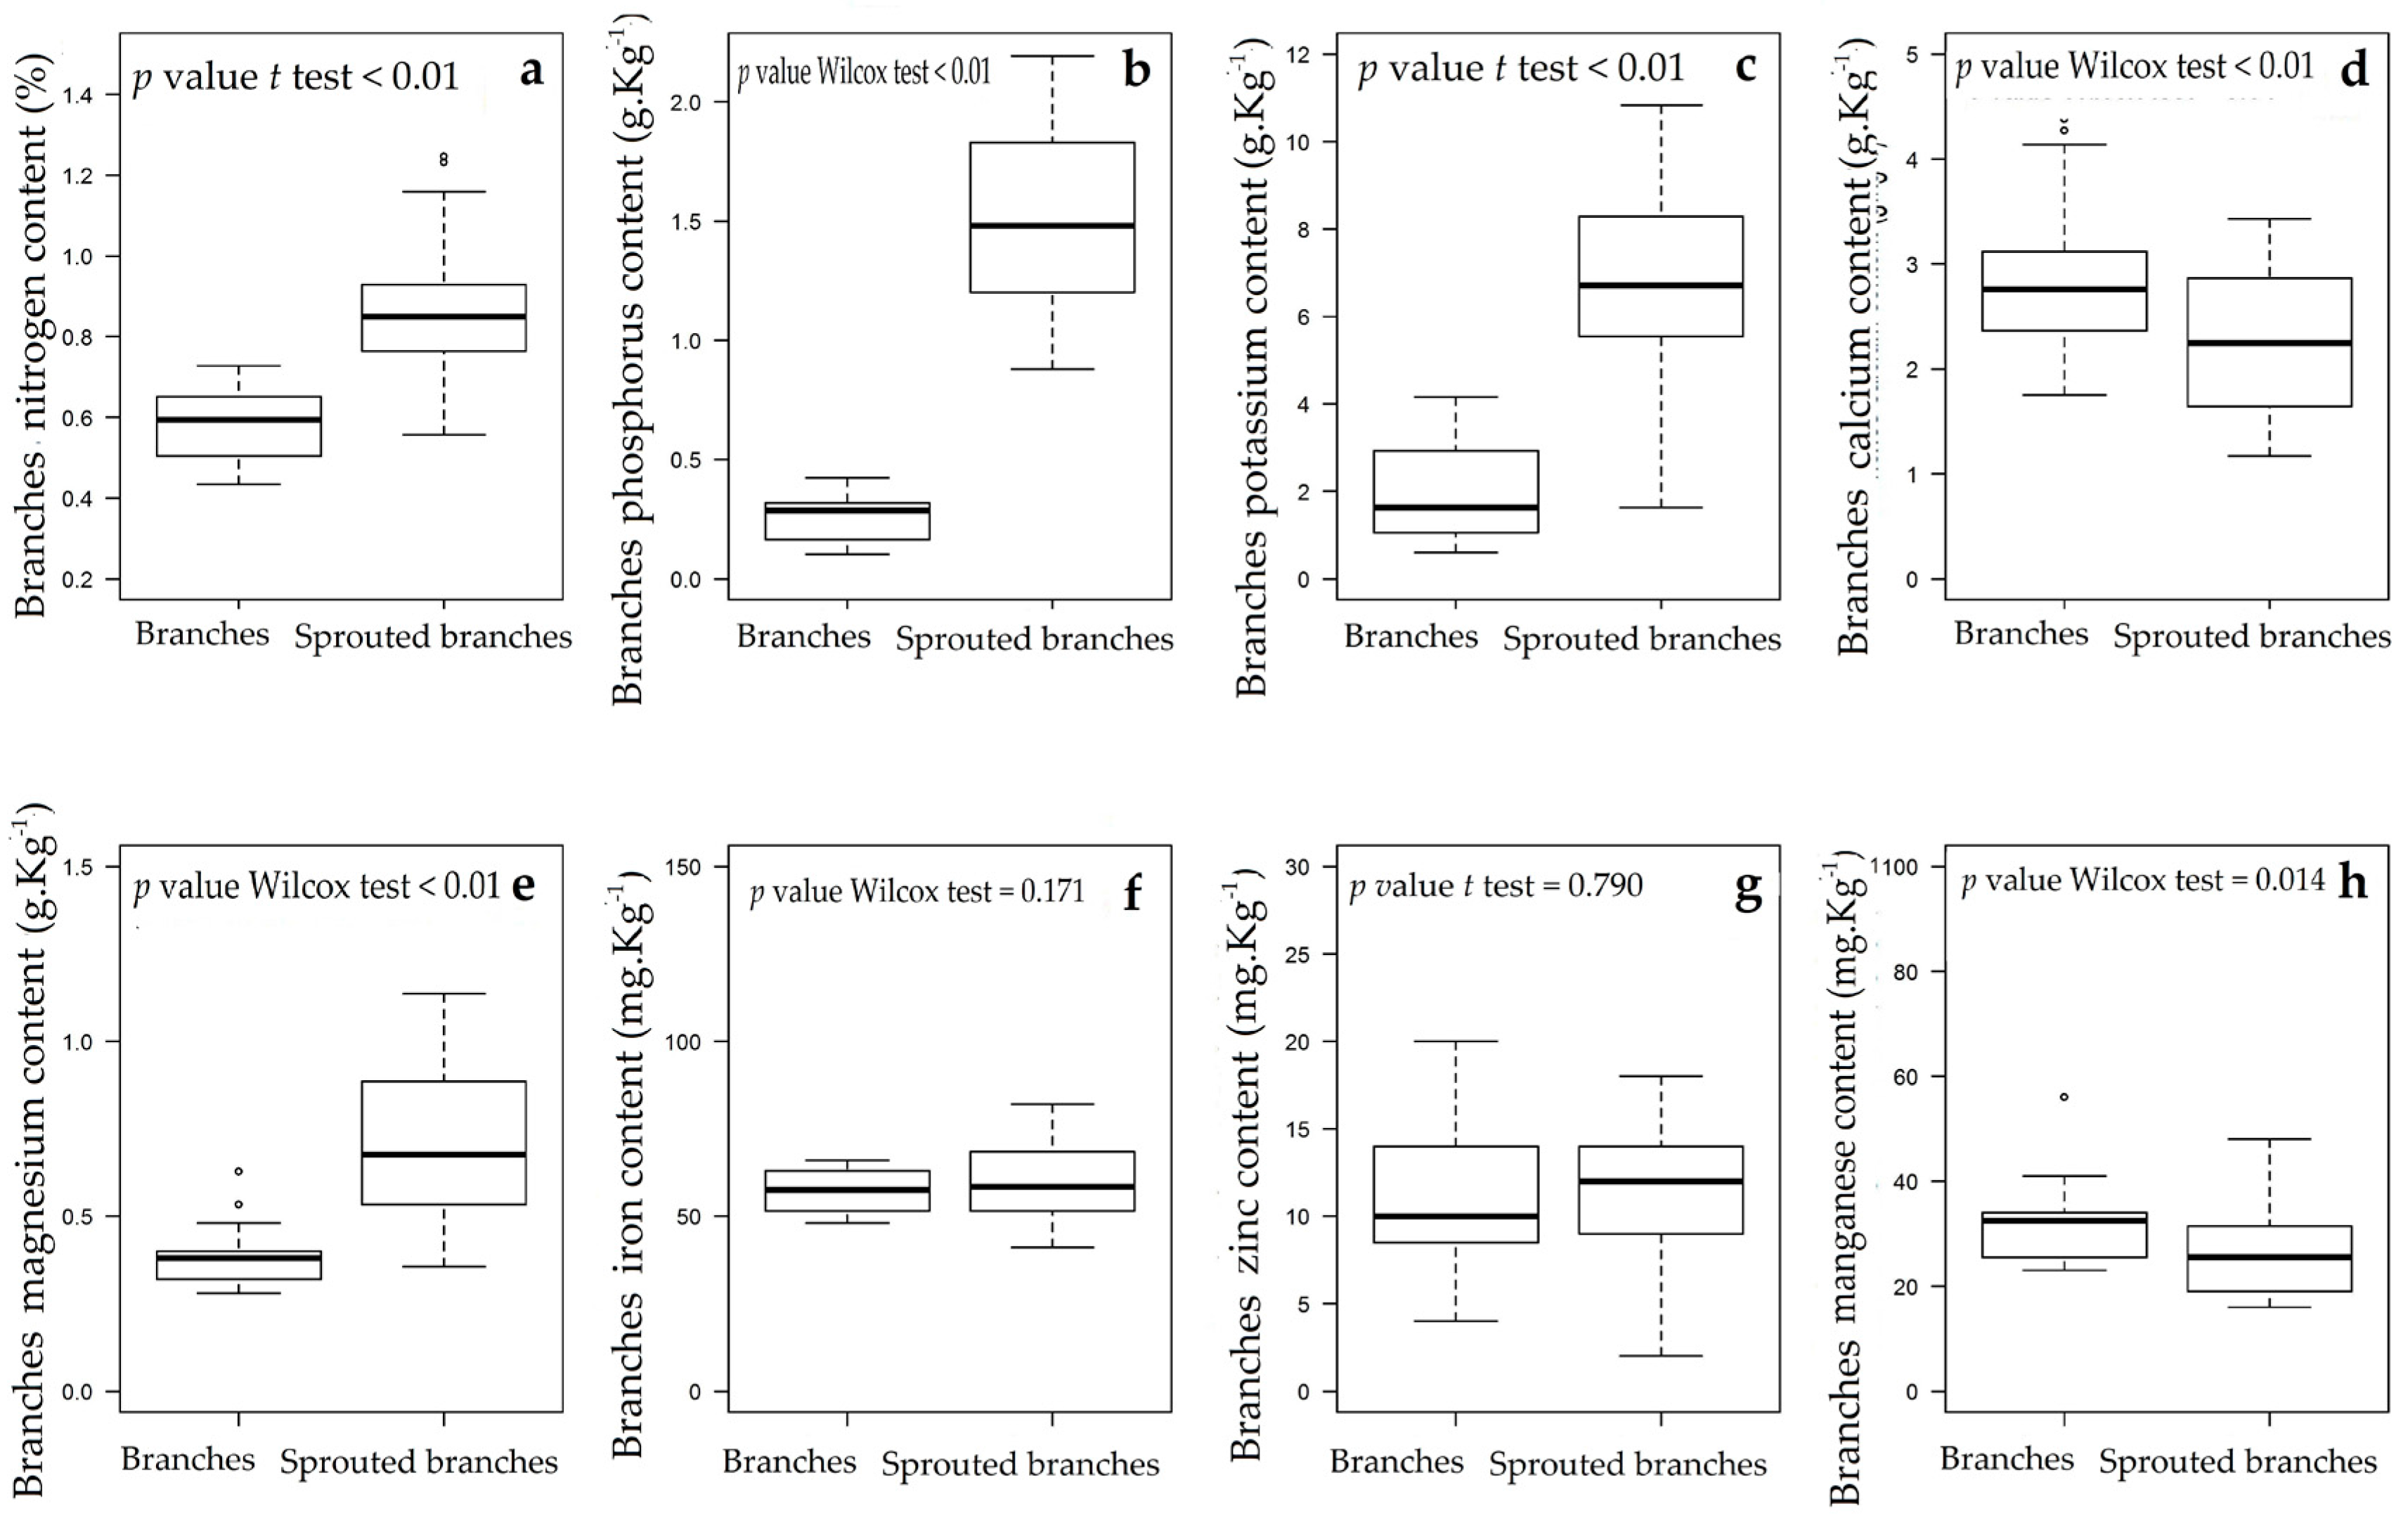
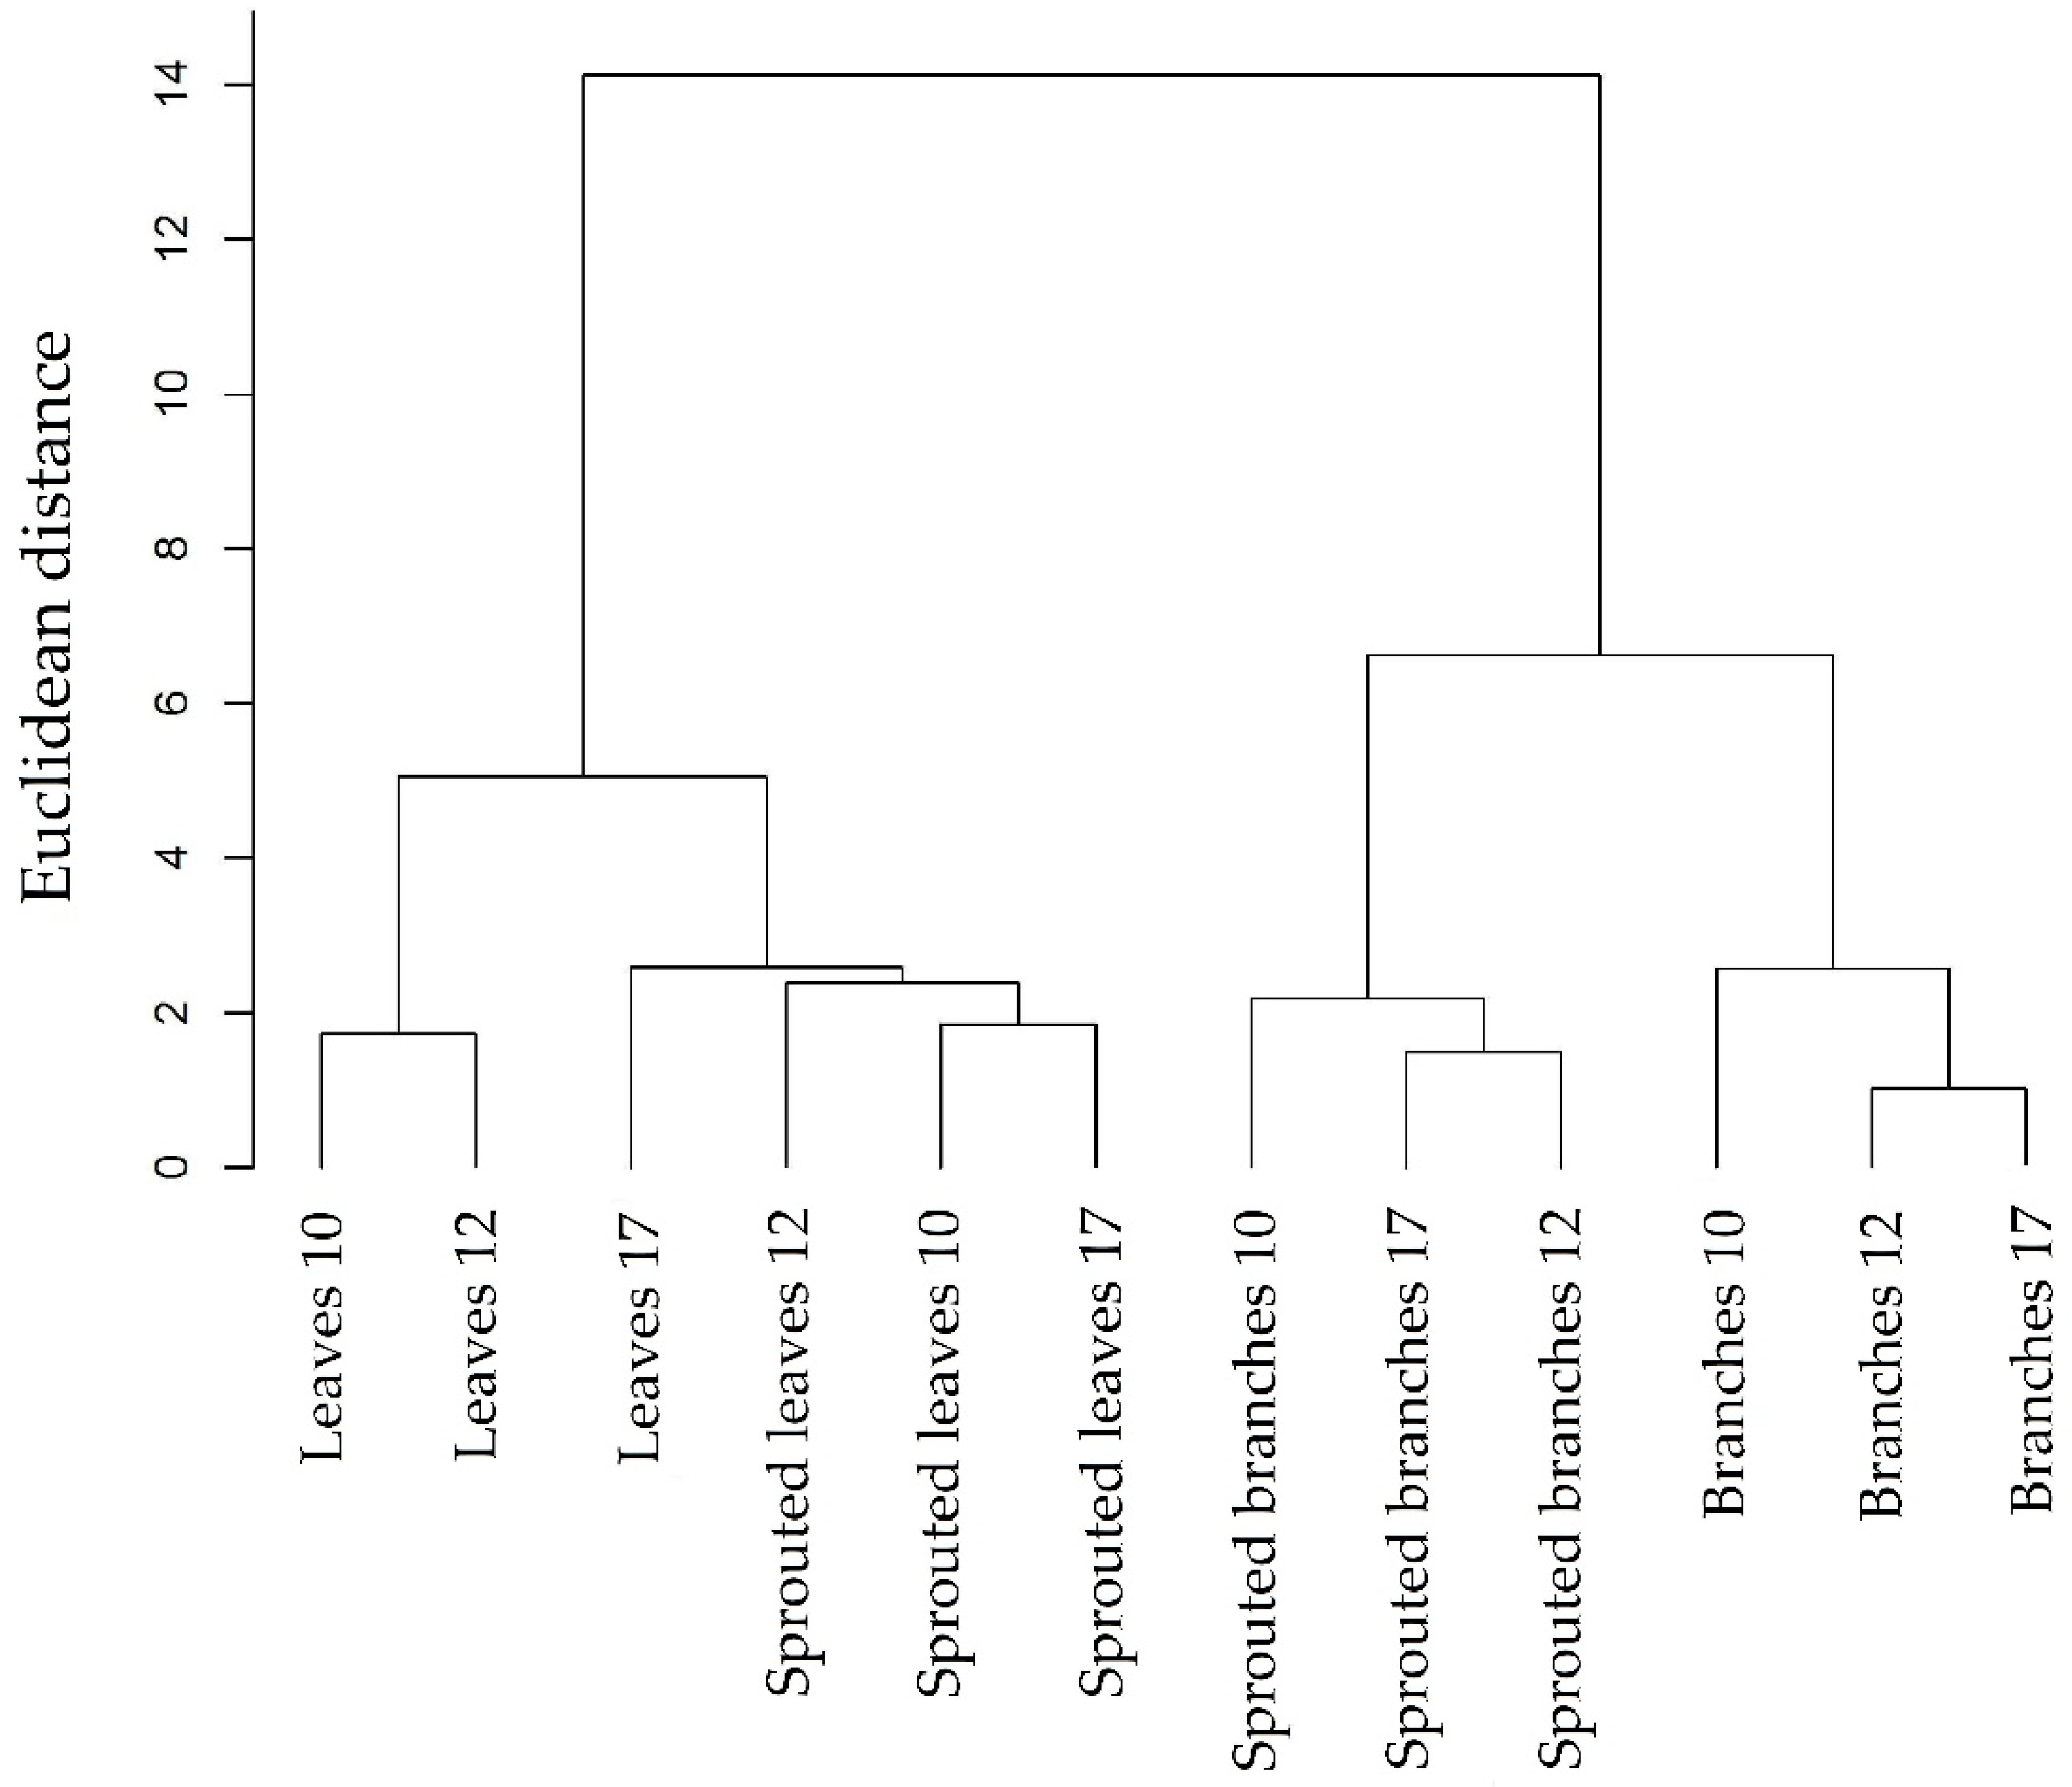
3.1. Changes in Nutritional Status Associated with the Management of Rosewood Plantations

The highest nutrient concentrations were found in leaves, and then progressively less in the materials with greater structural functions, the branches and trunk. Differences between nutrient content were found between the reference leaves and branches and those from regrowth material. For sampling areas, the highest nutrient content was found in C10 and C12 (Table 1).
The two first principal components (PC 1 and PC 2), accounted for 70.3% of the total variance. PC1 was negatively correlated with all variables. The gradient of nutrient content along this component had a higher correlation with Mg concentration (loading = −0.483), and was mainly (loading < −0.40) influenced by the values of Ca, N, P and Mn. PC 2 had the highest correlation with K content (loading = 0.667), and showed a nutrient concentration gradient more influenced by this nutrient and P (loading = 0.63). Between the eight variables, three showed negative correlations with this component. The chemical attributes of the plant parts varied before and after management. This is shown in the PCA biplot graph (Figure 2), where the overlap between the data sets is only partial.
Observed differences in data ordering patterns in the PCA biplot plot were confirmed by means of comparison tests performed on the scores, where the most significant elements in ordering trends have the largest plotted vectors on the biplot plot. For leaves, mean tests indicated significant differences in the first two principle components between the reference and regrowth chemical attributes (Figure 3a,b), while for twigs differences were more pronounced along principle component 2 (Figure 3c,d). These trends were also observed in the multivariate analyses performed with the data of each component (Figure A2 and Figure A3), and with each area separately (Table A2).
Analyses performed separately on chemical attributes confirmed the PCA results. The variables with the greatest significance in the multivariate analyzes were the same as those showing statistical significance in tests of individualized averages. These tests showed increases in N, P and K concentrations in re-sprouted leaves, while Ca, Mg, Fe, Zn and Mn declined. P and K were significantly higher in regrowth tissues (p < 0.01), while Ca, Mg and Mn were significantly lower, while N, Fe and Zn exhibited no significant statistical difference (Figure A4). Concentrations of chemical attributes in sprouted branches were significantly higher for N, P, K and Mg than in reference branches, while Ca and Mn concentrations were significantly lower (p < 0.02). Fe and Zn showed no significant differences (Figure A5).
Two groups can be distinguished in the dendrogram (Figure 4), one formed from leaves, and another from branches showing a grouping consistent with the PCA data and the results of mean tests. Subgroups formed in both groups as a function of the chemical attributes of reference and regrowth material. The distinct groupings of leaves, reference and regrowth branches shown in the dendrogram result from a higher cophenetic correlation coefficient between the reference branches and their regrowths (3.05) than between the leaves and their regrowths (2.66). Such coefficients indicated clustering was a robust method, as was clustering analysis that treated areas/ages separately (Figure A6).

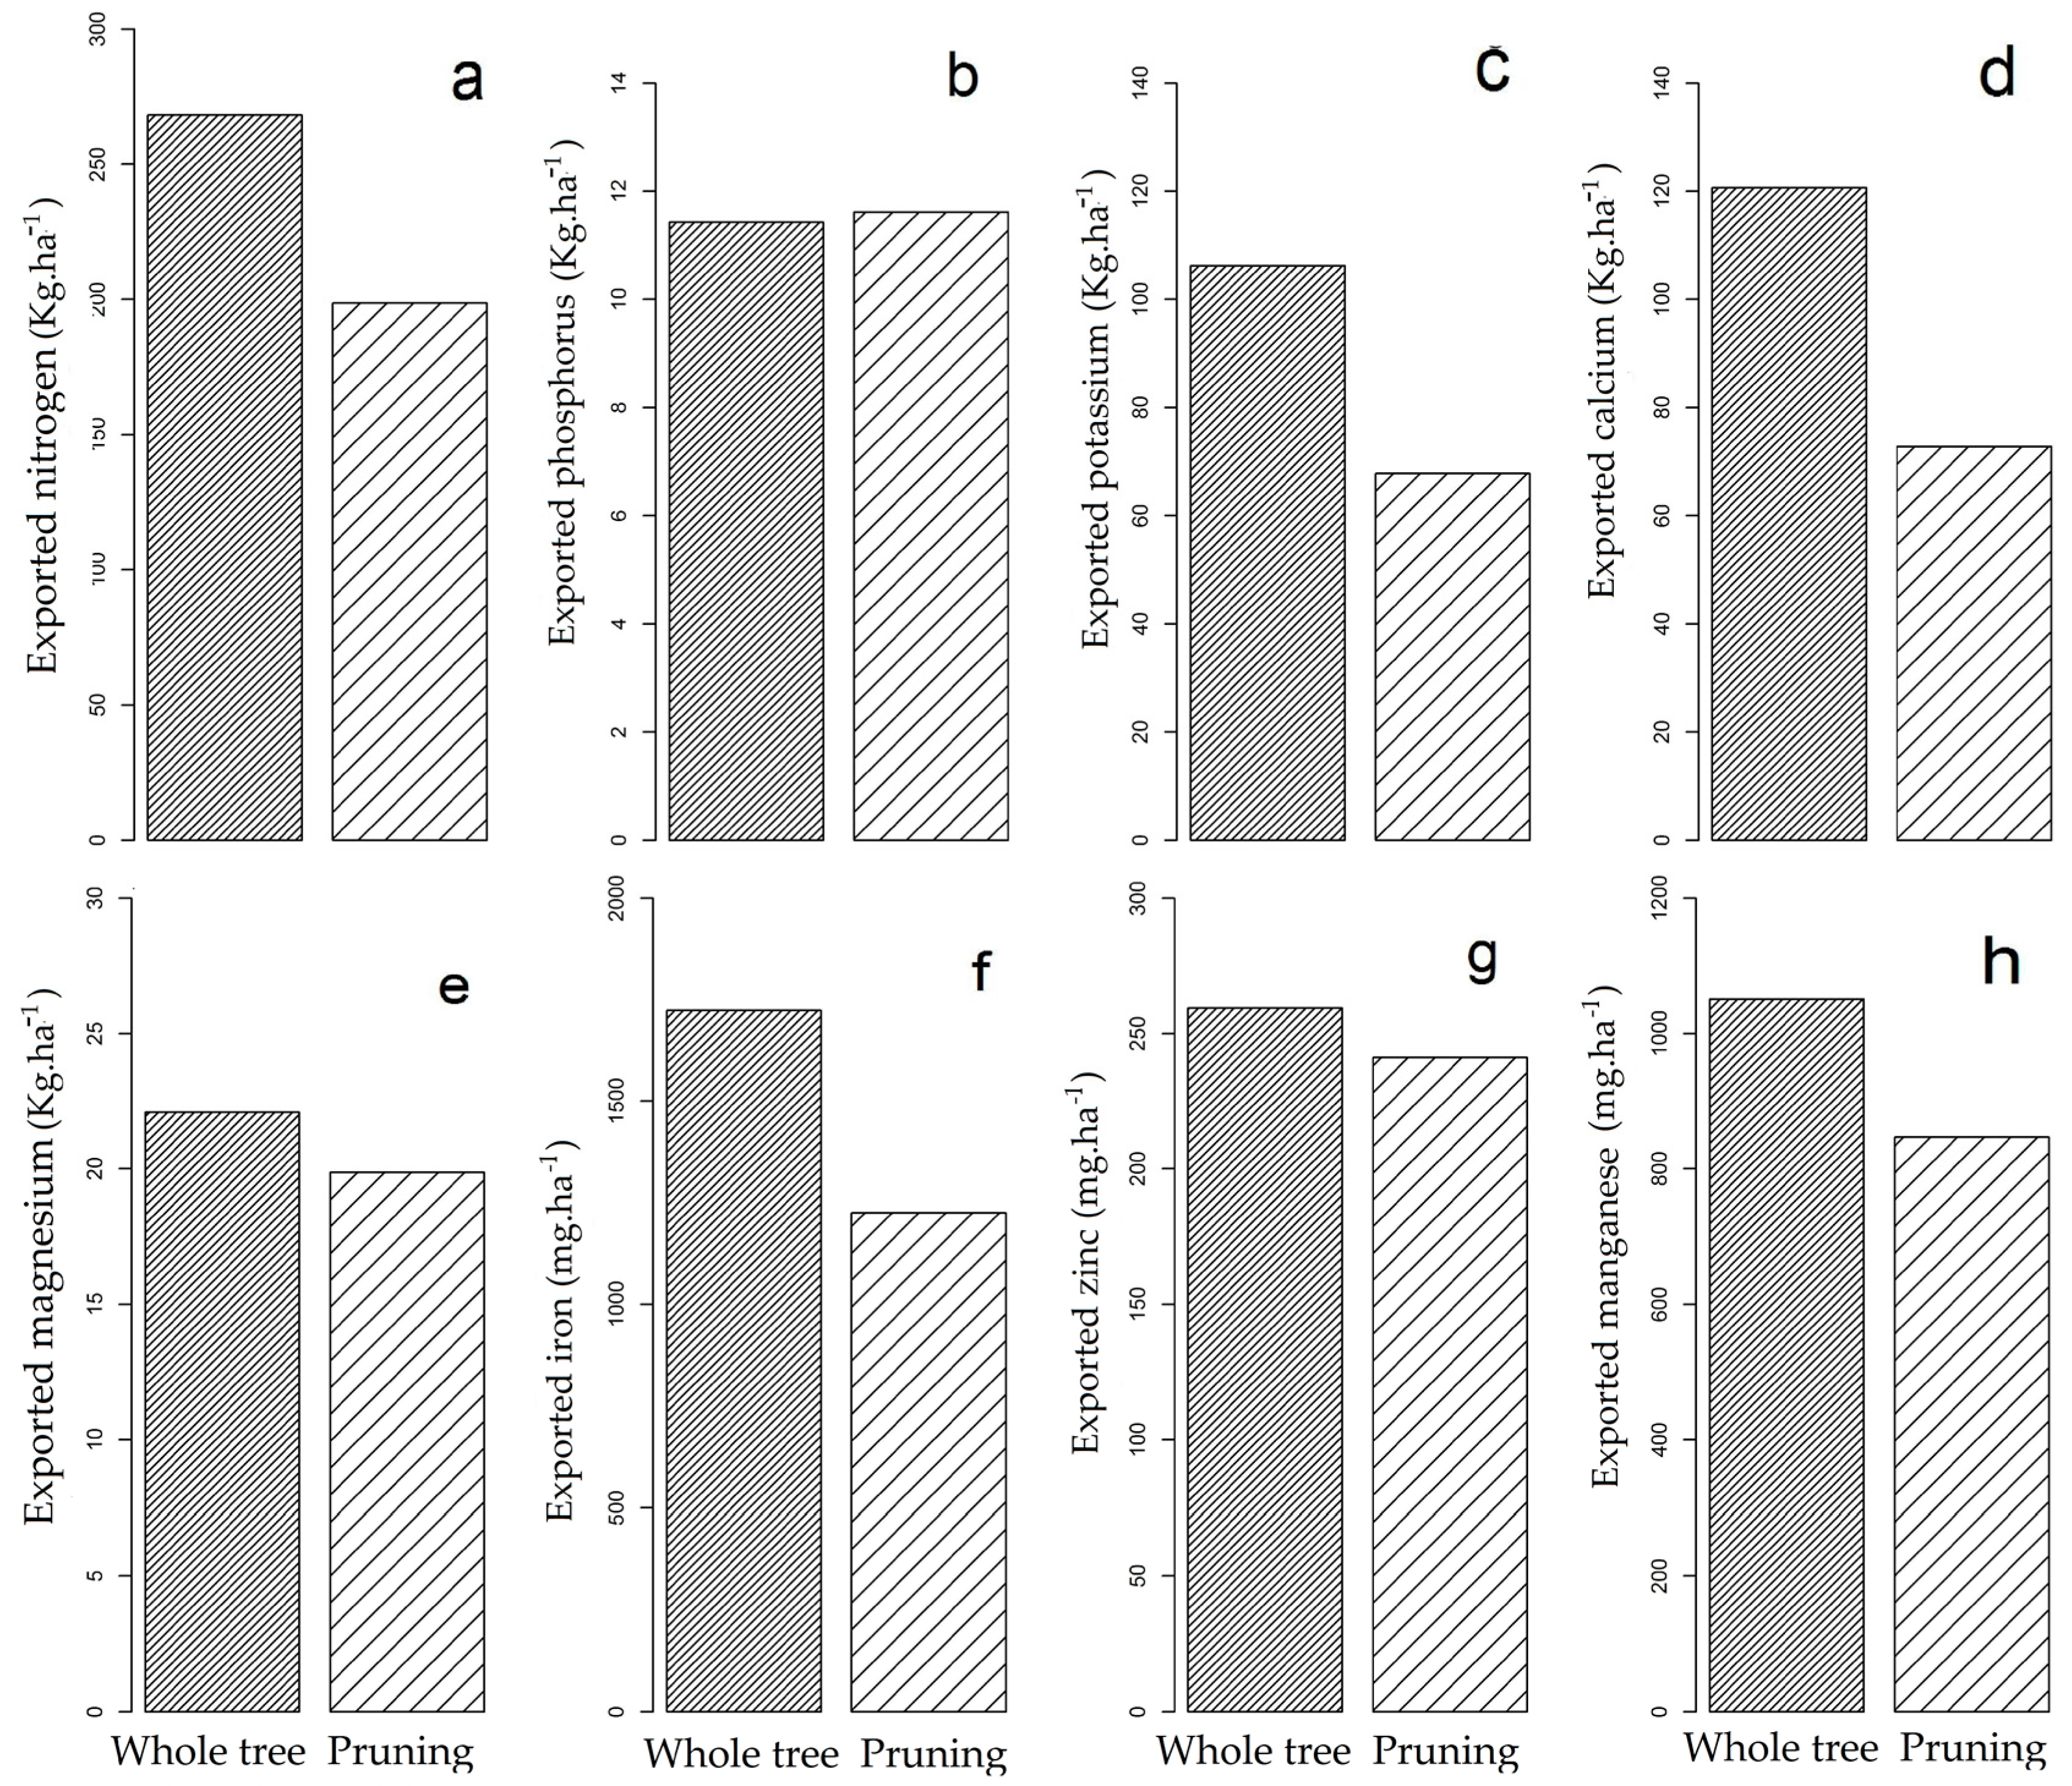
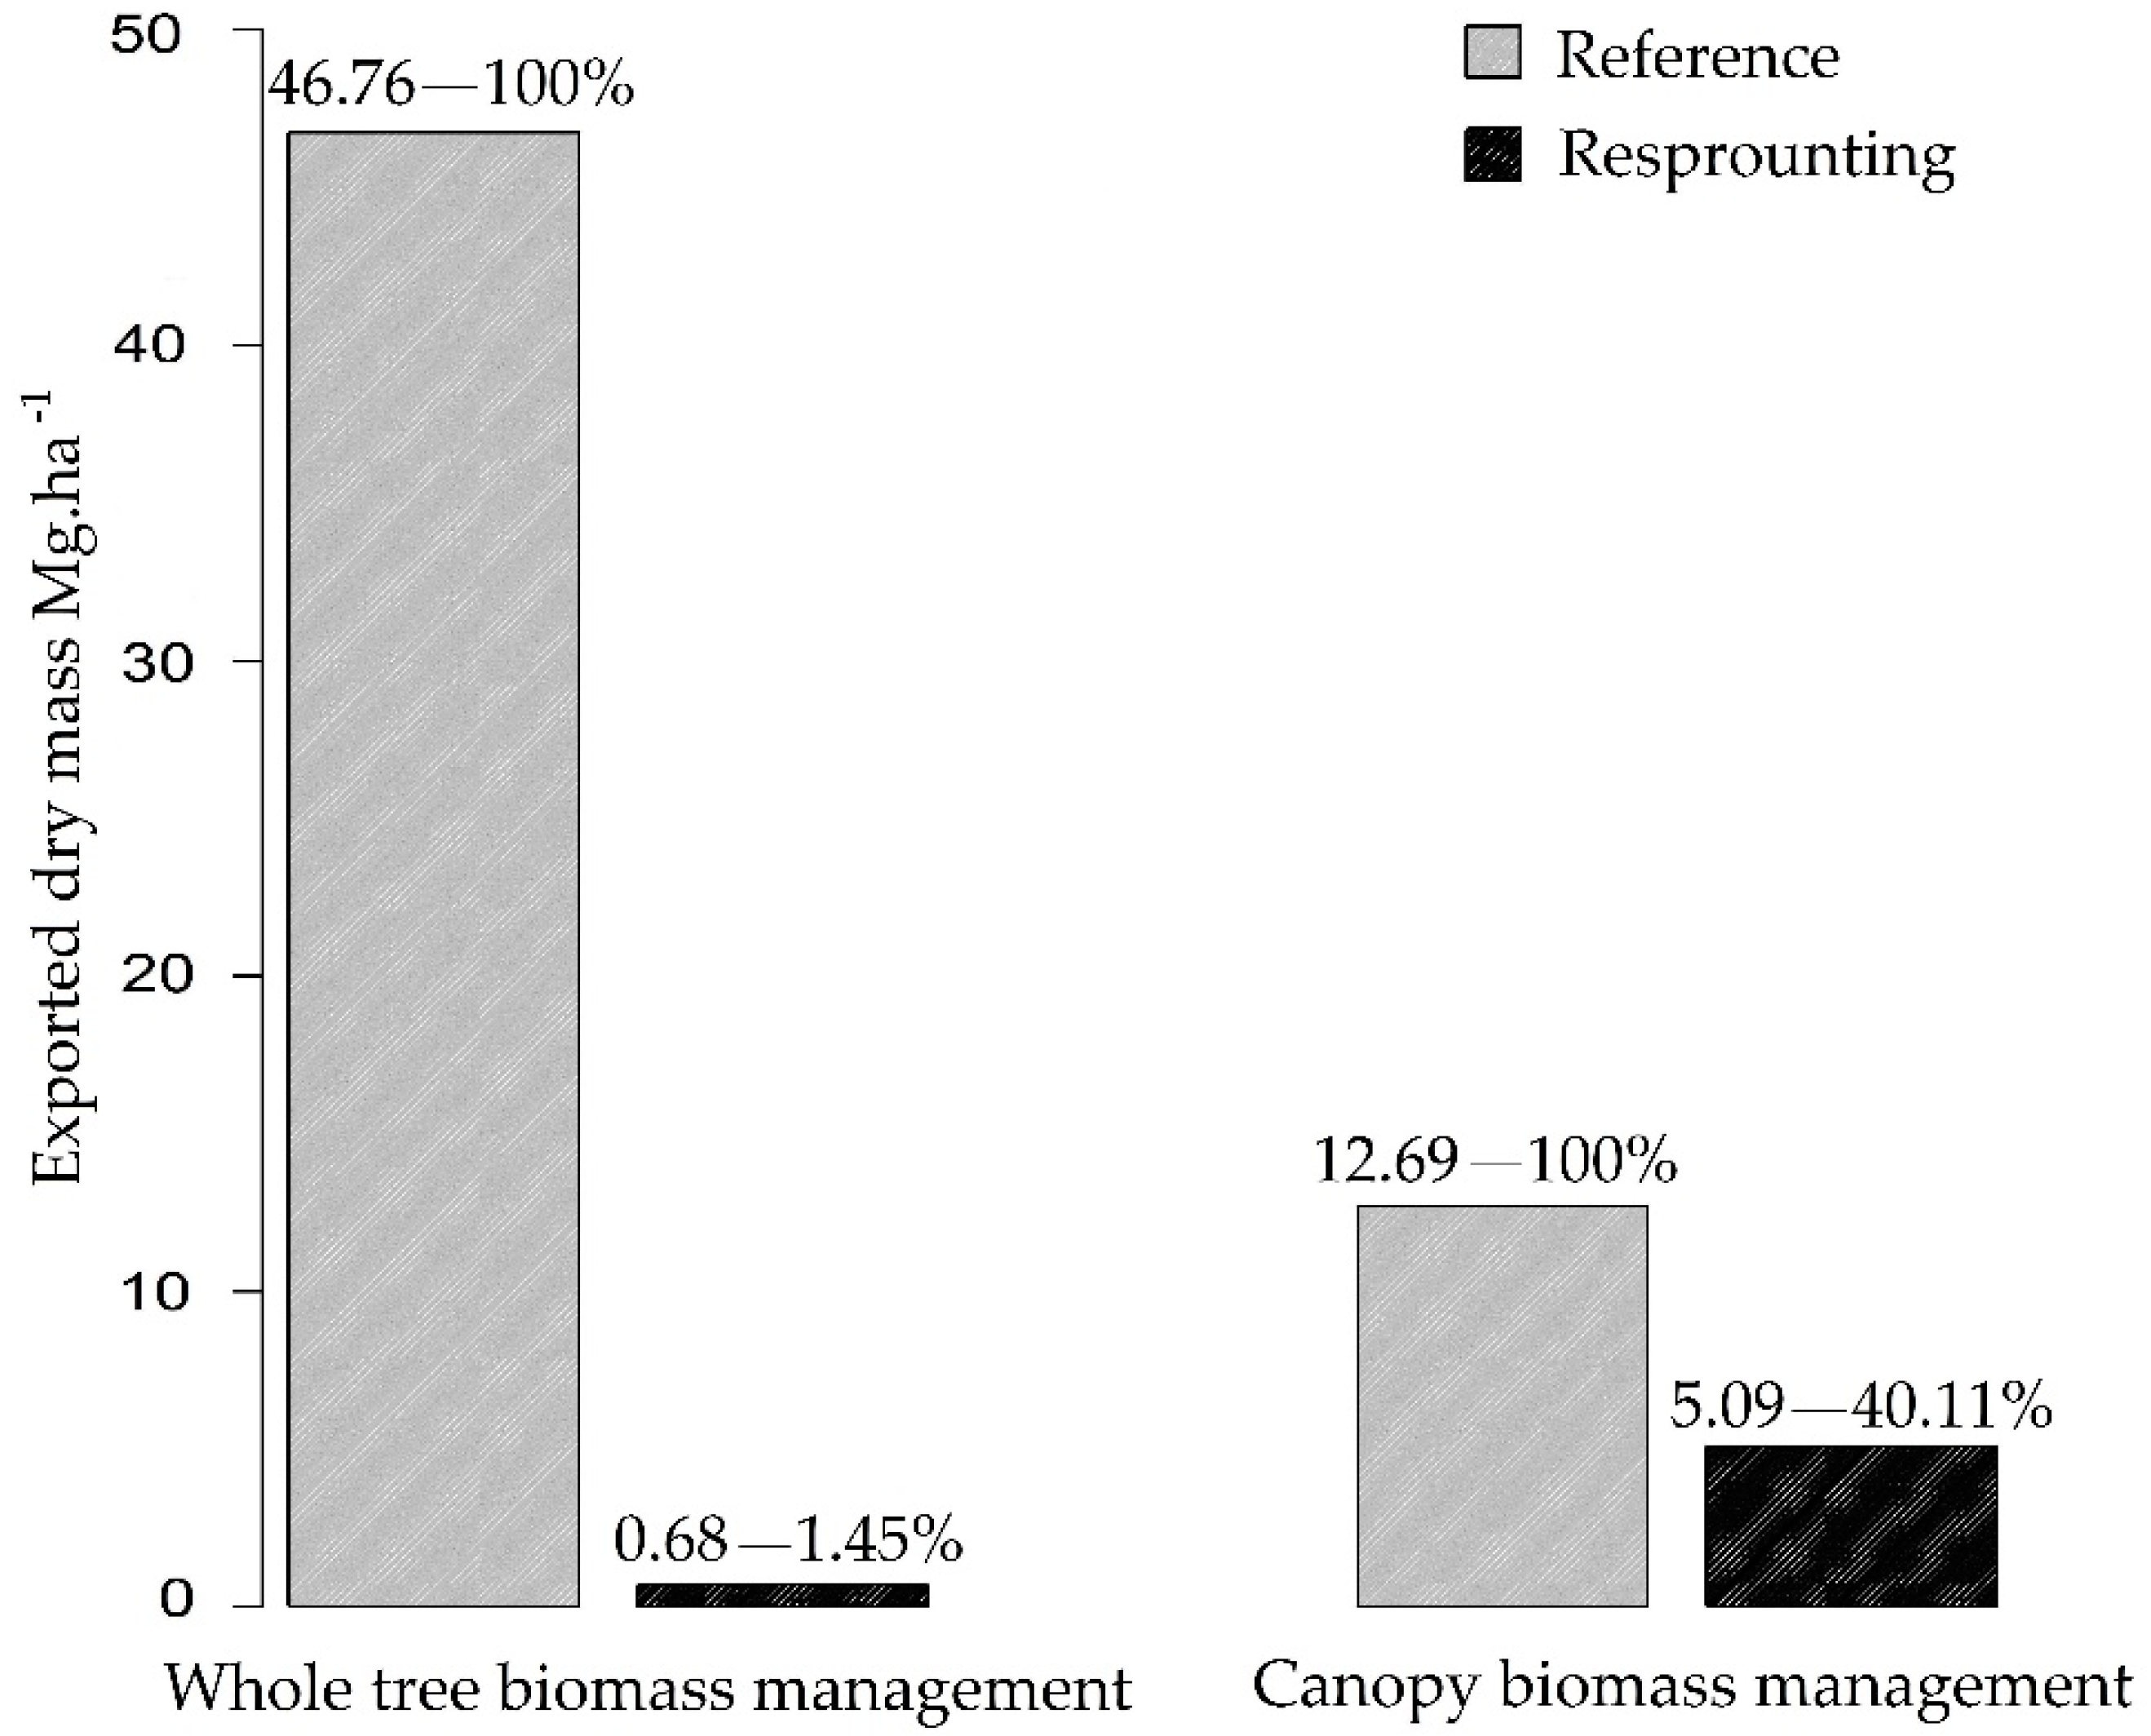
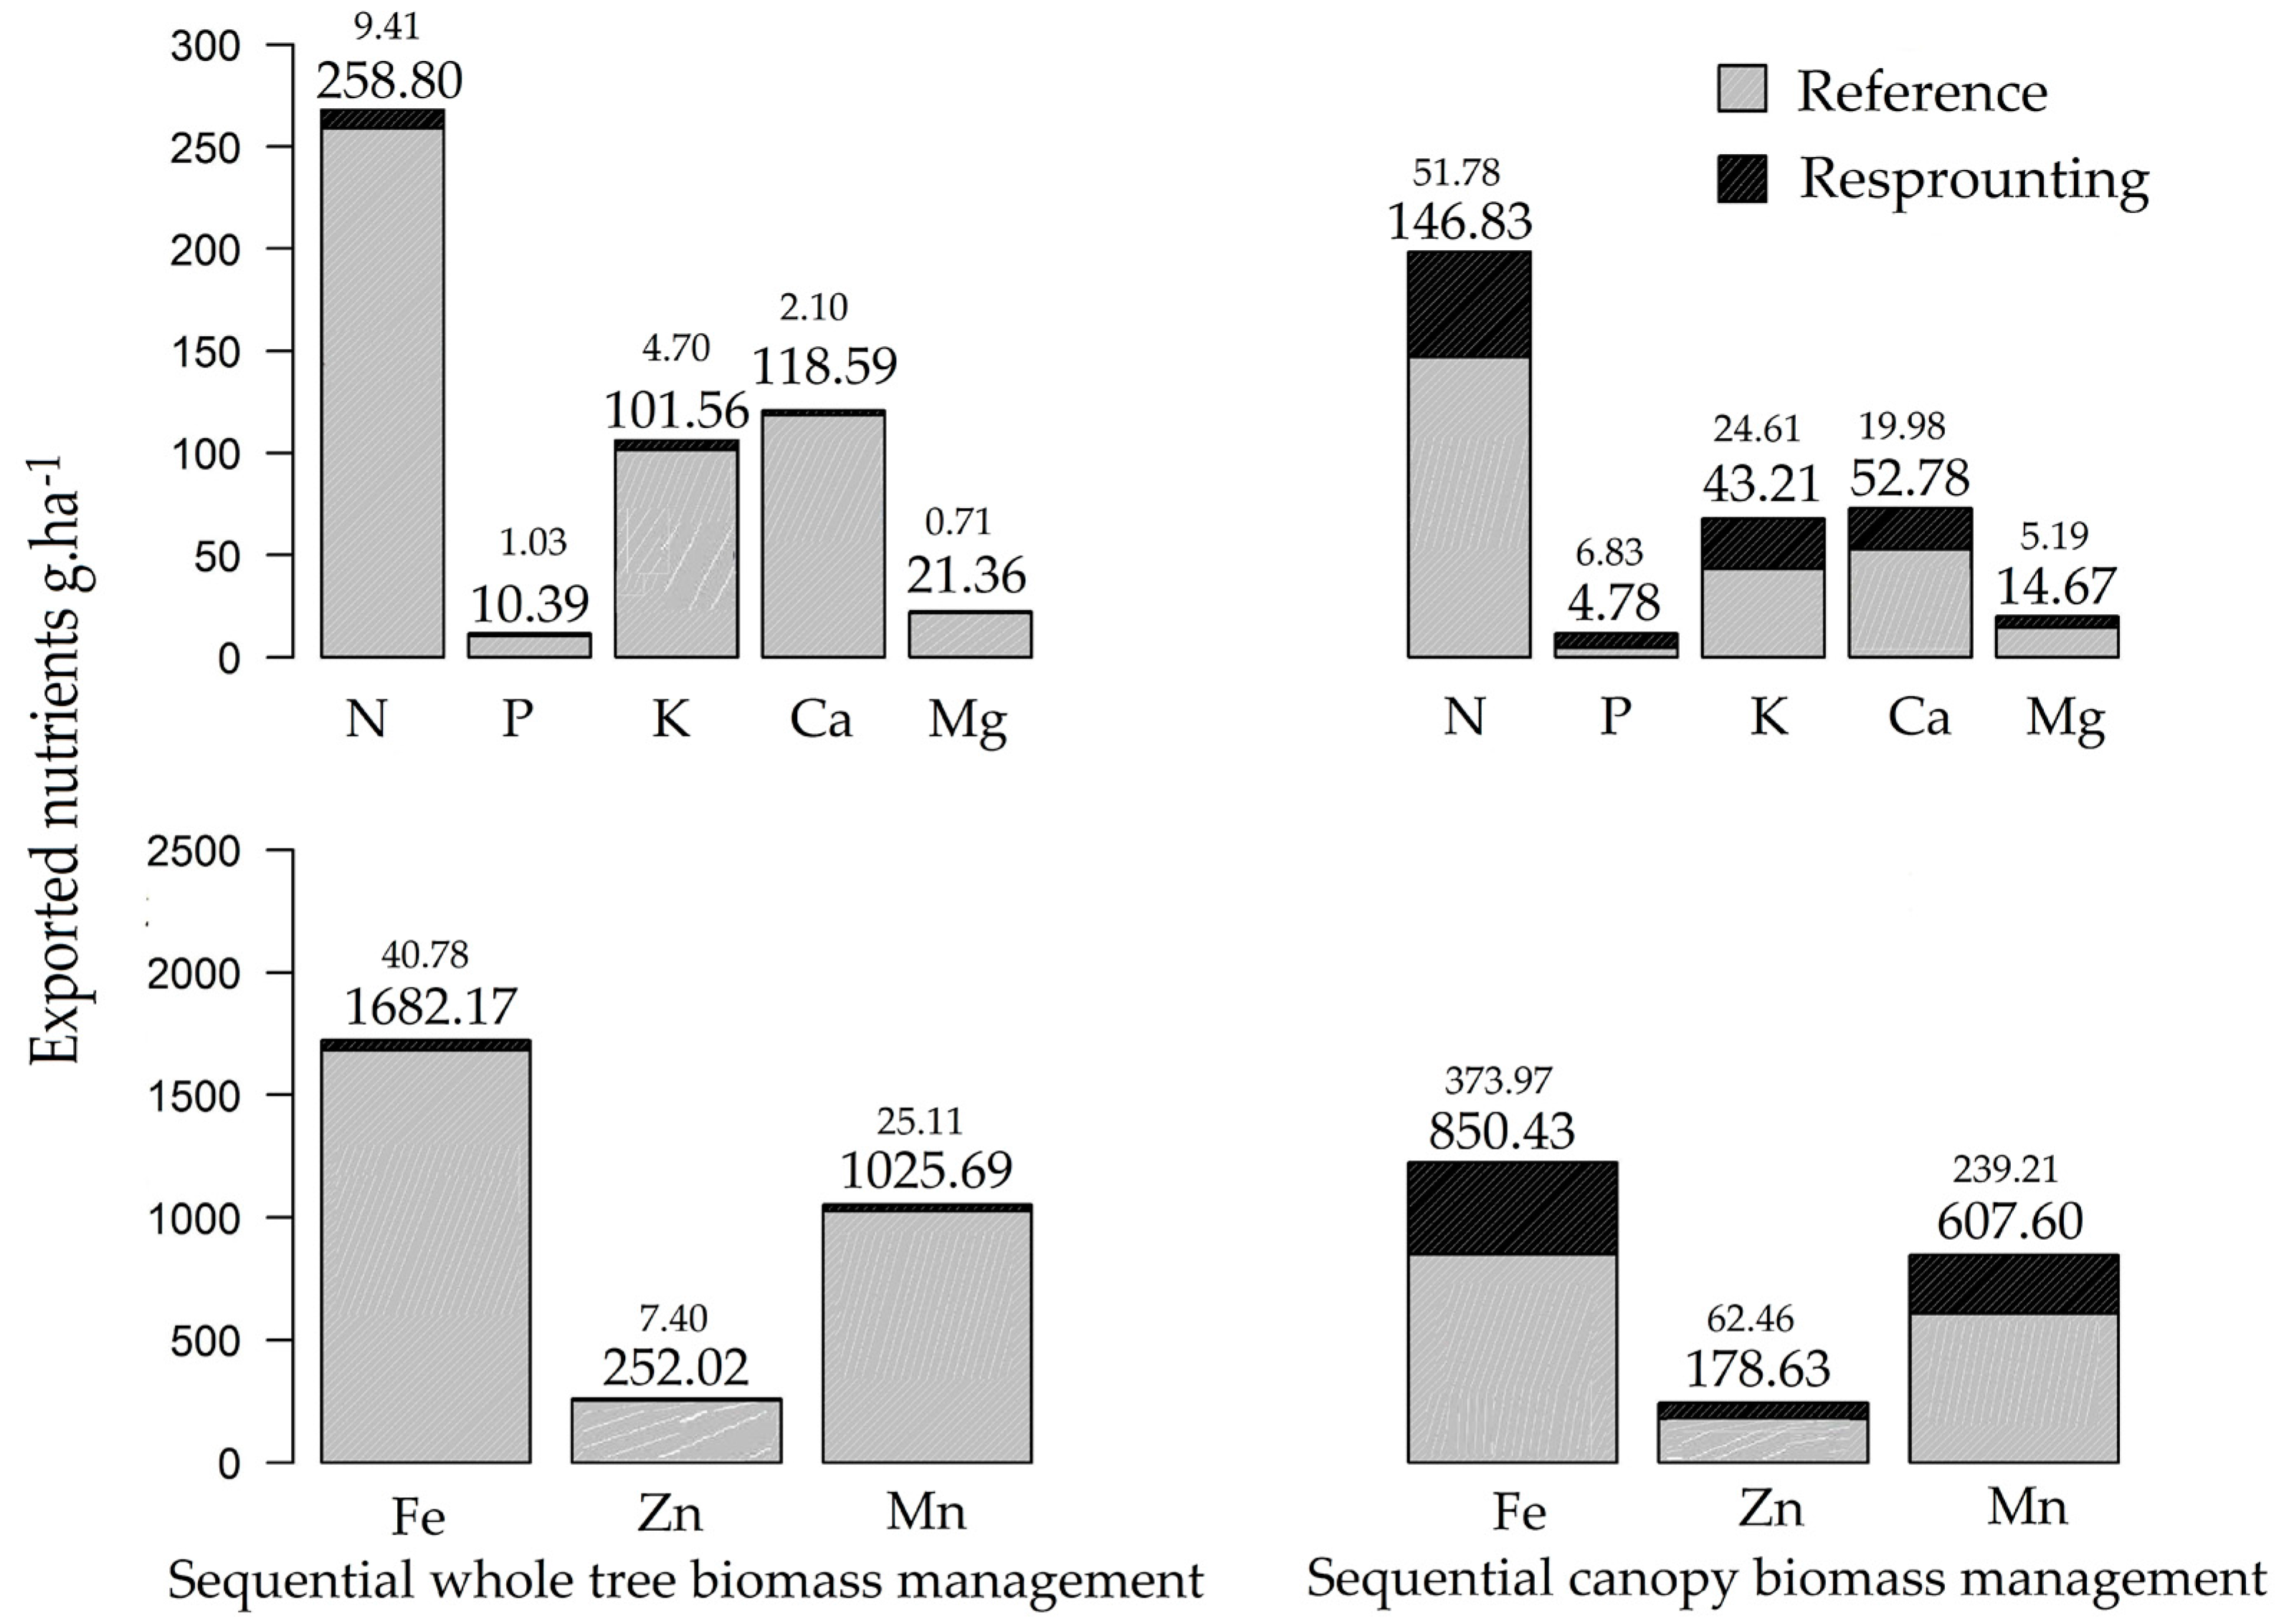
3.2. Nutrient Export during Sequential Management of Rosewood Plantations

Overall, trunks contributed 62.22% of exported biomass, with a recovery of initial dry mass of 1.45% (Figure 5). Such a higher biomass allocation implies greater nutrient storage. Sequential management of rosewood canopies produced a 40.11% dry mass recovery in 12 months, with tree crowns accounting for 37.48% of total whole tree harvested mass.
Nitrogen was the analyzed macronutrient present in the greatest amounts in the biomass resulting from sequential management (Figure 6). Wood had a lower N content, but its greater accumulation resulted in the greater recorded mass of N. Of the N exported in the first whole rosewood tree harvest, 55.57% came from N stored in canopy. Relative contributions to total nutrient stock of P, K, Ca and Mg in the crown were 46%, 42.54%, 44.5%, and 68.68% respectively (see Figure A7 for more details).
The same trends of in-biomass macro and micronutrient concentrations seen in whole tree harvested management were apparent in samples derived from sequential canopy management. Magnitude of macronutrient export was, in descending order: N > Ca > K> Mg> P for the first harvest. For the second harvest magnitudes differed: N > K > Ca > P > Mg, with inversion between the Ca and K and Mg and P concentrations. This corroborates the PCA results (represented by the vectors indicating the data ordering trend). Micronutrients export showed the same order for the two harvests: Fe > Mn > Zn.
Amounts of fertilizer to be replenished depends on the type and intensity of management adopted (Table 2). Harvesting entire trees requires that more fertilizer be provided, as the nutrient loss exceeds that of two canopy harvests.
Given the average concentrations of elemental sources (mineral and organic), available in the region, the average volume of fertilizer required to replenish the quantities exported by the total biomass removal would be 5238.51 kg ha−1, while pollarding reduces this amount by 44%. When the volume accumulated in sequential management is factored in, the reduction becomes 26.37%.

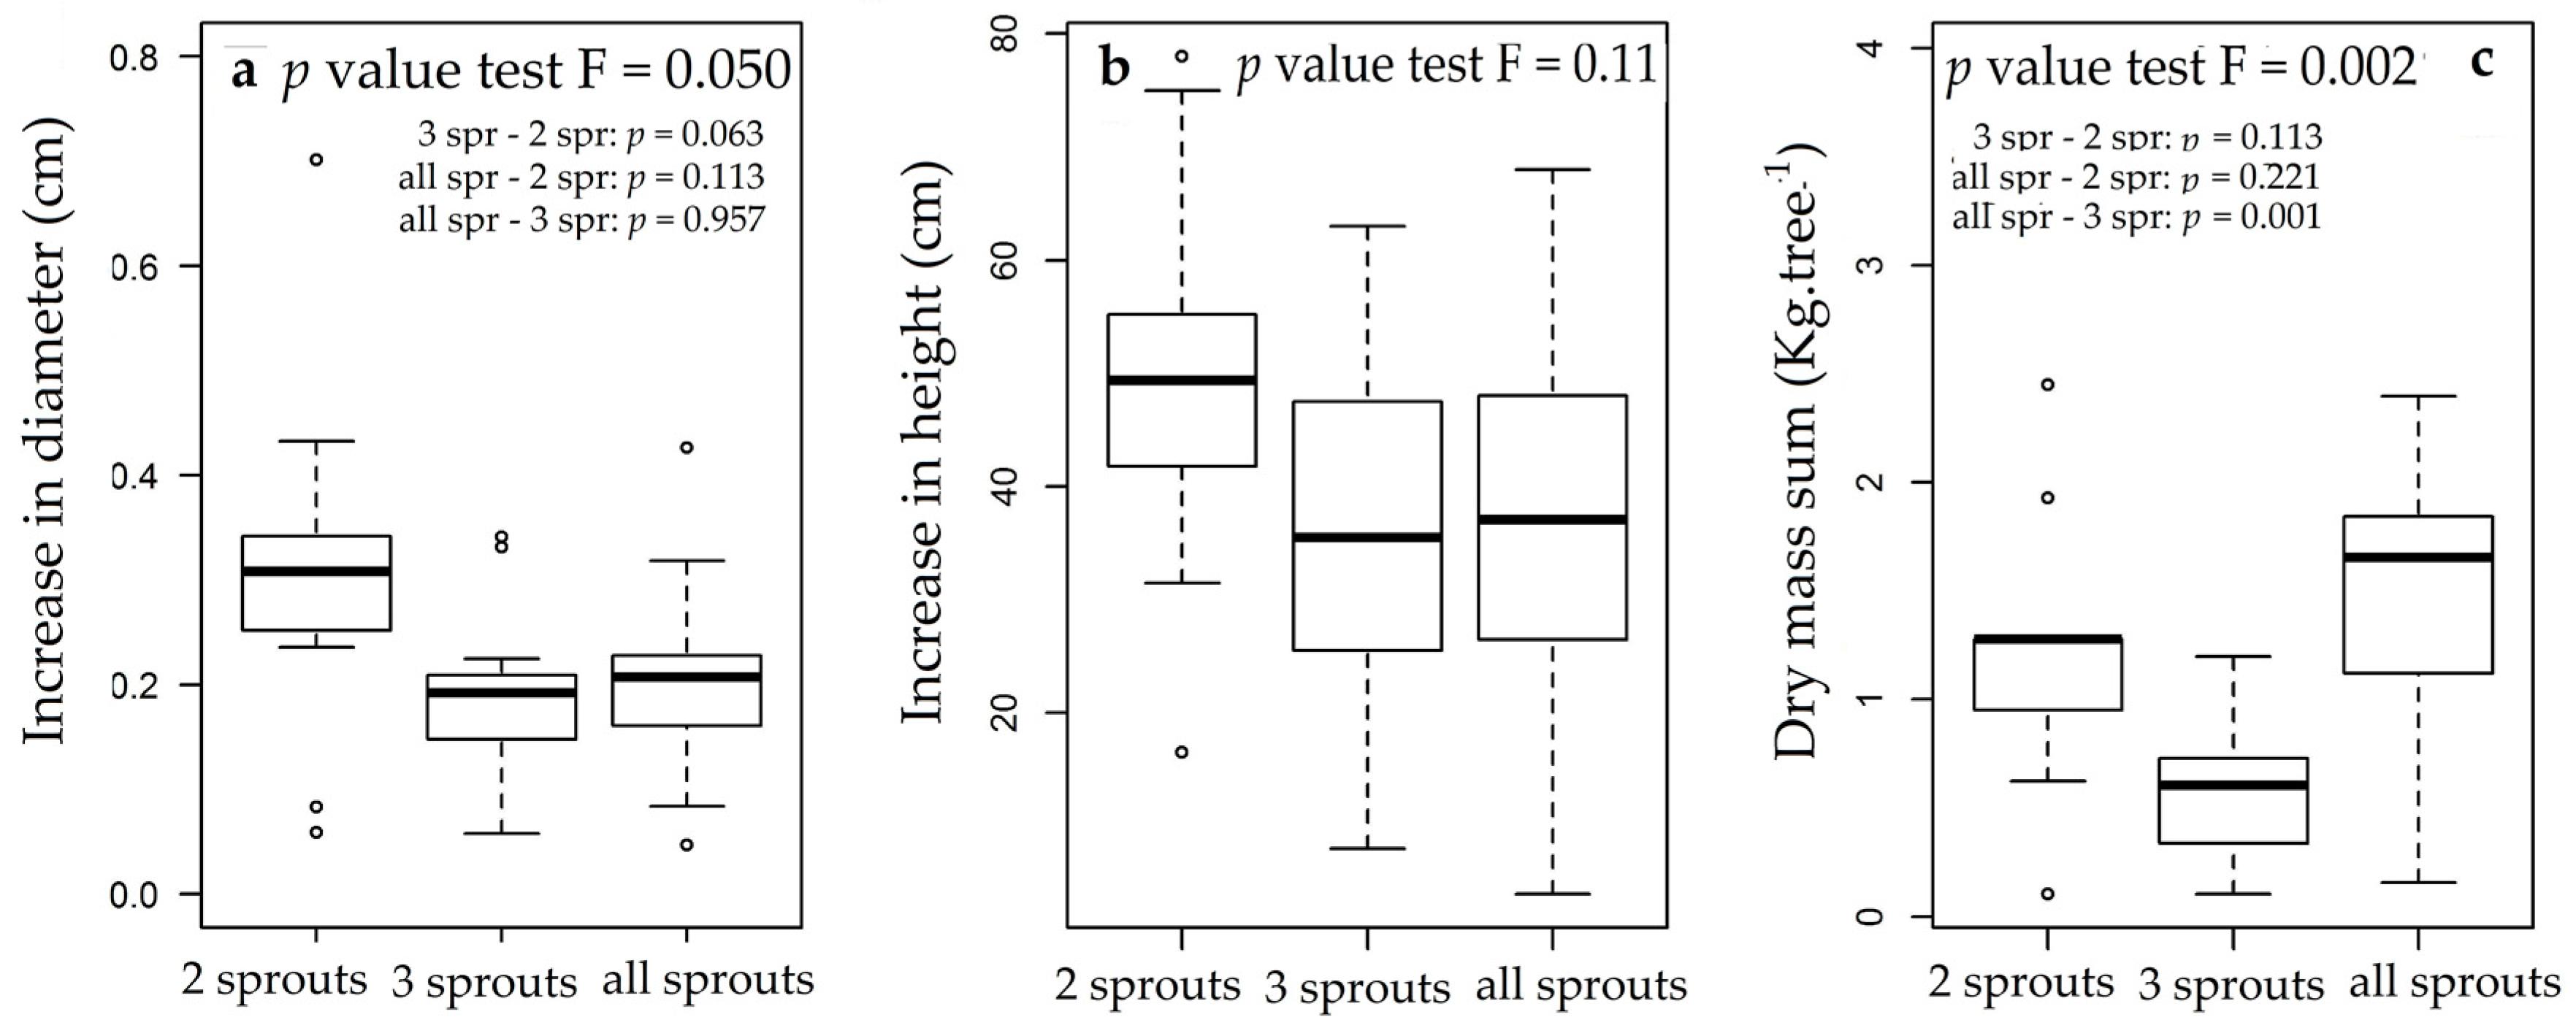
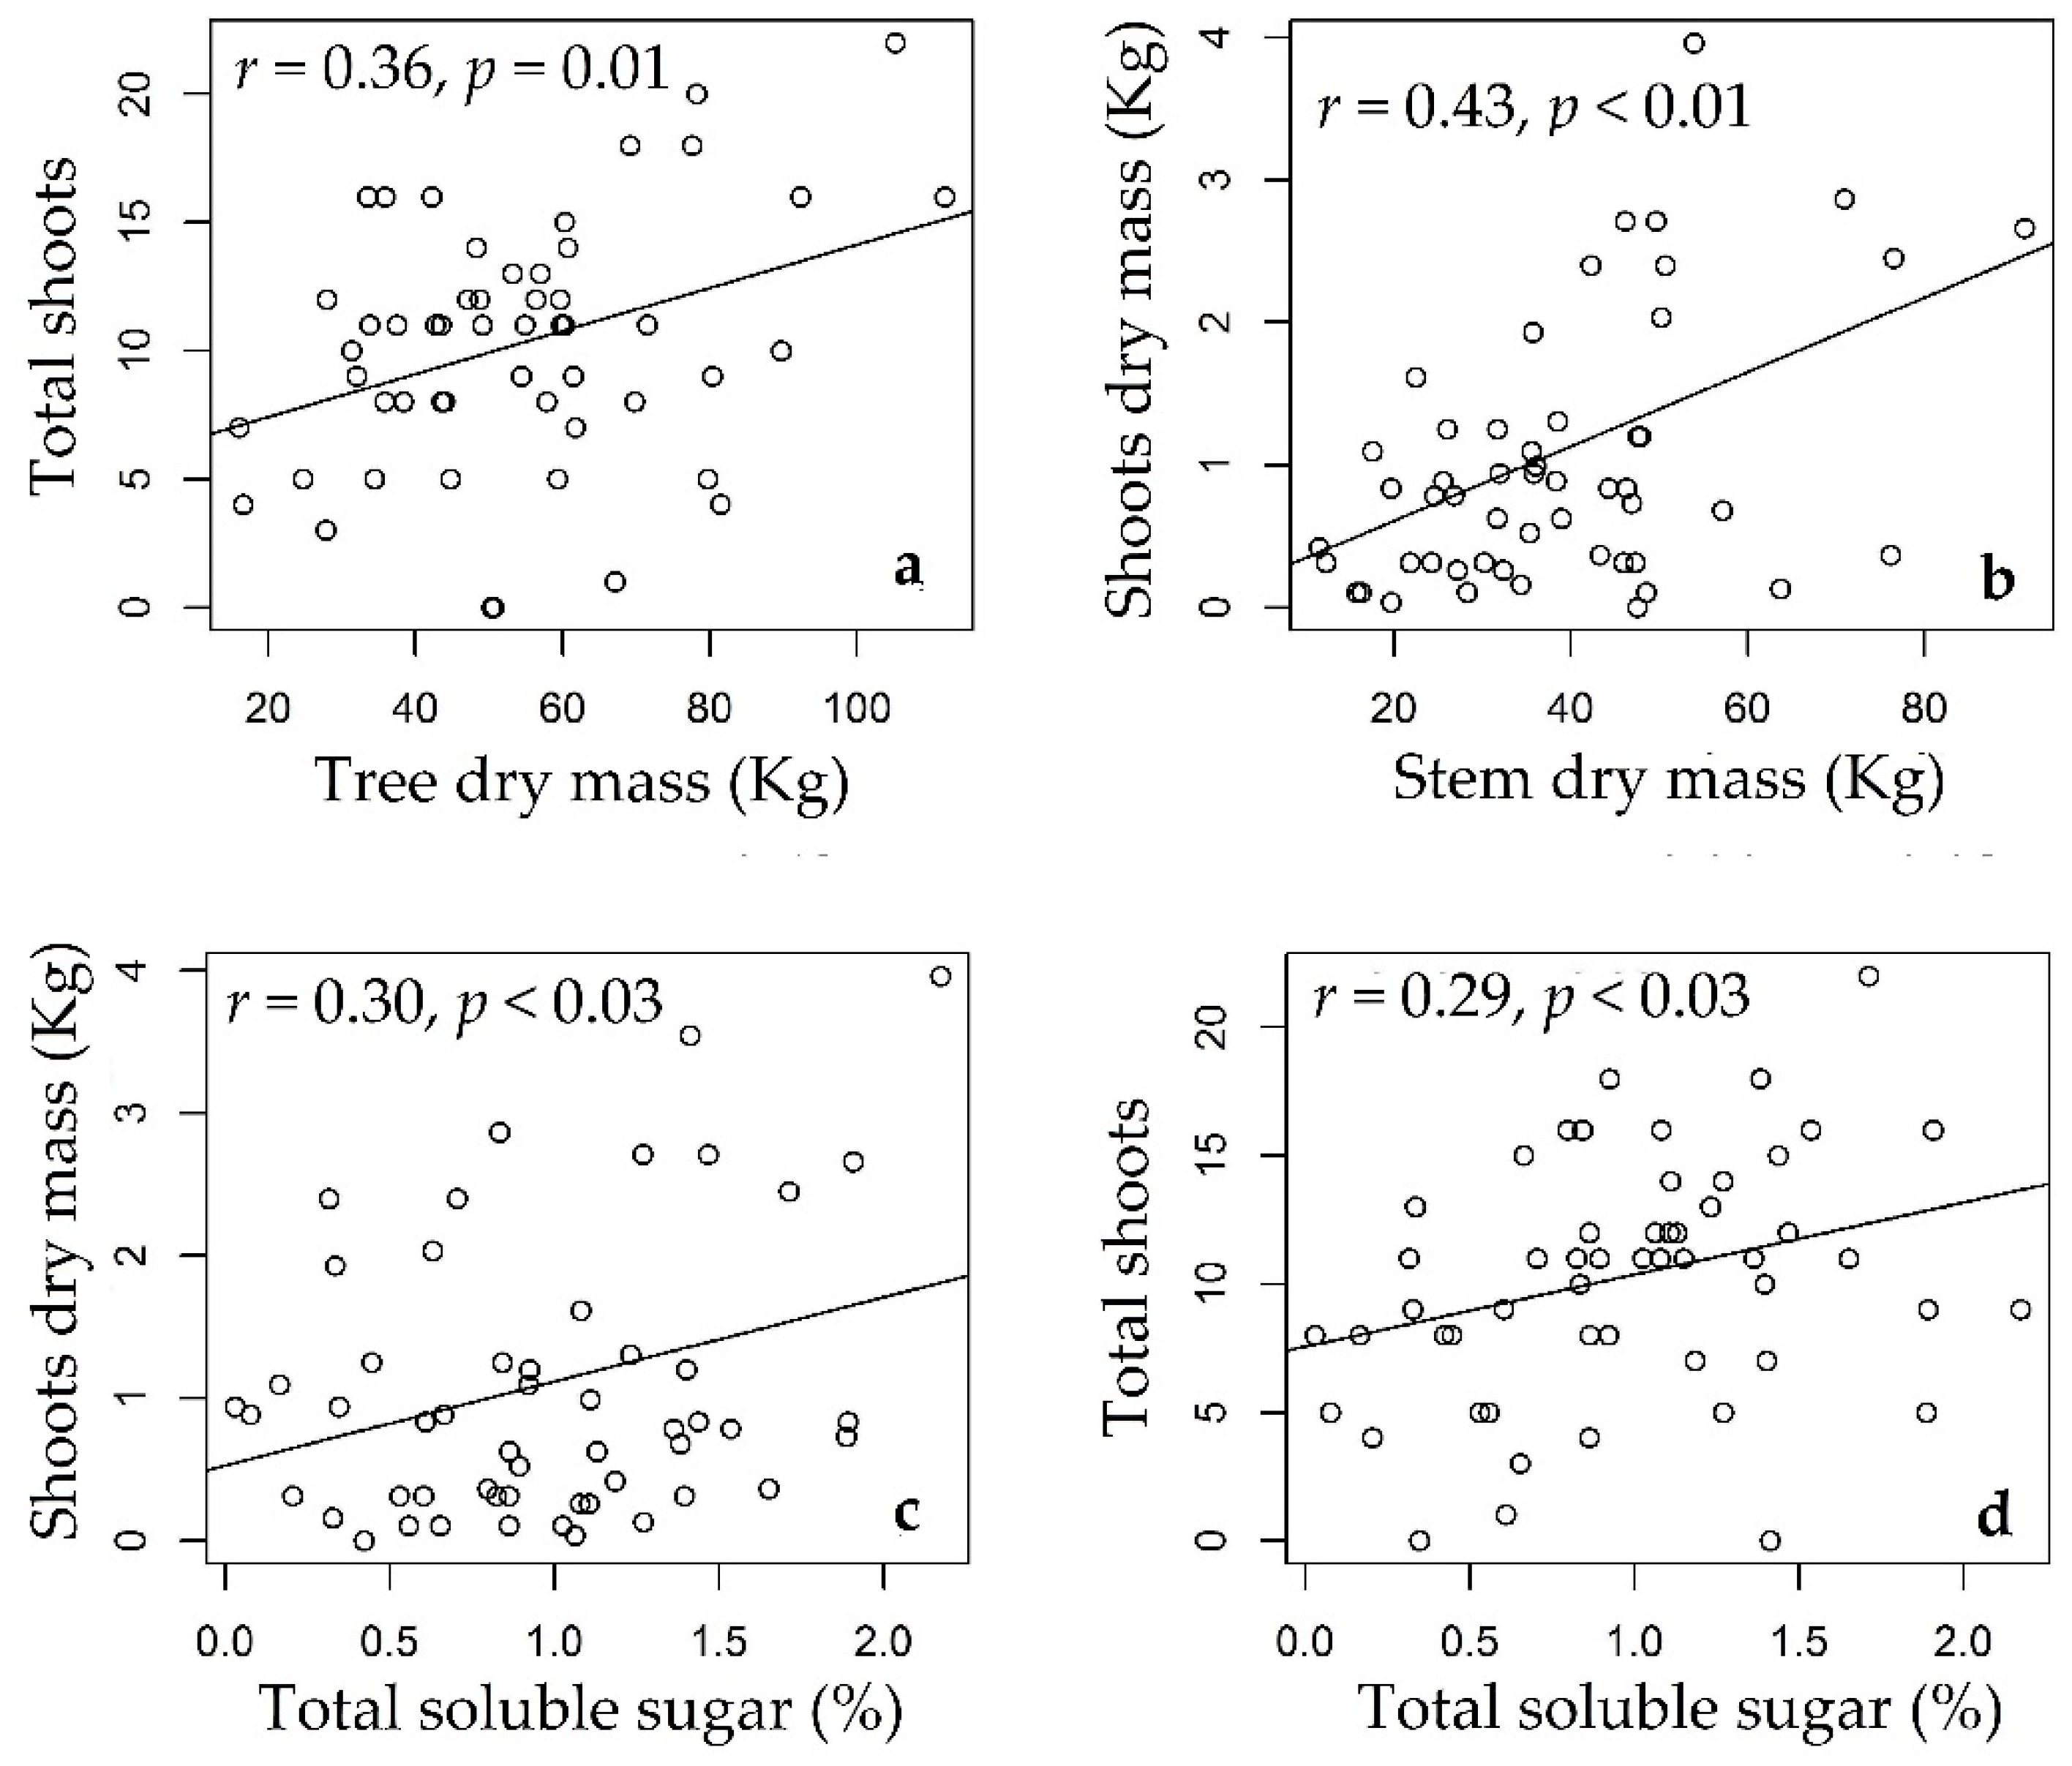
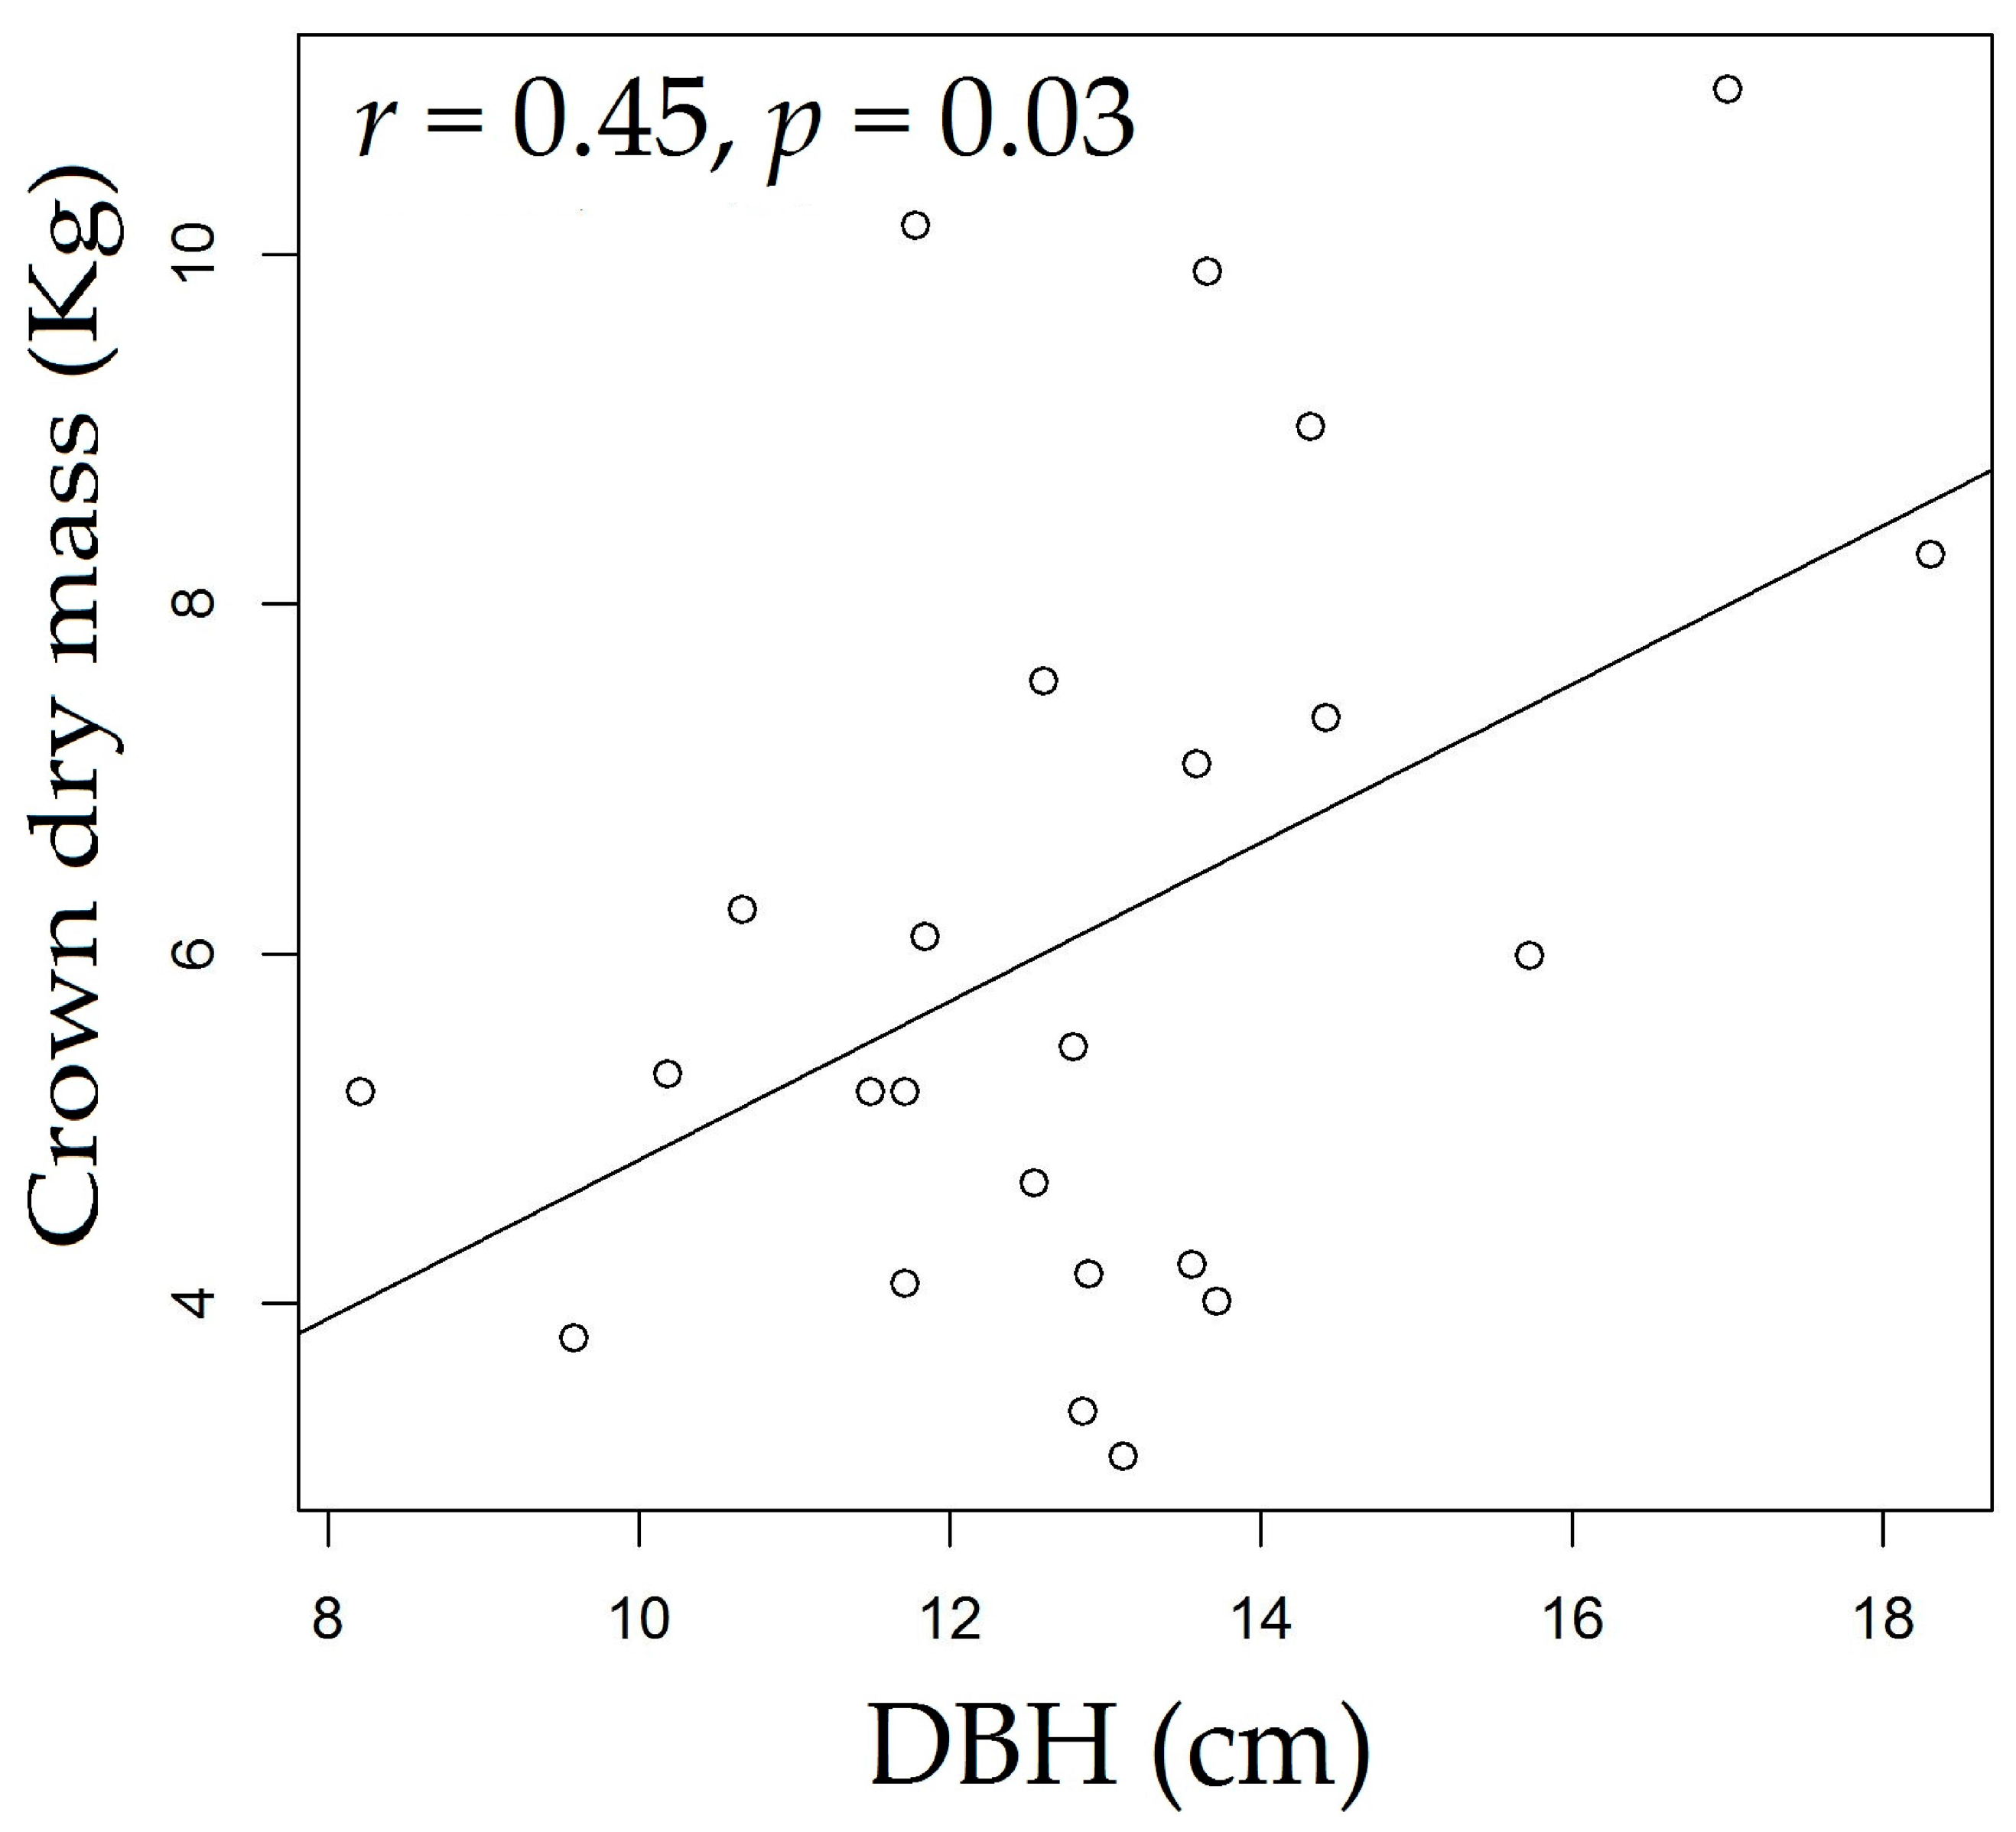
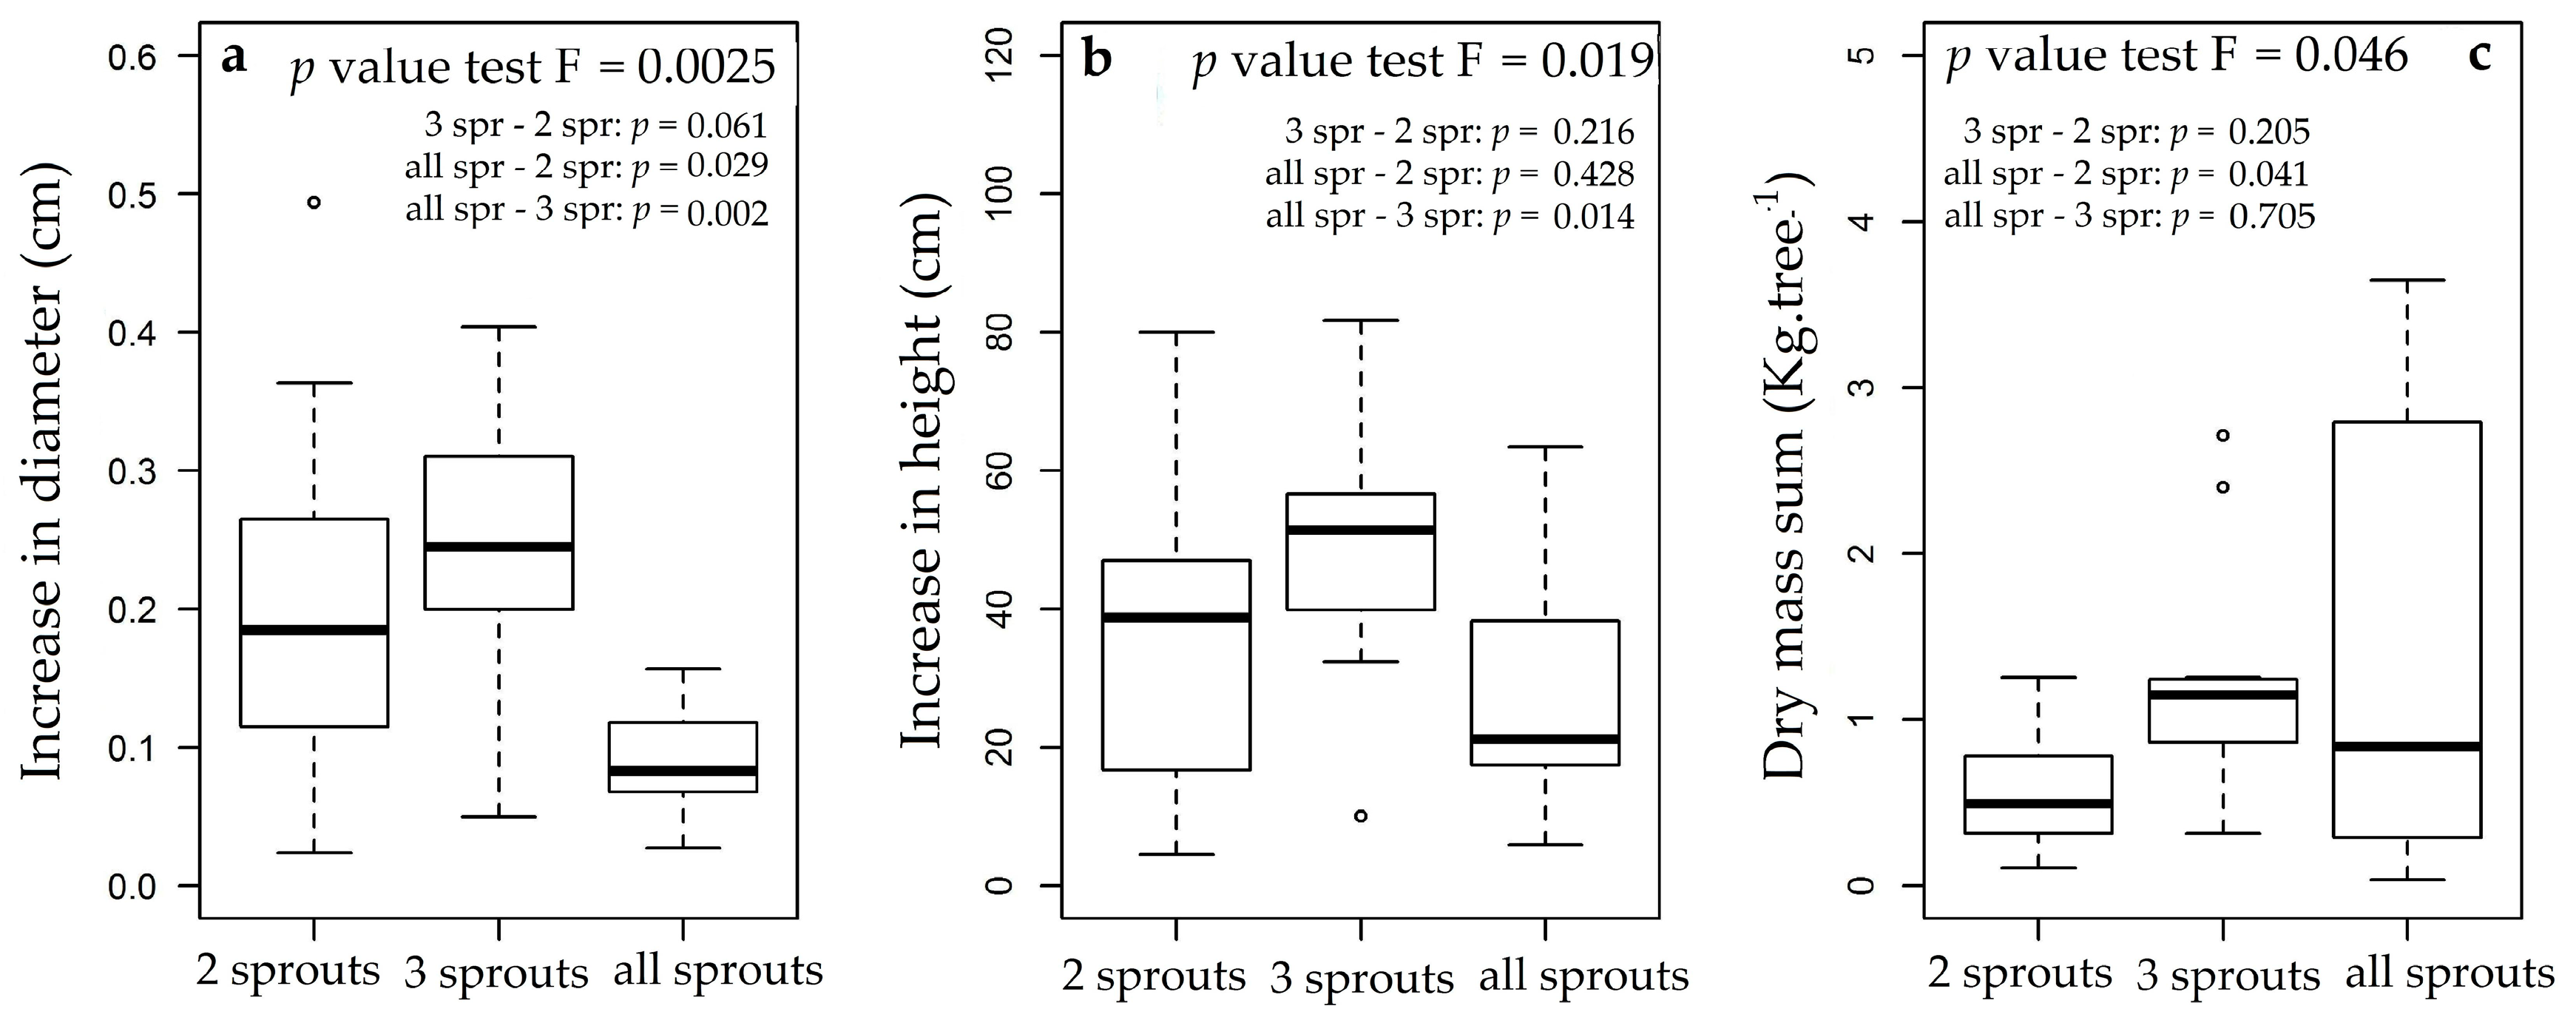
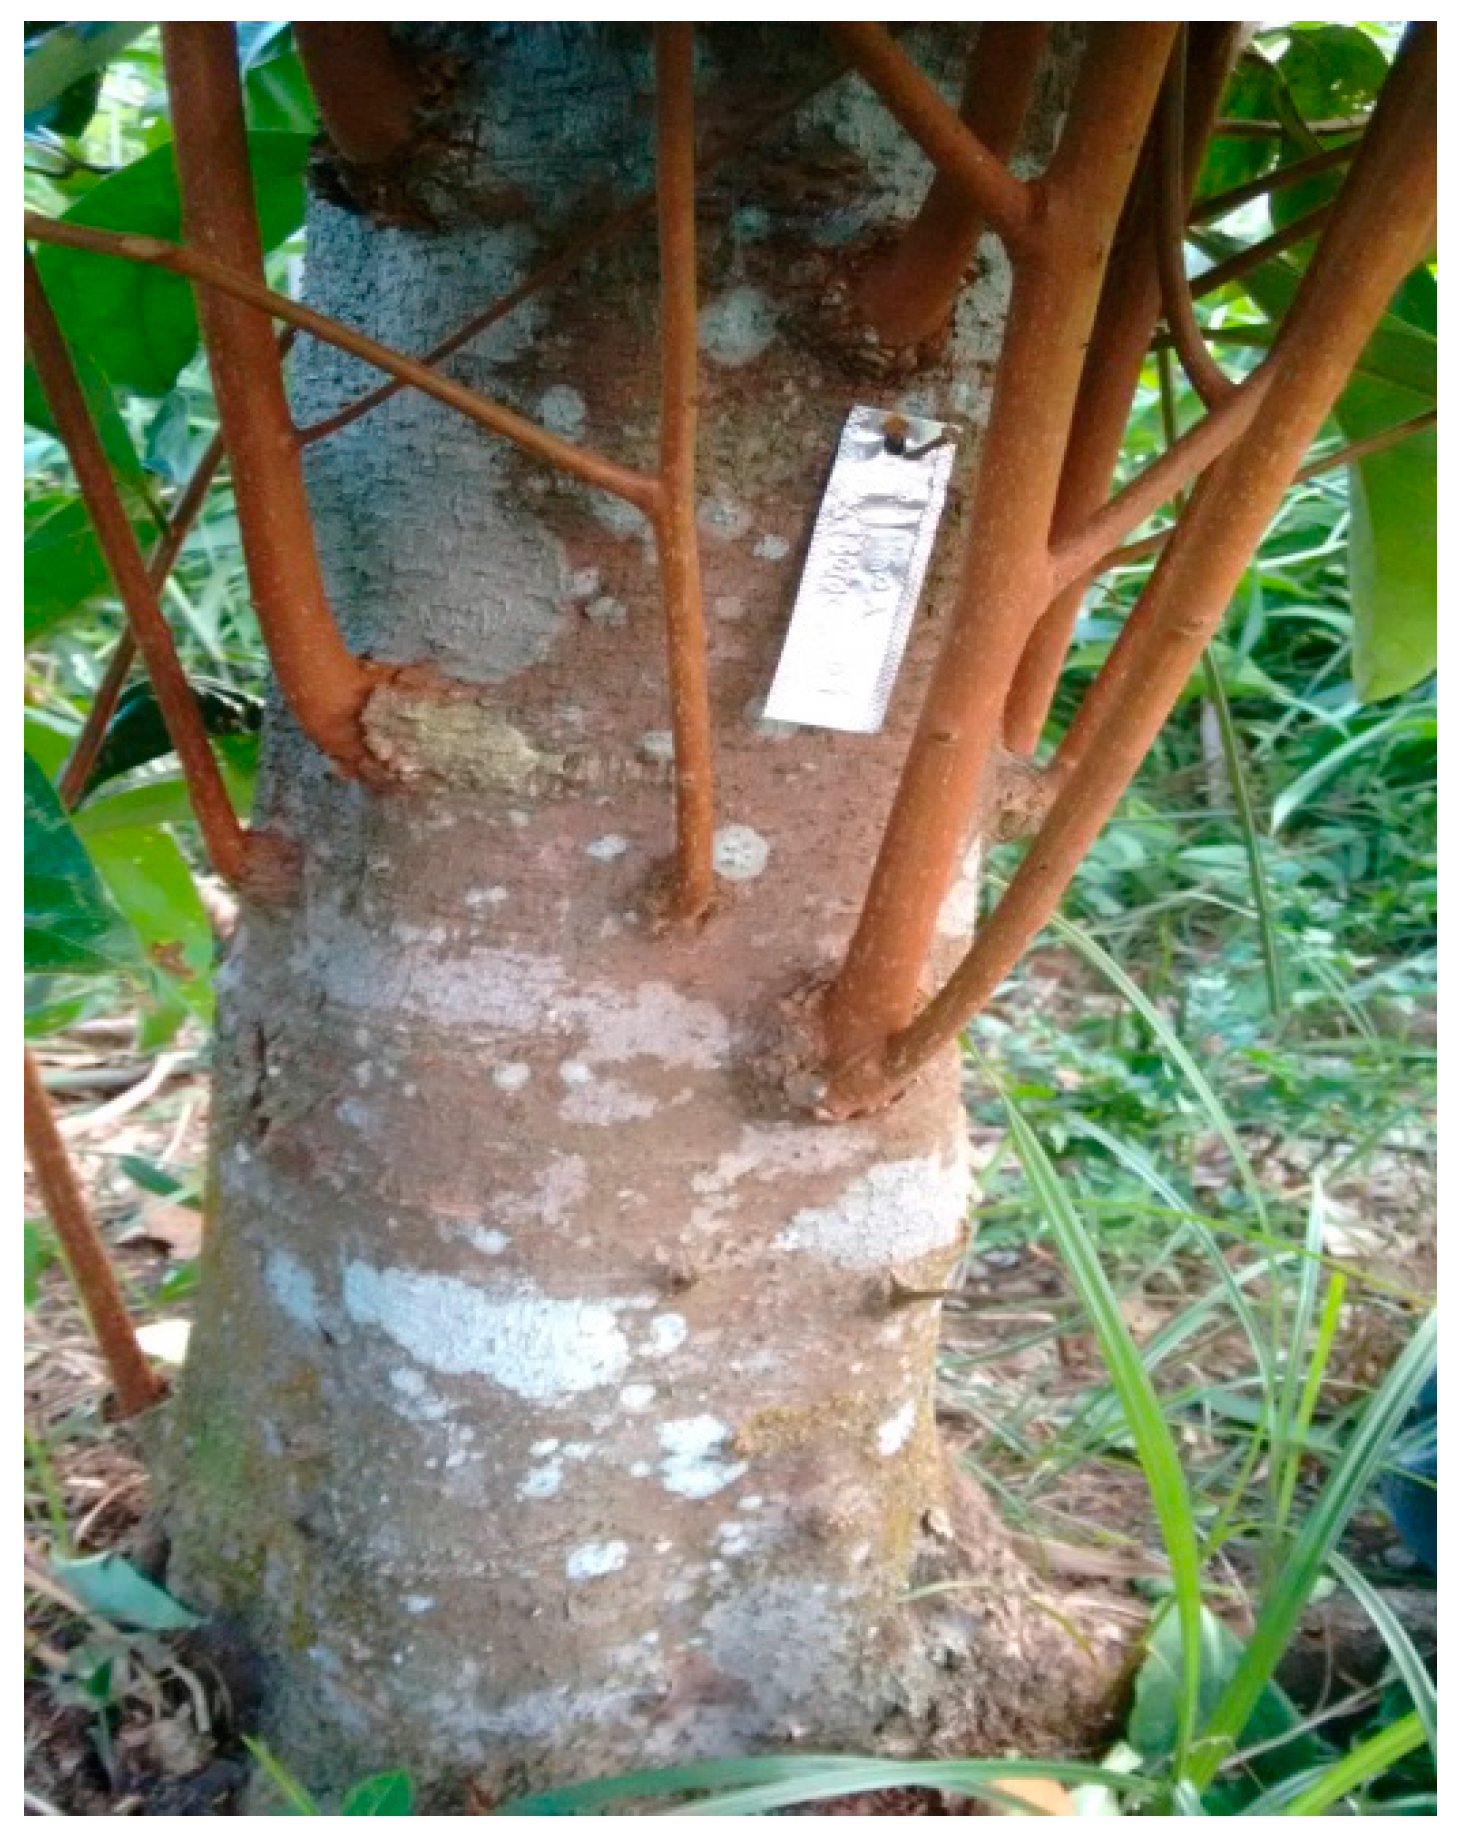
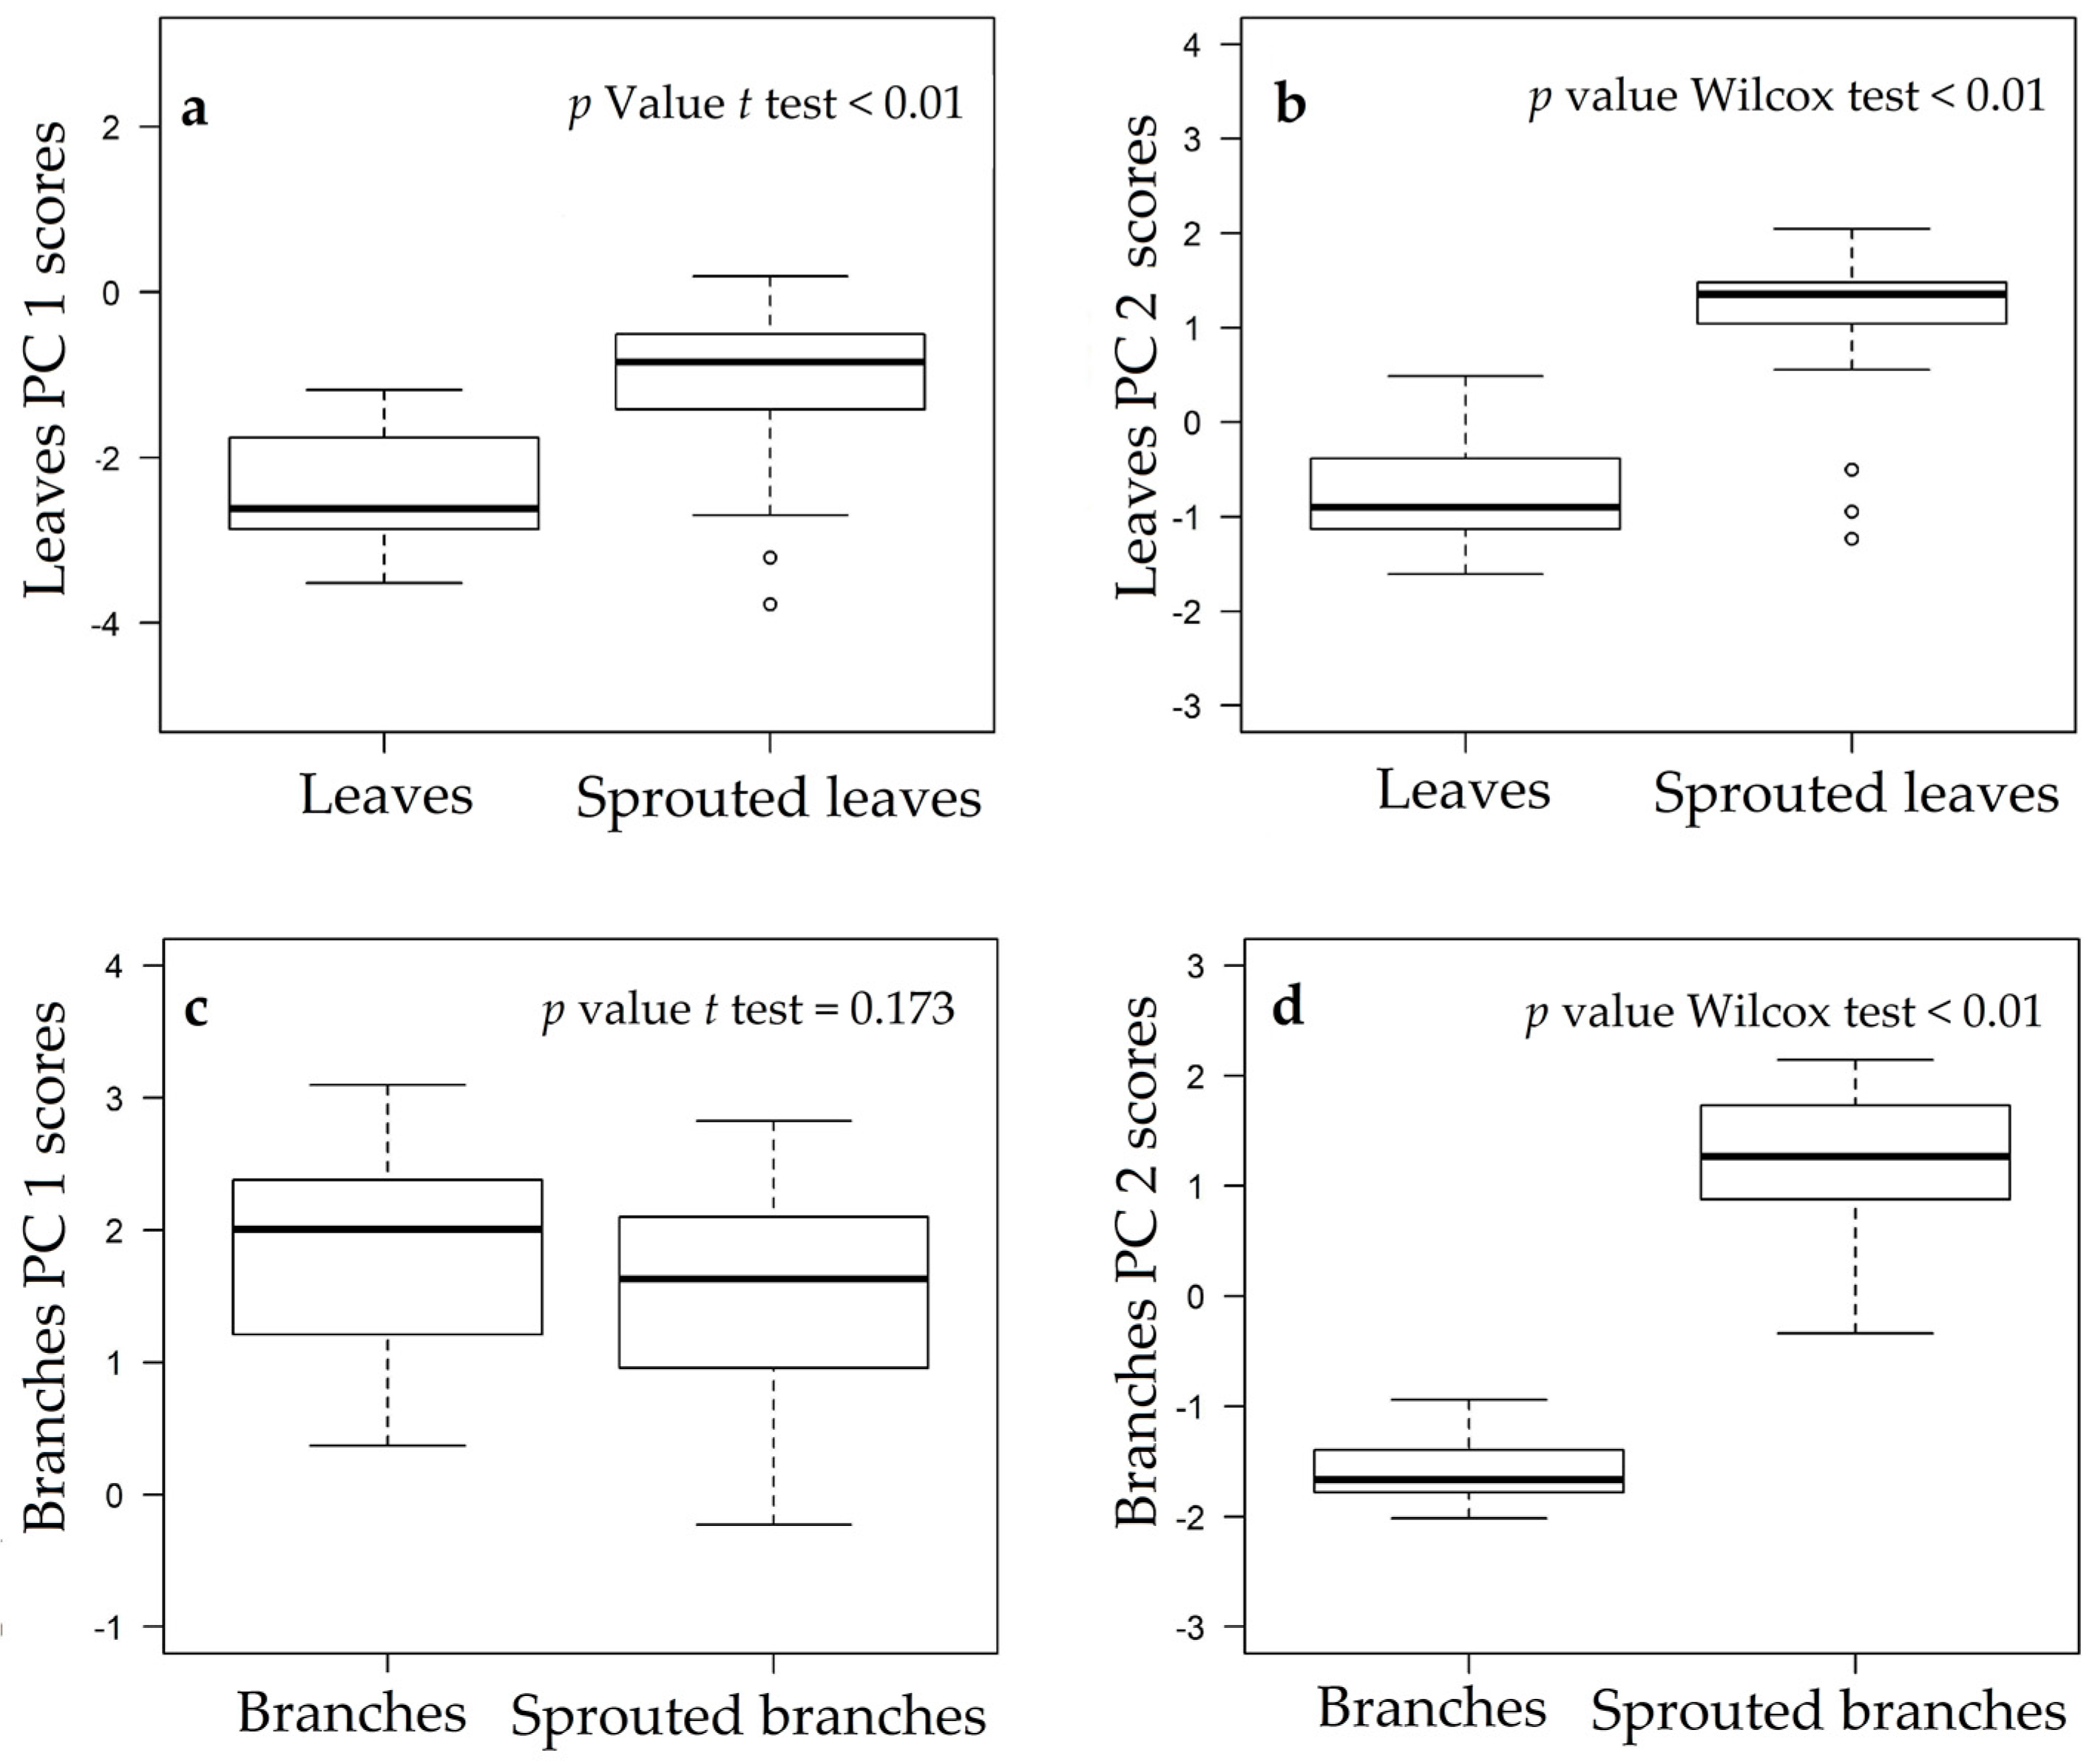
3.3. Rosewood Shoots Following Above-Ground Biomass Management

Regrowth involved, on average, 8.83 shoots per stump in C10 and 10.30 in C12. None of the trees with pruned crowns died, while 25% of the trees managed with cutting to a stump died during the regrowth follow-up period (18 individuals out of the managed 72). There was no initial mortality, with all individuals beginning a regrowth process.
When a trunk is cut, rosewood trees produce epicormic buds, with laterally emergent shoots. These were located more frequently on the upper half of the stump (Figure A18). For total shoot growth, C10 had a mortality rate of 12.57% (40 of 318), while this was 11.05% (41 of 371) for C12. Removal of two and three shoots were responsible for the removal of 73.34% of total shoots in C10 and 75.51% in C12.
There was a significant trend in increasing average shoot increment with decreasing shoot number (Figure 7a,b). An ANOVA of height increase data found no significant results (p = 0.078), although the two data sets (diameter and height) had a highly significant correlation (r = 0.86, p < 0.001). At the end of the evaluation period, per individual sum of re-sprouted dry mass was measured and the result was the opposite of the means of diameter increase and height. Yields of two and three shoots were not significantly different (p = 0.965), while dry mass of all shoots was significantly higher than three shoots (p = 0.007, Figure 7c). The same trends were observed when the analyses was performed separately for each location (Figure A8 and Figure A9).
Investigation of possible influences of pre-management status (biophysical variables and roots chemical attributes) on tree sprouting capacity, found significant correlations between total sprouts and tree dry mass (r = 0.36, p = 0.01, Figure A10a and r = 0.43, p < 0.01, Figure A10b) and between sprouted dry mass and pre-cutting trunk dry mass. For harvesting by cutting, significant correlations were found between TSS concentration and dry shoot mass (r = 0.3, p = 0.03, Figure A10c), and between TSS and total shoot number (r = 0.29; p = 0.03, Figure A10d). For pruning the highest correlations were between canopy dry weight resprouted and the tree DBH (r = 0.45, p = 0.03, Figure A11).

4. Discussion

4.1. Changes in Nutritional Status Associated with the Management of Rosewood Plantations

Multivariate analysis distinguished between chemical attributes of branches and leaves from the reference sample in relation to regrowth, and identified the most significant variables in data ordering trends. For reference sample leaves, there was a partial overlap between C10 and C12, while C17 data overlapped less what may be a result of intrinsic differences between the sampling regions and trees genetic origin. Leaves from the regrowth sample had the greatest data ordination spread, with the greatest variation coming from C10. Group formation trends were explained by the higher concentrations of P and K and lower concentrations of Ca, Mg, Mn in regrowth material. For shoots, the pattern of distinct grouping between reference and regrowth samples is explained by the greater concentrations of N, P, K and Mg and lower concentrations of Ca and Mn in the sprouting (regrowth) samples.
The results obtained confirm the findings of previous studies, where variations in nutrient concentration were linked to differences in tissue age and nutrient mobility [23,58]. Greater or lesser concentrations of some nutrients in the regrowing tissues occurs as a result of increased metabolic activity linked with the capacity of translocated nutrients from subterranean organs to above ground plant parts [59,60], which was observed in managed rosewood plantations.
Fleck et al. [41] studying post-fire and post-fall regrowth of two Mediterranean plant species, Arbutus unedo and Coriaria myrtifolia found higher concentrations of N, P and K in regrowth leaves when compared to the control. This was also found in rosewood regrowth, most evidently for P and K. Some studies indicate that, for species that do not store reserves in underground tissues (as tuber-producing species do), the highest concentrations of nutrients in sprouting tissues occur mostly due to an ability to acquire, directly from soil, those elements necessary to meet the physiological requirements of sprouting [61].
Improvement in photosynthetic rate is one of the widely-described effects of the increase in nutrient content of regrowth material [41,42,62]. Other reported differences include chlorophyll levels, rubisco activity, carotenoid content and an increase in the flow of soil water to leaves [41,42], as well as modifications related to transpiration rate and stomatal conductance, which induce leaf cooling. These changes, coupled with a reduction in leaf area without proportional reduction of the surface of water-absorbing roots [41,62,63], are a response to the absence of photoinhibition of photosynthesis in sprouting plants. The latter is a widespread phenomenon that is known to occur in rosewood seedlings [64].
That sprouting stems have a significantly higher N concentrations than sprouted leaves is a result of their participation in the processes of ionic absorption, photosynthesis, respiration, multiplication and cellular differentiation driven by the higher metabolic activity of juvenile tissues [65]. In sprouted stems, the greatest changes were observed in relation to the reference sample branches, which were noted in the field as being tender and greenish-red. The notable differences between reference and regrowth shoots are supported by the higher coefficient of variation of their groupings in relation to leaf groupings. At the start of regrowth, material produced by managed stumps and crowns are astes, petioles and branches, which become woody as maturation progresses. It is of interest that, during sprouting, only those parts capable of partly meeting of the demand for photoassimilates accumulate, this being linked to initial differences in the photosynthetic capacities associated with the structures involved [65].
P is a component of sugar phosphates, nucleic acids, nucleotides, and coenzymes, and plays a central role in reactions involving ATP, which occurs in higher concentrations in juvenile tissues [61]. An understanding of how this nutrient is used in rosewood shoots is key since low P levels are considered the main limiting factor for the development of agriculture in the Amazon [66]. Deficiency of this element results in undersized plants, with appearant necrosis on the leaves, fruit and stems, and leaves that are twisted and colored reddish-purple, a trait associated with anthocyanin accumulation [61,67].
Besides being a cofactor for more than 40 enzymes, K is the principle cation for establishing cellular turgor and maintenance of cell electroneutrality [68]. Present in lower concentrations in the foliar tissues of regrowth samples are those elements classified biochemically as nutrients that remain in ionic form; Ca is a constituent of the cell wall middle lamella, which explains its significantly higher concentration in reference sample shoots, and older woody tissues. The Mg is a constituent of chlorophyll and is required by many enzymes involved in phosphate transfer. It occurred at lower concentrations in foliar tissues, but was significantly higher in regrowth shoots, an event which occurs for the same reasons as high N concentrations.
On the dendrogram, branches and leaves were organized according to their similarities, and separated by criteria of dissimilarity in chemical attributes, which led to the presence of two groups, one of leaves, the other of branches. Within each group, subgroups were present, distinguishing by chemical attributes of the reference and regrowth samples. Attribute characteristics of the same group are similar to each other and different from that of other groupings, leading us to conclude that the management of above-ground rosewood biomass promotes differentiation of chemical attributes of leaves and branches, which may result in essential oil with a composition qualitatively distinct from those currently required by industry.

4.2. Nutrient Export during Sequential Management of Rosewood Plantations

Production of essential oil in rosewood occurs in all its parts of the tree [10,19]. If a biomass harvest is totally removed then no material remains at the planting site, and so no further contribution decomposition-mediated nutrient cycling is possible [27,28,29]. For the first harvest, reduction of nutrient exports by pruning management compared to full-cut management was 43% for N, 54% for P, 57% for K, 46% for Ca, 31% for Mg, 49% for Fe, 30% for Zn and 41% for Mn.
For the subsequent rotations via pruning, nutrient exportation values for the second harvest were 26% N, 36% K, 40% Ca, 10% to Mg, 29% Fe, 7.1% Zn and 19% of Mn from samples from sequential management of whole trees. Values were directly influenced by biomass regrowth which added to the greater concentration of nutrients in tissues with the highest metabolic activity. From a long-term management perspective, three or four crop rotations per pruning would be required for the levels of exported nutrients to equal those exported in a single harvest where a whole tree is cut and removed. Similar results have been reported by Witschoreck and Shumacher [31], in a study of Eucalyptus saligna management. These authors concluded that harvest intensity may represent the difference between a sustainable nutritional management and one deleterious to nutrient reserves.
In terms of need for nutritional replacement, it is important to recognize that the exported nutrients were stored by the plants throughout their cycle and the use of incorrect fertilization techniques can generate both economic and environmental losses [23]. As trees do not have the capacity to absorb and store large quantities of readily available nutrients, unabsorbed elements may enter in the soil solution, percolate deeply and then contaminate water resources. The return of the residues after the distillation to extraction of essential oil to the soil of the plantations can be an alternative to be considered, however the nutritional qualities of this residue as well as its decomposition rate are unknown. At present, all the waste is used as fuel (burned) in the extraction process itself. The objective of this work was to evaluate nutrient replacement techniques permitting maintenance of available soil nutrient levels after harvesting [31], what was done with the two harvest types applied.
This is important since, given the international market requirements for use of synthetic industrial fertilizers and non-organic pesticide use, there is a need to determine whether the nutrient cycles in Amazonian soils in areas producing rosewood can be maintained through the natural biochemical processes themselves. In general, soils beneath the Amazonian forest have low chemical fertility, and the natural forest survives by highly effective nutrient cycling, combined with heat, high humidity and great biological diversity [27,69]. The introduction of organic fertilizers, and deployment of intercropping techniques using fast-growing, N-fixing, herbaceous species may provide an alternative means of attaining soil organic matter stability [70], improving and adjusting current pH values and low mineralization [51] while avoiding damage to soil quality with consequent diminished crop productivity.

4.3. Rosewood Shoots Following Above-Ground Biomass Management

The allometric variables of dead individuals were not significantly different (p > 0.01) from those of living ones, being not the size of the managed plant the reason that caused mortality. Mortality may be related to an initial difficulty in acquiring post-disturbance resources [32,33,71]. In this study, no results were found to explain the mortality of individuals.
Even if some plants die, the economic and environmental regulations imposed by law support the use of coppice in rosewood plantations and may play a primary role in generating raw material for the production of the commercialized essential oil. Higher average shoot diameters and height increments of two and three shoots, leads to the conclusion that conducted management by coppice increase biomass production during the evaluation period. However, the significantly lower mean values of sum of dry mass, leads to the conclusion that the time for this management effect on the increment of mass per tree is higher than the evaluation period.
The need to replant a seedling for each tree felled impedes the effectiveness of rosewood harvesting by total tree cutting [10]; it can be difficult to acquire seedlings costs of area preparation are high. In addition, young plants not only need time to adapt and grow, but competing weeds must be managed until canopy closure occurs [8]. This is especially important for rosewood seedlings which, in the first year of cultivation, need to be protected from directly incident sunlight in order to avoid photosynthetic photoinhibition [64]. In contrast, weed control is rarely required during with coppicing and canopy closure is achieved quickly [60].
There was no significance correlation between stump diameter and either shoot diameter or height. Such shoot diameter results differ from those of Ohashi et al. [36], who measured six-year-old shoots from 15–22-year-old trees and found a high correlation between these variables. On the other hand, for shoot height, our results were in agreement with Ohashi et al. [36], who also found no significant correlation.
The current study recorded an average of 9.57 shoots per stump, while results from the only other work available on the subject, Ohashi et al. [36], reported an average of 2.6 shoots per stump, six years after cutting. It is known that competition between shoots will reduce the number of persistent post-management shoots over time [72], and that pollarded plant regrowth depends on the stock of dormant buds [73]. The eventual number of shoots also depends on the initial number on the stump, and the degree of competition between stumps, primarily for light [74].
Our results are consisted with the notion that successful rosewood regrowth is more strongly related to a capacity to sustain post-harvesting nutrient acquisition than to an ability to mobilize reserves of nutrients stored in the roots. Similar results were reported by Zambrosi et al. [61] from studies on the influence of P levels on plantation sugarcane shoots. Correlations between regrowth and TSS ratios confirm a need by rosewood plants for this reserve to meet respiratory demands and for regrowth after losing photosynthetic capacity. Fang et al. [42], studying regrowth ecophysiology, describe a decrease in TSS concentrations during the regrowth process, wherein root tissues became the source in a source-sink system. This agrees with other studies that have concluded that a capacity to mobilize such reserves, and so support sprouting shoot growth, is predominant in the period following pollarding [34,36,75,76,77].
Root reserves carbohydrates change dramatically throughout a plant`s life, decreasing rapidly with budbreak and early vegetative and reproductive development, and then increasing late in the growing season, usually after cessation of vegetative growth and fruit maturation. Accumulation of these reserves is very sensitive to late-season stresses and management practices, and decreased accumulation can profoundly affect a tree’s performance the following year [78]. In addition, it is reported that shade-tolerant species, such as rosewood, can regrow vigorously independent of underground reserves, with above-ground carbohydrate reserves responsible for shoot persistence in the environment after disturbance and before photosynthesis begins [43]. Applying these findings to the management of above ground biomass of rosewood, it is necessary to consider that periods of high vegetative development may represent a good time for harvesting (since there may be rapid regrowth), but during this period the plants are investing in vegetative growth and are not stocking such reserves, which is of importance to studies aiming to find the ideal period of intervention in the above ground biomass.
For the biophysical variables in pre-disturbance rosewood plant, the heavier (dry mass) the managed tree, the greater the shoot mass and the greater the number of sprouting shoots. This was also observed for trees managed by pruning, where shoot production increased as a function of the increase in diameter. Investigating relationships between individual size and the capacity to grow after a variety of different disturbance types (fire, death of trunk by fire, trunk cutting) in different vegetation types, Vesk et al. [79] found that shoot production occurred in 43% of the studied species. Of these, 90% re-emerged after the cutting of young seedlings and in 70% of the species more than 90% of mature individuals sprouted after the cutting. In contrast, for mature Quercus petraea (Fagaceae) individuals in European forests, the probability of sprout out diminished with the increase in diameter [37], which may mean that the age X diameter relationship, may have a maximum level related to the ability to regrow.
Although specific equations for rosewood mass estimation have been recently developed [17], there are no similar studies evaluating the sequential frequency of above ground biomass production for rosewood. The increase in frequency of mass loss causes changes in the content of carbohydrate stores available in reserve tissues for the production of subsequent shoots [75], while resource allocation patterns and the capacity for continuous regrowth may be influenced by the disturbance regime to which the species are adapted [43], which is unknown in the case of rosewood. Plant responses to injury are ecologically and evolutionarily important, allowing sprouting individuals to persist in the environment without changes in population size, while non-regenerating species face the challenges of seed-based regeneration, including pollination failures, the uncertainties associated with dispersion, seedling mortality, and competitive interactions while growing [33]. This makes the regrowth mechanisms important as indicators of how plants will react to ecological dynamics and in determining the likely responses of a species to the threat of extinction, as well as to the methods used in plantation management.
The production of shoots after disturbances may be genetically-controlled [60], and is generally seen] in environments where fire or intense herbivory are common [32,71,80,81,82]. Rosewood plants evolved in environments where natural fires are extremely rare, which rule out the possibility that the observed regrowth capacity of rosewood is the result of natural selection. Additionally, the study plantations were not the product of any selected breeding program (founding seeds having been wild-collected). However, while extractivist exploitation date back to the 1950s until 1980s, the first commercial plantations of the Brazilian Amazon began in the late 1980s. Consequently, it is likely that the seeds used to establish the plantations contained genetic material of those plants that managed to persist in the environment after successive waves of exploitation. Thus, resprouting ability may be a recent adaptation by rosewood to the former full-cut methods of human exploiting this species.

4.4. Future Management of Rosewood Plantations

The valuation of forest resources is well-established and is, every day, strengthened by academic results. However, historically, the benefits from exploiting these resources, such as the rosewood, have led to excessive deforestation. The alternative to this environmental loss is the search for forest sustainability in the Amazon region, which is key to reducing deforestation. The possible increase in the demand for rosewood essential oil is controlled by the legal prerogatives that exist today, which decrees full protection of the species, being its use restricted to commercial plantations [83]. All economic forestry activity in the Amazon must be regulated and deforestation in private areas is restricted to 20% of the total of the same [84], where the productive factors must be optimized.
With these aspects in mind, it is necessary to develop alternative techniques for the use of forest resources that improve the technological standard already available, adapted to the ecological and economic conditions of the region. Forestry is still incipient in the Amazon in contrast to the strong extractive culture traditionally used over time. In its theoretical conception, vegetable extractivism is a very fragile economy to be the basis for the sustainable development of the Amazon [85]. This practice is subject, among many other factors, to the reduction of the resource in nature, which happened historically with the rosewood and impacted the biodiversity, seen by the exhaustion of its natural populations.
Intensified land use, with the integration of degraded, altered and/or underutilized areas, represents a form of conservation of natural resources from Amazonian primary rain forests [16,85], opening space for technical development and efficient use of resources. There are few successful economic forestry models in the region, with few homogeneous plantations and agroforestry systems (mixed plantations). In mixed plantations the dynamics become more complex, while increasing the ecosystem function, which highlights the importance of research aimed at the development of appropriate technical and scientific models for economic growth and biodiversity conservation.
Today, the lack of such knowledge discourages the implementation of forestry practices in the Amazon, which contributes to deforestation at the time when natural forests are exploited. The results of this study greatly advance scientific knowledge concerning rosewood plantation production and management, and should greatly assist rosewood-based economic forestry and the conservation of the species, as well as an informed underpinning of the formulation of public policies of regulation and inspection for this key natural Amazonian resource.

5. Conclusions

Our study has important practical implications for the commercial management of rosewood above-ground biomass. Due to the differences in regrowing shoots, essential oil yield and chemical composition may differ from those pre-management, regardless of age or region. In terms of crop sustainability, canopy management substantially reduces exported macro- and micronutrients volume in comparison to tree cutting. When the whole stem of the pollarded trees are included, at least three pruning crop rotations are needed to export the same amount of biomass harvested in one whole-tree cutting. For the use of coppiced shoots from a stump pollarded at 50 cm above the soil, post-harvest shoot management is required to increase shoot height and diameter, with resulting increases in volume appearing only after 12 months or more. Regarding the ability to regrow, the ideal period for the management of above ground biomass should take into account not only the vegetative growth related to the capacity to regrow, but also the reserve of soluble sugars. For commercial plantations, the use of mixed management is suggested, with the emphasis depending on producer demands and the support capacity of the productive environment. In terms of plantation sustainability, use of soil organic matter management practices and/or nutrient replacement through fertilization is recommended in view of the large quantities of nutrients exported in the sequential management of above-ground biomass. The generated knowledge contributes to the use of sequential harvests in rosewood plantations, describing important factors concerning the different forms of above ground biomass management, thus contributing to this silvicultural practice becoming viable ecologically and economically.

Acknowledgments

The authors would like to thank to Carlos Magaldi, Zanone Magaldi and Akira Tanaka for granting the study areas and also thank to FAPEAM—Foundation Support Research in the State of Amazonas for the grant (grant 016/2013-POSGRAD 2013-INPA) and FAPESP—Foundation Support Research in the State of São Paulo (grant 2016/05219-9) for the financial support.

Author Contributions

P.M.K. collected the experimental data, did laboratory analysis, did data analysis and wrote the manuscript. D.R.A.d.A. contributed to the experimental design, statistical analysis and textual logic review. D.D. contributed with field data collection, laboratory analysis and textual logic review. P.d.T.B.S. and V.F.d.V.J. contributed to the construction of the work, logistical support and revision of the textual logic.

Conflicts of Interest

The authors declare no conflict of interest.

Appendix A

Table A1. Description of study areas showing values for: diameter at breast height (DBH) height (H), above-ground fresh weight of whole tree (AGFW), percentage of canopy fresh weight and form factor (FF) * of the trees in farmlands near Maués and Novo Aripuanã, Amazonas, Brazil.
Soil Management SystemDescription: Cultivated Areas
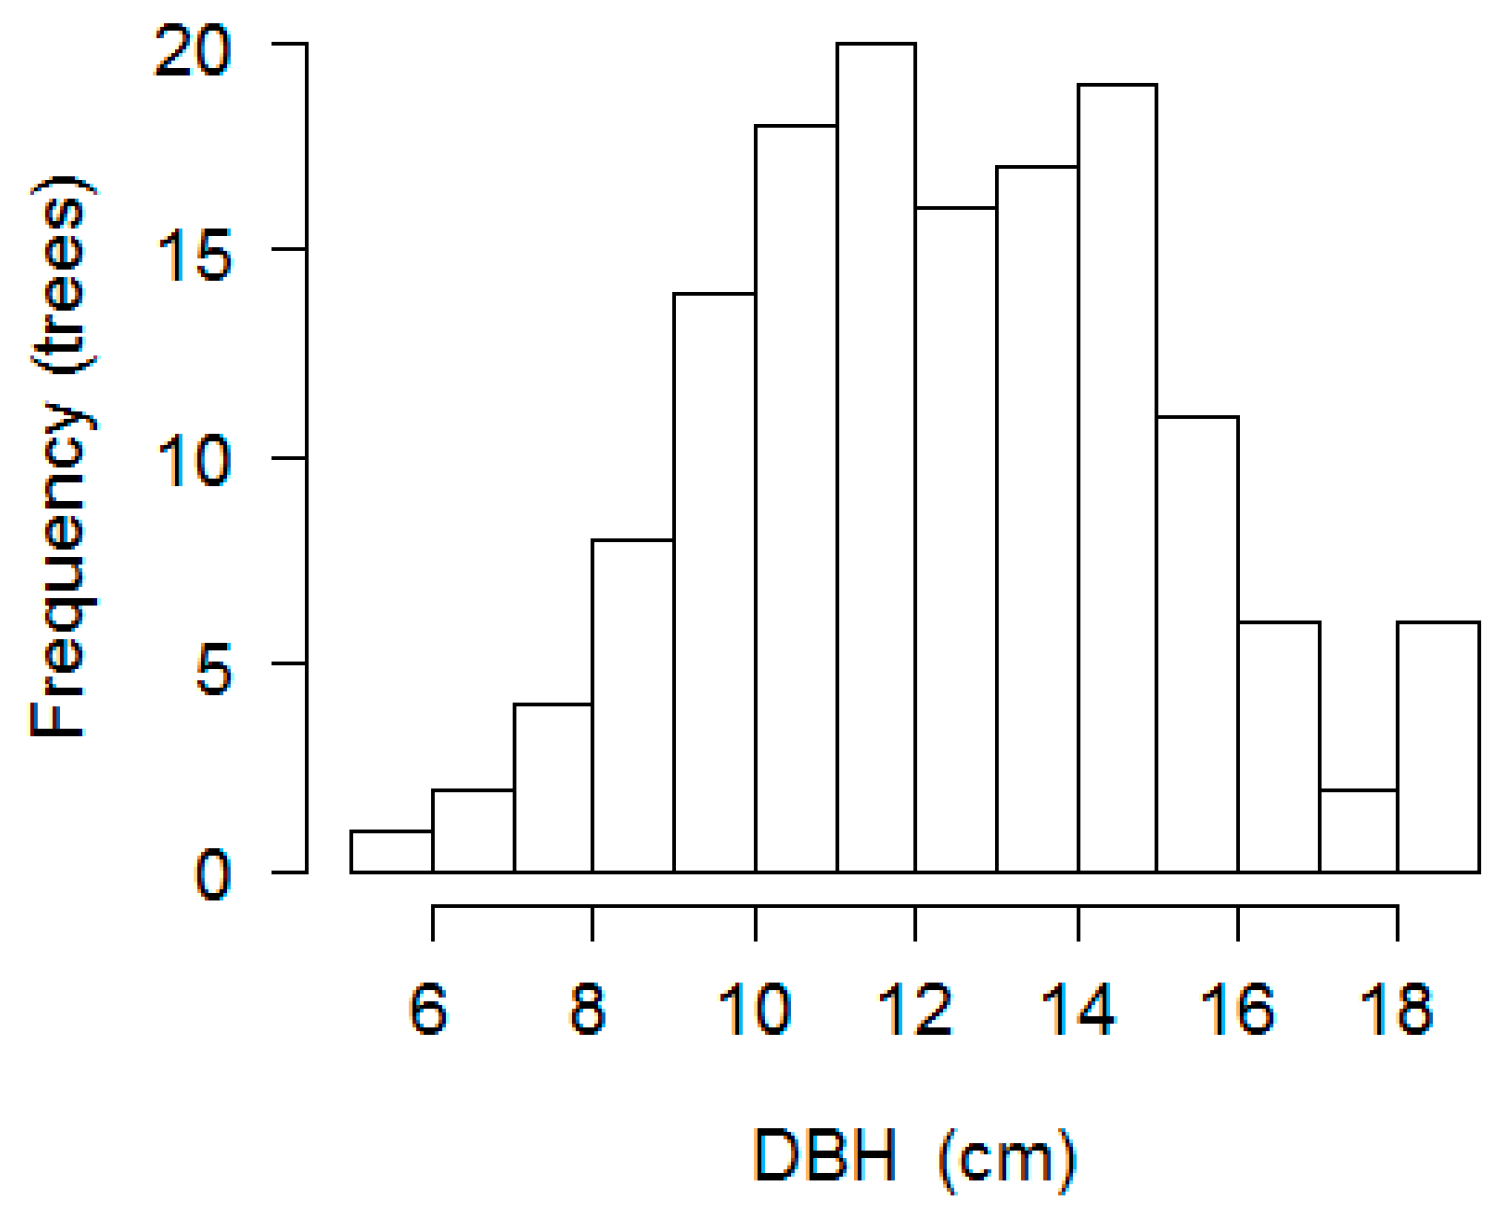
Rosewood plantations (cultivated for ten years): C10.Rosewood seedlings planted in 2005 with 3.0 × 4.0 m spacing, following cutting and burning of original vegetation. Individual rosewood plants had a mean AGFW of 102.47 ± 33.69 Kg, DBH of 13.88 ± 2.37 cm and H = 8.15± 1.39 m. (n = 36). Canopy percentage were 35.89 ± 6.91% and FF = 0.49 ± 0.061
Rosewood plantations (cultivated for twelve years): C12.Rosewood seedlings planted in 2003 with 1.5 × 2.0 m spacing, following cutting and burning of original vegetation. In 2010 following systematic thinning, spacing was 3.0 × 4.0 m. Individual rosewood plants had a mean AGFW of 89.89 ± 36.44 Kg, DBH of 12.80 ± 2.68 cm and H = 9.49 ± 1.13 m. (n = 36). Canopy percentage was 32.01 ± 8.06% and FF = 0.57 ± 0.053.
Rosewood plantations (cultivated for seventeen years): C17.Rosewood seedlings planted in 1998 with 5.0 × 10 m spacing, following cutting and burning of original vegetation. Planting lines were maintained in the middle of naturally regenerating, occasionally cut, vegetation. Individual rosewood plants had AGFW of 96.02 ± 39.78 Kg, DBH of 12.7 ± 2.8 cm and H = 11.02 ± 1.97 m. (n = 36) Canopy percentage was 54.87 ± 17.99% and FF = 0.57 ± 0.106. Natural regeneration was uncontrolled and abundant.
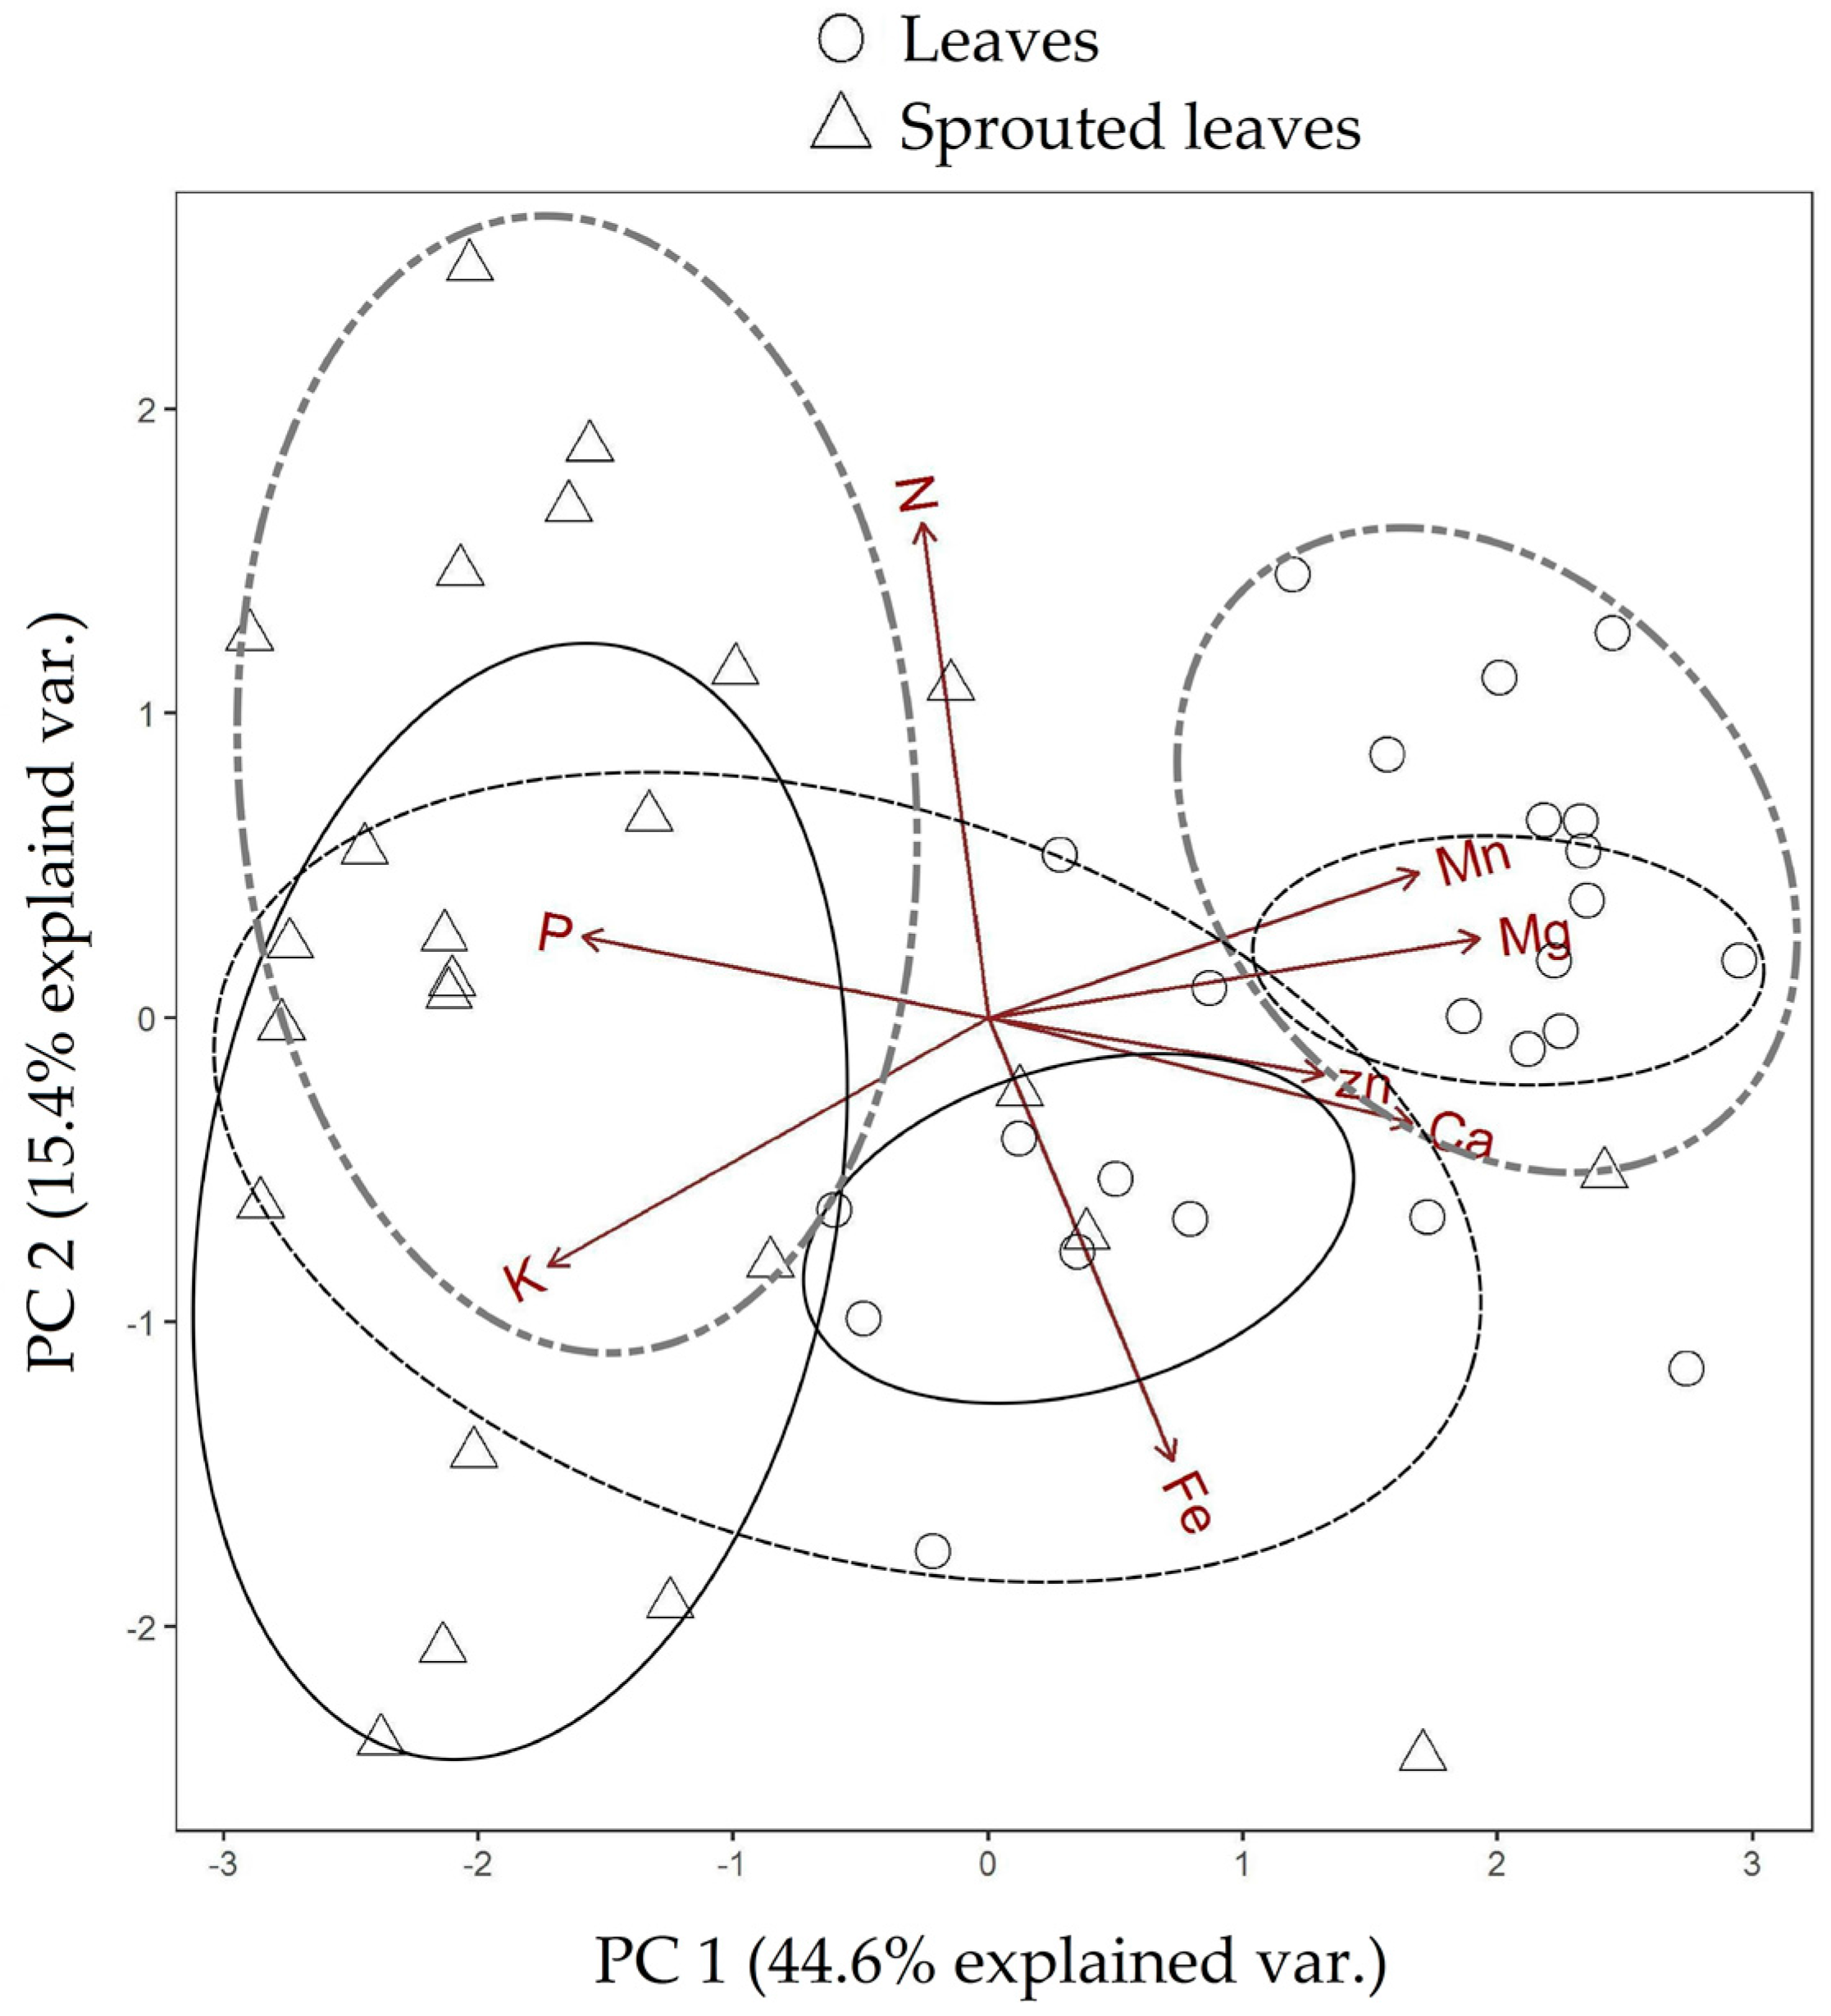
* Form factor for each tree was calculated using the ratio of the calculated volume to a volume that assumed the canopy was a perfect cylinder.
Figure A1. Histogram of tree DBH frequency at the three study sites. n = 144.
Forests 08 00438 g0a1
Figure A2. Biplot graph with two first principal components (PC 1 and PC 2) showing the ordering of leaf chemical attribute data for “reference” and “regrowth” material collected by sequential management of the Rosewood mass in the three study areas. Ellipses with dash, dash dot dot and solid line, correspond to areas C10, C12 and C17 respectively.
Forests 08 00438 g0a2
Figure A3. Biplot graph with two first principal components (PC 1 and PC 2) showing the ordering of branch chemical attribute data for “reference” and “regrowth” material collected by sequential management of the Rosewood mass in the three study areas. Ellipses with dash, dash dot dot and solid line, correspond to areas C10, C12 and C17 respectively.
Forests 08 00438 g0a3
Table A2. Paired p values from mean tests for PC 1 and PC 2 scores resulting from principal component analysis for sequentially managed branch and leaf chemical attributes in each rosewood plantation located in the three study areas.
Test Categoriesp-Value PC 1p-Value PC 2
Leaves 10-Sprouted leaves 100.0430.006
Leaves 12-Sprouted leaves 120.0010.000
Leaves 17-Sprouted leaves 170.0640.000
Branches 10-Sprouted branches 100.0800.000
Branches 12-Sprouted branches 120.0540.000
Branches 17-Sprouted branches 170.0250.000
Figure A4. Box plot and p values of paired mean tests comparing leaf chemical attributes data for “reference” and “regrowth” material collected by sequential management of above ground rosewood mass in the three study areas. (a) Nitrogen; (b) Phosphorus; (c) Potassium; (d) Calcium; (e) Magnesium; (f) Iron; (g) Zinc and; (h) Manganese.
Forests 08 00438 g0a4
Figure A5. Box plot and p values of paired mean tests comparing branch chemical attributes data for “reference” and “regrowth” material collected by sequential management of above ground rosewood mass in the three study areas. (a) Nitrogen; (b) Phosphorus; (c) Potassium; (d) Calcium; (e) Magnesium; (f) Iron; (g) Zinc and; (h) Manganese.
Forests 08 00438 g0a5
Figure A6. Dendrogram showing grouping at Euclidean distance of leaves and branches of each area/age according to the chemical attributes measured before and after the management of the above ground mass in commercial rosewood plantations located in the three study areas.
Forests 08 00438 g0a6
Figure A7. Sum of nutrients exported by the sequential management of whole trees and pruning 100% of the canopy in two commercial plantations in Maués, AM. (a) Nitrogen; (b) Phosphorus; (c) Potassium; (d) Calcium; (e) Magnesium; (f) Fe; (g) Zinc; (h) Manganese.
Forests 08 00438 g0a7
Figure A8. (a) Average increase in diameter; (b) height and; (c) sum of dry mass according to shoot management in 10-year-old rosewood plantations managed in the region of Maués, AM.
Forests 08 00438 g0a8
Figure A9. (a) Average increase in diameter; (b) height and; (c) sum of dry mass according to shoot management in 12-year-old rosewood plantations managed in the region of Maués, AM.
Forests 08 00438 g0a9
Figure A10. Correlation between (a) Total shoots and tree dry mass; (b) Shoots dry mass and stem dry mass; (c) Shoots dry mass and total soluble sugar; (d) total shoots and total soluble sugar in managed Central Amazonian rosewood plantations.
Forests 08 00438 g0a10
Figure A11. Correlation between crown dry mass resprouted and tree DBH in managed Central Amazonian rosewood plantations.
Forests 08 00438 g0a11

Appendix B

Figure A12. A rosewood tree cut at 50 cm from the ground as required by law in Central Amazonian commercial rosewood plantations.
Forests 08 00438 g0a12
Figure A13. 100% canopy pruning and canopy climbing ladder for removal of branches and leaves.
Forests 08 00438 g0a13
Figure A14. Digital scale for measuring fresh weight of the mass harvested in a rosewood plantation.
Forests 08 00438 g0a14
Figure A15. (Left) Collection of wood discs at 0%, 50% and 100% of the height of the stem and (Right) using chainsaws, harvesting sawdust and cutting of the trunk in sections.
Forests 08 00438 g0a15
Figure A16. (Left) Excavation and (Right) collection of rosewood lateral roots in Central Amazonian commercial plantations.
Forests 08 00438 g0a16
Figure A17. Measurement of shoot diameter after above ground cut at 50 cm using digital callipers in Central Amazonian commercial rosewood plantations.
Forests 08 00438 g0a17
Figure A18. Spacing of shoots on a trunk cut 50 cm above the ground, the standard management form in Central Amazonian commercial rosewood plantations.
Forests 08 00438 g0a18

References

  1. Marques, C.A. A Importância Econômica Da Família Lauraceae Lindl. Floresta Ambient. 2001, 8, 195–206. [Google Scholar]
  2. Zanin, S.M.W.; Lordello, A.L.L. Alcalóides aporfinóides do gênero Ocotea (Lauraceae). Químic. Nova 2007, 30, 92–98. [Google Scholar] [CrossRef]
  3. Instituto Brasileiro do Meio Ambiente e dos Recursos Naturais Renováveis (IBAMA). Portaria 06-N; Instituto Brasileiro do Meio Ambiente e dos Recursos Naturais Renováveis: Brasília, Brazil, 1992. [Google Scholar]
  4. The Convention on International Trade in Endangered Species of Wild Fauna and Flora (CITES), Convention on International Trade in Endangered Species of Wild Fauna and Flora, Doha, Qatar, 18 March 2010. Available online: http://www.cites.org/esp/app/appendices.shtml (accessed on 15 November 2016).
  5. International Union for Conservation of Nature (IUCN). The IUCN Red List of Threatened Species, Version 2014.3 (IUCN, 2014). Available online: http://www.iucnredlist.org (accessed on 11 March 2015).
  6. Sampaio, P.T.B.; Barbosa, A.P.; Vieira, G.; Spironello, W.R.; Bruno, F.M.S. Biomassa da rebrota de copas de Rosewood (Aniba rosaeodora Ducke) em plantios sob sombra parcial em floresta primária. Acta Amazon. 2005, 35, 491–494. [Google Scholar] [CrossRef]
  7. Sampaio, P.T.B.; Santos, M.; Vieira, G.; Spironello, W.; Useche, F.L.; Bruno, F.M.S. Avaliação da rebrota da copa das árvores de pau-rosa (Aniba rosaeodora Ducke) em sistema de podas sucessivas. Acta Amazon. 2007, 37, 55–60. [Google Scholar] [CrossRef]
  8. McEwan, A.; Magagnotti, N.; Spinelli, R. The effects of number of stems per stool on cutting productivity in coppiced Eucalyptus plantations. Silva Fenn. 2016, 50. [Google Scholar] [CrossRef]
  9. Fredericksen, T.S.; Putz, F.E. Silvicultural intensification for tropical forest conservation. Biodivers. Conserv. 2003, 12, 1445–1453. [Google Scholar] [CrossRef]
  10. Secretaria de Estado do Meio Ambiente e Desenvolvimento Sustentável (SDS) 2006. Notícias: Semana do Meio Ambiente. Available online: http://www.sds.am.gov.br/noticia.php?xcod=2255 (accessed on 1 February 2015).
  11. Ministério do Meio Ambiente (MMA). Instrução Normativa MMA Nº 04; Ministério do Meio Ambiente: Brasília, Brazil, 2006.
  12. Ministério do Meio Ambiente (MMA). Instrução Normativa MMA Nº 05; Ministério do Meio Ambiente: Brasilia, Brazil, 2006.
  13. Instituto Brasileiro do Meio Ambiente e dos Recursos Naturais Renováveis (IBAMA). Instrução Normativa IBAMA Nº 09; Instituto Brasileiro do Meio Ambiente e dos Recursos Naturais Renováveis: Brasilia, Brazil, 2011. [Google Scholar]
  14. May, P.H.; Barata, L.E. Rosewood exploitation in the Brazilian Amazon: Options for sustainable production. Econ. Bot. 2004, 58, 257–265. [Google Scholar] [CrossRef]
  15. Takeda, P.S. Avaliação de Biomassa e óleo da Rebrota de Galhos e Folhas de Rosewood (Aniba rosaeodora Ducke) em Plantios Comerciais Submetidos a Poda e Adubação. Master’s Dissertation, Instituto Nacional de Pesquisas da Amazônia/Universidade Federal Rural da Amazônia, Manaus, Brazil, 2008. (In Portuguese). [Google Scholar]
  16. Krainovic, P.M. Plantios de Pau-rosa (Aniba Rosaeodora Ducke) em Áreas com Histórico de Degradação por Atividades Agrícolas e Pecuárias. Master’s Dissertation, Instituto Nacional de Pesquisas da Amazônia, Manaus, Brazil, 2011. (In Portuguese). [Google Scholar]
  17. Krainovic, P.M.; Almeida, D.R.; Sampaio, P.T.B. New Allometric Equations to Support Sustainable Plantation Management of Rosewood (Aniba rosaeodora Ducke) in the Central Amazon. Forests 2017, 8, 327. [Google Scholar] [CrossRef]
  18. Maia, J.G.S.; Andrade, E.H.A.; Couto, H.A.R.; Silva, A.C.M.D.; Marx, F.; Henke, C. Plant sources of Amazon rosewood oil. Químic. Nova 2007, 30, 1906–1910. [Google Scholar] [CrossRef]
  19. Chantraine, J.M.; Dhénin, J.M.; Moretti, C. Chemical variability of rosewood (Aniba rosaeodora Ducke) essential oil in French Guiana. J. Essent. Oil Res. 2009, 21, 486–495. [Google Scholar] [CrossRef]
  20. Fidelis, C.H.; Augusto, F.; Sampaio, P.T.; Krainovic, P.M.; Barata, L.E. Chemical characterization of rosewood (Aniba rosaeodora Ducke) leaf essential oil by comprehensive two-dimensional gas chromatography coupled with quadrupole mass spectrometry. J. Essent. Oil Res. 2012, 24, 245–251. [Google Scholar] [CrossRef]
  21. Fidelis, C.H.; Sampaio, P.T.; Krainovic, P.M.; Augusto, F.; Barata, L.E. Correlation between maturity of tree and GC × GC–qMS chemical profiles of essential oil from leaves of Aniba rosaeodora Ducke. Microchem. J. 2013, 109, 73–77. [Google Scholar] [CrossRef]
  22. Paul, M.; Catterall, C.P.; Pollard, P.C.; Kanowski, J. Recovery of soil properties and functions in different rainforest restoration pathways. For. Ecol. Manag. 2010, 259, 2083–2092. [Google Scholar] [CrossRef]
  23. Londero, E.K.; Schumacher, M.V.; Szymczak, D.A.; Viera, M. Exportação e reposição nutricional no primeiro desbaste de um povoamento de Pinus taeda L. em área de segunda rotação. Ciênc. Florest. 2011, 21. Available online: http://www.redalyc.org/articulo.oa?id=53420071009 (accessed on 15 January 2017). [CrossRef]
  24. Schumacher, M.V.; Witschoreck, R.; Calil, F.N.; Lopes, V.G. Biomassa e nutrientes no corte raso de um povoamento de Pinus taeda L. de 27 anos de idade em Cambará do Sul–RS. Ciênc. Florest. 2013, 23, 321–332. [Google Scholar] [CrossRef]
  25. Cram, S.; Sommer, I.; Fernández, P.; Galicia, L.; Ríos, C.; Barois, I. Soil natural capital modification through landuse and cover change in a tropical forest landscape: Implications for management. J. Trop. For. Sci. 2015, 27, 189–201. [Google Scholar]
  26. Barichello, R.; Schumacher, L.; Valdir, M.; Vogel, M.; Luiz, H. Quantificação da biomassa de um povoamento de Acacia mearnsii De Wild. NA região sul do Brasil. Ciênc. Florest. 2005, 15, 129–135. Available online: http://www.redalyc.org/articulo.oa?id=53415202 (accessed on 15 January 2017). [CrossRef]
  27. Lammel, D.R.; Nüsslein, K.; Tsai, S.M.; Cerri, C.C. Land use, soil and litter chemistry drive bacterial community structures in samples of the rainforest and Cerrado (Brazilian Savannah) biomes in Southern Amazonia. Eur. J. Soil Biol. 2015, 66, 32–39. [Google Scholar] [CrossRef]
  28. Nyland, R.D. Silviculture: Concepts and Applications; Waveland Press: New York, NY, USA, 2016; ISBN 1-7486-2714-X. [Google Scholar]
  29. Augusto, L.; Achat, D.L.; Bakker, M.R.; Bernier, F.; Bert, D.; Danjon, F.; Khlifa, R.; Meredieu, C.; Trichet, P. Biomass and nutrients in tree root systems-sustainable harvesting of an intensively managed Pinus pinaster (Ait.) planted forest. Glob. Chang. Biol. Bioenergy 2015, 7, 231–243. [Google Scholar] [CrossRef]
  30. Carneiro, M.A.C.; Souza, E.D.; Reis, E.F.; Pereira, H.S.; Azevedo, W.R. Atributos físicos, químicos e biológicos de solo de cerrado sob diferentes sistemas de uso e manejo. Rev. Brasil. Ciênc. Solo 2009, 33, 147–157. Available online: http://www.redalyc.org/articulo.oa?id=180214067016 (accessed on 5 February 2017). [CrossRef]
  31. Witschoreck, R.; Schumacher, M.V. Nutrient allocation in Eucalyptus saligna sm. Stands In The Region Of Guaíba-Rio Grande do Sul. Cerne 2015, 21, 625–632. [Google Scholar] [CrossRef]
  32. Pausas, J.G.; Bradstock, R.A.; Keith, D.A.; Keeley, J.E. Plant functional traits in relation to fire in crown-fire ecosystems. Ecology 2004, 85, 1085–1100. [Google Scholar] [CrossRef]
  33. Pausas, J.G.; Pratt, R.B.; Keeley, J.E.; Jacobsen, A.L.; Ramirez, A.R.; Vilagrosa, A.; Davis, S.D. Towards understanding resprouting at the global scale. New Phytol. 2016, 209, 945–954. [Google Scholar] [CrossRef] [PubMed] [Green Version]
  34. Moreira, B.; Tormo, J.; Pausas, J.G. To resprout or not to resprout: Factors driving intraspecific variability in resprouting. Oikos 2012, 121, 1577–1584. [Google Scholar] [CrossRef]
  35. Vesk, P.A.; Westoby, M. Sprouting ability across diverse disturbances and vegetation types worldwide. J. Ecol. 2004, 92, 310–320. [Google Scholar] [CrossRef]
  36. Ohashi, S.T.; dos Santos Rosa, L.; Mekdece, F.S. Influência do diâmetro e da altura de corte das cepas na brotação de Pau-rosa (Aniba rosaeodora Ducke). Rev. Ciênc. Agrár./Amazon. J. Agric. Environ. Sci. 2004, 41, 137–144. Available online: https://periodicos.ufra.edu.br/index.php/ajaes/article/view/2381 (accessed on 14 March 2017).
  37. Matula, R.; Svátek, M.; Kůrová, J.; Úradníček, L.; Kadavý, J.; Kneifl, M. The sprouting ability of the main tree species in Central European coppices: Implications for coppice restoration. Eur. J. For. Res. 2012, 131, 1501–1511. [Google Scholar] [CrossRef]
  38. Spinelli, R.; Pari, L.; Aminti, G.; Magagnotti, N.; Giovannelli, A. Mortality, re-sprouting vigor and physiology of coppice stumps after mechanized cutting. Ann. For. Sci. 2017, 74, 5. [Google Scholar] [CrossRef]
  39. Canullo, R.; Simonetti, E.; Cervellini, M.; Chelli, S.; Bartha, S.; Wellstein, C.; Campetella, G. Unravelling mechanisms of short-term vegetation dynamics in complex coppice forest systems. Folia Geobot. 2017, 1–11. [Google Scholar] [CrossRef]
  40. Moreira, B.; Pausas, J.G. Shedding light through the smoke on the germination of Mediterranean Basin flora. S. Afr. J. Bot. 2016. [Google Scholar] [CrossRef]
  41. Fleck, I.; Diaz, C.; Pascual, M.; Iniguez, J. Ecophysiological differences between first-year resprouts after wildfire and unburned vegetation of Arbutus unedo and Coriaria myrtifolia. Acta Oecol. 1995, 16, 55–69. [Google Scholar]
  42. Fang, X.; Li, J.; Xiong, Y.; Xu, D.; Fan, X.; Li, F. Responses of Caragana korshinskii Kom. to shoot removal: Mechanisms underlying regrowth. Ecol. Res. 2008, 23, 863–871. [Google Scholar] [CrossRef]
  43. Shibata, R.; Kurokawa, H.; Shibata, M.; Tanaka, H.; Iida, S.; Masaki, T.; Nakashizuka, T. Relationships between resprouting ability, species traits and resource allocation patterns in woody species in a temperate forest. Funct. Ecol. 2016, 30, 1205–1215. [Google Scholar] [CrossRef]
  44. Fittkau, E.J.; Irmler, U.; Junk, W.J.; Reiss, F.; Schmidt, G.W. Productivity, biomass, and population dynamics in Amazonian water bodies. In Tropical Ecological Systems; Springer: Berlin/Heidelberg, Germany, 1975; pp. 289–311. [Google Scholar] [CrossRef]
  45. Kottek, M.; Grieser, J.; Beck, C.; Rudolf, B.; Rubel, F. World map of the Köppen-Geiger climate classification updated. Meteorol. Z. 2006, 15, 259–263. [Google Scholar] [CrossRef]
  46. CLIMATE-DATA.ORG. Climate Data for World Cities. Electronic Publishing. 2016. Available online: http://en.climate-data.org/ (accessed on 2 December 2016).
  47. Tanaka, A.; Vieira, G. Autoecologia das espécies florestais em regime de plantio de enriquecimento em linha na floresta primária da Amazônia Central. Acta Amazon. 2006, 36, 193–204. [Google Scholar] [CrossRef]
  48. Lindell, L.; Åström, M.; Öberg, T. Land-use change versus natural controls on stream water chemistry in the Subandean Amazon, Peru. Appl. Geochem. 2010, 25, 485–495. [Google Scholar] [CrossRef]
  49. Silva, R.P. Alometria, Estoque e Dinâmica da Biomassa de Florestas Primárias e Secundárias na Região de Manaus (AM). Ph.D. Thesis, Universidade Federal do Amazonas, Manaus, Brazil, 2007; p. 152, (In Portuguese with English abstract). [Google Scholar]
  50. Embrapa. Manual de Análises Químicas de Solos, Plantas e Fertilizantes; Embrapa Informação Tecnológica; Embrapa Solos: Rio de Janeiro, Brazil, 2009. [Google Scholar]
  51. Malavolta, E. Manual de Calagem e Adubação das Principais Culturas; Agronômica Ceres: São Paulo, Brazil, 1987. [Google Scholar]
  52. Black, M.; Corbineau, F.; Grzesik, M.; Guyi, P.; Côme, D. Carbohydrate metabolism in the developing and maturing wheat embryo in relation to its desiccation tolerance. J. Exp. Bot. 1996, 47, 161–169. [Google Scholar] [CrossRef]
  53. Dubois, M.; Gilles, K.A.; Hamilton, J.K.; Rebers, P.A.; Smit, F. Colorimetric method for determination of sugars and related substances. Anal. Chem. 1956, 28, 350–356. [Google Scholar] [CrossRef]
  54. Oliveira, I.A.D.; Campos, M.C.C.; Freitas, L.D.; Soares, M.D.R. Characterization of soils under different land uses in the southern region of the Amazonas. Acta Amazon. 2015, 45, 1–12. [Google Scholar] [CrossRef]
  55. Young, F.J.; Hammer, R.D. Defining geographic soil bodies by landscape position, soil taxonomy, and cluster analysis. Soil Sci. Soc. Am. J. 2000, 64, 989–998. [Google Scholar] [CrossRef]
  56. Sokal, R.R.; Rohlf, F.J. The comparison of dendrograms by objective methods. Taxon 1962, 11, 33–40. [Google Scholar] [CrossRef]
  57. R Core Team. A Language and Environment for Statistical Computing; R Foundation for Statistical Computing: Vienna, Austria, 2016. [Google Scholar]
  58. Pallardy, S.G. Physiology of Woody Plants; Academic Press: San Diego, CA, USA, 2010; ISBN 978-0-12-088765-1. [Google Scholar]
  59. Kabeya, D.; Sakai, S. The relative importance of carbohydrate and nitrogen for the resprouting ability of Quercus crispula seedlings. Ann. Bot. 2005, 96, 479–488. [Google Scholar] [CrossRef] [PubMed]
  60. Moreira, B.; Tavsanoglu, Ç.; Pausas, J.G. Local versus regional intraspecific variability in regeneration traits. Oecologia 2012, 168, 671–677. [Google Scholar] [CrossRef] [PubMed]
  61. Zambrosi, F.C.B.; Ribeiro, R.V.; Machado, E.C.; Garcia, J.C. Phosphorus deficiency impairs shoot regrowth of sugarcane varieties. Exp. Agric. 2017, 53, 1–11. [Google Scholar] [CrossRef]
  62. Clemente, A.S.; Rego, F.C.; Correia, O.A. Growth, water relations and photosynthesis of seedlings and resprouts after fire. Acta Oecol. 2005, 27, 233–243. [Google Scholar] [CrossRef]
  63. Drake, P.L.; Mendham, D.S.; White, D.A.; Ogden, G.N. A comparison of growth, photosynthetic capacity and water stress in Eucalyptus globulus coppice regrowth and seedlings during early development. Tree Physiol. 2009, 29, 663–674. [Google Scholar] [CrossRef] [PubMed]
  64. Gonçalves, J.F.D.C.; Barreto, D.C.D.S.; Santos Junior, U.M.D.; Fernandes, A.V.; Sampaio, P.D.T.B.; Buckeridge, M.S. Growth, photosynthesis and stress indicators in young rosewood plants (Aniba rosaeodora Ducke) under different light intensities. Braz. J. Plant Physiol. 2005, 17, 325–334. [Google Scholar] [CrossRef]
  65. DeSouza, J.; Silka, P.A.; Davis, S.D. Comparative physiology of burned and unburned Rhus laurina after chaparral wildfire. Oecologia 1986, 71, 63–68. [Google Scholar] [CrossRef] [PubMed]
  66. Moreira, A.; Fageria, N.K. Soil chemical attributes of Amazonas state, Brazil. Commun. Soil Sci. Plant Anal. 2009, 40, 2912–2925. [Google Scholar] [CrossRef]
  67. Dechen, A.R.; Nachigall, G.R. Elementos requeridos à nutrição de plantas. In Fertilidade do Solo; Novais, R.F., Alvarez, V.V.H., Barros, N.F., Fonte, R.L.F., Cantarutti, R.B., Neves, J.C.L., Eds.; SBCS/UFV: Viçosa, Brazil, 2007; pp. 92–132. [Google Scholar]
  68. Taiz, L.; Zeiger, E. Fisiologia Vegetal, 4th ed.; Artmed: Porto Alegre, Rio grande do Sul, Brazil, 2008; p. 820. [Google Scholar]
  69. Ferreira, S.J.F.; Mello-Ivo, W.; Biot, Y.; Luizão, F.J.; Ross, S.M. Propriedades físicas do solo após extração seletiva de madeira na Amazônia Central. Acta Amazon. 2002. [Google Scholar] [CrossRef]
  70. Van Raij, B. Fertilidade do Solo e Adubação; Associação Brasileira para Pesquisa da Potassa e do Fosfato: Piracicaba, Brasil, 1991. [Google Scholar]
  71. Vesk, P.A.; Westoby, M. Funding the bud bank: A review of the costs of buds. Oikos 2004, 106, 200–208. [Google Scholar] [CrossRef]
  72. Kauppi, A.; Kiviniitty, M.; Ferm, A. Growth habits and crown architecture of Betula pubescens Ehrh. of seed and sprout origin. Can. J. For. Res. 1988, 18, 1603–1613. [Google Scholar] [CrossRef]
  73. Bond, W.J.; Midgley, J.J. Ecology of sprouting in woody plants: The persistence niche. Trends Ecol. Evol. 2001, 16, 45–51. [Google Scholar] [CrossRef]
  74. Oliveira, C.H.R.D. Produção de Eucalipto em alto Fuste e Talhadia e de Braquiária em Sistemas Silvipastoris com Diferentes Arranjos Espaciais. Ph.D. Thesis, Universidade Federal de Viçosa, Minas Gerais, Brazil, 2014. [Google Scholar]
  75. Kays, J.S.; Canham, C.D. Effects of time and frequency of cutting on hardwood root reserves and sprout growth. For. Sci. 1991, 37, 524–539. [Google Scholar]
  76. Borzak, C.L.; Potts, B.M.; O’Reilly-Wapstra, J.M. Survival and recovery of Eucalyptus globulus seedlings from severe defoliation. For. Ecol. Manag. 2016, 379, 243–251. [Google Scholar] [CrossRef]
  77. Paula, S.; Arianoutsou, M.; Kazanis, D.; Tavsanoglu, Ç.; Lloret, F.; Buhk, C.; Espelta, J.M. Fire-related traits for plant species of the Mediterranean Basin. Ecology 2009, 90, 1420. [Google Scholar] [CrossRef]
  78. Loescher, W.H.; McCamant, T.; Keller, J.D. Carbohydrate reserves, translocation, and storage in woody plant roots. HortScience 1990, 25, 274–281. [Google Scholar]
  79. Vesk, P.A. Plant size and resprouting ability: Trading tolerance and avoidance of damage? J. Ecol. 2006, 94, 1027–1034. [Google Scholar] [CrossRef]
  80. Bellingham, P.J.; Sparrow, A.D. Resprouting as a life history strategy in woody plant communities. Oikos 2000, 89, 409–416. [Google Scholar] [CrossRef]
  81. Bond, W.J.; Midgley, J.J. The evolutionary ecology of sprouting in woody plants. Int. J. Plant Sci. 2003, 164, S103–S114. [Google Scholar] [CrossRef]
  82. Sparrow, A.D.; Bellingham, P.J. More to resprouting than fire. Oikos 2001, 94, 195–198. [Google Scholar] [CrossRef]
  83. Ministério do Meio Ambiente (MMA). Portaria MMA Nº 443; Ministério do Meio Ambiente: Brasília, Brazil, 2014.
  84. Instituto Brasileiro do Meio Ambiente e dos Recursos Naturais Renováveis (IBAMA). Lei Federal n° 12.651; de 25 de maio de 2012, alterada pela Lei 12.727, de 17 de outubro de 2012; Instituto Brasileiro do Meio Ambiente e dos Recursos Naturais Renováveis: Brasília, Brazil, 2012. [Google Scholar]
  85. Homma, A.K.O. Amazônia: Como aproveitar os benefícios da destruição? Estudos Avançados 2005, 19, 115–135. [Google Scholar] [CrossRef]
Figure 1. Map of study areas showing (a) Brazilian Legal Amazon and Amazon River sub-basins; and (b) Maués, directly linked to main Amazon River channel and Novo Aripuanã just inside Madeira River basin.
Forests 08 00438 g001
Figure 2. Biplot graph with two first principal components (PC 1 and PC 2) showing the ordering of branch and leaf chemical attribute data from “reference” and “regrowth” material collected by sequential management of rosewood mass in the three study areas. Ellipses with dash, dash dot dot and solid line, correspond to areas C10, C12 and C17 respectively.
Forests 08 00438 g002
Figure 3. Box plot and p values of paired mean tests comparing PCA scores of leaf and branch chemical attributes data for “reference” and “regrowth” material collected by sequential management of rosewood above ground mass in the three study areas. (a) PC 1 Scores for leaf chemical attributes; (b) PC 2 Scores for leaf chemical attributes; (c) PC 1 Scores for branch chemical attributes; (d) PC 2 Scores for branch chemical attributes.
Forests 08 00438 g003
Figure 4. Dendrogram showing the grouping at Euclidean distance of leaves and branches according to the chemical attributes measured before and after the management of the above ground mass in Central Amazonian commercial rosewood plantations.
Forests 08 00438 g004
Figure 5. Dry mass exported by the sequential management of rosewood plantations via whole tree removal and 100% canopy pruning of trees located in the Central Amazon. Percentage values represent the percentage of above ground dry weight by the resprouting process.
Forests 08 00438 g005
Figure 6. Quantities of macro and micronutrients exported by sequential management of above ground dry mass of Central Amazonian rosewood. Larger sized numbers correspond to the first harvest, and smaller sized numbers to the second harvest.
Forests 08 00438 g006
Figure 7. Average increase in (a) diameter; (b) height; and (c) sum of dry mass according to shoot management in managed rosewood plantations in Central Amazon. The large-size character is the Fisher’s F test p-value. The smaller-sized character shows the values for each assay made with the Tukey test. Spr: sprouts.
Forests 08 00438 g007
Table 1. Chemical attributes of trunks, branches and leaves collected from Rosewood plantations in Maués and Novo Aripuanã regions at first harvest (reference-harvest = 1st) and at second harvest (regrowth material-harvest = 2nd).
Cultivated AreasHarvestNPKCaMgFeZnMn
(%)g kg−1mg kg−1
Leaves
10 years old1.680.433.445.601.9275.1619.1160.63
1.511.266.545.281.3168.7514.6349.13
12 years old1.700.443.145.282.0774.3114.6869.28
1.751.386.713.771.4464.7511.0053.75
17 years old1.500.337.494.401.7675.6513.4855.53
1.671.139.57 4.361.3273.1315.1332.63
Branches
10 years old0.610.341.793.520.4162.9214.0939.30
0.791.655.232.850.6461.139.8823.38
12 years old0.650.291.382.710.4255.789.9433.89
1.021.656.342.030.8267.5011.1333.50
17 years old0.480.153.032.410.3254.029.4225.06
0.811.178.761.800.6562.6313.5021.88
Stem
10 years old0.340.191.342.080.1527.782.5010.33
12 years old0.280.130.891.530.1418.330.339.33
17 years old0.280.091.471.970.1538.331.1115.78
Table 2. Sources and doses of macro- and micronutrients available in the Amazon region, suggested for nutritional replacement of rosewood plantations, based on the quantities exported by above ground biomass crops in commercial plantations of Central Amazonia.
Nutrient SourcesWhole Tree *Harvest **
(a)(b)(a)(b)(a)(b)(a)(b)
N (Kg ha−1)Ureia (45% N) 575-20.9-326-115-
Ammonium Sulphate (a 21% N) + (b 21% S) 1.23 exp325944.89.4169914724751.8
Salitre (16% N)1.62 exp3-58.8-917-324-
Sawdust (2% N)1.29 exp4-470-7.54 exp3-2.59 exp3-
P (Kg ha−1)Super Triple Phosphate (a 42% P) + (b 11% Ca)24.72.722.450.26911.381.2516.31.79
Super Phosphate Simple (a 19% P) + (b 18% Ca) 54.79.845.420.97525.164.5335.96.47
Monoamonium Phosphate (a 46% P) + (b 10% N) 22.62.252.240.22310.391.0414.81.49
Natural Araxá Phosphate (36% P)28.9-2.86-13.28-18.9-
Pottasium Chloride (60% K)169-7.83-72.0-41.0-
K (Kg ha−1)Potassium Sulphate (a 50% K) + (b 18% S)20336.69.401.6986.415.5649.28.86
Potassium Nitrate (46% K) + (16% N)22135.310.21.6393.915.0353.58.56
Ca (Kg ha−1)Dolomitic Limestone PRNT > 80% (a 20% Ca) + (b 11% Mg)59365.210.51.1626429.0399.811.0
Mg (Kg ha−1)Magnesium Sulphate (a 16% Mg + (b 22 % S)13329.44.440.9891.720.1732.47.14
Fe (g ha−1)Iron Sulphate (a 19% Fe + b 11% S)8.750.960.210.024.470.491.960.22
Zn (g ha−1)Zinc Sulphate (a 20% Zn + b 11% S)1.260.140.040.000.890.100.310.03
Mn (g ha−1)Magnesium Sulphate (a 26% Mn + b 14 % S)3.940.550.100.012.330.330.920.13
* Average measures from 108 trees in a central Amazonian plantation; ** Average measures from 36 trees in a central Amazonian plantation. 1. Export from first harvest; 2. Export from second harvest. (a) Principle element provided, (b) Supplemental element provided in addition to the main element. “-“: Supplementary element null values added by the nutrient source.

