Article

Growth, Physiological, Biochemical, and Ionic Responses of Morus alba L. Seedlings to Various Salinity Levels

1
State Key Laboratory of Forest Genetics and Tree Breeding, Key Laboratory of Tree Breeding and Cultivation of State Forestry Administration, Research Institute of Forestry, Chinese Academy of Forestry, Beijing 100091, China
2
Beijing Advanced Innovation Center for Tree Breeding by Molecular Design, National Engineering Laboratory for Tree Breeding, Key Laboratory of Genetics and Breeding in Forest Trees and Ornamental Plants of Ministry of Education, College of Biological Sciences and Technology, Beijing Forestry University, Beijing 100083, China
3
Tibet Municipal Tree Science Institution, Lasa 850000, China
4
Department of Biology and Chemistry, Baoding University, Baoding 071000, China
5
Henan Longyuan Flowers & Trees Co., Ltd., Yanling, Xuchang 461200, China
6
Beijing Forestry University Yanling Collaborative Innovation Center, Yanling, Xuchang 461200, China
*
Author to whom correspondence should be addressed.
These authors contributed equally to this work.
Forests 2017, 8(12), 488; https://doi.org/10.3390/f8120488
Submission received: 14 September 2017 / Revised: 17 November 2017 / Accepted: 28 November 2017 / Published: 7 December 2017
(This article belongs to the Section Forest Ecophysiology and Biology)

Abstract

:
Mulberry (Morus alba L.), a moderately salt-tolerant tree species, is considered to be economically important. In this study, 1-year-old mulberry seedlings cultivated in soil under greenhouse conditions were treated with five concentrations of sodium chloride (NaCl; 0%, 0.1%, 0.2%, 0.3%, and 0.5%) for 3 and 21 days. Plant growth parameters were not affected by 0.1% NaCl, but significant reductions were observed after treatment with 0.2%, 0.3%, and 0.5% NaCl. The malondialdehyde content and cell membrane stability of mulberry seedlings exposed to 0.1% NaCl did not change, indicating that mulberry is not significantly affected by low-salinity conditions. The Na contents of various organs did not increase significantly in response to 0.1% NaCl, but the K:Na, Mg:Na, and Ca:Na ratios of various organs were affected by NaCl. Marked changes in the levels of major compatible solutes (proline, soluble sugars, and soluble proteins) occurred in both the leaves and roots of NaCl-treated seedlings relative to control seedlings. Under severe saline conditions (0.5% NaCl), the ability of mulberry to synthesize enzymatic antioxidants may be impaired.

1. Introduction

Plants are exposed to multiple abiotic stresses in their natural surroundings. Abiotic stress conditions such as high or low temperature, drought, and salinity are common unfavorable conditions that have negative effects on tree growth and production. Among these stresses, soil salinity imposes a major constraint on forestry production because it not only restricts growth but also limits the use of uncultivated land [1]. Salt stress exerts multiple adverse effects on plants, including reduced photosynthetic efficiency, ion toxicity due mainly to sodium (Na) and chlorine (Cl), and osmotic stress [2]. High-salt environments can also interfere with the ion homeostasis of plant cells, disrupt the ionic balance, and affect the distributions of potassium ions (K+) and calcium ions (Ca2+) in cells [3]. In addition, salt stress induces the formation of reactive oxygen species (ROS), which participate in a wide range of reactions with negative effects such as lipid peroxidation, pigment oxidation, membrane disruption, protein denaturation, and DNA mutation [4].
Saline conditions are not fatal to all plant species, and a wide range of plant species can grow in saline areas. To accommodate saline conditions, salt-resistant plants have mechanisms that attenuate or eliminate the negative effects of salt. Plants grown under saline conditions may accumulate compatible solutes, such as proline, which function as osmotic adjustment substances that lower the cellular osmotic potential [5], maintain water absorption from saline solutions [6], and restore intracellular ion homeostasis [7]. To mitigate the damage caused by ROS, specific protective mechanisms that rely on antioxidants have evolved in plants [8].
Antioxidants are divided into two classes: nonenzymatic free radical scavengers such as glutathione (GSH), vitamin C (Vc), and carotenoids, and enzymes such as superoxide dismutase (SOD). SOD is a major scavenger of superoxide ions (O2−) and its enzymatic action results in the formation of hydrogen peroxide (H2O2) and oxygen (O2). Peroxidase (POD) degrades H2O via the oxidation of cosubstrates, and catalase (CAT) breaks down H2O2 into water and molecular O2 [9]. The intracellular ion balance plays a key role in salt resistance in plants via three mechanisms that maintain homeostasis: reduction of Na+ entry into the cell, active Na+ efflux from the cell, and active sequestration of Na+ in the vacuole. In addition to these responses, plants can also make morphological and developmental adjustments to saline conditions [6].
Morus alba L. is native to China, but is now cultivated globally. Mulberry leaves are important as the primary food of silkworms whose cocoons are used to make silk. Mulberry fruits are highly nutritious and have many medicinal properties [10]. To boost economic development and restore soil conditions, the mulberry planting industry is moving from developed regions in southeastern China to inland saline regions, creating a need for systematic research on the salt-resistance mechanisms of mulberry [11]. Not much information is available on mulberry salt-resistance mechanisms [12]. Some studies have focused on morphological, biochemical and physiological changes under salinity, for example: Kumar et al. found that after being subjected to NaCl for 12 days, leaf area, dry mass accumulation and some photosynthetic parameters in mulberry significantly declined [13]. Gai et al. found the SOD activity of mulberry increased under low salt stress, but decreased under high level of NaCl. In addition, salt stress also reduced multiple mineral elements in leaves of mulberry [14]. However, little is known about the influence of salt on the various organs of the plant. Claes et al. showed that the expression of salt resistance genes in rice may be organ-specific when responding to salt and drought stress [15], and in a study of salt tolerance in wheat [16], Tammam et al. proved dry weight of roots remained unchanged up to the level of 120 mM NaCl, while shoots and spikes were either unchanged or even stimulated to increase toward 180 mM NaCl, which indicated that salt-tolerant mechanisms and abilities may be different between organs.
In addition, the responses of mulberry to mild, moderate, and severe salt stress over various periods of stress, which might reveal varied mechanisms for maintenance of mulberry growth under salt-stress conditions, have not been determined.
In a preliminary salt stress experiment, we found in all the salt-stressed treatments, seedlings began to die at the 3rd day, and also if a seedling did not die within 21 days, it could survive eventually, which was an interesting phenomenon (see Supplementary Materials Figure S1). An explanation for this phenomenon could be that the 3rd day and the 21st day are two key time points in the process that mulberry seedlings undergo to resist the salt: the 3rd day is an initial phase during which NaCl stress substantially harms the mulberry, followed by a stable phase during which the mulberry adapts to the NaCl stress by the 21st day. In this study, we investigated the effects of different NaCl concentrations on the growth, gas exchange, osmotic adjustment, antioxidant enzyme content, and ionic content of mulberry seedlings subjected to salt stress for 3 days and 21 days. We examine the growth, physiological, biochemical, and ionic responses of the various organs to salt in an effort to understand the salt resistance mechanisms in mulberry and salt resistance ability among different organs.

2. Materials and Methods

2.1. Plant Material and Salt Treatments

Mulberry (Morus spp.) cultivars were obtained from the experimental nursery of the Chinese Academy of Forestry Sciences, Liangxiang, Beijing. The Mulberry cultivar used in our experiment is a new hybrid cultivar with good economic characteristics, and good salt tolerance. One-year-old mulberry seedlings approximately 1 cm in diameter at ground level with 30-cm tall stems were transplanted to pots (30.0 cm in diameter and 25.0 cm tall) before budding in early March 2007, with one plant per pot. The cultivation substrate was sandy soil [6 kg dry weight (DW) per pot] with available nitrogen (N), phosphorus (P), and potassium (K) amounts of 121, 27, and 1117 mg/kg, respectively, and 5% organic matter content. The potted plants were well watered regularly and received 1 L of Hoagland’s nutrient solution at 2-week intervals. The potted plants were placed in a greenhouse with a day/night temperature regime of 25 °C and 18 °C, under a 14-h light and 10 h-dark photocycle, with relative humidity of 70% during day and 80% at night, and at a photon flux density of approximately 300–400 μmol m−2 s−1.

2.2. Salt Treatment and Determination of Salt Content

Salt treatments were initiated when young sprouts were approximately 15–20 cm long in late May 2007. One hundred fifty randomly selected plants with similar heights, numbers of leaves, and leaf areas were subjected to treatments with 30 seedlings per treatment. To determine an appropriate sodium chloride (NaCl) concentration, five NaCl concentrations including 0 (control), 0.1%, 0.2%, 0.3%, and 0.5% (accounting for the dry weight (DW) of potted soil) were applied to the soils. To achieve distinct levels of soil salinity, NaCl at rates of 0, 6, 12, 18 and 30 g was dissolved in 1 L distilled water and added to the pots each containing 6 kg dry soil to bring them to the water-saturated level.
In a previous survival rate experiment using the same materials and methods for salt treatments used in this study and 30 seedlings per treatment (with 3 replications per treatment) to evaluate the effects of various NaCl concentrations, we showed that salt-treated seedlings began to die after 3 days and that the survival rates stabilized after 21 days (Supplementary Materials Figure S1). Based on these prior results, we collected and evaluated materials for this study after 3 and 21 days of salt stress, and we designated 0.1% NaCl as a low stress condition (survival rate was greater than 75%), 0.2 and 0.3% NaCl as moderate stress conditions (survival rates were approximately 50%), and 0.5% NaCl as a high stress condition (survival rate was approximately 25%). The soil moisture was maintained at the maximum soil moisture capacity during the salt treatments. Leaf numbers, average leaf areas, and total leaf areas of all the seedlings were calculated before the salt treatments.

2.3. Plant Harvest and Determination of Growth Parameters

After 3 and 21 days of salt treatment, plants were harvested (excluding dead plants). Shoots and roots were washed with distilled water, blotted dry on filter paper, and dried for 48 h at 70 °C for determination of DW. The lengths of new shoots and roots were measured using a ruler, and lateral root diameters were determined using a micrometer. For determination of leaf area, detached leaves were traced on graph paper printed with 1-mm squares. Leaf area was determined by counting the number of grid squares inside the leaf outlines. Growth parameters were calculated only for plants surviving after 21 days.

2.4. Measurement of Photosynthetic Gas Exchange and Chlorophyll Fluorescence Parameters

Leaf gas exchange parameters were measured in the fourth fully expanded leaves from the tops of seedlings after 3 and 21 days of salt treatment using a portable LI-6400 system (LI-Cor Inc., Lincoln, NE, USA). The net photosynthetic rate (Pn), transpiration rate (Tr), intercellular CO2 concentration (Ci), and stomatal conductance (Gs) were measured simultaneously using an internal light source with a photosynthetically active radiation (PAR) value of 1000 μmol m−2 s−1. During the measurement, the ambient air CO2 concentration was approximately 400 μmol mol−1 and the temperature was approximately 25 °C. Water-use efficiency (WUE) was calculated as WUE = Pn/Tr. In each treatment, we randomly selected five seedlings for the photosynthetic measurement. The means of data were used to compare the effects of treatments.
Chlorophyll fluorescence parameters were recorded using a fluorometer (PAM-2100; Heinz Walz, Effeltrich, Germany) on the same day that gas exchange measurements were taken. The initial fluorescence (Fo) and maximal fluorescence (Fm) were measured after a 30-min dark acclimation. Then, the variable fluorescence (Fv = FmF0) and the maximal photochemical efficiency of photosystem II (PSII, Fv/Fm) were calculated according to Demmig-Adams and Adams [17]. During measurements, the dark-acclimated leaves were irradiated first by a red light-emitting diode (LED) with a PAR value of 0.1 μmol m−2 s−1 (λ = 650 nm) to measure Fo followed by a 0.8 s pulse of saturating light with a PAR value of 9000 μmol m−2 s−1 to measure Fm.
Subsequently, an actinic light source with a PAR value 400 μmol m−2 s−1 was turned on, and the saturated light pulse was illuminated to measure the maximum fluorescence of the light-acclimated leaves (Fm’). The actinic light was then turned off and a far-red light with λ = 730 nm was turned on for several seconds and the minimum fluorescence of the light-acclimated leaves (Fo’) was recorded. After this step, the actual photochemical efficiency of PSII (ΦPSII) and the photochemical fluorescence quenching (qP) were recorded automatically by the instrument [ΦPSII = (Fm’ − F)/Fm’ and qP = (Fm’ − F)/(Fm’ − Fo’)), respectively, where F is the steady-state fluorescence in light-acclimated leaves]. The non-photochemical quenching (NPQ) was calculated as NPQ = Fm/Fm’ − 1. All values were measured five times, with five replications.

2.5. Analysis of Soluble Sugars, Soluble Proteins, and Proline

To determine soluble sugar content, samples were homogenized in 100 mM phosphate buffer (pH 7.5) at 4 °C after centrifugation at 4000 rpm for 15 min, and the supernatant was used to determine the total soluble sugar content according to the method described by Magné et al. [18]. Soluble protein content was determined as described by Bradford [19] using a commercial reagent (Sigma-Aldrich, St. Louis, MO, USA) and bovine serum albumin (BSA; Merck, Darmstadt, Germany) as a standard. Proline was extracted and quantitated using the method of Bates et al. [20]: Samples were homogenized with 3% sulfosalicylic acid and the homogenate was centrifuged at 4000 rpm for 20 min. The supernatant was treated with acetic acid and acid ninhydrin and boiled for 1 h, then the absorbance at 520 nm was measured. Proline (Sigma-Aldrich, St. Louis, MO, USA) was used to generate a standard curve.

2.6. Measurement of Antioxidant Enzyme Activities

Fresh leaf samples were obtained and frozen instantly in liquid N and stored at −80 °C. Frozen leaf samples weighing 0.5 g were ground to fine powder in liquid N using a mortar and then homogenized with 3 mL of 50 mM phosphate buffer solution (pH 7.8) containing 1 mM EDTA–Na2 and 1% polyvinylpyrrolidone (PVP). The homogenate was centrifuged at 10,000 rpm for 15 min, and the supernatant was then centrifuged at 10,000 rpm for an additional 5 min. The supernatant was collected as a crude enzyme extract for enzyme measurements and stored at 4 °C. All steps were carried out at 4 °C. Enzyme activities were assayed using a spectrophotometer.
The total SOD activity was assayed according to Becana et al. via inhibition of the photochemical reduction of nitroblue tetrazolium (NBT). The reaction mixture (3 mL) contained 50 mM phosphate buffer (pH 7.8) and 0.1 mM EDTA, and an O2generating system containing 14.3 mM methionine, 82.5 μM NBT, and 2.2 μM riboflavin. The reaction was initiated by the addition of 100 μL of crude enzyme extract. The entire system was positioned 30 cm below a light source (six 15-W fluorescent tubes) for 30 min. The reaction was stopped by turning the light off. The complete reaction mixture without enzyme extract was incubated in light as for the experimental samples to provide a light blank, and the complete reaction mixture including 100 μL of enzyme extract was incubated in the dark to provide a dark blank. The reduction in the amount of NBT was determined by monitoring the change in absorbance at 560 nm. The readings obtained from the light blank were used to calculate units of enzymatic activity. One unit (U) of SOD enzyme activity was defined as the amount of enzyme that produced 50% inhibition of NBT reduction under the assay conditions and was expressed as U SOD activity mg−1 protein [21].
Catalase activity was measured by monitoring the decomposition of H2O2 as described by Cakmak and Marschner [22]. Catalase activity was measured in a reaction mixture (1 mL) containing 50 mM phosphate buffer (pH 7.0) and 15 mM H2O2. The reaction was initiated by adding 50 μL of enzyme extract and the activity was determined from the decomposition of H2O2 by monitoring the decrease in absorbance at 240 nm (molar extinction coefficient = 39.4 mM−1 cm−1). One unit of CAT activity was defined as a decrease in the A240 of 0.1 absorbance unit in 1 min.
The POD activity in enzyme extracts was assayed by monitoring changes in absorbance at 470 nm in mixtures containing 0.02 M Na2HPO4, 0.08 M NaH2PO4, 20 mM guaiacol, 4 mM H2O2, and enzyme extract (10 mL), pH 6, in a total volume of 3 mL [23]. One unit of POD enzyme activity was defined as the amount of enzyme that increased the A470 by 0.001 absorbance unit per min at 50 °C. The effects of β-mercaptoethanol, l-cysteine, and p-chloromercuribenzoate (5 mM) on POD activity were determined at pH 8 by adding the compounds to the buffer prior to preparation of reaction mixtures and enzyme activity assays.

2.7. Malondialdehyde Concentration and Cell Membrane Stability

Malondialdehyde (MDA) concentration was measured according to Quan et al. [24], using a thiobarbituric acid (TBA) colorimetric assay in which 0.5 g of fresh tissue was homogenized in 2 mL of 10% trichloroacetic acid (TCA, w/v). The homogenate was centrifuged at 4000 rpm for 10 min at 4 °C, and then 2 mL of the supernatant was mixed with 2 mL of 0.6% TBA (w/v). The mixture was incubated in boiling water for 30 min and then centrifuged at 4000 rpm for 10 min. The MDA concentration was expressed as micromoles per gram of fresh mass using an extinction coefficient of 155 mM−1 cm−1 at 532 nm. Absorbance was also measured at 600 and 450 nm to account for interference due to nonspecific turbidity and carbohydrates, respectively. The MDA concentration was defined as
C = 6.45 × (OD532 − OD600) − 0.56 × OD450.
Cell membrane stability was expressed as relative electrolytic conductivity determined by measuring conductance in a 50-mL triangular flask containing 20 mL of deionized water after 30 min under vacuum. Cell membrane stability was measured as follows. Fresh tissues were cut into segments, and 0.2-g segments were washed three times in deionized water and incubated in a glass vial containing 20 mL of deionized water under vacuum for 30 min, after which the electrolytic conductivity of the bathing solution was measured using a conductivity meter. The segments were then heated to boiling for 15 min, the bathing solution cooled to room temperature, and the electrolytic conductivity was measured again. The relative permeability of root plasma membrane was calculated as described by Zwiazek et al.: the relative permeability equals the electrolytic conductivity of a solution 30 min before heating divided by the electrolytic conductivity of the solution after heating multiplied by 100% [25].

2.8. Determination of the Sodium (Na), Potassium (K), Magnesium (Mg), and Calcium (Ca) Contents of Various Organs

Leaves, shoots, taproots, and lateral roots were transferred to porcelain crucibles and dry-ashed at 550 °C for 12 h, dissolved in 0.5 M HCl, and brought to volume with double-distilled water. Concentrations of Na, Ca, Mg, and K were determined using a flame photometer (Jenway PFP7; Bibbly Scientific Singapore).

2.9. Osmotic Potential

Leaf and root osmotic potentials were determined in the second or third youngest fully expanded leaves and in the terminal 5-cm segments of roots. All samples were harvested, cleaned in water, and stored at −30 °C. Osmotic potentials were determined according to Li et al. [26]: Frozen samples were cut into small segments and squeezed using a syringe, then the squeezed out cell sap was collected to determine the osmotic potential in a freezing-point osmometer (FM-4, Shanghai, China [26]).

2.10. Statistics

The differences in all statistical values among the treatments were assessed by one-way ANOVA, Duncan’s multiple range test, using SPSS 19.0 software (SPSS Inc., Chicago, IL, USA).

3. Results

3.1. Growth under Increasing Levels of Soil Salinity

Saline conditions had negative effects on plant growth, and reductions in growth became more pronounced with increasing levels of salt in the soil; however, the average leaf area and the lengths and diameters of lateral roots were higher under low-salinity conditions (0.1% NaCl) than in the untreated control plants (Table 1). More than 90% of the plants died after being subjected to 0.5% NaCl stress for 21 days (Figure S1), so only the effects of this treatment on growth were included in our study.

3.2. Gas Exchange and Chlorophyll Fluorescence Parameters

The net assimilation rate of leaves after 3 days of salt stress decreased with increasing salt concentration, with 0.5% NaCl having the most pronounced effect (Table 2). A significant reduction in the net assimilation rate was observed after 21 days of treatment with 0.2% NaCl. Stomatal conductance was decreased significantly by the 0.3% NaCl treatment during the first 3 days, but the stomatal conductance was not significantly different between the salt-stressed plants and the control plants after 21 days, the same being true for transpiration rates (Table 2). In plants treated with salt for 3 days, the instant water-use efficiency (iWUE) did not change significantly under 0.1% NaCl, but did decrease under the moderate (0.2 and 0.3% NaCl)- and high (0.5% NaCl)-salinity treatments. After 21 days of exposure, however, a significant increase in iWUE occurred in the plants treated with 0.1% NaCl (Table 2). The intercellular CO2 (Ci) concentration decreased after 3 days under the 0.1% NaCl treatment, but increased under the 0.5% NaCl treatment. After 21 days, the Ci did not change significantly under the low or moderate salinity treatments.
Leaf fluorescence parameters were not negatively affected at less than 0.3% NaCl. Only NPQ exhibited higher values relative to the control plants under all salinity treatments, with a peak value under the 0.1% NaCl treatment (Table 3).

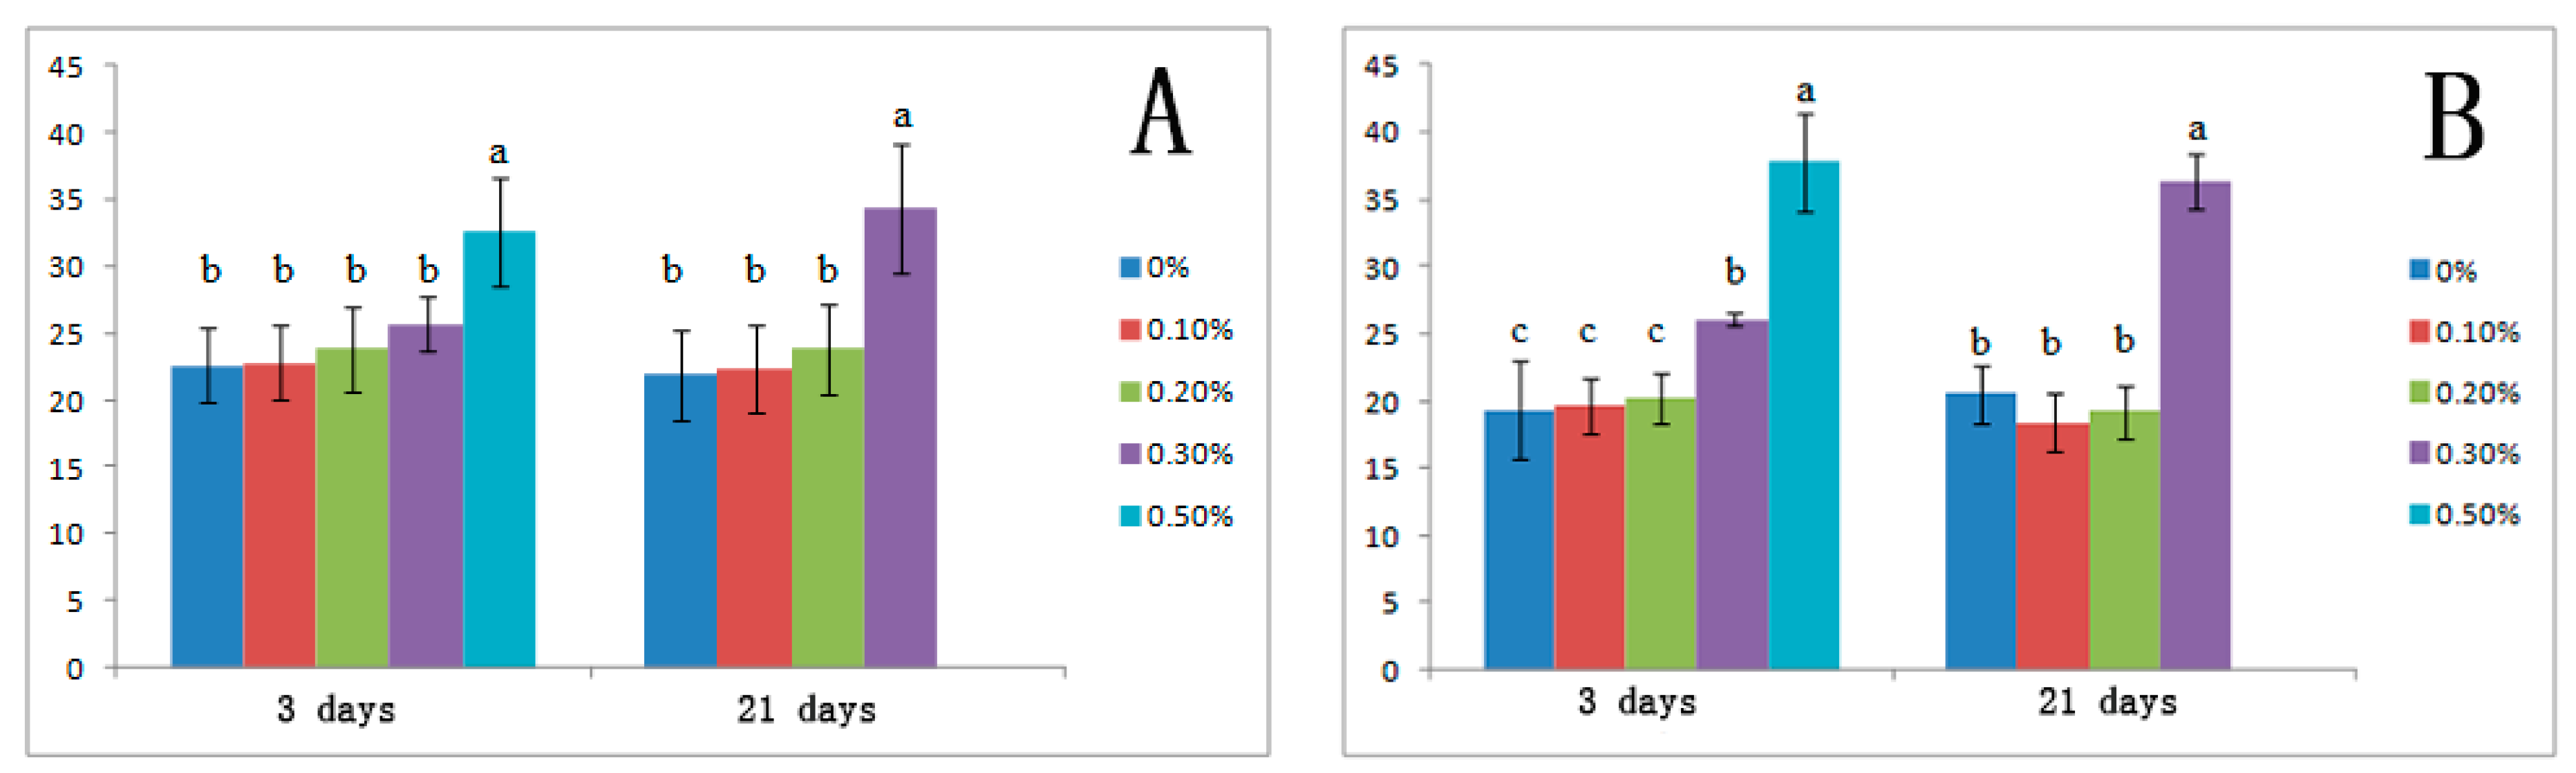
3.3. Effects of Salt Stress on Organic Solutes and Osmotic Potential

The soluble sugar concentration did not change significantly in leaves and roots in response to any of the salt treatments. We observed a sustained increase in the proline concentration in leaves after 3 days of growth under NaCl levels as low as 0.1%, while the proline concentration did not significantly increase in roots at less than 0.3% NaCl (Table 4). Soluble protein concentrations were negatively affected by the moderate (0.3% NaCl) and high (0.5% NaCl) salinity treatments.
Leaf and root osmotic potential values decreased with increasing NaCl concentration (Table 5). After 3 days of salt treatment, the osmotic potentials in the control and 0.5% NaCl-treated plants ranged from −1.50 MPa to −4.85 MPa, respectively, in the leaves and from −0.66 MPa to −1.32 MPa, respectively, in the roots. The osmotic potentials of leaves subjected to low NaCl treatment did not change significantly after 3 days, but decreased after 21 days. The osmotic potentials of roots were not affected after 21 days by the low and moderate NaCl treatments.

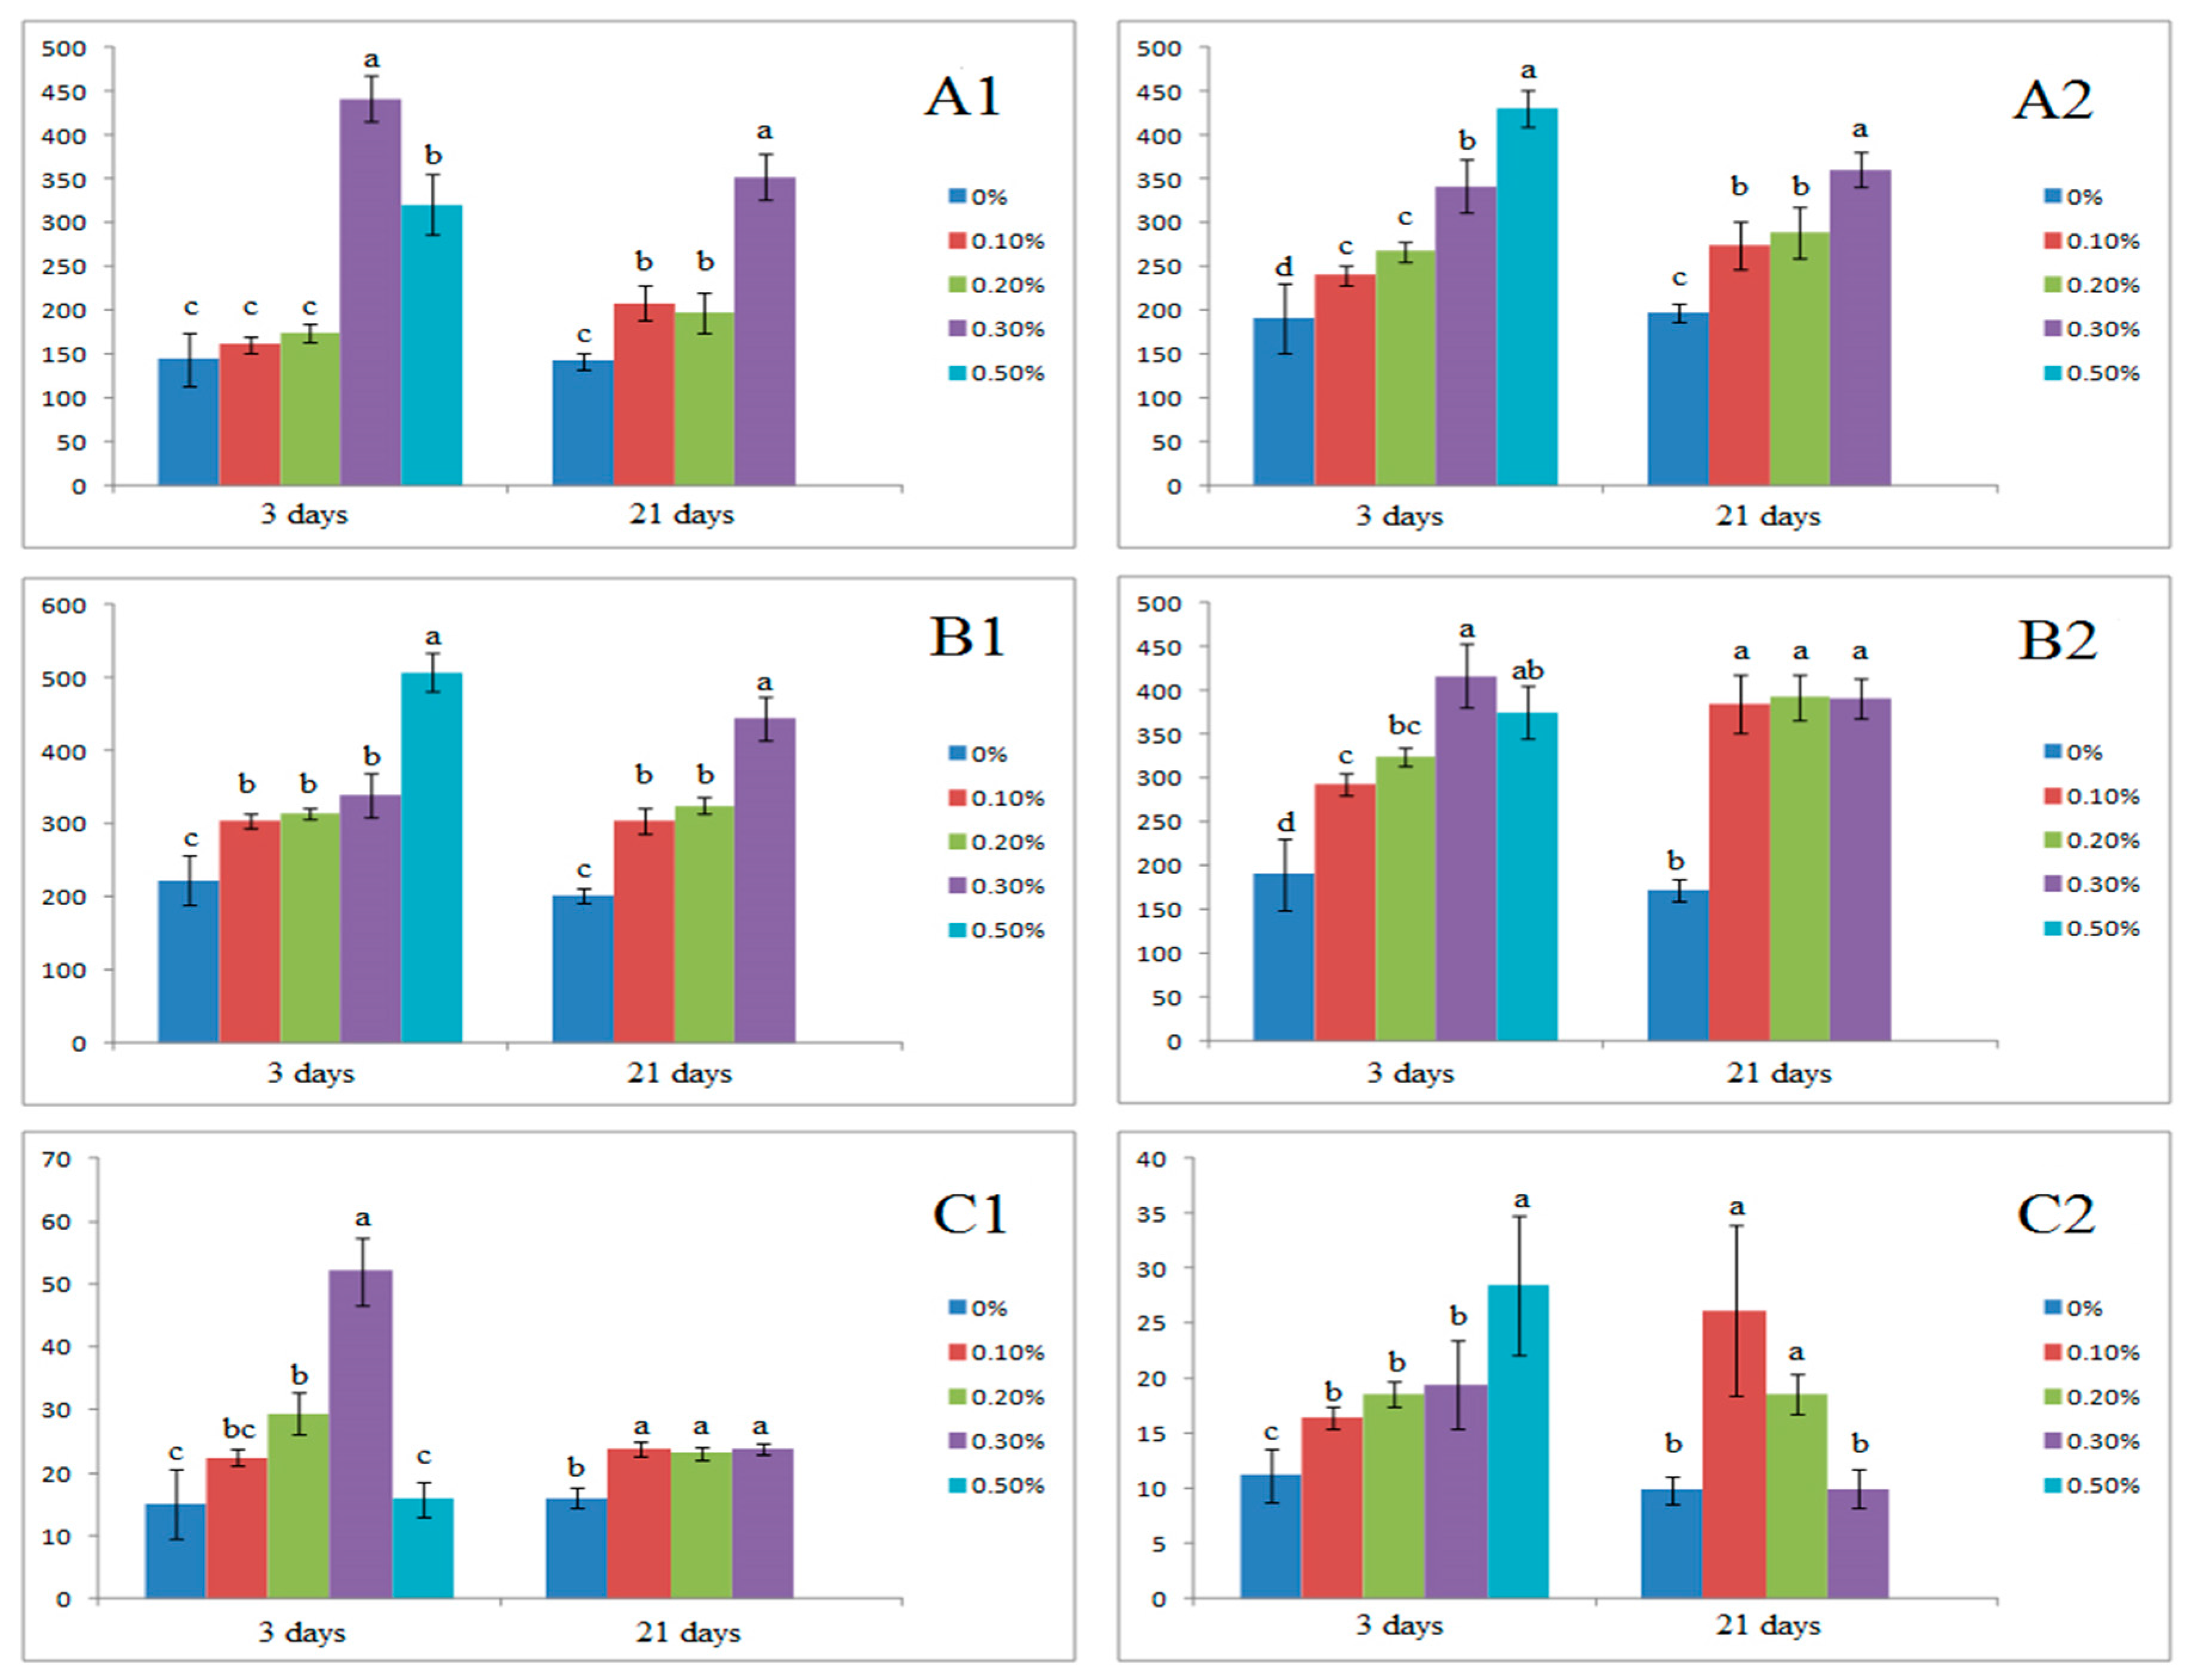
3.4. Effect of Salinity on Inorganic Ion Balance

Exposure to NaCl increased the Na concentration in the plant tissues (Table 6). Na concentrations were affected in the shoots after only 3 days under the 0.1% NaCl treatment. Similar trends were observed for changes in the Na concentrations in taproots and lateral roots. In leaves, Na concentrations began to increase significantly under the 0.2% NaCl treatment. After 21 days, however, the Na content increased only in plants subjected to the 0.3% NaCl treatment. K concentrations in leaves were unaffected by the NaCl treatments, but increased in other organs after 3 days of NaCl treatment and decreased after 21 days of treatment. Mg concentrations increased in both lateral roots and taproots after 21 days of NaCl treatment, but decreased in leaves and shoots. Ca concentrations increased in response to NaCl treatment in shoots, taproots, and lateral roots after 3 days, but remained unchanged in leaves by NaCl concentrations less than 0.5%. After 21 days, the Ca concentrations in taproots and lateral roots increased in response to the high salinity (0.5% NaCl) treatment. The K:Na, Mg:Na, and Ca:Na ratios decreased with increasing salinity levels (Table 6).

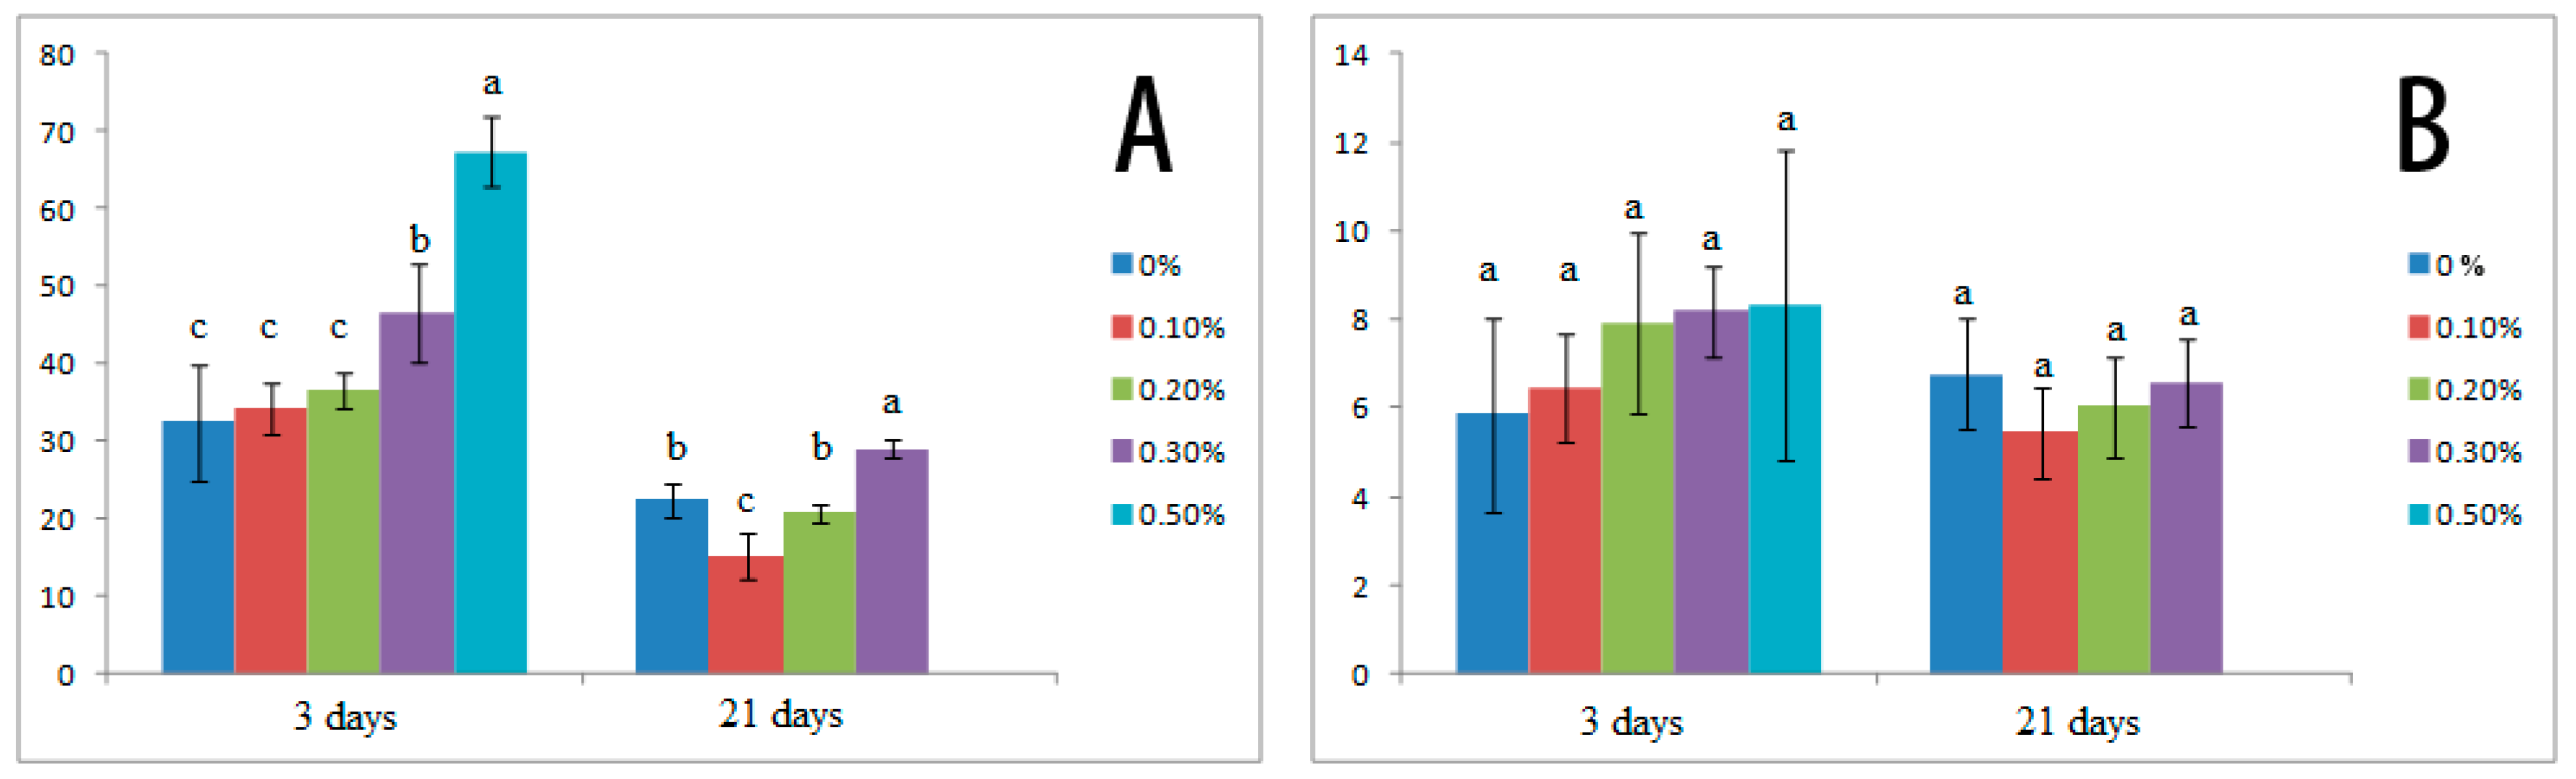
3.5. Cell Membrane Stability and Malondialdehyde (MDA) Content

Cell membrane stability remained unchanged after 3 days under NaCl treatments less than 0.3% in leaves and less than 0.2% in roots, but a significant increase was observed in both leaves and roots after 21 days under 0.3% NaCl (Figure 1A). The low-salinity (0.1 and 0.2% NaCl) treatments did not significantly affect the MDA content in leaves (Figure 2A), although a significant decrease in MDA content occurred under the 0.1% NaCl treatment after 21 days. The salt treatments appeared to have no effect on the MDA content of roots.

3.6. Antioxidant Enzyme Activities

SOD activity increased in leaves and roots at all concentrations of NaCl relative to the untreated control plants as shown in Figure 3(A1,A2). SOD activity in leaves increased with increasing NaCl concentration, with a peak value at 0.3% NaCl, and then declined after 3 days under 0.5% NaCl. Salt stress increased SOD activity in both leaves and roots. The effects of NaCl on CAT and POD activities are shown in Figure 3B,C. Salt stress increased the CAT and POD activities in both leaves and roots at NaCl concentrations as low as 0.1%. In contrast, high salinity (0.5% NaCl) neither affected the POD activity in leaves after 3 days of stress nor in roots under 0.3% NaCl after 21 days.

4. Discussion

Mulberry is a tree species that is moderately resistant to salt stress [27]. In this study, we found that NaCl-induced salinity stress caused a marked inhibition in the growth of mulberry seedlings as evidenced by changes in the DW of new leaves, shoots, and roots; the lengths of roots and shoots; and the successive increments in leaf number. Reduced plant growth is a common effect of salt stress that has been observed in several tree species, including mulberry, and morphological changes and growth reduction provide visual evidence of the degree of injury caused by salt [28,29,30]. In general, salt stress inhibits plant growth and development, resulting in reductions of 24–55% in root growth and 35–40% in shoot and leaf growth [31,32]. In this study, 1-year-old mulberry seedlings suffered reductions in root, shoot, and leaf growth of 15.4–85.9%, 20.5–84.6%, and 7.8–76.0%, respectively, under various levels of salt stress, and significant reductions in biomass were caused by high-salt concentrations. In addition, salt stress had a significantly higher inhibitory effect on the belowground parts of mulberry seedlings than the aboveground parts, which caused a significant decrease in the root-to-shoot ratio. It is remarkable that the dry weight of new shoots and leaves were unchanged until 0.2% of NaCl, while 0.1% NaCl significantly decreased the weight of new roots. In this regard, when studying salt tolerance in wheat, Tammam et al. found the dry weights of shoots and spikes were unchanged and increased when stressed by 180 Mm NaCl, while the dry weights of roots were significantly decreased, which indicates the possibility that the development of roots may be more sensitive to salt stress than leaves and shoots in mulberry.
The response of photosynthesis to salinity stress is complex, and various aspects of photosynthesis including photochemistry, CO2 diffusion, and the activities of photosynthesis enzymes may be influenced by salt stress. Stomatal regulation has been shown to be adversely affected in most plants subjected to salinity stress [33]. In our study, the reduction in net CO2 fixation under moderate- and high-salinity conditions during the initial 3 days of salt stress may have been due to the negative regulation of stomatal conductance, and the decrease in net CO2 fixation may have caused the reduction in biomass. Although low-salinity levels did not affect net CO2 fixation, we detected some deceleration in growth, possibly due to reduced metabolic activity. Agastian et al. found low salinity did not reduce, but increased the net photosynthetic rate of three mulberry genotypes, which indicated that low salt stress may be beneficial to mulberry [34]. However, Pn improvements were not found under salt stress in our study; this may be because of the different material genotypes and experimental methods. In this study, we showed that the NPQ in mulberry was increased by NaCl concentrations as low as 0.1%. An increase in NPQ acts as a mechanism that protects the photosystems from damage caused by prolonged photoinhibition under salt-stress conditions [35]. Of the chlorophyll fluorescence parameters measured in mulberry leaves in this study, only NPQ was affected when plants were subjected to low salt-stress conditions. The leaf photochemical parameters were stable in leaves subjected to 0.1% and 0.2% NaCl, indicating that the electron transport and photosystems were not impaired, although 0.3% NaCl caused damage.
In a high-salt environment, plants maintain their water content by accumulating compatible organic solutes such as proline and soluble sugars and proteins in the cytoplasm [36]. Proline is an important osmotic protectant and has also been suggested to protect enzymes and membranes, scavenge ROS, and supply energy and N for utilization during salt stress [37].
In this study, proline concentrations increased with increasing NaCl concentration and increased 8.5- and 1.8- fold in leaves and roots, respectively, during the initial 3 days of stress. Based on the increased proline concentration in leaf after 3 days under 0.1% NaCl, proline began to protect mulberry plants during the early period of salt stress at NaCl concentrations as low as 0.1%, and the proline content continuously increased in leaf with the salt stress. The proline content in root did not change until 0.3% NaCl, which indicates that less production of proline content may be one of the reasons that salinity stress caused biomass to decrease more in new roots than in new shoots and new leaves. In Agastian et al.’s study, low salt could significantly decrease the soluble sugars in mulberry M-5 [34], while in our study, the concentrations of soluble sugars were stable in both leaves and roots under moderate- and high-salt stress conditions, even though we measured a significant decrease in the net photosynthetic rate, which indicates that mulberry used in our study may have a high salt tolerance ability. Although photosynthesis was reduced by salt stress, the allocation of assimilates for osmotic homeostasis, as well as partitioning into leaves and roots, were not negatively affected. We found a significant increase in soluble proteins in both leaves and roots after 3 days of 0.1 and 0.2% NaCl treatment, but not after 21 days; however, the soluble protein content decreased in leaves after 3 days under 0.5% NaCl and in both roots and leaves after 21 days under 0.3% NaCl.
The reduction in protein synthesis in salt-stressed plants may be caused by a reduction in nitrate uptake and assimilation [28] or by protein proteolysis induced by high NaCl concentrations [38].
Among the various negative impacts of salt stress on plants, membrane damage is a primary effect [39]. The content of MDA, which accumulates in cells as a result of lipid peroxidation, is the parameter most commonly used to evaluate membrane damage [40]. Cell membrane permeability reflects the extent of lipid peroxidation caused by ROS [5]. MDA content and membrane permeability are important selection criteria for salt tolerance in most plants because salt-sensitive plants generally accumulate higher levels of MDA and have higher cell membrane permeability than salt-tolerant plants [41]. In this study, the membrane permeability of leaves and roots did not change significantly until the NaCl concentration was at least 0.3%. The MDA content changed significantly in leaves at NaCl concentrations less than 0.3%. Our results indicate that 1-year-old mulberry seedlings tolerate, at most, stress imposed by 0.2% NaCl. We also showed that the MDA contents in the roots were more stable and lower than in the leaves, possibly because salt stress imposes more severe stress in the leaves than in the roots [42].
A stable intracellular ion balance is necessary for plants to maintain normal metabolism. Generally, Na concentrations increase, while Ca and K concentrations decrease in plant cells and tissues with increasing external Na concentration [43]. Because Na toxicity begins when NaCl accumulates due to toxic concentrations in the organs, the maintenance of K and Na homeostasis is important for the activities of many cytosolic enzymes and for the maintenance of membrane integrity [44]. During the initial period of stress (3 days), although the Na contents of various plant parts were affected by salt stress, the Na contents remained unchanged after 21 days under NaCl concentrations less than 0.3%. The K content of taproots was not affected by 0.1% NaCl. The K:Na ratio in the taproot was affected only by high salinity, while it decreased in the leaves, shoots, and lateral roots under low-salinity conditions. Similar trends were observed for the Mg:Na and Ca:Na ratios. These results indicate that under low-salt stress, mulberry plants may be able to maintain ion homeostasis in the taproots, while this capability is limited in the shoots and leaves.
Excessive salt promotes the production of ROS, which cause oxidative damage to lipid membranes, proteins, and nucleic acids. Limited CO2 fixation under salt-stress conditions leads to a decrease in carbon reduction by the Calvin cycle, and the subsequent generation of O2− and other O2 radicals through a series of biochemical reactions [42]. In this study, the photosynthetic rate decreased under 0.2% NaCl, and increased NaCl stress likely led to the overproduction of ROS and oxidative stress. To relieve oxidative stress, plants synthesize enzymatic antioxidants to counteract the ROS produced in response to stress [45,46]. The most important enzymatic antioxidants are SOD, CAT, and POD. In this study, the activities of all three enzymes increased consistently with increasing NaCl stress (0.1–0.3%), but we also found a reduction in antioxidant enzyme activities at high levels of NaCl stress. Similar results were found by Yu et al. suggesting that 0.5% NaCl stress may cause inactivation of antioxidant enzymes or prevent the synthesis of enzymatic antioxidants in 1-year-old mulberry cultivars [11]; however, in their study, seedlings suffered not only salt stress, but also high temperature, and the influences of single salt stress on antioxidants were not clear.

5. Conclusions

Salt stress caused reduced growth and physiological and biochemical changes in one-year-old mulberry seedlings, including reduced gas exchange and increased Na+ accumulation, MDA content, and membrane permeability, suggesting a limited degree of salt tolerance. The NaCl tolerance of mulberry plants was associated with enhanced accumulation or synthesis of key osmoprotectants, as well as the regulation of antioxidant enzymes and ionic homeostasis. Reduction in growth was observed from moderate (0.2% and 0.3%) and high (0.5%) NaCl stress. Failure to restrict Na exclusion, inhibition of the ability of assimilate synthesis, and increased allocation of carbohydrates for osmotic homeostasis may be the main reasons for growth reduction under higher salinity levels in mulberry plants.

Supplementary Materials

The following are available online at www.mdpi.com/1999-4907/8/12/488/s1, Figure S1: Changes in survival rates (%) over a period of 1–60 days under various NaCl concentrations (0%, 0.1%, 0.2%, 0.3%, 0.5%, 0.7%, and 0.9%). One-year-old seedlings began to die after 3 days, and survival rates were stable after 21 days.

Acknowledgments

This work was financially supported by the Special Fund for Forest Scientific Research in the Public Welfare of China (No. 201504401), the National Natural Science Foundation of China (No. 30870231), Medium and Long Scientific Research Project for Young Teachers in Beijing Forestry (2015ZCQ-SW-03); the Project of National Natural Science Foundation of China (No. 31400562); the National Science and Technology Support Program (2012BAD01B0601) and Innovation Team Development Program of the Ministry of Education (IRT13047).

Author Contributions

N.L., Z.L., Y.K. and Y.L. conceived and designed the experiments; N.L., H.D, L.D., B.C., S.D., Y.Z. and Y.S. performed the experiments and analyzed the data; N.L. wrote the paper. All authors read and approved the final paper.

Conflicts of Interest

The authors declare no conflict of interest.

References

  1. Oba, G.; Nordal, I.; Stenseth, N.C.; Stave, J.; Bjorå, C.S.; Muthondeki, J.K.; Bii, W.K.A. Growth performance of exotic and indigenous tree species in saline soils in Turkana, Kenya. J. Arid Environ. 2001, 47, 499–511. [Google Scholar] [CrossRef]
  2. Munns, R. Comparative physiology of salt and water stress. Plant Cell Environ. 2002, 25, 239–250. [Google Scholar] [CrossRef] [PubMed]
  3. Parida, A.K.; Das, A.B. Salt tolerance and salinity effects on plants: A review. Ecotoxicol. Environ. Saf. 2005, 60, 324–349. [Google Scholar] [CrossRef] [PubMed]
  4. Gill, S.S.; Tuteja, N. Reactive oxygen species and antioxidant machinery in abiotic stress tolerance in crop plants. Plant Physiol. Biochem. 2010, 48, 909–930. [Google Scholar] [CrossRef] [PubMed]
  5. Ashraf, M.; Ali, Q. Relative membrane permeability and activities of some antioxidant enzymes as the key determinants of salt tolerance in canola (Brassica napus L.). Environ. Exp. Bot. 2008, 63, 266–273. [Google Scholar] [CrossRef]
  6. Hauser, F.; Horie, T. A conserved primary salt tolerance mechanism mediated by HKT transporters: A mechanism for sodium exclusion and maintenance of high K+/Na+ ratio in leaves during salinity stress. Plant Cell Environ. 2010, 33, 552–565. [Google Scholar] [CrossRef] [PubMed]
  7. Yang, C.; Shi, D.; Wang, D. Comparative effects of salt and alkali stresses on growth, osmotic adjustment and ionic balance of an alkali-resistant halophyte Suaeda glauca (Bge). Plant Growth Regul. 2008, 56, 179–190. [Google Scholar] [CrossRef]
  8. Vaidyanathan, H.; Sivakumar, P.; Chakrabarty, R.; Thomas, G. Scavenging of reactive oxygen species in NaCl-stressed rice (Oryza sativa L.)—Differential response in salt-tolerant and sensitive varieties. Plant Sci. 2003, 165, 1411–1418. [Google Scholar]
  9. Zhu, Z.; Wei, G.; Li, J.; Qian, Q.; Yu, J. Silicon alleviates salt stress and increases antioxidant enzymes activity in leaves of salt-stressed cucumber (Cucumis sativus L.). Plant Sci. 2004, 167, 527–533. [Google Scholar] [CrossRef]
  10. Jia, Z.S.; Tang, M.C.; Wu, J.M. The determination of flavonoid contents in mulberry and their scavenging effects on superoxide radicals. Food Chem. 1999, 64, 555–559. [Google Scholar]
  11. Yu, C.; Huang, S.; Hu, X.; Deng, W.; Xiong, C.; Ye, C.; Li, Y.; Peng, B. Changes in photosynthesis, chlorophyll fluorescence, and antioxidant enzymes of mulberry (Morus ssp.) in response to salinity and high-temperature stress. Biologia 2013, 68, 404–413. [Google Scholar]
  12. Vijayan, K.; Doss, S.G.; Chakraborti, S.P.; Ghosh, P.D. Breeding for salinity resistance in mulberry (Morus spp.). Euphytica 2009, 69, 403–411. [Google Scholar] [CrossRef]
  13. Kumar, S.G.; Lakshmi, A.; Madhusudhan, K.V.; Ramanjulu, S.; Sudhakar, C. Photosynthesis parameters in two cultivars of mulberry differing in salt tolerance. Photosynthetica 2000, 36, 611–616. [Google Scholar] [CrossRef]
  14. Gai, Y.P.; Ji, X.L.; Mu, Z.M.; Liu, X.L.; Wang, H.L. Effect of NaCl stress on superoxide dismutase and catalase of mulberry. Canye Kexue 2006, 32, 99–102. [Google Scholar]
  15. Claes, B.; Dekeyser, R.; Villarroel, R.; Van den Bulcke, M.; Bauw, G.; Van Montagu, M.; Caplan, A. Characterization of a rice gene showing organ-specific expression in response to salt stress and drought. Plant Cell 1990, 2, 19–27. [Google Scholar] [CrossRef] [PubMed]
  16. Tammam, A.A.; Alhamd, M.A.; Hemeda, M.M. Study of salt tolerance in wheat (Triticum aestivum L.) cultivar Banysoif 1. Aust. J. Crop Sci. 2008, 1, 115–125. [Google Scholar]
  17. Demmig-Adams, B.; Adams, W.W. The role of xanthophyll cycle carotenoids in the protection of photosynthesis. Trends Plant Sci. 1996, 1, 21–26. [Google Scholar] [CrossRef]
  18. Magné, C.; Saladin, G.; Clément, C. Transient effect of the herbicide flazasulfuron on carbohydrate physiology in Vitis vinifera L. Chemosphere 2006, 62, 650–657. [Google Scholar] [CrossRef] [PubMed]
  19. Bradford, M.M. A rapid and sensitive method for the quantitation of microgram quantities of protein utilizing the principle of protein-dye binding. Anal. Biochem. 1976, 72, 248–254. [Google Scholar] [CrossRef]
  20. Bates, L.S.; Waldren, R.P.; Teare, I.D. Rapid determination of free proline for water-stress studies. Plant Soil 1973, 39, 205–207. [Google Scholar] [CrossRef]
  21. Becana, M.; Aparicio-Tejo, P.; Irigoyen, J.J.; Sanchez-Diaz, M. Some enzymes of hydrogen peroxide metabolism in leaves and root nodules of Medicago sativa. Plant Phys. 1986, 82, 1169–1171. [Google Scholar] [CrossRef]
  22. Cakmak, I.; Marschner, H. Magnesium deficiency and high light intensity enhance activities of superoxide dismutase, ascorbate peroxidase, and glutathione reductase in bean leaves. Plant Physiol. 1992, 98, 1222–1227. [Google Scholar] [CrossRef] [PubMed]
  23. Civello, P.M.; Martinez, G.A.; Chaves, A.R.; Anon, M.C. Peroxidase from strawberry fruit (Fragaria ananassa Duch.): Partial purification and determination of some properties. J. Agric. Food Chem. 1995, 43, 2596–2601. [Google Scholar]
  24. Quan, R.D.; Shang, M.; Zhang, H.; Zhao, Y.X.; Zhang, J.R. Improved chilling tolerance by transformation with betA gene for the enhancement of glycinebetaine synthesis in maize. Plant Sci. 2004, 166, 141–149. [Google Scholar] [CrossRef]
  25. Zwiazek, J.J.; Blake, T.J. Early detection of membrane injury in black spruce (Picea mariana). Can. J. For. Res. 1991, 21, 401–404. [Google Scholar] [CrossRef]
  26. Li, D.Q.; Zou, Q.; Cheng, B.S.; Sun, G.Y. Determining the osmotic potential of plant cell by cryoscopic method. Shandong Agric. Sci. 1988, 1, 43–45. [Google Scholar]
  27. Harinasut, P.; Poonsopa, D.; Roengmongkol, K.; Charoensataporn, R. Salinity effects on antioxidant enzymes in mulberry cultivar. Sci. Asia 2003, 29, 109–113. [Google Scholar] [CrossRef]
  28. Hamed, K.B.; Chibani, F.; Abdelly, C.; Magne, C. Growth, sodium uptake and antioxidant responses of coastal plants differing in their ecological status under increasing salinity. Biologia 2014, 69, 193–201. [Google Scholar]
  29. Hajiboland, R.; Norouzi, F.; Poschenrieder, C. Growth, physiological, biochemical and ionic responses of pistachio seedlings to mild and high salinity. Trees 2014, 28, 1065–1078. [Google Scholar] [CrossRef]
  30. Nguyen, H.T.; Stanton, D.E.; Schmitz, N.; Farquhar, G.D.; Ball, M.C. Growth responses of the mangrove Avicennia marina to salinity: Development and function of shoot hydraulic systems require saline conditions. Ann. Bot. 2015, 115, 397–407. [Google Scholar] [CrossRef] [PubMed]
  31. Carvajal, M.; Syvertsen, J.P. Gas exchange, chlorophyll and nutrient contents in relation to Na+ and Cl accumulation in ‘Sunburst’ mandarin grafted on different rootstocks. Plant Sci. 2002, 162, 705–712. [Google Scholar]
  32. Seemann, J.R.; Critchley, C. Effects of salt stress on the growth, ion content, stomatal behaviour and photosynthetic capacity of a salt-sensitive species, Phaseolus vulgaris L. Planta 1985, 164, 151–162. [Google Scholar] [CrossRef] [PubMed]
  33. Akram, M.S.; Ashraf, M. Exogenous application of potassium dihydrogen phosphate can alleviate the adverse effects of salt stress on sunflower. J. Plant Nutr. 2011, 34, 1041–1057. [Google Scholar] [CrossRef]
  34. Agastian, P.; Kingsley, S.J.; Vivekanandan, M. Effect of salinity on photosynthesis and biochemical characteristics in mulberry genotypes. Photosynthetica 2000, 38, 287–290. [Google Scholar] [CrossRef]
  35. Müller, P.; Li, X.P.; Niyogi, K.K. Non-photochemical quenching. A response to excess light energy. Plant Physiol. 2001, 125, 1558–1566. [Google Scholar] [PubMed]
  36. Bompy, F.; Lequeue, G.; Imbert, D.; Dulormne, M. Increasing fluctuations of soil salinity affect seedling growth performances and physiology in three Neotropical mangrove species. Plant Soil 2014, 380, 399–413. [Google Scholar] [CrossRef]
  37. Szabados, L.; Savouré, A. Proline: A multifunctional amino acid. Trends Plant Sci. 2010, 15, 89–97. [Google Scholar] [CrossRef] [PubMed]
  38. Mansour, M.M.F. Nitrogen containing compounds and adaptation of plants to salinity stress. Biol. Plant. 2000, 43, 491–500. [Google Scholar] [CrossRef]
  39. Uprety, D.C.; Sarin, M.N. Physiological studies on salt tolerance in Pisum sativum L. iV. tonic composition and nitrogen metabolism. Acta Agron Budap 1976, 25, 455–460. [Google Scholar]
  40. Ashraf, M.; Harris, P.J.C. Potential biochemical indicators of salinity tolerance in plants. Plant Sci. 2004, 166, 3–16. [Google Scholar] [CrossRef]
  41. Mandhania, S.; Madan, S.; Sawhney, V. Antioxidant defense mechanism under salt stress in wheat seedlings. Biol. Plant. 2006, 50, 227–231. [Google Scholar] [CrossRef]
  42. Demiral, T.; Turkan, I. Comparative lipid peroxidation, antioxidant defense systems and proline content in roots of two rice cultivars differing in salt tolerance. Environ. Exp. Bot. 2005, 53, 247–257. [Google Scholar] [CrossRef]
  43. Zhu, J.K. Regulation of ion homeostasis under salt stress. Curr. Opin. Plant Biol. 2003, 6, 441–445. [Google Scholar] [CrossRef]
  44. Kronzucker, H.J.; Coskun, D.; Schulze, L.M.; Wong, J.R.; Britto, D.T. Sodium as nutrient and toxicant. Plant Soil 2013, 369, 1–23. [Google Scholar] [CrossRef]
  45. Ahmad, P.; Jaleel, C.A.; Sharma, S. Antioxidant defense system, lipid peroxidation, proline-metabolizing enzymes, and biochemical activities in two Morus alba genotypes subjected to NaCl stress. Russ. J. Plant Physiol. 2010, 57, 509–517. [Google Scholar] [CrossRef]
  46. Ahmad, P.; Ozturk, M.; Sharma, S.; Gucel, S. Effect of sodium carbonate-induced salinity–alkalinity on some key osmoprotectants, protein profile, antioxidant enzymes, and lipid peroxidation in two mulberry (Morus alba L.) cultivars. J. Plant Interact. 2012, 9, 460–467. [Google Scholar] [CrossRef]
Figure 1. (A) Cell membrane stability (%) in leaves (A) and roots (B) of mulberry plants grown for 3 and 21 days with increasing levels of soil salinity under greenhouse conditions. Data with the same letter are not significantly different (P = 0.05).
Forests 08 00488 g001
Figure 2. MDA content (μg g−1 FW) in leaves (A) and roots (B) of mulberry plants grown for 3 and 21 days with increasing levels of soil salinity under greenhouse conditions. Data with the same letter are not significantly different (P = 0.05).
Forests 08 00488 g002
Figure 3. SOD activity in leaves (A1), SOD activity in roots (A2), CAT activity in leaves (B1), CAT activity in roots (B2), POD activity in leaves (C1), and POD activity in roots (C2) of mulberry plants grown for 3 and 21 days under increasing levels of soil salinity under greenhouse conditions. All enzyme activities are expressed as U mg−1 fresh weight (FW). Data with the same letter are not significantly different (P = 0.05).
Forests 08 00488 g003
Table 1. Effect of increasing levels of soil salinity on the growth of mulberry seedlings after 21 days. Parameters measured include the dry weight (DW) of new roots, shoots, and leaves (g plant−1), the successive increments in leaf number (plant−1), average leaf area (cm2), total leaf area (cm2), lateral root number (plant−1), length (cm) of the first and second longest lateral roots, diameter (mm) of the first and second largest lateral roots, total shoot length (cm), and the longest shoot length (cm). Data in each column within each defined plant part with the same letter are not significantly different (P = 0.05).
Treatment (%)New Root (DW)New Shoot (DW)New Leaf (DW)Root: Shoot RatiosLeaf Number IncrementAverage Leaf Area IncrementTotal Leaf Area Increment
Control1.83 ± 0.23a2.34 ± 0.35a2.83 ± 0.80a0.35 ± 0.10a13.70 ± 4.80a2.79 ± 1.28ab205.50 ± 77.94a
0.11.55 ± 0.16b1.86 ± 0.41ab2.61 ± 0.32a0.35 ± 0.06a11.00 ± 3.95ab4.78 ± 1.94a197.15 ± 53.41a
0.20.36 ± 0.15c1.37 ± 0.07b1.52 ± 0.17b0.26 ± 0.07b8.00 ± 6.10ab2.63 ± 1.24ab122.92 ± 106.87ab
0.30.15 ± 0.09d0.68 ± 0.04c1.24 ± 0.34b0.13 ± 0.05c8.60 ± 5.82ab2.01 ± 0.49bc115.15 ± 42.34ab
0.50.13 ± 0.08d0.36 ± 0.08d0.68 ± 0.36c0.07 ± 0.03d7.50 ± 0.84ab1.89 ± 0.09bc89.18 ± 6.74b
Treatment (%)Lateral Root NumberLateral Root Length
(1st longest)
Average Lateral Root LengthLateral Root Diameter
(1st biggest)
Average Lateral Root DiameterTotal Shoot LengthAverage Shoot Length
Control47.50 ± 13.13a31.20 ± 8.09a20.08 ± 6.05a1.65 ± 0.36a1.18 ± 0.14a34.63 ± 9.25a9.90 ± 3.23a
0.140.00 ± 8.91a32.25 ± 7.85a22.00 ± 6.65a1.88 ± 0.85a1.26 ± 0.46a21.54 ± 6.25ab7.72 ± 2.45ab
0.232.75 ± 13.23a23.75 ± 1.71ab15.38 ± 1.60b0.93 ± 0.20ab0.65 ± 0.09b14.87 ± 6.13b5.13 ± 3.10bc
0.319.25 ± 2.22b13.95 ± 2.89b8.38 ± 3.40b0.69 ± 0.19b0.48 ± 0.17b16.35 ± 5.12b4.94 ± 2.41bc
0.513.42 ± 0.35b10.34 ± 3.78b7.98 ± 4.78b0.54 ± 0.07b0.39 ± 0.11b10.53 ± 6.48ab2.58 ± 1.42c
Table 2. Effect of increasing soil salinity levels on the net assimilation rate (Pn, μmol m−2 s−1), stomatal conductance (Gs, mol m−2 s−1), transpiration rate (Tr, mmol m−2 s−1), intercellular CO2 concentration (Ci, μmol mol−1), and instant water-use efficiency (iWUE, net assimilation rate/transpiration rate) of leaves of mulberry plants grown for 3 and 21 days under greenhouse conditions. Data in each column with the same letter are not significantly different (P = 0.05).
Treatment (%)PnGsTrCiiWUE
3 days
010.79 ± 4.10a0.14 ± 0.07a2.37 ± 1.02a228.35 ± 21.29ab4.63 ± 0.52a
0.110.55 ± 3.10a0.11 ± 0.04a2.63 ± 0.8a206.12 ± 40.50b4.10 ± 0.85a
0.28.32 ± 3.12ab0.11 ± 0.05a2.22 ± 0.41a214.54 ± 28.22ab3.75 ± 0.88ab
0.35.72 ± 4.16b0.05 ± 0.02b1.41 ± 0.56b224.27 ± 88.32ab3.55 ± 2.06ab
0.51.09 ± 1.03c0.02 ± 0.02c0.67 ± 0.38b229.34 ± 87.85a1.30 ± 2.96b
21 days
09.28 ± 2.47a0.17 ± 0.07a1.50 ± 0.52a280.80 ± 22.17a6.38 ± 1.10b
0.111.08 ± 2.04a0.17 ± 0.07a1.57 ± 0.47a262.00 ± 29.21a7.38 ± 1.47a
0.28.52 ± 2.08ab0.13 ± 0.05a1.28 ± 0.52a258.90 ± 23.54a6.65 ± 1.24b
0.36.10 ± 1.80b0.11 ± 0.05a1.14 ± 0.43a290.75 ± 21.16a5.58 ± 1.06c
0.5-----
Table 3. Effect of increasing levels of soil salinity on chlorophyll fluorescence parameters including Fv/Fm (photochemical efficiency of PSII), Fv/F0 (potential photochemical efficiency), ΦPSII (actual photochemical efficiency of PSII), qP (photochemical quenching), and NPQ in leaves of mulberry plants grown for 3 and 21 days under greenhouse conditions. Data in each column with the same letter are not significantly different (P = 0.05).
TreatmentFv/FmFv/F0ΦPSIIqPNPQ
3 days
00.76 ± 0.02a3.08 ± 0.25a0.59 ± 0.12a0.72 ± 0.17a1.11 ± 0.02d
0.10.75 ± 0.04a2.96 ± 0.17a0.55 ± 0.13a0.71 ± 0.21a1.68 ± 0.03a
0.20.72 ± 0.08a2.68 ± 0.45ab0.52 ± 0.11a0.68 ± 0.28a1.51 ± 0.08b
0.30.64 ± 0.10ab2.18 ± 0.45bc0.36 ± 0.31ab0.45 ± 0.33b1.37 ± 0.08c
0.50.56 ± 0.03b1.63 ± 0.32c0.30 ± 0.25b0.38 ± 0.31b1.30 ± 0.06c
21 days
00.76 ± 0.03a3.48 ± 0.57a0.60 ± 0.32a0.72 ± 0.38a0.78 ± 0.18b
0.10.75 ± 0.04a3.30 ± 0.24a0.55 ± 0.27a0.70 ± 0.41a1.18 ± 0.07a
0.20.74 ± 0.05a3.03 ± 0.35a0.48 ± 0.22a0.68 ± 0.34a1.10 ± 0.08a
0.30.63 ± 0.08b2.67 ± 0. 51a0.44 ± 0.40b0.56 ± 0.46b0.98 ± 0.04ab
0.5-----
Table 4. Effect of soil salinity on the concentrations of soluble sugars (mg g−1 FW), proline (mg g−1 FW), and soluble proteins (mg g−1 FW) in the lateral roots and leaves of mulberry plants grown for 3 and 21 days under greenhouse conditions. Data in each column with the same letter are not significantly different (P = 0.05).
Treatments (%)Soluble SugarProlineSoluble Protein
Leaf
3 days
Control31.03 ± 1.45a0.25 ± 0.02d18.58 ± 1.64a
0.131.18 ± 2.45a0.76 ± 0.14c17.22 ± 5.67a
0.231.27 ± 1.77a0.83 ± 0.16c18.81 ± 0.96a
0.332.47 ± 1.55a1.31 ± 0.13b20.25 ± 0.92a
0.533.85 ± 1.88a2.13 ± 0.09a11.24 ± 3.57b
21 days
Control32.63 ± 2.47a0.26 ± 0.03c19.71 ± 0.11b
0.134.60 ± 1.44a0.68 ± 0.12b23.22 ± 0.20a
0.234.27 ± 1.77a0.73 ± 0.16b24.81 ± 0.96a
0.335.07 ± 2.95a1.39 ± 0.14a16.95 ± 0.46c
0.5---
Root
3 days
Control12.46 ± 1.20a0.16 ± 0.03b13.03 ± 2.68a
0.115.30 ± 1.97a0.15 ± 0.03b12.67 ± 0.70a
0.215.02 ± 3.50a0.18 ± 0.06b12.81 ± 0.36a
0.314.04 ± 2.08a0.25 ± 0.02a13.81 ± 0.51a
0.513.00 ± 1.40a0.29 ± 0.03a13.45 ± 1.78a
21 days
Control16.22 ± 3.75a0.15 ± 0.02c10.78 ± 1.54c
0.116.97 ± 1.27a0.22 ± 0.02b20.31 ± 4.79a
0.216.02 ± 2.50a0.30 ± 0.02a14.86 ± 1.30b
0.315.12 ± 2.12a0.38 ± 0.09a9.14 ± 2.14c
0.5---
Table 5. Effect of soil salinity on the osmotic potentials (MPa) of leaves and roots of mulberry plants grown for 3 and 21 days under greenhouse conditions. Data in each column with the same letter are not significantly different (P = 0.05).
Treatment (%)LeafRoot
3 days
Control−11.50 ± 0.15a−0.66 ± 0.05a
0.1−1.53 ± 0.11a−0.77 ± 0.04a
0.2−2.10 ± 0.12b−0.88 ± 0.11b
0.3−2.32 ± 0.23b−0.92 ± 0.15b
0.5−4.85 ± 0.32c−1.32 ± 0.15c
21 days
Control−1.73 ± 0.15a−0.87 ± 0.05a
0.1−2.14 ± 0.11b−0.92 ± 0.04a
0.2−2.12 ± 0.12b−0.96 ± 0.11a
0.3−2.39 ± 0.23b−1.02 ± 0.15a
0.5--
Table 6. Concentrations of Na, K, Mg, and Ca in leaves, shoots, taproots, and lateral roots of mulberry plants (mg g−1 DW) grown under various levels of soil salinity under greenhouse conditions. Data in each column with the same letter are not significantly different (P = 0.05).
Treatments (%)NaKMgCaK:Na ratioMg:Na RatioCa:Na Ratio
Leaf
3 days
Control0.12 ± 0.05d11.13 ± 0.46a4.74 ± 0.44ab22.57 ± 3.47b92.24 ± 16.69a39.29 ± 8.70a187.07 ± 70.20a
0.10.16 ± 0.07d10.36 ± 0.51a5.13 ± 0.25a23.19 ± 8.34b63.85 ± 15.64b31.60 ± 3.77a142.95 ± 53.94a
0.20.46 ± 0.15c11.01 ± 0.44a4.85 ± 0.15ab22.64 ± 5.13b23.93 ± 5.54bc16.25 ± 3.12b48.83 ± 10.69b
0.32.20 ± 0.89b12.01 ± 0.72a4.57 ± 0.27ab19.97 ± 6.34b5.45 ± 0.23c2.07 ± 0.14c9.06 ± 2.90c
0.516.28 ± 2.36a10.11 ± 0.33a4.32 ± 0.29b32.29 ± 8.78a0.62 ± 0.07d0.27 ± 0.05c1.98 ± 0.87d
21 days
Control0.31 ± 0.12b8.85 ± 0.34a5.43 ± 0.25a56.66 ± 12.34a28.37 ± 2.34a17.40 ± 2.34a181.67 ± 52.34a
0.10.59 ± 0.33b10.10 ± 0.55a5.25 ± 0.36a61.41 ± 6.32a17.04 ± 4.32b8.86 ± 1.03b103.60 ± 31.03b
0.20.81 ± 0.12b8.81 ± 0.21a4.81 ± 0.21b62.55 ± 5.21a10.87 ± 5.21b5.94 ± 2.21b77.22 ± 25.40b
0.33.59 ± 1.13a4.87 ± 0.78b4.21 ± 0.27b63.39 ± 7.55a1.36 ± 0.55c1.17 ± 0.24c17.66 ± 7.24c
0.5-------
Shoot
3 days
Control0.08 ± 0.05e4.38 ± 0.51b1.76 ± 0.21b6.49 ± 2.15b54.73 ± 8.32a21.97 ± 4.18a81.12 ± 23.43a
0.10.36 ± 0.23d6.72 ± 0.27a2.40 ± 0.34a10.00 ± 2.43a18.66 ± 3.21b6.66 ± 1.21b27.79 ± 7.75b
0.21.04 ± 0.25c6.25 ± 0.34 a2.58 ± 0.33a9.58 ± 4.65a6.01 ± 1.02c2.31 ± 0.87c10.65 ± 2.31c
0.34.07 ± 1.14b5.48 ± 0.49ab2.48 ± 0.42a8.81 ± 2.15ab1.23 ± 0.11d0.55 ± 0.28c2.16 ± 0.56d
0.512.17 ± 5.24a5.57 ± 0.54ab2.41 ± 0.18a8.25 ± 1.35ab0.46 ± 0.10e0.20 ± 0.08c0.68 ± 0.12e
21 days
Control0.11 ± 0.03b6.59 ± 0.47a2.38 ± 0.24a10.82 ± 6.12a57.64 ± 15.66a20.82 ± 2.34a94.55 ± 22.34a
0.10.23 ± 0.14b5.31 ± 0.52ab1.59 ± 0.32b7.74 ± 1.33a23.11 ± 3.52b6.92 ± 2.32b33.64 ± 8.03b
0.20.53 ± 0.16b4.81 ± 0.12b1.81 ± 0.21b7.81 ± 0.21a9.08 ± 5.21bc3.42 ± 1.21b14.75 ± 5.21bc
0.35.29 ± 0.78a4.17 ± 0.33b1.79 ± 0.34b8.13 ± 2.36a0.79 ± 0.15c0.34 ± 0.25c1.54 ± 0.24c
0.5-------
Taproot
3 days
Control0.71 ± 0.23d5.22 ± 0.29c1.84 ± 0.15ab3.84 ± 0.89b7.38 ± 1.23a2.60 ± 0.52a5.43 ± 2.12a
0.10.96 ± 0.34d5.95 ± 0.44a1.91 ± 0.34a4.62 ± 1.25ab6.20 ± 1.67a1.99 ± 0.98ab4.79 ± 0.54ab
0.21.58 ± 0.54c5.71 ± 0.53a 1.83 ± 0.66ab4.44 ± 1.03ab3.61 ± 0.31b1.16 ± 0.42bc2.81 ± 1.08bc
0.32.14 ± 1.32b5.68 ± 0.38a1.66 ± 0.10b4.38 ± 1.22ab2.65 ± 0.34bc0.78 ± 0.18b2.04 ± 0.32b
0.53.28 ± 1.11a5.94 ± 0.47a1.94 ± 0.15a5.57 ± 2.34a1.82 ± 0.31c0.59 ± 0.08b1.71 ± 0.12b
21 days
Control0.88 ± 0.58b6.25 ± 0.21a1.93 ± 0.17a5.27 ± 2.34b6.13 ± 1.75a1.90 ± 0.34ab5.17 ± 2.36a
0.11.02 ± 0.35b5.55 ± 0.37b1.80 ± 0.35a3.50 ± 2.15b5.12 ± 1.32a2.04 ± 0.92a3.96 ± 1.03a
0.21.21 ± 0.12b5.31 ± 0.12b1.81 ± 0.21a3.81 ± 0.21b4.39 ± 1.21ab1.50 ± 0.75ab3.15 ± 1.21a
0.32.64 ± 1.13a5.15 ± 0.33b2.05 ± 0.25a10.37 ± 2.44a1.95 ± 0.32b0.78 ± 0.22b3.93 ± 1.25a
0.5-------
Lateral root
3 days
Control2.45 ± 0.76c 7.95 ± 0.65 b2.85 ± 0.31ab7.60 ± 1.24b3.24 ± 0.56a1.16 ± 0.34a3.10 ± 0.35a
0.14.37 ± 1.07b9.19 ± 0.72a3.34 ± 0.56a9.04 ± 2.36ab2.10 ± 0.43b0.76 ± 0.12b2.07 ± 0.26bc
0.24.12 ± 1.67b9.88 ± 0.24a3.28 ± 0.77a9.03 ± 0.88ab2.40 ± 0.32b0.80 ± 0.16b2.19 ± 0.52b
0.34.57 ± 2.31b9.74 ± 0.46a2.71 ± 0.32b12.01 ± 2.37a2.13 ± 0.20b0.54 ± 0.11b2.37 ± 0.08b
0.55.87 ± 0.78a7.28 ± 0.23b2.90 ± 0.32ab9.07 ± 1.33ab1.24 ± 0.05c0.49 ± 0.08b1.55 ± 0.05c
21 days
Control2.59 ± 0.61b10.37 ± 0.55a2.55 ± 0.10b5.62 ± 1.78b4.00 ± 0.78a0.98 ± 0.17a2.17 ± 0.34a
0.14.34 ± 0.98b9.57 ± 0.24ab2.16 ± 0.11c5.37 ± 3.33a2.21 ± 0.33b0.50 ± 0.12b1.24 ± 1.03a
0.24.81 ± 0.45b8.81 ± 0.12b2.11 ± 0.10c5.41 ± 2.10a1.83 ± 0.27b0.44 ± 0.22b1.12 ± 0.23a
0.35.89 ± 1.41a8.31 ± 0.42b2.89 ± 0.16a6.99 ± 2.33a1.95 ± 0.43b0.49 ± 0.25b1.19 ± 0.24a
0.5-------

