Combined Analysis of mRNAs and miRNAs to Identify Genes Related to Biological Characteristics of Autotetraploid Paulownia

1
Institute of Paulownia, Henan Agricultural University, 95 Wenhua Road, Jinshui District, Zhengzhou 450002, Henan, China
2
College of Forestry, Henan Agricultural University, 95 Wenhua Road, Jinshui District, Zhengzhou 450002, Henan, China
3
Forestry Academy of Henan, Zhengzhou 450002, Henan, China
*
Author to whom correspondence should be addressed.
Forests 2017, 8(12), 501; https://doi.org/10.3390/f8120501
Submission received: 20 September 2017
/
Revised: 5 December 2017
/
Accepted: 8 December 2017
/
Published: 13 December 2017
(This article belongs to the Section Forest Ecophysiology and Biology)
Abstract
:Autopolyploid plants and their organs are larger than their corresponding diploid ancestors, and they attract considerable attention for plant breeding. Paulownia is a fast-growing tree. To identify genes related to the biological characteristics of tetraploid Paulownia, transcriptome and small RNA sequencing were used to identify the key gene expression regulation in tetraploid Paulownia fortunei and tetraploid P. tomentosa and their corresponding diploids. A total of 1977 common differentially expressed genes (DEGs) and 89 differentially expressed miRNAs (DEMs) (38 conserved and 51 novel) were obtained in tetraploid vs. diploid comparisons of the two Paulownia species, and 18 target genes were identified by target prediction. Finally, by analyzing the expression profiles of the DEGs and DEMs and their target genes, we discovered that Pau-miR169, Pau-miR408 and Pau-miR156 interacted with their target gene nuclear transcription factor Y subunit A-9 (NF-YA9), serine/threonine protein phosphatase (PP1) and s-adenosyl-methionine-sterol-c-methyltransfera—se (SAM:SMT) to regulate the abiotic stress tolerance and the timber quality of the tetraploid Paulownia. This study lays a molecular biology foundation for understanding autotetraploid Paulownia and will benefit future breeding work.
1. Introduction
Polyploidy, or whole-genome duplication, is an important evolutionary force that causes immediate phenotypic changes in plants, including increased nuclei, cell, and stomata sizes, and larger leaves, flowers, fruits, and roots. Polyploidy species usually exhibit greater vigor, have more biomass [1] and are more adaptable and tolerant to different environmental conditions than diploids [2,3]. Many woody plants, such as mulberry, jujube, and willow carry multiple copies of the same genome, are classified as autopolyploid [4,5,6], and are attracting considerable attention for forest tree breeding.
Paulownia is a genus of fast-growing deciduous tree species, native to China. Paulownia wood has many good qualities such as being light-colored, lightweight, and knot-free; it can also be dried and processed easily. Because of these advantageous traits, Paulownia wood is widely used in building houses, farm implements, plywood, musical instruments, and furniture, as well as for environmental protection [7,8,9]. Therefore, Paulownia cultivation has an important place in national economic development. To date, many countries, including Japan, Korea, India, Australia, Brazil and others have successfully introduced Paulownia species [7,10]. With the increasing demand for wood production, in 2006, the Paulownia Polyploidization Project was initiated in our laboratory. Subsequently, several autotetraploid Paulownia species including autotetraploid Paulownia elongata, P. tomentosa × P. fortunei, P. australis, P. fortunei, P. tomentosa have been bred successfully from the corresponding diploids [11,12,13,14,15], and five new variety of Paulownia have been obtained in Henan Province, China, which has greatly enriched the Paulownia germplasm resources.
During the past few years, we have studied the evolutionary advantage of tetraploid Paulownia, such as the higher activity of peroxidases and superoxide dismutase, the larger stoma size, the higher whiteness of lumber, the higher wall-to-cavity ratio, and the larger fiber length and thickness [16,17]. Some epigenetic changes, including changes of DNA sequences and DNA methylation between diploid and autotetraploid Paulownia species have also been observed [18,19]. We also performed high-throughput sequencing, including transcriptome analysis, and microRNA (miRNA) sequencing of diploid and autotetraploid Paulownia, and compared the superiority of different diploid and autotetraploid Paulownia species under salt and drought stresses [17,20]. However, these previous studies were based on de novo transcriptome assemblies, which cannot provide irrefutable evidence of genes related to the advantage of autotetraploid Paulownia, and additional studies need to be carried out.
The lengths of unigene sequences obtained by transcriptome assembly are known to be shorter than reads matched to the Paulownia reference genome sequence, and genome data can greatly reduce the calculation intensity and improve the accuracy of genome annotation. In 2013, our team completed the sequencing of the P. fortunei genome in the BGI, Shenzhen, China. The availability of the reference genome ([21], version: v3.20130321) provides a great platform for Paulownia molecular biology research. In this study, to explore potential key gene expression regulations related to the advantage of autotetraploid Paulownia, we compared gene expression changes at genome-wide transcriptional and post-transcriptional levels in diploid and autotetraploid P. tomentosa and P. fortunei. The results will help to understand the biological characteristics of tetraploid Paulownia.
2. Materials and Methods
2.1. Plant Materials and RNA Isolation
In this study, we used tissue culture seedlings of diploid and tetraploid P. fortunei (PF2 and PF4) and diploid and tetraploid P. tomentosa (PT2 and PT4). All the seedlings were obtained from the Institute of Paulownia, Henan Agricultural University, Zhengzhou, Henan Province, China. Only one cultivar of each species of Paulownia was used, and each cultivar comes from the same individual. The four cultivar seedlings were first cultured on 1/2 Murashige and Skoog (MS) medium [22] for 30 days, respectively. Then, the terminal buds, 1.5 cm in length, were cut from the same cultivar tissue culture seedlings as above and transferred into 1/2 MS medium (40 mL), supplemented with 25 mg·L−1 sucrose and 8 mg·L−1 agar (Sangon, Shanghai, China). Three terminal buds of the same cultivar were transferred into each triangular flask. Each cultivar seedling was transferred into 20 triangular flasks. The buds were cultured at 25 ± 2 °C under 130 µmol·m−2·s−1 light intensity with a 16-h/8-h light/dark photoperiod. After 30 days, the terminal buds, 1.5 cm in length, of four samples were clipped, immediately frozen in liquid nitrogen, and stored at −80 °C.
Each Paulownia sample was made up of three biological repeats. Total RNAs were extracted from the buds of the Paulownia seedlings (PF2, PF4, PT2, and PT4) using TRIzol reagent (Invitrogen Life Technologies, Carlsbad, CA, USA) according to the manufacturer’s instructions, and then treated with DNase I. The quality of the RNAs was assessed using a NanoDrop 2000 (Thermo, Fisher, MA, USA). Each sample RNA was extracted from three biological repeats, and then the three individual RNAs were mixed in equal quantity to supply one pooled sample for the sequencing analysis.
2.2. Construction of the Paulownia cDNA Libraries and Transcriptome Sequencing Data Processing
The isolation of mRNAs from the four total RNAs and cDNAs synthesis were performed as described by Fan et al. [23]. An Agilent 2100 Bioanalyzer (Agilent Technologies, Palo Alto, CA, USA) and ABI StepOnePlus Real-Time PCR system (Applied Biosystems, Foster City, CA, USA) were used for quantification and qualification of the cDNAs. Finally, the four cDNA libraries were sequenced on an Illumina HiSeq™ 2000 platform (BGI, Shenzhen, China).
The raw reads in FASTA format were filtered using in-house Perl scripts to remove reads containing adapters, low-quality reads, and reads containing poly(N) sequences. The resultant high-quality clean reads were mapped to the P. fortunei reference genome sequence ([21], version: v3.20130321), with no more than five mismatches. The gene expression of transcripts/homeologous transcripts were identified by the method of RNA-seq by the Expectation-Maximization (RSEM) algorithm, as described by Moon et al. [24]. The expression of these transcripts was quantified using the fragments per kilo base of transcript (FPKM) method, as described by LiandDewey [25]. The criterion of the threshold with false discovery rate (FDR) ≤ 0.001, p ≤ 0.05 and |log2 ratio (tetraploid/diploid)| > 1 was used to quantify the differentially expressed genes (DEGs) in the tetraploid and their corresponding diploid. The p-value threshold in multiple tests was determined using the false discovery rate (FDR) method of Broberg [26]. Finally, Gene functional annotation was predicted based on BLAST searches (e-value cutoff of 10−5) against the NCBI’s non-redundant protein sequence (nr) database, then bioinformatics analysis of the gene ontology (GO) and Kyoto Encyclopedia of Genes and Genomes (KEGG) database was performed to assign the functions of the DEGs.
The p-value was calculated as follows (Equation (1)):
where N represents the total number of genes with GO annotation; n represents the number of DEGs in N; M represents the total number of all genes in each GO term; and m represents the number of DEGs in M. After applying the Bonferroni correction to the calculated p-value, we selected a corrected p-value of ≤0.05 as the threshold to determine significantly enriched GO terms for the DEGs. The p-value threshold in multiple hypothesis testing and analyses was determined by manipulating the false discovery rate (FDR) value [27], and two points (|log2 ratio (tetraploid/diploid)| > 1 and FDR ≤ 0.001) were used to judge the significance of the DEGs. A Q-value was defined as the FDR analog of the p-value. After multiple testing and corrections, a Q-value of ≤0.05 was taken to indicate a significantly enriched pathway among the DEGs.
2.3. Construction of Paulownia Small RNA Libraries and Small RNA Sequencing Data Processing
Total RNAs were extracted from the buds of the four Paulownia seedlings (PF2, PF4, PT2, and PT4) using TRIzol reagent following the manufacturer’s instructions. Small RNA (sRNA) libraries were built and sequenced on an Illumina GAIIx platform, according to the method proposed by Fan et al. [28]. Briefly, sRNA fragments from 18 nt to 30 nt were separated and purified by polyacrylamide gel electrophoresis, and ligated to 5′ and 3′ adaptors by T4 RNA ligase. The adaptor-ligated sRNAs were transcribed to single-stranded cDNA, and amplified by 12 PCR cycles. The products were used to build the libraries, which were sequenced on an HiSeq™ 2000 platform (BGI, Shenzhen, China).
The raw data was filtered to remove low quality reads, 5′ primer contaminants, adapters, reads without the insert tag, reads with poly(A), and reads shorter than 18 nt. The length distribution of the resultant clean reads was calculated. Then, the clean reads were mapped onto the P. fortunei reference gene and genome sequences ([21], version: v3.20130321). Perfectly matched reads were classified using BLASTN searches against the GenBank [29] and non-coding RNA (ncRNA) databases [30]; then, ncRNAs (including tRNA, rRNA, snoRNA, and other ncRNAs, except miRNAs) were removed. The remaining unique sRNA sequences were aligned with the known miRNA sequences in miRBase 21.0 database using BLASTN, allowing a maximum of two mismatches. The sequences that matched miRNAs in miRBase were considered as known miRNAs. For the remaining sRNAs that did not match a known miRNA sequence in miRBase, we used MIREAP [31] and RNAfold [32] to predict novel miRNAs using the basic criteria as described by Meyers et al. [33].
To compare the abundance of miRNAs between the diploid and tetraploid Paulownia libraries, miRNA abundance was normalized to transcript one million (Equation (2)). MiRNAs with fold changes >1 or <−1 and p ≤ 0.05 were considered to be differentially expressed miRNAs (DEMs) (Equation (3)). p-values were calculated using the previously established methods described by AudicandClaverie [34]. The formula was as follows (Equation (4)–(6)):
where N1 and N2 represent the total number of clean tags in PF2 and PF4 (or PT2 and PT4), respectively, x and y represent the number of miRNAs surveyed in PF2 and PF4 (or PT2 and PT4), respectively, C and D can be regarded as the probability discrete distribution of the p-value inspection.
Normalized expression = (actual miRNA count/total count of clean reads) × 1,000,000
Fold change = log2 (normalized read counts in tetraploid library/normalized read
counts in the diploid library)
counts in the diploid library)
2.4. Correlation Analysis of mRNA and miRNA
To define all possible miRNA–mRNA interactions, including positive and negative relationships between miRNA and mRNA expression, all the sample-matched miRNA and transcriptome (mRNA) sequencing data were analyzed in correlation. Then, the expression profiles of the DEMs were integrated with the transcriptome data to understand the functions of miRNA-target genes that related to the biological characteristics of autotetraploid Paulownia.
2.5. Verification of DEGs and DEMs by Quantitative Real-Time Polymerase Chain Reaction
The first-strand cDNAs of all the above RNAs samples were synthesized using a PrimeScript RT reagent kit (Takara, Dalian, China). Potential miRNAs and their corresponding target genes related to the biological characteristics of tetraploid Paulownia were chosen. Primers were designed with Beacon Designer, version 7.7 (Premier Biosoft International, Ltd., Palo Alto, CA, USA). The cDNAs were amplified in a Bio-Rad CFX96TM Real-Time System (Bio-Rad, Hercules, CA, USA) with SYBR Premix Ex Taq TM II (Takara, Dalian, China). The PCR cycles were 50 °C for 2 min, 95 °C for 30 s, followed by 40 cycles of 94 °C for 15 s and 60 °C for 1 min. Three replicates were analyzed for each gene. The average threshold cycle (Ct) was normalized and the relative expression changes were calculated using the 2−ΔΔCt method. The 18S rRNA and U6 were chosen as the internal reference gene for normalization of DEG and DEM. The primers used for qRT-PCR are shown in Table S1.
3. Results
3.1. Analysis of the Transcriptome Sequencing Data
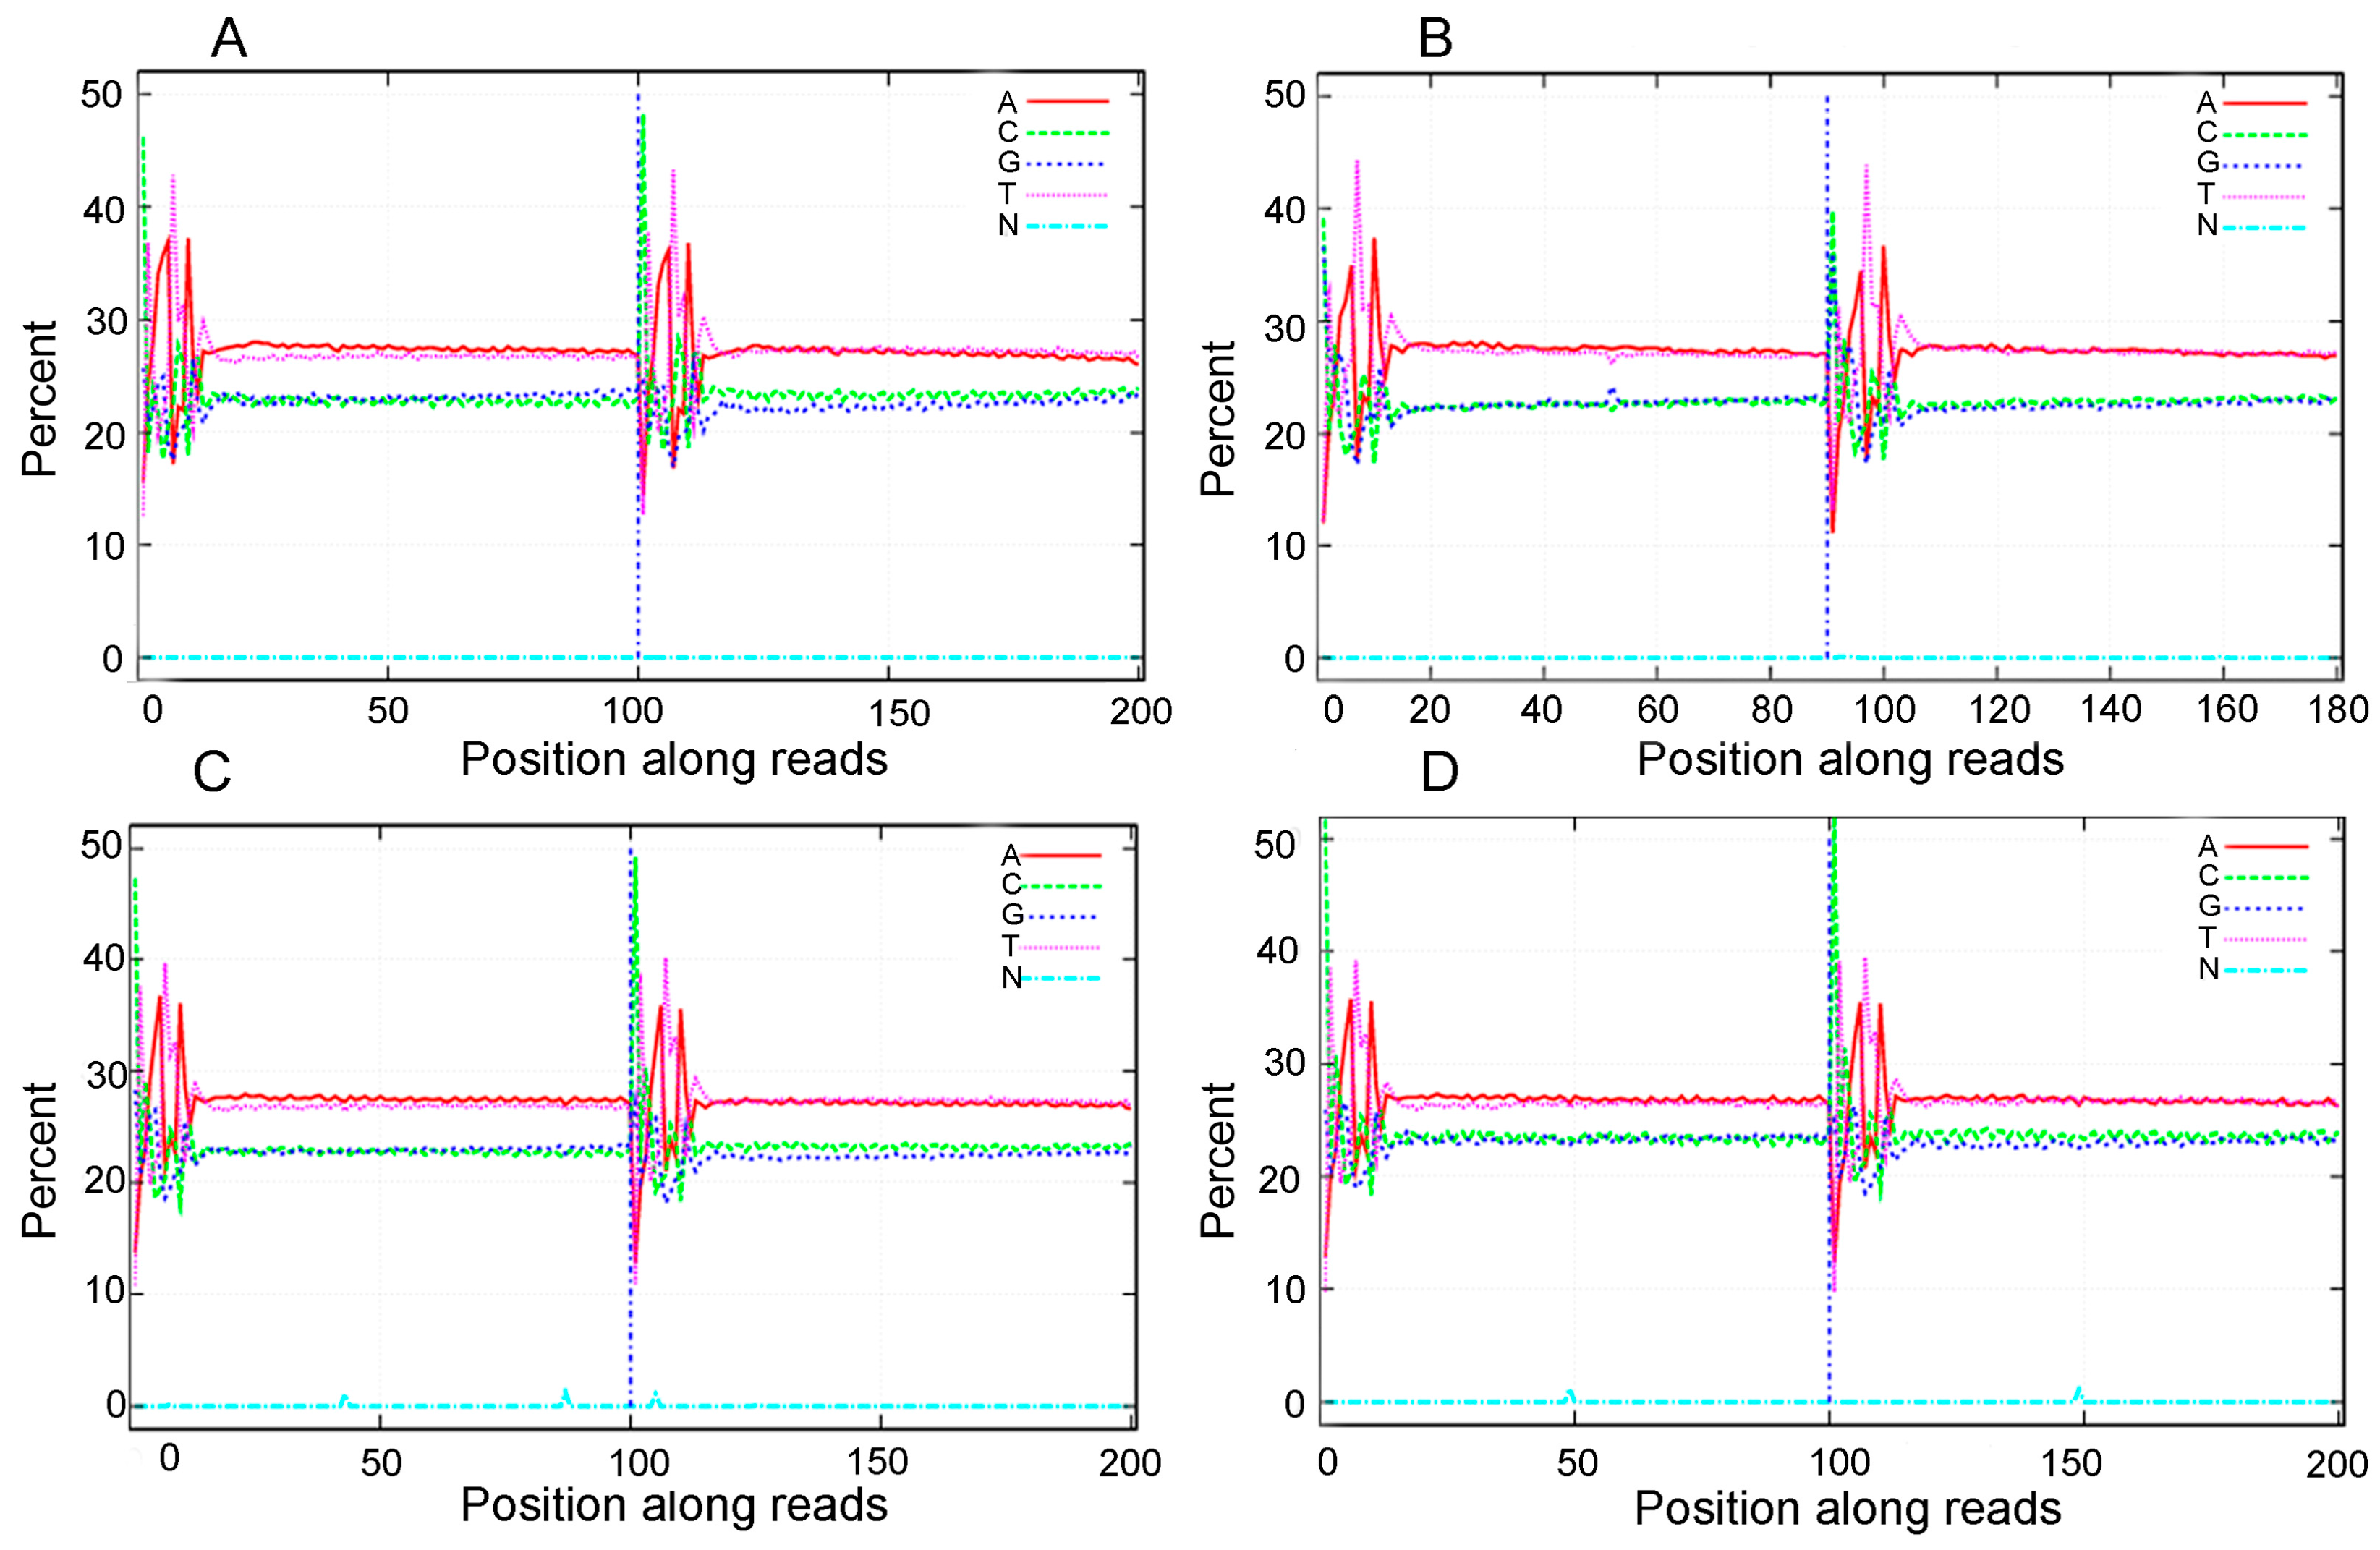
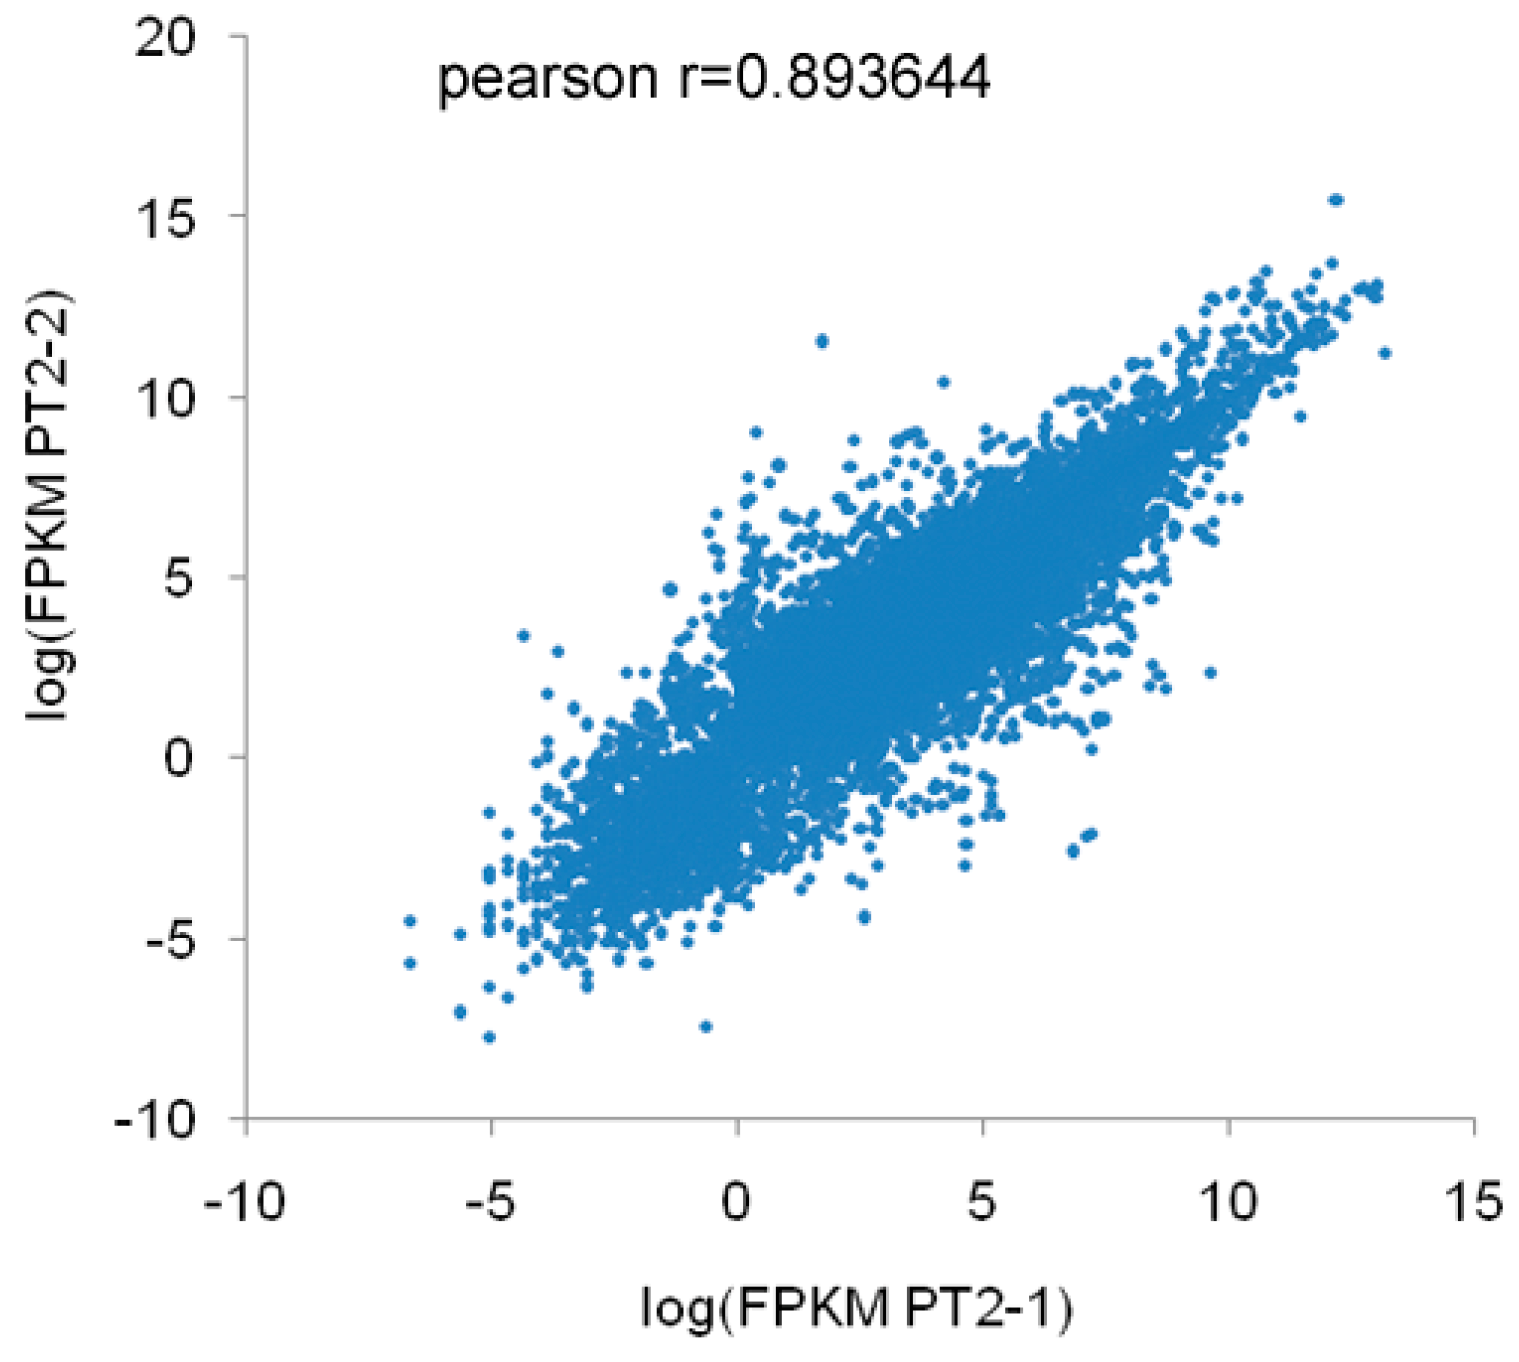
A total of 60,025,508 (PF2), 63,050,814 (PF4), 37,819,270 (PT2), and 37,817,466 (PT4) raw reads were obtained by Illumina sequencing. To determine whether the sequencing data were suitable for subsequent analysis, a quality control analysis was performed, and the results are shown in Table 1. After filtering the raw reads to remove adapters, unknown bases, and the low-quality reads, 55,415,706 (PF2), 60,184,338 (PF4), 36,303,856 (PT2), and 36,196,754 (PT4) clean reads were obtained. Subsequently, the base composition and quality of the clean data were determined by drawing base composition and quality distribution charts. The base composition of the four samples had similar trends with T and A curves and C and G curves (they were close to overlapping), demonstrating that the base composition was balanced (Figure 1). The distribution of bases along the reads showed that the ratio of low-quality bases (<20) was low (Figure S1). The clean reads were also aligned to the P. fortunei reference sequences ([21], version: v3.20130321), which revealed that the reads were evenly distributed on the gene sequence (Figure S2). The percentages of clean reads that mapped to the reference genome were 77.08% (PF2), 81.88% (PF4), 75.79% (PT2), and 77.04% (PT4) (Table S2); these results indicated that there were differences in the four libraries. The correlation coefficient of the expression of PT2 is shown in Figure 2. The result of duplicates showed linear correlations with the corresponding results. The Pearson r value was 0.8936. All these results demonstrated the high quality of the transcriptome sequencing data.
We identified DEGs in two comparisons according to the standard for defining differentially expressed genes (FDR ≤ 0.001, |log2 ratio (tetraploid/diploid)| > 1). In PF4 vs. PF2, 7072, significant DEGs were detected; 4331 DEGs were up-regulated and 2741 DEGs were down-regulated (Figure S3). In PT4 vs. PT2, 4512 significant DEGs were detected; 1684 DEGs were up-regulated and 2828 DEGs were down-regulated (Figure S4). When the |log2 ratio (tetraploid/diploid)| was changed from >1 to >10, 111 DEGs were up-regulated and 403 DEGs were down-regulated in PF4 vs. PF2, and 275 DEGs were up-regulated and 213 DEGs were down-regulated in PT4 vs. PT2. These results showed that chromosome doubling had a great impact on mRNA expression for diploid paulownia.
To determine the genes associated with outstanding features of tetraploid, we firstly looked for DEGs that were common in the two comparisons (PF4 vs. PF2 and PT4 vs. PT2). We detected 1977 common DEGs; among them, 766 DEGs had the same expression trends in the two comparisons (278 DEGs were up-regulated and 488 DEGs were down-regulated) (Table S3), in which, four tetraploid-specific DEGs (only expression in tetraploid Paulownia) in the two comparisons were obtained, including uncharacterized protein LOC100803853 (|XP_003542191.1|), ankyrin repeat domain-containing protein 13B-like (|XP_002266715.2|), cytochrome P450 93A1-like (|XP_004245721.1|), and uncharacterized protein LOC101266382 (|XP_004250299.1|), and their expression level in PF4 and PT4 was at least 11 times higher than that in PF2 and PT2. To predict the functions of the 766 DEGs with the same expression trends, GO functional analyses were carried out. The DEGs were classified into 38 GO functional categories (Figure S4), among which “plastid”, “intracellular membrane-bounded organelle”, and chloroplast part” were significantly enriched and contained the highest numbers of DEGs. In contrast, 1211 DEGs had opposite expression trends; among them, 738 DEGs were down-regulated in PT4 vs. PT2 and up-regulated in PF4 vs. PF2, and 473 DEGs were up-regulated in PT4 vs. PT2 and down-regulated in PF4 vs. PF2 (Table S4). Pathway analysis showed that 440 of 1211 DEGs did not map to the KEGG database, and the top 10 pathways of DEGs with opposite trends in the two comparsions were “plant hormone signal transduction”, “plant–pathogen interaction”, “circadian rhythm-plant”, “starch and sucrose metabolism”, “protein processing in endoplasmic reticulum”, “photosynthesis—antenna proteins”, “carbon metabolism”, “porphyrin and chlorophyll metabolism”, “biosynthesis of amino acids”, “phenylpropanoid biosynthesis”, respectively (Table S5).
3.2. Analysis of the miRNA Sequencing Data
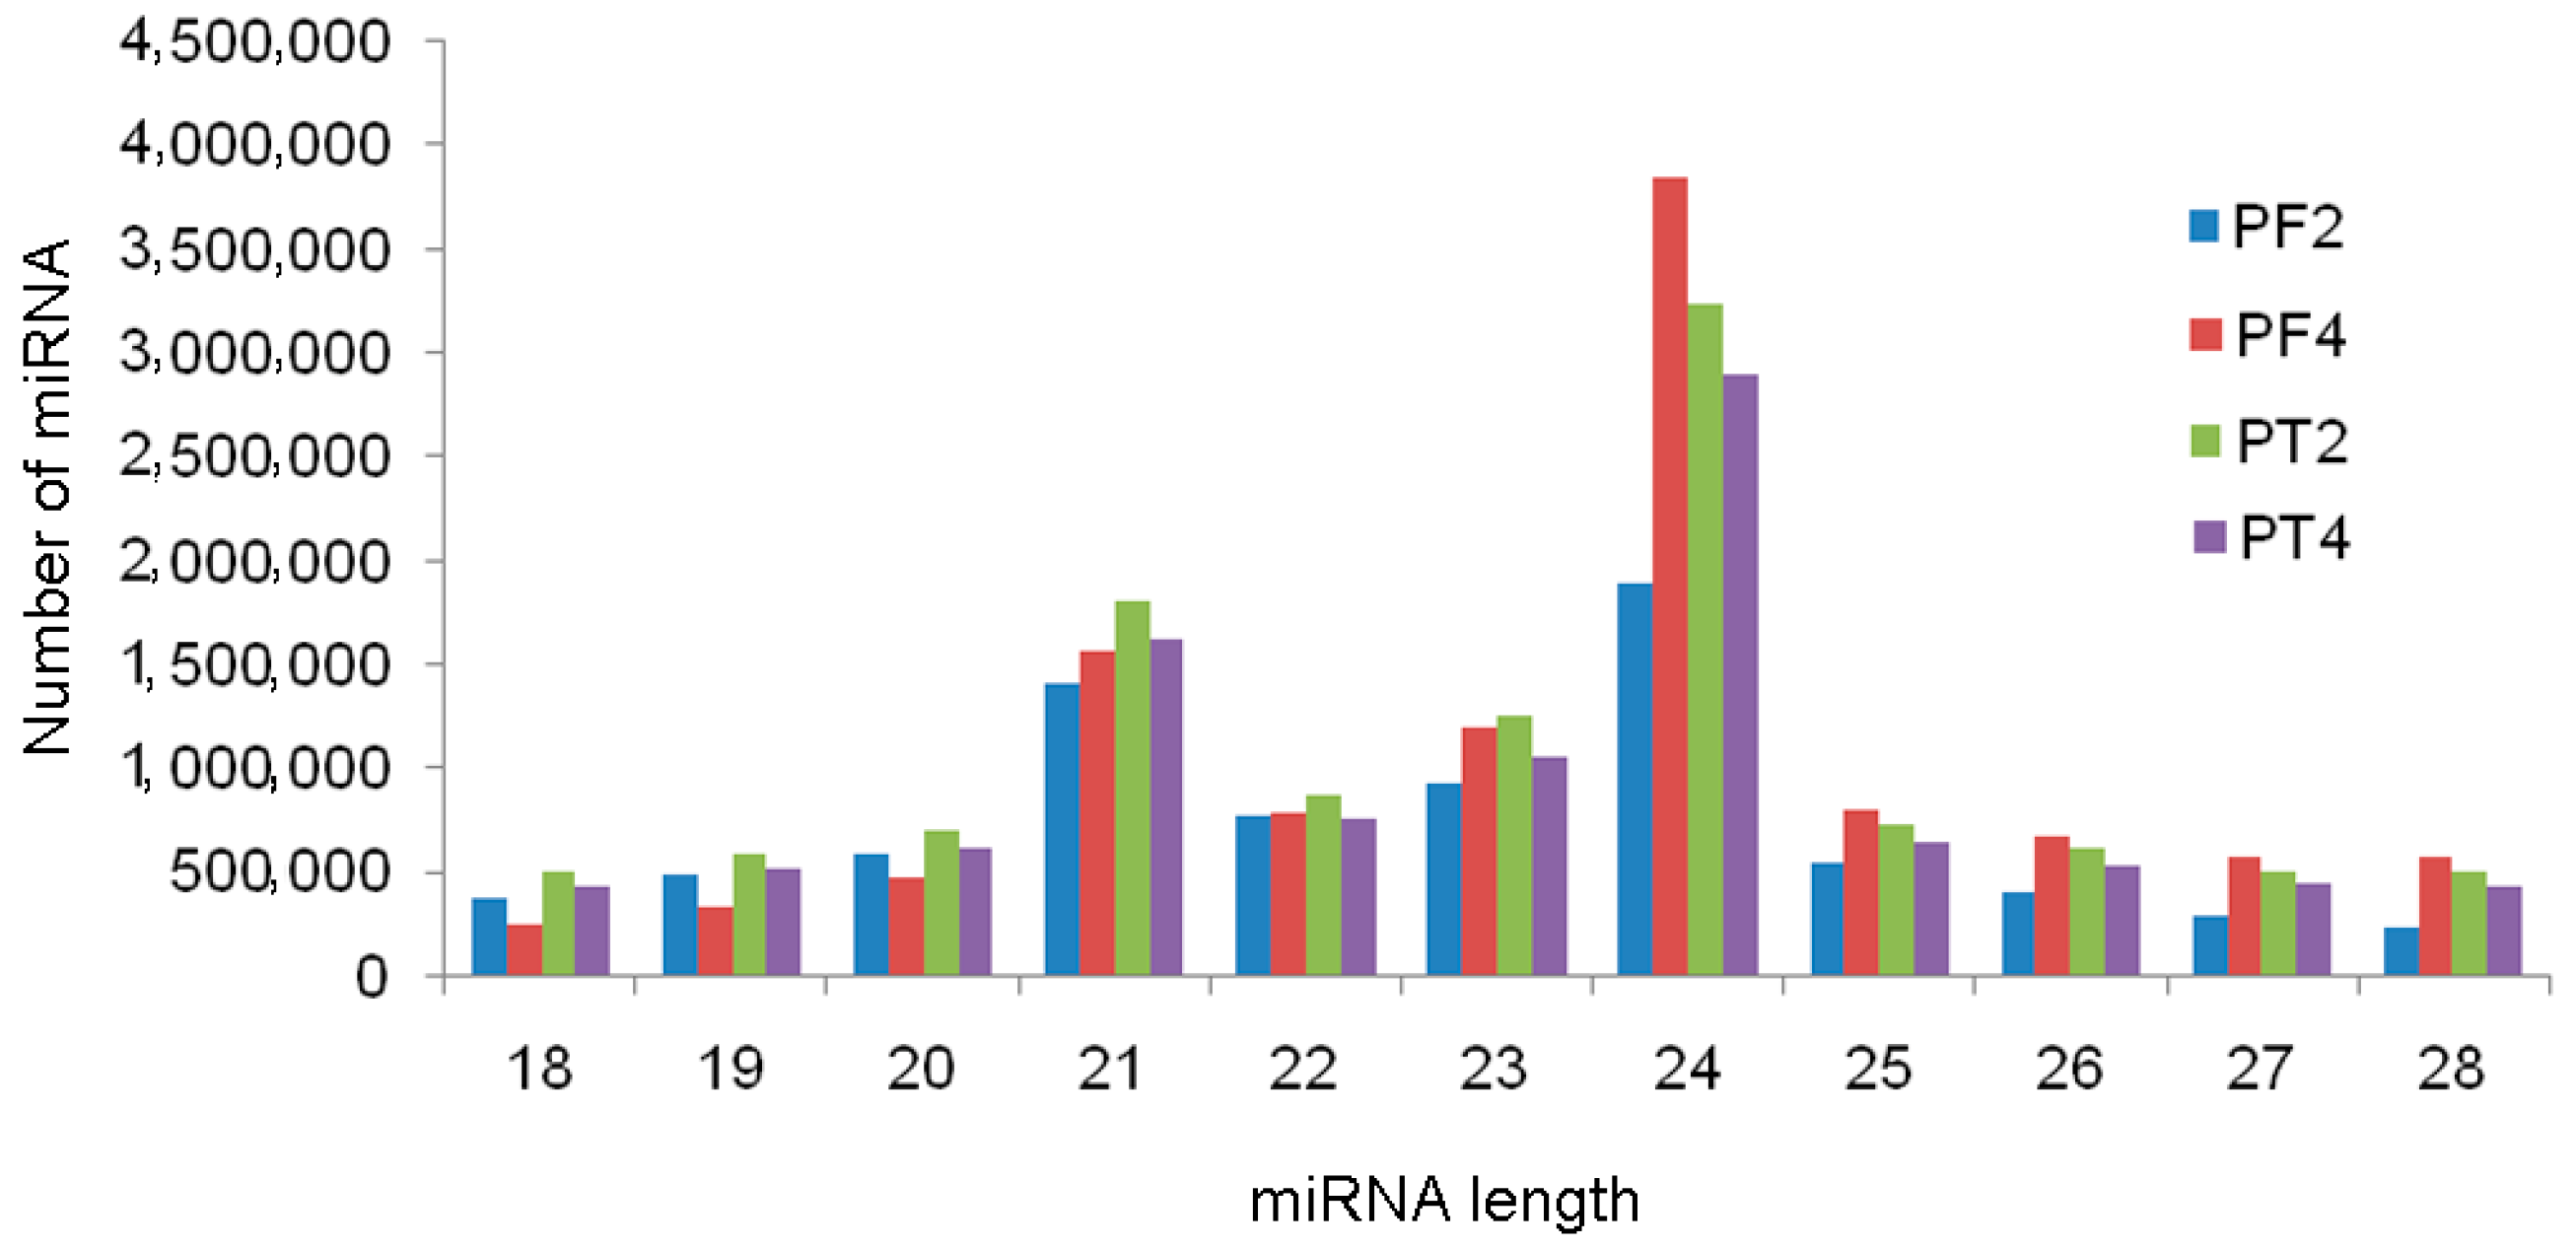
A total of 7,891,595 (PF2), 11,018,977 (PF4), 11,246,662 (PT2), and 9,885,066 (PT4) clean reads were obtained by Illumina sequencing. Overviews of the sequencing results are listed in Table 2. The percentage of clean reads in each sample was more than 70%. The length distribution analysis revealed that most reads were 18–28 nt, with a maximum at 24 nt (Figure 3), followed by 21 nt and 23 nt, and 90% of the sRNAs in the four libraries were from 20 nt to 24 nt, which was consistent with previous results [28]. These data indicated that miRNAs were rich in the four libraries.
The NCBI GenBank, Repeat, and Rfam (10.1) databases were used to annotate the sRNAs. The majority of sRNA had no annotations assigned (Table S6). Curiously, although the total sRNA numbers were high, the numbers of unique sRNAs were low: 0.40% (PF2), 0.42% (PF4), 0.54% (PT2), and 0.30% (PT2). After removing other ncRNAs, the remaining sRNAs were mapped to known miRNAs in the miRBase 21.0 database (Release 19.0, August 2012), allowing a maximum of two mismatches, to identify known miRNAs. A total of 182 (PF2), 163 (PF4), 183 (PT2), and 182 (PT4) known miRNAs were identified (Table S7). The remaining sRNAs with no matches to miRBase sequences were mapped to the P. fortunei reference genome. After that, a total of 6,944,589 (PF2), 7,586,055 (PF4), 8,302,865 (PT2), and 7,395,966 (PT4) sRNAs were mapped. The mapped sequences were used to predict novel miRNAs with MIREAP based on a precursor structure analysis. After that, a total of 139 (PF2), 158 (PF4), 163 (PT2), and 147 (PT4) novel miRNAs were obtained (Table S8).
To understand the advantage of tetraploid Paulownia related to miRNAs, DEMs were detected in the two comparisons (PF4 vs. PF2 and PT4 vs. PT2) (p ≤ 0.05, |log2 ratio (tetraploid/diploid) | > 1). Firstly, the common DEMs were calculated, a total of 122 known and 211 novel DEMs were detected in PF4 vs. PF2, and 79 known and 176 novel DEMs were detected in PT4 vs. PT2; among them, 35 common conserved and 51 common novel DEMs were obtained in the two comparisons (Tables S9 and S10). Secondly, the tetraploid-specific miRNAs in the two comparisons were also compared, and three conserved miRNAs including pau-miR156a, pau-miR171s and pau-miR390f (Table S11), and seven novel miRNAs including novel_mir_168, novel_mir_164, novel_mir_123, novel_mir_182, novel_mir_32, and two novel_mir_121 were obtained (Table S10). Then, targetFinder [35] and psRopot software [36] was used to predict the target genes of these 89 DEMs. Eighteen unique target genes were predicted to be cleaved by four conserved miRNAs and nine novel miRNAs (Table S12). Interestingly, several targets were predicted to be cleaved by more than one unique miRNA. Among them, some miRNAs from different miRNA families can be predicted to cleave the same target gene, and some miRNAs from the same miRNA families can be predicted to cleave different target genes. For example, miR36, miR128, miR125, and pau-miR169 were predicted to target the same gene (nuclear transcription factor Y subunit A-9), and pau-miR156 was predicted to target different genes (lycopene epsilon cyclase, unnamed protein product, SQUAMOSA promoter binding protein-like 1, S-adenosyl-methionine-sterol-C-methyltransferase and SQUAMOSA promoter binding protein-like 3), and the expression patterns of these miRNAs were inconsistent between PF4 vs. PF2 and PT4 vs. PT2, indicating that the regulation relationship of miRNAs-targets was complicated in the process of paulownia chromosome doubling.
3.3. Identification of the Key Genes Related to the Biological Characteristics of Tetraploid Paulownia
In this study, a total of 1977 DEGs and 89 DEMs (86 common DEMs and three tetraploid-specific miRNA) were identified through transcriptome and miRNA sequencing analysis between diploid and autotetraploid P. tomentosa and P. fortunei. In order to determine the biological characteristics of tetraploid paulownia associated with key gene expression regulation, the expression profiles of the DEMs were integrated with the transcriptome data to predict possible miRNA–mRNA interactions. The results indicated that 76 DEMs could not be integrated with the transcriptome data; these DEMs could not be predicted to target genes by targetFinder and psRopot software; only 13 DEMs were predicted to target 18 genes (Table S12), of which three tetraploid-specific DEMs (one conserved miRNA and two novel miRNAs) were predicted to target eight genes. The annotation results of these 18 target genes showed that they encoded two-component response regulator ARR18-like isoform 1 (PAU010926.1), nuclear transcription factor Y subunit A-9 (PAU026346.1), flowering time control protein FPA-like (PAU014657.1), phospholipase A(1) LCAT3 (PAU006394.1), heat shock protein 80 (PAU029277.1), lycopene epsilon cyclase (PAU004212.1), SQUAMOSA promoter binding protein-like 1 (PAU009402.1), SQUAMOSA promoter binding protein-like 3 (PAU027235.1), and serine/threonine-protein phosphatase PP1 isozyme 3-like (PAU029273.1). After that, we matched the annotation results of these 18 target genes to the four tetraploid-specific DEGs; the results showed that not all of the target genes were matched to the the four tetraploid-specific DEGs, but most of the target genes mapped to the other common DEGs. The functional analysis of these target genes demonstrated that they play significant roles in the regulation of transcription, cellular processes, plant defense, and signal transduction.
3.4. qRT-PCR Validation
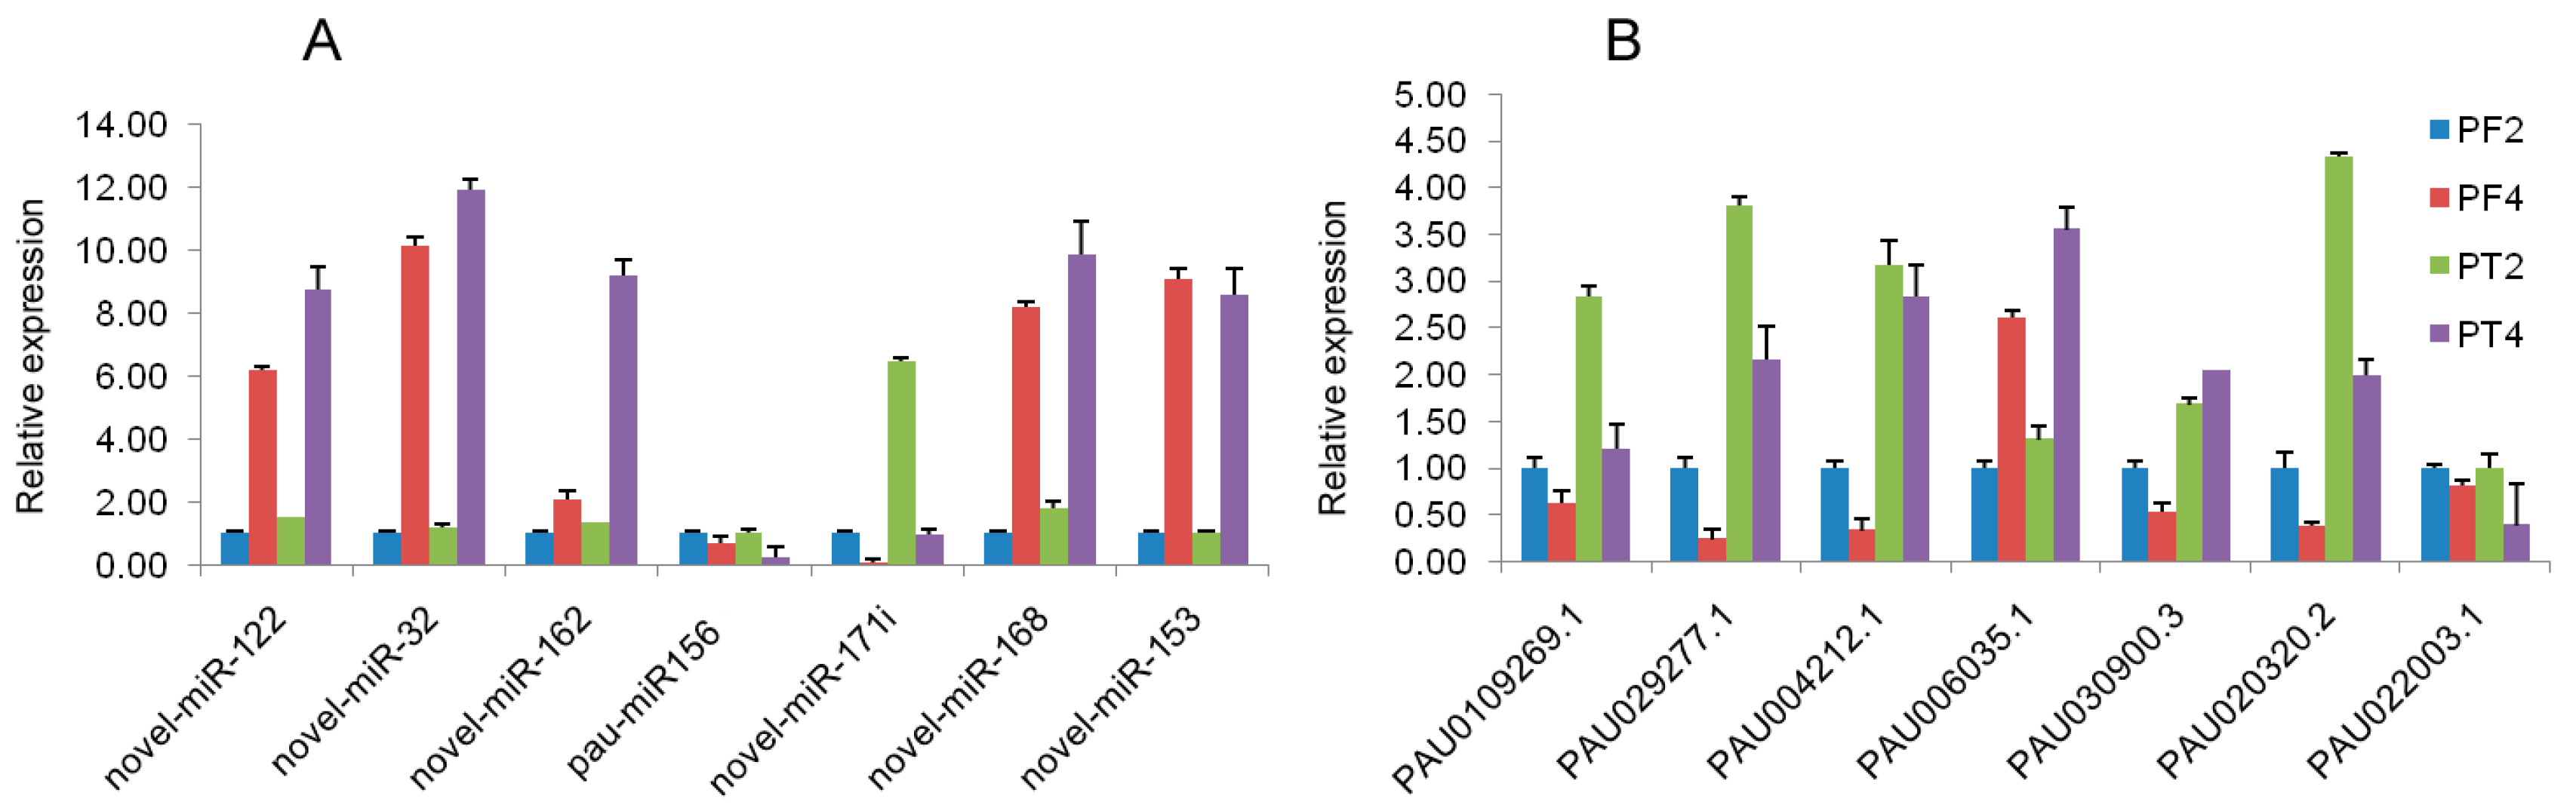
To confirm the expression profiles of miRNA and mRNA obtained by high-throughput sequencing, real-time qRT-PCR was performed to detect the expression levels of seven mRNAs and seven miRNAs (Figure 4A,B). The results showed that the expression levels of the DEGs and the DEMs were consistent with those generated from high-throughput sequencing, and the expressions of five miRNAs had a negative correlation with their corresponding target genes, such as novel_mir_122/PAU010926.1, novel_mir_32/PAU029277.1, novel_mir_162/PAU004212.1, novel_mir_153/PAU020320.2, pau-miR156/PAU006035.1, while the novel_mir_168/PAU030900.3 showed a negative regulation relation in PF4 vs. PF2, and a positive regulation relation in PT4 vs. PT2. The qRT-PCR results indicated that the regulation of miRNA was complex, and confirmed that the transcriptome and small RNA sequencing data in the present study were reliable to assess the mRNA–miRNA interactions to understand the biological characteristics of tetraploid Paulownia.
4. Discussion
Polyploidy can cause phenotypic changes and give rise to new allelic variants through the alteration of dosage-regulated gene expression [37]. Ploidy-dependent gene regulation has been studied in plants under abiotic and biotic stresses [38,39]. Previous results revealed that tetraploid Paulownia was superior to its corresponding diploid as it had better timber quality, higher activity of peroxidases and superoxide dismutase, larger stoma size, and higher stress resistance [15,16], and changes in gene expression between diploid and tetraploid Paulownia have been reported [17,28,40,41], but these results were based on de novo transcriptome data, which might not provide sufficient evidence to fully understand ploidy-dependent gene regulation. Therefore, in this study, we not only compared the gene expression in the two diploid and autotetraploid Paulownia at the transcriptional level and post-transcriptional level based on the genome data, but also compared the results between previous de novo assemblies and this genome result. Finally, we identified some potential genes related to the biological characteristics of tetraploid Paulownia. Then, we further analyzed the potential functions of key genes’ expression in the biological characteristics of tetraploid Paulownia.
4.1. DEMs Mediated Their Target Genes That Increased the Abiotic Stress Tolerance in Tetraploid Paulownia
MiRNAs are gene regulators which function as negative post-transcriptional regulators during plant development. MiRNAs not only function as plant phenotypic regulators, but also play important roles in adaption to stress conditions [42]. To verify the significant DEMs in tetraploid Paulownia (p ≤ 0.05, |log2 ratio (tetraploid/diploid)| > 1), we compared the DEMs between the P. fortunei reference genome and previously reported transcriptome assemblies. Finally, we found that the numbers of miRNAs and miRNA families were not identical. At the genome level, 89 significant DEMs were identified among the four libraries, whereas, at the transcriptome level, 88 DEMs were identified in our previous P. fortunei diploid and tetraploid result [40], and 29 DEMs were identified in the P. tomentosa diploid and tetraploid result [28]. By comparing the DEMs in the two diploid and tetraploid Paulownia species at the genome and previous transcriptome levels, we identified seven significant miRNAs families involved in tetraploid Paulownia chromosome doubling: miR2, miR156, miR169, miR171, miR397, miR399, and miR408. Nevertheless, not all the target genes were predicted at the genome level; only the targets of miR156, miR169, and miR408 were predicted, and the expression levels of these miRNAs exhibited a negative regulation correlation with their corresponding target genes between the diploid and tetraploid.
pau-miR169, which was down-regulated (11.52-fold) in tetraploid P. fortunei, and its target gene, which encodes nuclear transcription factor Y subunit A-9 (NF-YA9), were up-regulated in PF4. Increasing evidence has shown that NF-Y transcription factors can act as switches in the complex regulatory networks that control abiotic stress processes [43]. In Foxtail millet, over-expression of NF-Y transcription factors activated the stress-related genes NtERD10 and NtCAT, and improved physiological traits, including maintaining stable relative water content, and chlorophyll and malondialdehyde content in transgenic lines under stresses; at the same time, NF-Ys can also improve stress tolerance by mediating abscisic acid (ABA)-dependent and ROS signal pathways, which might be involved in the Ca2+ fluxes, and sugar sensing, H2O2 signal pathway, and can further enhance plant drought and salt tolerance [44,45,46]. Besides pau-miR169, NF-YA9 was also targeted by several novel miRNAs, such as novel miR36, novel miR128 and novel miR125, but the expression levels of these miRNAs were not completely negatively correlated with the expression of NF-YA9. These miRNAs may take part in other co-expression regulatory pathways, but the pau-miR169-NF-YA9 might be one of the important factors that increased the abiotic stress tolerance in the tetraploid Paulownia.
In the present study, pau-miR408 was down-regulated in tetraploid P. tomentosa, and its targets encoding serine/threonine protein phosphatase (PP1) were up-regulated. PP1 can regulate the cellular signal, cell cycle, and cellular metabolism [47]. Liao et al. [48] revealed that in transgenic rice, over-expressing OsPP1a exhibited higher survival rates and plant heights, fewer oxidative injuries, and grew faster than the non-transgenic lines that were exposed to salt treatment, meanwhile, they induced the stress-responsive genes SnRK1A, OsNAC5 and OsNAC6. These important genes could regulate downstream targets that are associated with the accumulation of compatible solutes, Na+ ions, H2O2 and malondialdehyde, and further enhanced tolerance to abiotic stress. Hence, pau-miR408 medicated the target gene PP1 which might enhance the abiotic stress tolerance of tetraploid Paulownia. The other miRNA, pau-miR171, was down-regulated (15.15-fold) in PF4 vs. PF2, but no target was predicted for it. It has been reported that pau-miR171 can increase drought and salt tolerance by regulating shoot development [49], implying that the differentially expressed miR171 might regulate other biological characteristic of tetraploid Paulownia. Therefore, we considered the interaction between miR169-NF-YA9 and pau-miR408-PP1 as the significant gene expression regulation that could enhance the abiotic stress tolerance of the tetraploid Paulownia.
4.2. DEM Target Gene Involved in Epigenetic Alterations That Regulated Tetraploid Paulownia Timber Quality
Epigenetics is the study of changes in gene expression that do not involve changes in the DNA sequence. DNA methylation is a major epigenetic modification of genomic DNA and an important means of regulating phenotypic variations [50,51]. Increasing evidence has shown that DNA methylation variations are involved in polyploidization events [52,53]. In our previous research, AFLP analyses indicated that the DNA sequence of the two diploid and tetraploid Paulownia did not change, while MSAP analyses showed that the DNA methylation level was higher in tetraploid Paulownia than in that of diploid, and the DNA methylation pattern also changed [19]. In this study, we compared the length distribution of the sRNAs at the level of the reference genome and the previously reported transcriptome, and identified that the majority of sRNAs in these four libraries were 24 nt in length, followed by 21-nt sRNAs, and, at the previous transcriptome level, the majority of sRNAs were also 21–24 nt in length with a peak at 24 nt, followed by 21 nt, but the proportion of 21-nt sRNAs was lower in PF4 compared with PF2 [28,40]. Similar results have also been reported in other polyploid plants, such as raphanobrassica and rice [54,55]. It has been reported that 24-nt sRNAs can not only promote plant cell division and morphogenesis, but also target DNA methylation to regulate gene expression [56], suggesting that DNA methylation might be related to tetraploid Paulownia phenotypic variations.
Interestingly, in this miRNA sequencing, the DEM, miR156, was down-regulated in the two tetraploid paulownias, its target gene encoded S-adenosyl-methionine-sterol-C-methyltransferase (SAM:SMT), and the expression of SAM:SMT was up-regulated in the mRNA sequencing. It was reported that plant SAM:SMT can transfer one or two methyl groups to methylate a variety of Δ24-sterols at the C-24 position, such as brassinosteroids, to further regulate the phytosterol biosynthesis. Therefore, high expression of SAM:SMT can regulate the plant growth and development [57,58]. Evidence has shown that exogenously applied 24-epi brassinolide increased the length of fiber and vessel elements, which played an important role in the timber quality of woody species [59]. Illuminating that interaction of miR156–SAM:SMT might increase the fiber length of tetraploid Paulownia; this result was consistent with our previous research showing that the fiber length of tetraploid Paulownia was longer than the corresponding diploid [16]. Therefore, miR156–SAM:SMT might be involved in tetraploid Paulownia timber quality, which should be verified in future studies.
5. Conclusions
In this study, we performed a comparative analysis of the mRNA and miRNA expression in two diploids and tetraploids—P. fortunei and P. tomentosa—using Illumina sequencing. A total of 1977 common DEGs were generated by transcriptome sequencing, among which, 766 DEGs had the same expression trends and 1211 DEGs had the opposite expression trends; 89 DEMs were obtained by small RNA sequencing, of which 86 were common DEMs, and three were tetraploid-specific miRNA. Subsequently, target genes of 89 DEMs were predicted, and only 13 DEMs were predicted to target 18 genes, and most of these target genes can be mapped to the 1977 DEGs by mRNA and miRNA correlation analysis. By analyzing the functions of DEM target genes, we discovered pau-miR169-NF-YA9 and pau-miR408-PP1, which might be associated with the higher abiotic stress tolerance of the tetraploid Paulownia, and pau-miR156-medicated target gene SAM:SMT, which might regulate the higher timber quality of tetraploid Paulownia by epigenetic alterations. These results will contribute to the selection of specific genes in the tetraploid P. fortunei and P. tomentosa for breeding new varieties. Future work will aim at confirming the function of these genes in the tetraploid Paulownia by transgenic experiments, which will provide more information to understand the characteristics of polyploid plants.
Supplementary Materials
The following are available online at www.mdpi.com/1999-4907/8/12/501/s1: Table S1: Primers of DEGs and DEMs for qRT-PCR analysis; Table S2: The statistics of clean reads mapped to reference gene and genome; Table S3: Common expression DEGs in the two comparison; Table S4: The opposite expression trends of DEGs in the two comparisons; Table S5: The top 10 pathways of DEGs with opposite trends in the two comparisons; Table S6: Classification of Paulownia’s RNAs from diploid and tetraploid libraries *: unnanotied; Table S7: Known miRNA of four Paulownia samples; Table S8: New miRNAs of four Paulownia samples; Table S9: Common known DEMs of four Paulownia samples; Table S10: Common new DEMs of four Paulownia samples; Table S11: Tetraploid paulownia-specific known DEMs; Table S12: Targets of miRNA matched to DEGs; Figure S1: Base quality distribution of four Paulownia samples (A): Base quality distribution of diploid P. fortunei; (B): Base quality distribution of tetraploid P. fortunei; (C): Base quality distribution of diploid P. tomentosa; (D): Base quality distribution of tetraploid P. tomentosa.; Figure S2: The reads distribution of four Paulownia samples in gene location (A): The reads distribution of diploid P. fortunei in gene location; (B): The reads distribution of tetraploid P. fortunei in gene location; (C): The reads distribution of diploid P. tomentosa in gene location; (D): The reads distribution of tetraploid P. tomentosa in gene locatio.; Figure S3: DEG analysis of four Paulownia samples; Figure S4: GO classification of DEGs.
Acknowledgments
Natural Science Foundation of Henan Province of China (162300410158). National Key Research and Development Plan (2016YFD0600106).
Author Contributions
G.F. conceived, designed and performed the experiments; E.X. analyzed the transcriptome data; X.Z. analyzed the miRNA data; Y.D. performed sample treatment, and seedling inoculation; X.C. wrote the paper. All authors read and provided comments and approved the final manuscript.
Conflicts of Interest
The authors declare no conflict of interest.
References
- Dhooghe, E.; Van Laere, K.; Eeckhaut, T.; Leus, L.; Van Huylenbroeck, J. Mitotic chromosome doubling of plant tissues in vitro. Plant Cell Tissue Org. Cult. 2011, 104, 359–373. [Google Scholar] [CrossRef]
- Doumett, S.; Lamperi, L.; Checchini, L.; Azzarello, E.; Mugnai, S.; Mancuso, S.; Petruzzelli, G.; Del Bubba, M. Heavy metal distribution between contaminated soil and Paulownia tomentosa, in a pilot-scale assisted phytoremediation study: Influence of different complexing agents. Chemosphere 2008, 72, 1481–1490. [Google Scholar] [CrossRef] [PubMed]
- Podda, A.; Checcucci, G.; Mouhaya, W.; Centeno, D.; Rofidal, V.; Del Carratore, R.; Luro, F.; Morillon, R.; Ollitrault, P.; Maserti, B.E. Salt-stress induced changes in the leaf proteome of diploid and tetraploid mandarins with contrasting Na+ and CL− accumulation behaviour. J. Plant Physiol. 2013, 170, 1101–1112. [Google Scholar] [CrossRef] [PubMed]
- Dai, F.; Wang, Z.; Luo, G.; Tang, C. Phenotypic and transcriptomic analyses of autotetraploid and diploid mulberry (Morus alba L.). Int. J. Mol. Sci. 2015, 16, 22938–22956. [Google Scholar] [CrossRef] [PubMed]
- Shi, Q.H.; Liu, P.; Liu, M.J.; Wang, J.R.; Xu, J. A novel method for rapid in vivo induction of homogeneous polyploids via calluses in a woody fruit tree (Ziziphus jujuba Mill.). Plant Cell Tissue Org. Cult. 2015, 121, 423–433. [Google Scholar] [CrossRef]
- Dudits, D.; Török, K.; Cseri, A.; Paul, K.; Nagy, A.V.; Nagy, B.; Sass, L.; Ferenc, G.; Vankova, R.; Dobrev, P. Response of organ structure and physiology to autotetraploidization in early development of energy willow Salix viminalis. Plant Physiol. 2016. [Google Scholar] [CrossRef] [PubMed] [Green Version]
- Krikorian, A.D. Paulownia in china: Cultivation and utilization. Econ. Bot. 1988, 42, 283. [Google Scholar] [CrossRef]
- Jey, A. Paulownia Plantation Experiences and Profitable Timber Production. In Proceedings of the Plantation and Regrowth Forestry—A diversity of opportunity, Australian Forest Growers Biennial Conference, Lismore, Australia, 6–9 July 1998; pp. 199–214. [Google Scholar]
- Kalaycioglu, H.; Deniz, I.; Hiziroglu, S. Some of the properties of particleboard made from paulownia. J. Wood Sci. 2005, 51, 410–414. [Google Scholar] [CrossRef]
- Ipekci, Z.; Gozukirmizi, N. Direct somatic embryogenesis and synthetic seed production from Paulownia elongata. Plant Cell Rep. 2003, 22, 16–24. [Google Scholar] [CrossRef] [PubMed]
- Fan, G.; Yang, Z.; Cao, Y.; Liu, F.; Jia, F. Autotetraploid induction of Paulownia elongata with colchione. J. Nucl. Agric. Sci. 2006, 20, 473–476. [Google Scholar]
- Fan, G.; Zhai, X.; Wei, Z.; Yang, Z. Induction of autotrtraploid from the saomtic cell of Paulownia tomentosa × Paulownia fortunei and its in vitro plantlet regeneration. J. NE Forestry. Univ. 2010, 38, 22–26. [Google Scholar]
- Fan, G.; Wei, Z.; Yang, Z. Induction of autotetraploid of Paulownia australis and its in vitro plantlet regeneration. J. Northwest A F Univ. 2009, 37, 83–90. [Google Scholar]
- Fan, G.; Zhang, X.; Deng, M. Induction of autotetraploid Paulownia fortunei. Sci. Silv. Sin. 2007, 43, 31–35. [Google Scholar]
- Fan, G.Q.; Cao, Y.C.; Zhai, Z.; Yang, Z.Q. Induction of autotetraploid of Paulownia tomentosa (Thunb.) steud. Plant Physiol. Commun. 2007, 109, 43. [Google Scholar]
- Zhai, X.; Zhang, X.; Zhao, Z.; Deng, M.; Fan, G. Study on wood physical properties of tetraploid Paulownia fortunei. J. Henan Agric. Univ. 2012, 46, 651–654. [Google Scholar]
- Zhang, X.; Deng, M.; Fan, G. Differential transcriptome analysis between Paulownia fortunei and its synthesized autopolyploid. Int. J. Mol. Sci. 2014, 15, 5079–5093. [Google Scholar] [CrossRef] [PubMed]
- Zhang, X.; Fan, G.; Zhao, Z.; Cao, X.; Zhao, G.; Deng, M.; Dong, Y. Analysis of diploid and its autotetraploid Paulownia tomentosa × Paulownia fortunei with AFLP and MSAP. Sci. Silv. Sin. 2013, 49, 167–172. [Google Scholar]
- Zhai, X.; Zhang, X.; Fan, G.; Zhao, Z.; Cao, X. Analysis of diploid and its autotetraploid Paulownia tomentosa with AFLP and MSAP. J. Henan Agric. Univ. 2015, 49, 89–93. [Google Scholar]
- Deng, M.; Zhang, X.; Fan, G.; Zhao, Z.; Dong, Y.; Wei, Z. Comparative studies on physiological responses to salt stress in tetraploid paulownia plants. J. Cent. South Univ. For. Technol. 2013, 33, 42–46. [Google Scholar]
- Paulownia Genome Database, Henan Agricultural University. Available online: http://paulownia.genomics.cn (accessed on 21 March 2013).
- Murashige, T.; Skoog, F. A revised medium for rapid growth and bio assays with tobacco tissue cultures. Physiol. Plant. 2010, 15, 473–497. [Google Scholar] [CrossRef]
- Fan, G.; Wang, L.; Dong, Y.; Zhao, Z.; Deng, M.; Niu, S.; Zhang, X.; Cao, X. Genome of paulownia (Paulownia fortunei) illuminates the related transcripts, mirRNA and proteins for salt resistance. Sci. Rep. 2017, 7, 1285. [Google Scholar] [CrossRef] [PubMed]
- Moon, T.K. Te expectation-maximization algorithm. IEEE Signal Process. Mag. 2000, 13, 47–60. [Google Scholar] [CrossRef]
- Li, B.; Dewey, C.N. Rsem: Accurate transcript quantification from rna-seq data with or without a reference genome. BMC Bioinform. 2011. [Google Scholar] [CrossRef] [PubMed]
- Broberg, P. A comparative review of estimates of the proportion unchanged genes and the false discovery rate. BMC Bioinform. 2005, 6, 199. [Google Scholar] [CrossRef] [PubMed] [Green Version]
- Benjamini, Y.; Yekutieli, D. The control of the false discovery rate in multiple testing under dependency. Ann. Stat. 2001, 29, 1165–1188. [Google Scholar]
- Fan, G.; Zhai, X.; Niu, S.; Ren, Y. Dynamic expression of novel and conserved microRNAs and their targets in diploid and tetraploid of Paulownia tomentosa. Biochimie 2014, 102, 68–77. [Google Scholar] [CrossRef] [PubMed]
- BLAST. Available online: http: //www.ncbi.nlm.nih.gov/ (accessed on 29 January 2015).
- Rfam. Available online: http://rfam.sanger.ac.uk/ (accessed on 11 November 2014).
- MicroRNA Discovery By Deep Sequencing. Available online: http://sourceforge.net/projects/mireap/ (accessed on 27 March 2013).
- RNAfold web server. Available online: http://rna.tbi.univie.ac.at/cgi-bin/RNAfold.cgi (accessed on 10 January 1981).
- Meyers, B.C.; Axtell, M.J.; Bartel, B.; Bartel, D.P.; Baulcombe, D.; Bowman, J.L.; Cao, X.; Carrington, J.C.; Chen, X.; Green, P.J. Criteria for annotation of plant microRNAs. Plant Cell 2008, 20, 3186–3190. [Google Scholar] [CrossRef] [PubMed]
- Audic, S.; Claverie, J. The significance of digital gene expression profiles. Genome Res. 1997, 7, 986–995. [Google Scholar] [CrossRef] [PubMed]
- carringtonlab/TargetFinder. Available online: https://github.com/carringtonlab/TargetFinder (accessed on 17 March 2014).
- psRobot: Plant Small RNA Analysis Toolbox. Available online: http://omicslab.genetics.ac.cn/psRobot (accessed on 12 March 2012).
- Saminathan, T.; Nimmakayala, P.; Manohar, S.; Malkaram, S.; Almeida, A.; Cantrell, R.; Tomason, Y.; Abburi, L.; Rahman, M.A.; Vajja, V.G. Differential gene expression and alternative splicing between diploid and tetraploid watermelon. J. Exp. Bot. 2014, 66, 1369–1385. [Google Scholar] [CrossRef] [PubMed]
- Podwyszyńska, M.; Gabryszewska, E.; Dyki, B.; Stępowska, A.; Kowalski, A.; Jasiński, A. Phenotypic and genome size changes (variation) in synthetic tetraploids of daylily (Hemerocallis) in relation to their diploid counterparts. Euphytica 2015, 203, 1–16. [Google Scholar] [CrossRef]
- Balal, R.M.; Shahid, M.A.; Vincent, C.; Zotarelli, L.; Liu, G.; Mattson, N.S.; Rathinasabapathi, B.; Martínez-Nicolas, J.J.; Garcia-Sanchez, F. Kinnow mandarin plants grafted on tetraploid rootstocks are more tolerant to cr-toxicity than those grafted on its diploids one. Environ. Exp. Bot. 2017, 140, 8–18. [Google Scholar] [CrossRef]
- Niu, S.; Fan, G.; Zhao, Z.; Deng, M.; Dong, Y. High-throughput sequencing and degradome analysis reveal microRNA differential expression profiles and their targets in Paulownia fortunei. Plant Cell Tissue Org. Cult. 2014, 119, 457–468. [Google Scholar] [CrossRef]
- Fan, G.; Wang, L.; Deng, M.; Niu, S.; Zhao, Z.; Xu, E.; Cao, X.; Zhang, X. Transcriptome analysis of the variations between autotetraploid Paulownia tomentosa and its diploid using high-throughput sequencing. Mol. Genet. Genom. 2015, 290, 1627–1638. [Google Scholar] [CrossRef] [PubMed]
- Ferdous, J.; Sanchez-Ferrero, J.C.; Langridge, P.; Milne, L.; Chowdhury, J.; Brien, C.; Tricker, P.J. Differential expression of micrornas and potential targets under drought stress in barley. Plant Cell Environ. 2017, 40, 11–24. [Google Scholar] [CrossRef] [PubMed]
- Bi, C.; Ma, Y.; Wang, X.F.; Zhang, D.P. Overexpression of the transcription factor NF-YC9 confers abscisic acid hypersensitivity in Arabidopsis. Plant Mol. Biol. 2017, 95, 425–439. [Google Scholar] [CrossRef] [PubMed]
- Myers, Z.A.; Kumimoto, R.W.; Siriwardana, C.L.; Gayler, K.K.; Risinger, J.R.; Pezzetta, D.; Holt III, B.F. Nuclear factor Y, subunit C (NF-YC) transcription factors are positive regulators of photomorphogenesis in Arabidopsis thaliana. PLoS Genet. 2016, 12, e1006333. [Google Scholar] [CrossRef] [PubMed]
- Feng, X.; Qiao, Y.; Mao, K.; Hao, Y.; You, C. Overexpression of arabidopsis atmiR408 gene in tobacco. Acta Biol. Crac. Bot. 2010, 52, 26–31. [Google Scholar] [CrossRef]
- Chen, M.; Zhao, Y.; Zhuo, C.; Lu, S.; Guo, Z. Overexpression of a NF-YC transcription factor from bermudagrass confers tolerance to drought and salinity in transgenic rice. Plant Biotechnol. J. 2015, 13, 482–491. [Google Scholar] [CrossRef] [PubMed]
- Verbinnen, I.; Ferreira, M.; Bollen, M. Biogenesis and activity regulation of protein phosphatase 1. Biochem. Soc. Trans. 2017, 45, 89–99. [Google Scholar] [CrossRef] [PubMed]
- Liao, Y.D.; Lin, K.H.; Chen, C.C.; Chiang, C.M. Oryza sativa protein phosphatase 1a (OsPP1a) involved in salt stress tolerance in transgenic rice. Mol. Breed. 2016, 36, 1–19. [Google Scholar] [CrossRef]
- Wang, L.; Mai, Y.X.; Zhang, Y.C.; Luo, Q.; Yang, H.Q. MicroRNA171c-targeted SCL6-II, SCL6-III, and SCL6-IV genes regulate shoot branching in Arabidopsis. Mol. Plant 2010, 3, 794–806. [Google Scholar] [CrossRef] [PubMed]
- Takuno, S.; Ran, J.; Gaut, B.S. Evolutionary patterns of genic DNA methylation vary across land plants. Nat. Plants 2016. [Google Scholar] [CrossRef] [PubMed]
- Lang, Z.; Xie, S.; Zhu, J.-K. The 1001 arabidopsis DNA methylomes: An important resource for studying natural genetic, epigenetic, and phenotypic variation. Trends Plant Sci. 2016, 21, 906–908. [Google Scholar] [CrossRef] [PubMed]
- Zhang, J.; Liu, Y.; Xia, E.; Yao, Q.; Liu, X.; Gao, L. Autotetraploid rice methylome analysis reveals methylation variation of transposable elements and their effects on gene expression. Proc. Natl. Acad. Sci. USA 2015, 112, E7022–E7029. [Google Scholar] [CrossRef] [PubMed]
- Gardiner, L.-J.; Quinton-Tulloch, M.; Olohan, L.; Price, J.; Hall, N.; Hall, A. A genome-wide survey of DNA methylation in hexaploid wheat. Genome Biol. 2015, 16, 273. [Google Scholar] [CrossRef] [PubMed]
- Ye, B.; Wang, R.; Wang, J. Correlation analysis of the mRNA and miRNA expression profiles in the nascent synthetic allotetraploid Raphanobrassica. Sci. Rep. 2016, 6, 37416. [Google Scholar] [CrossRef] [PubMed]
- Li, X.; Shahid, M.Q.; Wu, J.; Wang, L.; Liu, X.; Lu, Y. Comparative small RNA analysis of pollen development in autotetraploid and diploid rice. Int. J. Mol. Sci. 2016, 17, 499. [Google Scholar] [CrossRef] [PubMed]
- Lewsey, M.G.; Hardcastle, T.J.; Melnyk, C.W.; Molnar, A.; Valli, A.; Urich, M.A.; Nery, J.R.; Baulcombe, D.C.; Ecker, J.R. Mobile small rnas regulate genome-wide DNA methylation. Proc. Natl. Acad. Sci. USA 2016, 113, E801–E810. [Google Scholar] [CrossRef] [PubMed]
- Kaneshiro, E.S.; Johnston, L.Q.; Nkinin, S.W.; Romero, B.I.; Giner, J.L. Sterols of saccharomyces cerevisiae erg6 knockout mutant expressing the pneumocystis carinii S-adenosylmethionine: Sterol c-24 methyltransferase. J. Eukaryot. Microbiol. 2015, 62, 298–306. [Google Scholar] [CrossRef] [PubMed]
- Shi, J.; Gonzales, R.A.; Bhattacharyya, M.K. Identification and characterization of an S-adenosyl-L-methionine:-sterol-c-methyltransferase cDNA from soybean. J. Biol. Chem. 1996, 271, 9384–9389. [Google Scholar] [CrossRef] [PubMed]
- Jin, H.; Do, J.; Shin, S.J.; Choi, J.W.; Choi, Y.I.; Kim, W.; Kwon, M. Exogenously applied 24-epi brassinolide reduces lignification and alters cell wall carbohydrate biosynthesis in the secondary xylem of liriodendron tulipifera. Phytochemistry 2014, 101, 40–51. [Google Scholar] [CrossRef] [PubMed]
Figure 1.
Base composition of clean reads from four Paulownia samples. (A): Base composition of clean reads from diploid P. fortunei; (B): Base composition of clean reads from tetraploid P. fortunei; (C): Base composition of clean reads from diploid P. tomentosa; (D): Base composition of clean reads from tetraploid P. tomentosa.

Figure 2.
Correlation coefficients of the gene expression of duplicate samples. X-axis represents the logarithmic value of diploid P. tomentosa (PT2) expression, while Y-axis represents the logarithmic value of the corresponding duplicate samples.
Figure 2.
Correlation coefficients of the gene expression of duplicate samples. X-axis represents the logarithmic value of diploid P. tomentosa (PT2) expression, while Y-axis represents the logarithmic value of the corresponding duplicate samples.

Figure 3.
Length distribution of four Paulownia small RNAs PF2: diploid P. fortunei; PF4: tetraploid P. fortunei; PT2: diploid P. tomentosa; PT4: tetraploid P. tomentosa.
Figure 3.
Length distribution of four Paulownia small RNAs PF2: diploid P. fortunei; PF4: tetraploid P. fortunei; PT2: diploid P. tomentosa; PT4: tetraploid P. tomentosa.

Figure 4.
qRT-PCR analysis of transcriptome and miRNA sequencing data. In this figure, (A) qRT-PCR analysis of selective miRNAs; (B) qPCR analysis of the selective DEGs. PF2: diploid P. fortunei. PF4: tetraploid P. fortunei. PT2: diploid P. tomentosa. PT4: tetraploid P. tomentosa. novel_mir_122 in (A) target PAU010926.1 in (B); novel_mir_32 in (A) target PAU029277.1 in (B); novel_mir_162 in (A) target PAU004212.1 in (B); novel_mir_168 in (A) target PAU030900.3 in (B); novel_mir_153 in (A) target PAU020320.2 in (B); pau-miR156 in (A) target PAU006035.1 in (B).

Table 1.
Assessment of the transcriptome sequencing data.
| Sample | Raw Reads | GC (%) | Q20 (%) | Q30 (%) | Adapter | N | Low Quality Reads | Clean Reads | Ratio of Clean Reads |
|---|---|---|---|---|---|---|---|---|---|
| PF2 | 60,025,508 | 46.43 | 91.06 | 84.91 | 0 | 68,226 | 4,541,576 | 55,415,706 | 92.32% |
| PF4 | 63,050,814 | 45.78 | 95.65 | 90.37 | 170,350 | 278,396 | 2,417,730 | 60,184,338 | 95.45% |
| PT2 | 37,819,270 | 46.17 | 94.87 | 90.83 | 0 | 18,780 | 1,496,634 | 36,303,856 | 95.99% |
| PT4 | 37,817,466 | 47.1 | 94.67 | 90.70 | 0 | 17,904 | 1,602,808 | 36,196,754 | 95.71% |
Table 2.
Quality statistics of Paulownia’s sRNAs.
| Sample | Total Reads | High Quality | 3′adapter Null | Insert Null | 5′adapter Contaminants | Smaller than 18 nt | polyA | Clean Reads |
|---|---|---|---|---|---|---|---|---|
| PF2 | 9,774,977 | 9,679,547 | 406,061 | 483,751 | 13,380 | 884,549 | 211 | 7,891,595 |
| 100% | 4.20% | 5.00% | 0.14% | 9.14% | 0.00% | 81.53% | ||
| PF4 | 14,422,555 | 14,176,998 | 2,149,291 | 49,377 | 14,150 | 554,768 | 435 | 11,018,977 |
| 100% | 15.16% | 3.10% | 0.10% | 3.91% | 0.00% | 77.72% | ||
| PT2 | 14,520,461 | 14,261,213 | 1,607,505 | 161,420 | 14,284 | 1,230,980 | 362 | 11,246,662 |
| 100% | 11.27% | 1.13% | 0.10% | 8.63% | 0.00% | 78.86% | ||
| PT4 | 13,109,201 | 13,008,182 | 1,407,359 | 495,415 | 23,817 | 1,196,260 | 265 | 9,885,066 |
| 100% | 10.82% | 3.81% | 0.18% | 9.20% | 0.00% | 75.99% |
© 2017 by the authors. Licensee MDPI, Basel, Switzerland. This article is an open access article distributed under the terms and conditions of the Creative Commons Attribution (CC BY) license (http://creativecommons.org/licenses/by/4.0/).
Share and Cite
MDPI and ACS Style
Cao, X.; Xu, E.; Zhai, X.; Dong, Y.; Fan, G. Combined Analysis of mRNAs and miRNAs to Identify Genes Related to Biological Characteristics of Autotetraploid Paulownia. Forests 2017, 8, 501. https://doi.org/10.3390/f8120501
AMA Style
Cao X, Xu E, Zhai X, Dong Y, Fan G. Combined Analysis of mRNAs and miRNAs to Identify Genes Related to Biological Characteristics of Autotetraploid Paulownia. Forests. 2017; 8(12):501. https://doi.org/10.3390/f8120501
Chicago/Turabian StyleCao, Xibing, Enkai Xu, Xiaoqiao Zhai, Yanpeng Dong, and Guoqiang Fan. 2017. "Combined Analysis of mRNAs and miRNAs to Identify Genes Related to Biological Characteristics of Autotetraploid Paulownia" Forests 8, no. 12: 501. https://doi.org/10.3390/f8120501
Note that from the first issue of 2016, this journal uses article numbers instead of page numbers. See further details here.