Article

Costs of Lost opportunities: Applying Non-Market Valuation Techniques to Potential REDD+ Participants in Cameroon

Department of Resource Economics and Environmental Sociology, University of Alberta, Edmonton, Alberta, T6G-2H1, Canada
*
Author to whom correspondence should be addressed.
Forests 2017, 8(3), 69; https://doi.org/10.3390/f8030069
Submission received: 30 October 2016 / Revised: 14 February 2017 / Accepted: 28 February 2017 / Published: 3 March 2017
(This article belongs to the Special Issue REDD+ Crossroads Post Paris: Politics, Lessons and Interplays)

Abstract

:
Reduced Emissions from Deforestation and Forest Degradation (REDD+) has been systematically advanced within the UN Framework Convention on Climate Change (UNFCCC). However, implementing REDD+ in a populated landscape requires information on local costs and acceptability of changed practices. To supply such information, many studies have adopted approaches that explore the opportunity cost of maintaining land as forest rather than converting it to agricultural uses. These approaches typically assume that the costs to the smallholder are borne exclusively through the loss or gain of the production values associated with specific categories of land use. However, evaluating the value of land to smallholders in incomplete and messy institutional and economic contexts entails other considerations, such as varying portfolios of land holdings, tenure arrangements, restricted access to capital, and unreliable food markets. We suggest that contingent valuation (CV) methods may provide a more complete reflection of the viability of REDD+ in multiple-use landscapes than do opportunity cost approaches. The CV approach eliminates the need to assume a homogenous smallholder, and instead assumes heterogeneity around social, economic and institutional contexts. We apply this approach in a southern rural Cameroonian context, through the lens of a hypothetical REDD+ contract. Our findings suggest local costs of REDD+ contracts to be higher and much more variable than opportunity cost estimates.

1. Introduction

Reduced Emissions from Deforestation and Forest Degradation (REDD+) has been systematically advanced within the UN Framework Convention on Climate Change (UNFCCC), and is now embraced by the Paris Climate Agreement [1]. The early conception of REDD+ was that it would be primarily implemented through actions of national governments, which would enact instruments and policies most appropriate to their particular national circumstances. This conception prompted concerns that REDD+ would reverse general trends toward devolution of forest governance to local users. Local user groups have been shown to be effective managers of local forests, while individual farmers have been shown to be involved in planting trees and clearing forests for agriculture. REDD+ was thus seen as a paradox; on one hand recognizing that improvements in forest governance require devolution, while on the other hand encouraging a centralization of the finance and accountability for REDD+ toward national governments [2]. Over time, however, it has been recognized that REDD+ will need to be adapted to the governance context of particular countries where it is implemented [3]. To the extent that forest governance involves a diversity of government levels and user groups, REDD+ will need to engage with that same diversity of interests [4], particularly the indigenous peoples and local communities who may be most affected [5,6]. This local engagement is particularly important in ‘fragile states’ where central governments exert minimal control over local land use [7,8]. Local users of land and forests need to be involved in order for REDD+ to be viable, and to fulfill the principle of Free, Prior and Informed Consent (FPIC) that is promoted as the international norm for developments that potentially impinge upon the land or resource rights of local and indigenous peoples [9].
However, many of the studies that have investigated how local economic conditions could affect the support of REDD+ have ignored various local concerns. Economic studies of REDD+ have focused on the opportunity costs of leaving land in high carbon uses, compared to clearing trees and converting the land into lower carbon land uses. Evidence on the farm-level returns and carbon fluxes associated with alternative land uses, including intact primary forests, secondary forests, tree crop systems, and annual food crops, showed that large areas of tropical forests were being converted into alternative uses that generate very low returns per tonne of carbon emitted [10,11]. Influential reports such as Stern (2008) and Eliasch and Office of Climate Change (2009) drew upon that evidence in their support of REDD+ [12,13]. McKinsey and Company (2009) also drew upon that evidence to generate their well-known Global Greenhouse Gas Abatement Cost Curve, which indicates reduced slash and burn agriculture conversion to be one of the lowest cost approaches to abating greenhouse gas emissions [14].
Previous economic studies of the opportunity costs of avoided deforestation have implicitly assumed that financial compensation for foregone income would be sufficient to garner local support for land use restrictions that maintain high carbon land uses. For example, Swallow et al. (2007) consider the costs in humid forest areas of Cameroon, Peru and Indonesia [15]. Within Akok village in Cameroon, the authors estimate that emissions released have resulted in returns of around 8 USD/t CO2e, using the social net present value approach [16]. For smallholders, conversions from mixed food crops fallow systems to shade-cocoa agroforestry practices were found to be a ‘win-win’ situation; both carbon sequestration and incomes to farmers would increase [12]. The methods used in the Swallow et al. (2007) study have been endorsed by the Carbon Finance Unit of the World Bank and are detailed in a training manual published by the World Bank Institute (2011) [13].
Such opportunity cost approaches may suffer from a number of shortcomings. First, returns are based on production values of specified categories of land. They do not consider the many nuanced combinations of land holdings that households possess that could influence their willingness to participate in REDD+ programs. Second, these approaches lack considerations of fluid, complex property rights. Gregerson et al (2010) note that property rights to forest lands and products are often insecure and contested, and thus not easily disaggregated or made subject to sale or lease [17]. Cerbu et al (2013) and Sunderlin et al (2014) both found tenure insecurity and the customary practice of ‘the right of the axe’ (securing land rights through land clearing) to be major constraints to implementation of REDD+ in the forest areas of Cameroon [18,19]. Besides tenure insecurity, Cameroon suffers from other characteristics of a fragile state, and is rated by the Fund for Peace as being in the “alert” category according to its fragile states index [20]. Third, investments may be impeded by a lack of capital. For example, despite the win-win situation identified In the Swallow et al. (2007) study [15], conversions to shade-cocoa agroforestry are rare, perhaps because there is a minimum amount of capital investment required to develop a cocoa agro-forest. Many smallholders are unable to come up with this investment, and are reliant on the mixed-food crops for subsistence [21]. Fourth, dynamic considerations of uncertain futures are frequently ignored. For example, Swallow et al. (2007) [15] is an ex post study where opportunity costs are based on conditions in the recent past, and sensitivity analysis used to assess the impacts of various social discount rates.
The purpose of this study is to explore contingent valuation (CV) methods as a means to account for local contexts in influencing opportunity costs of avoided deforestation. The general idea is that when a household is considering how much they are willing to accept for conserving trees, they consider the myriad of considerations, referred to above, so that their choices reflect local contexts. The application of our approach eliminates the notion of a homogenous smallholder, and instead assumes household-level heterogeneity around social, economic and institutional contexts of land holdings. We argue that this method is suitable for informing the design of contracts that reduce property rights to land when focused on situations that include complex and inconsistent institutional parameters, as well as imperfect, unreliable and missing economic contexts. Despite the potential advantages of this approach, we are only aware of one study in Cambodia that has used CV in a REDD+ setting [22].
We explore the value of lost opportunities through a study of farmers’ willingness to accept compensation for REDD+ in a multiple land use context in southern Cameroon. We present three types of results. First, we use contingent valuation to assess the willingness of individual land users to accept compensation for the lost opportunities that REDD+ would create. Second, we investigate factors affecting that willingness. Third, by aggregating willingness to accept compensation (WTA) amounts across the sample, we generate a potential abatement cost curve for avoided emissions.

2. Materials and Methods

2.1. Approaches to Measuring Costs of Avoided Deforestation

Studies that estimate opportunity costs from farm-level data have been described as “bottom up.” Those studies have considered three main factors: (1) the returns that forest users could obtain from clearing and converting forest land into different types of agricultural uses compared to the alternative of leaving the forest intact; (2) the time-averaged carbon stock associated with alternative uses; and (3) the efficiency of targeting payments to those who actually would convert any particular area from forest to agriculture in the absence of a compensation payment [16]. Bottom-up studies such as Swallow et al. (2007) [15] implicitly assume perfect targeting: if payments could be targeted only to those land users who converted land within a particular period, what amount of money would actually compensate them for the lost earnings associated with that conversion? Other bottom-up opportunity cost studies have made the efficiency of targeting more explicit [23] and considered other types of opportunity costs such as the costs of lost value-added income that may accrue at the regional level [24]. On the other hand, “top-down” studies of opportunity costs use aggregate models of forest product supply and demand and treat carbon storage as an additional demand for forest products. The top-down studies are not able to consider how that demand would be expressed at the local level [25].
An alternative approach is to directly elicit the values that land users place on foregoing the opportunity to convert their land into low carbon uses with stated preferences. Contingent valuation (CV) approaches allow for the integrated nature of household decision making in the context of both missing markets and integrated production–consumption decision-making [26]. Further, CV approaches can capture heterogeneity in production, consumption, and perceptions of the losses associated with irreversibility [26,27].
CV approaches frequently ask respondents the amounts that they would be willing to pay (WTP) to avoid a loss. An alternative approach is to elicit the amounts that they would be willing to accept (WTA) to incur a loss. Although basic economic theory suggests that the amounts should be very similar, empirical studies show that WTA tends to be considerably higher than WTP for the same loss. A substantial literature [26,27,28,29] has investigated possible reasons for these differences. In our application, we elicit WTA measures because of the nature of REDD+. Implementation of REDD+ with smallholders potentially involves offering payments to individual land users who commit to avoid deforestation. Therefore, we are interested in knowing how much these contracts would cost in terms of payments to local smallholders.
Despite their potential strengths, contingent valuation approaches for estimation of WTA are controversial for several reasons [26]. First, CV estimates can suffer from hypothetical bias because participants typically have no experience placing monetary values on the goods in question. This situation is certainly a possibility in the case of payments for avoided deforestation. Second, respondents may feel the need to say yes to adopting a hypothetical contract (i.e., yea-saying) because of the natural human inclination to please others, thus creating an enumerator bias. Residents of the study site were involved in several agronomic and land use studies over the previous 10–15 years and may perceive the possibility of future benefits or threats from participating in research. Third, respondents may tend to anchor their responses to the first value that the enumerator mentions, especially if they have little experience in valuing the proposed change. This problem could occur in our case because farmers do not seem to have experiences in receiving payments for a future commitment. Rather, their experiences are with payments for specific delivered actions or products. Fourth, the nature and amount of information presented as background to the hypothetical scenario may bias the respondents’ responses and undermine the validity of the study [30,31]. Fifth, there may be an embedding or scope effect depending upon whether respondents view the good on its own or as part of a larger inclusive package. Below we describe the steps taken to minimize the effects of these potential biases.

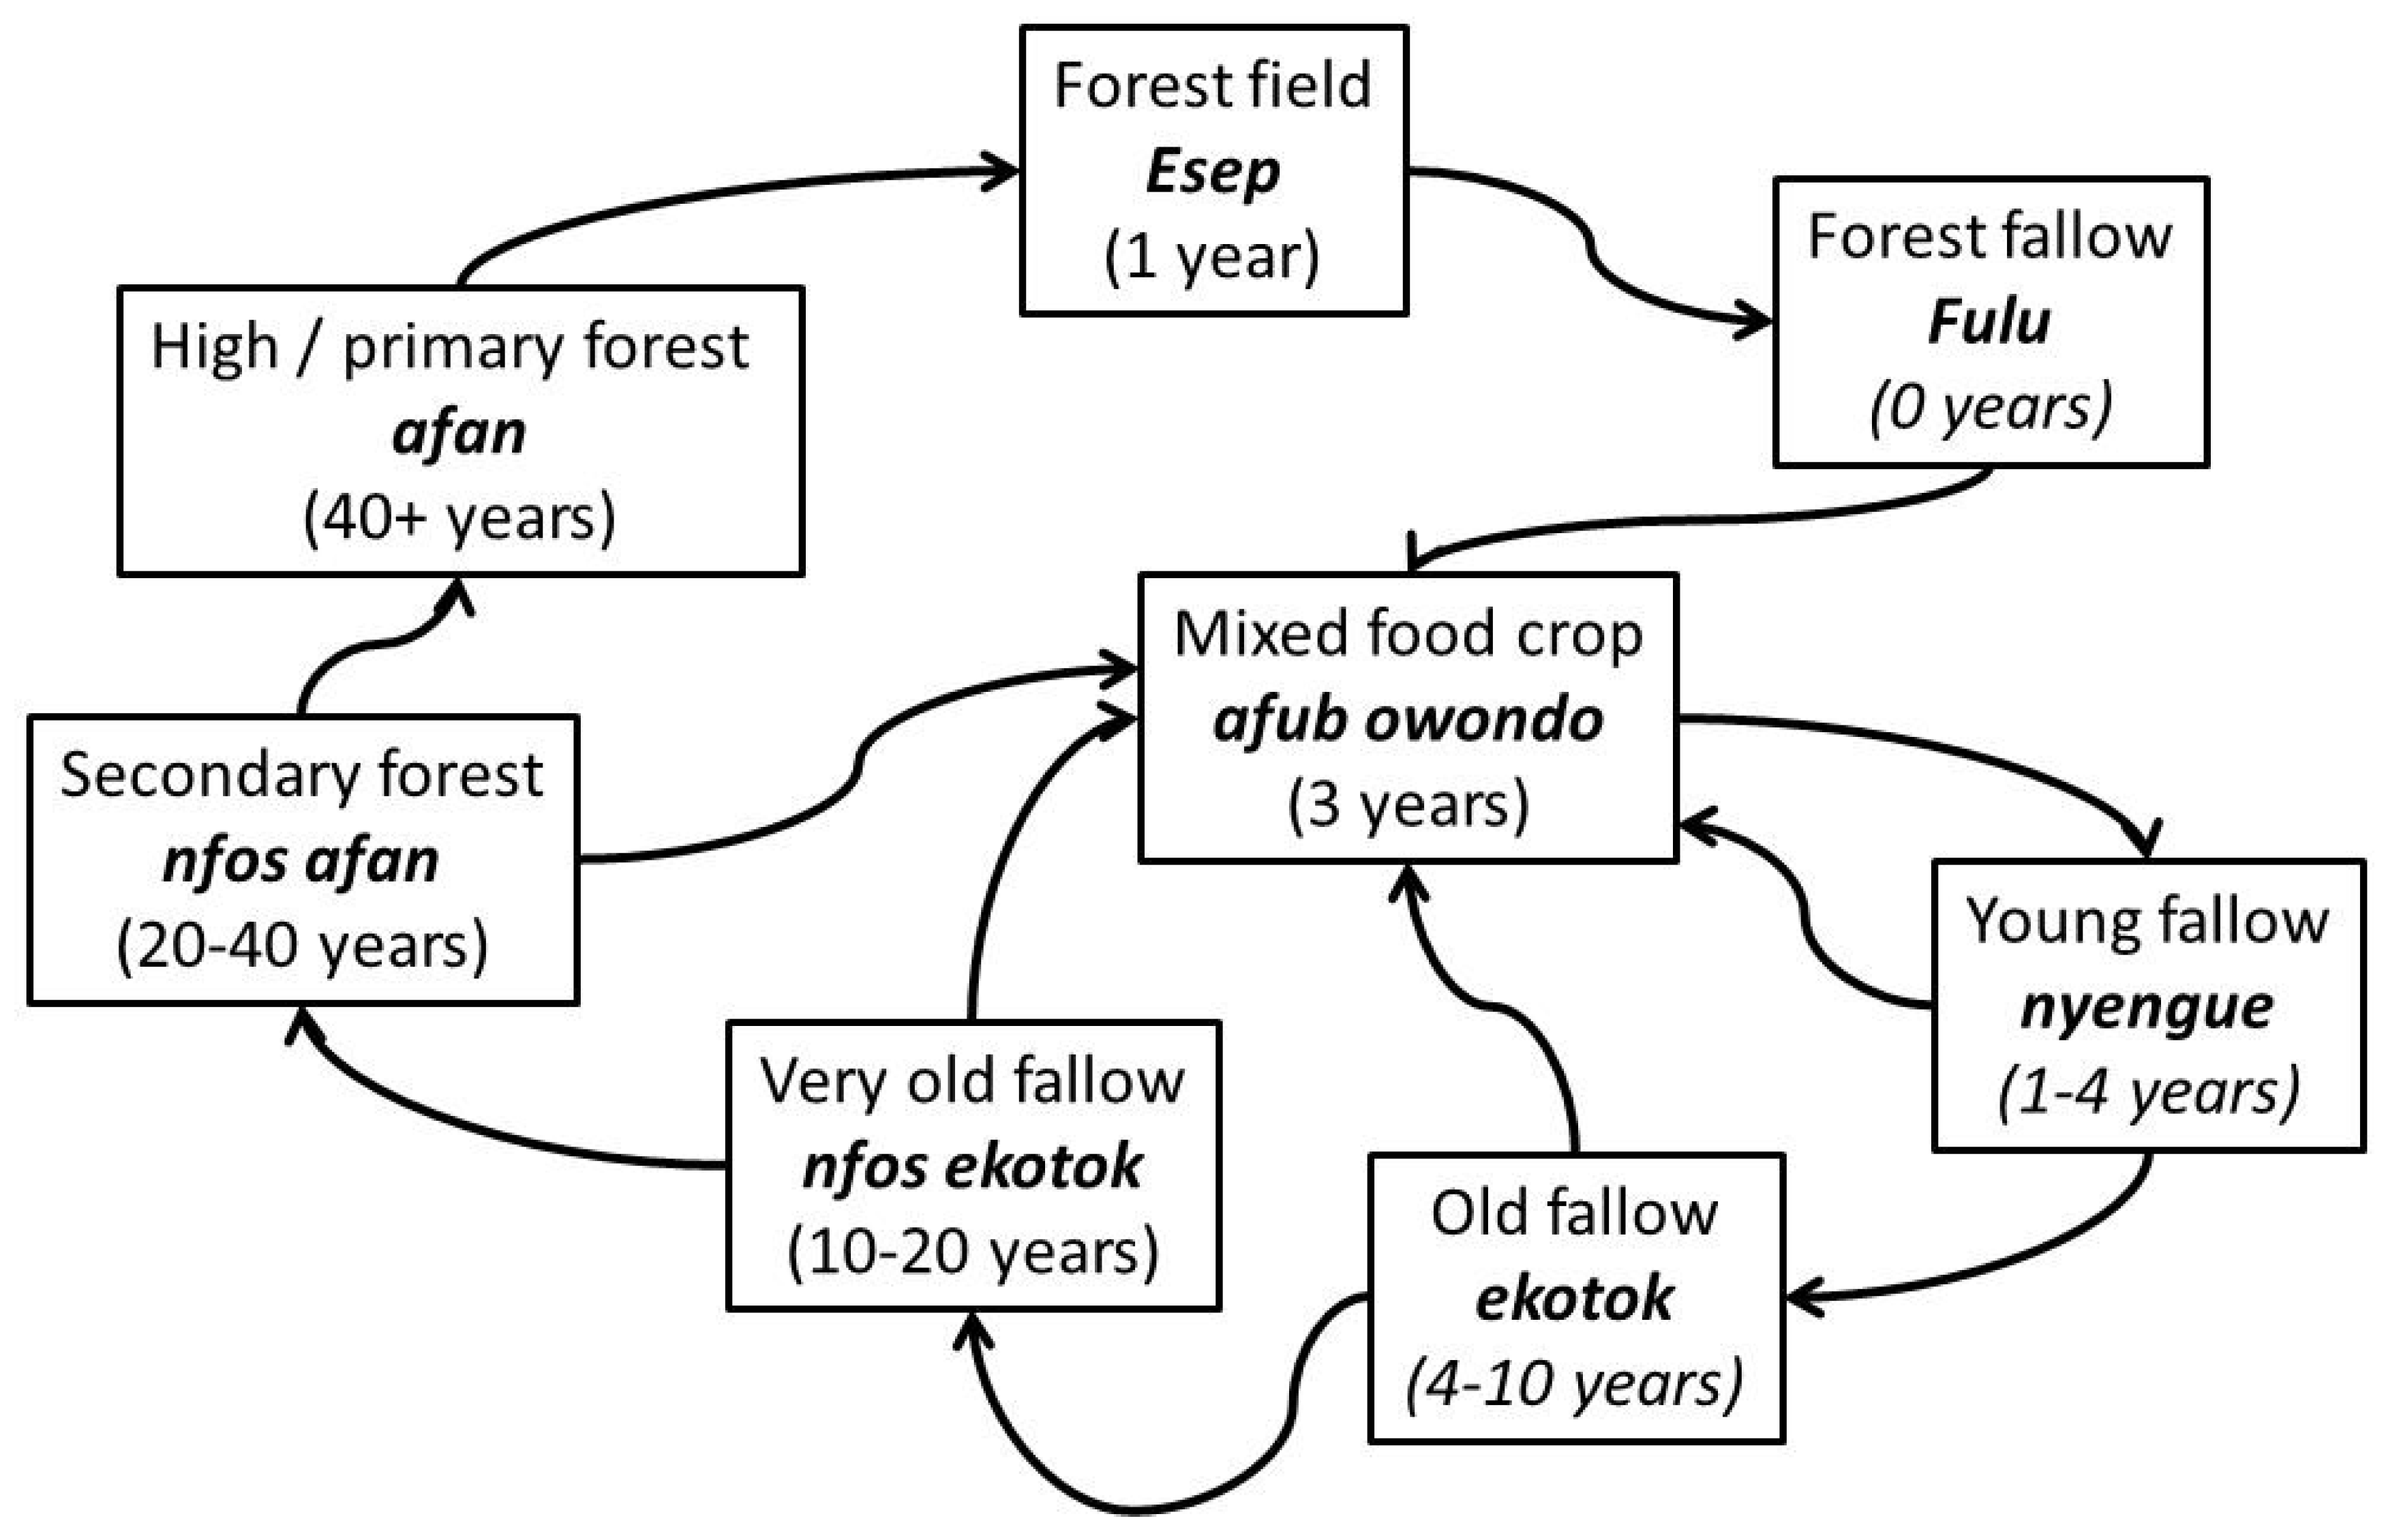
2.2. Study Site and Context

The field study was conducted in the village of Akok, a collaborative of eight sub-villages, located in the South Province of Cameroon. This area was selected as it had been previously studied through the Alternative to Slash and Burn (ASB) Partnership for the Tropical Forest Margins, with research conducted by scientists associated with the International Institute for Tropical Agriculture, the World Agroforestry Centre and other research partners [32]. The ASB studies provide descriptions of the main land uses [33], spatial analysis of changes in land use [34], institutional capacity for REDD+ [18], as well as estimates of the carbon stock [35] and private economic returns associated with those land uses [15]. Most residents are of the Bulu ethnic group, one of the Beti-Pahuin ethnicities occupying that part of the Congo basin.
The main agricultural production system in this area, like other parts of the Congo basin, is a shifting cultivation system [33]. Generally, shifting cultivation progresses from land being in a high-carbon state, primary forest, to a low-carbon state, such as groundnut or cassava production. Because the REDD+ contract is based on avoiding deforestation, these land-use transitions are important for WTA estimates. Figure 1 provides a summary of these transitions. A forest area that has not been used for agriculture in recent years is the starting point. Underbrush and larger trees are selectively cleared and burned to produce nutrient-rich ash. Farmers then plant crops that do well in that type of soil, particularly forest melon (esëp). Once esëp has matured for approximately one year, the produce is harvested and the field burned. The result is a forest fallow field (fulu), which is left to dry. The next step is to plant a mixture of food crops (afub owondo) which is the most important land type for subsistence. For about three years, crops such as cassava, cocoyam, plantain and peanut are cultivated on a semi-annual basis. Another group of food crops, known as asan, is planted after vegetation is cleared from lowland peat fields [33].
After the food crop phase, farmers allow the land to lay fallow in order for underbrush and soil nutrients to re-establish. There are four classifications of fallow within the Bulu tenure system: young (1–4 years, nyengue), old (4–10 years, ekotok), very old (10–20 years, nfos ekotok) and degraded secondary forest (20–40 years, nfos afan). Any fallow may be used to create an afub owondo field or other crop. However, the longer the land lays fallow, the more fertile the soil. Cocoa is typically introduced into the traditional shifting cultivation system after longer-term fallow, or even along with an esëp field, which can be considered a ‘cocoa with fruit’ field. As cocoa fields can be created from any stage of forest or very old fallow, these are not included in the illustration of the shifting cultivation transition shown in Figure 1.
Shifting cultivation in the Akok area primarily occurs in the context of customary clan-lineage tenure agreements. The traditional Bulu system employs a provisional, cyclic method of household land allocation [36]. An individual or household does not hold title to the land in the Bulu system. However, while an individual or household has cleared and is cultivating an area, that particular area is recognized as that household’s possession. There are three broad categories of possession within the Bulu system: (1) individual and/or household; (2) lineage; and (3) community or clan. A household holds individual/domestic possession during cultivation and through to the old fallow stage (ekotok), which is approximately 10 years after the last crop is harvested. Once this land transforms into a very old fallow or secondary forest (approximately nfos ekotok and nfos afan), the land reverts to the possession of the entire lineage and anyone within the lineage can utilize it. Finally, if the land is left uncultivated long enough to grow back into secondary forest, it is available to all members of the community or clan [36].
The Forestry Law of 1994 has complicated tenure arrangements in the area. There are three important differences between Bulu forest tenure and the 1994 Forest Law. First, the Forest Law makes a clear distinction between agricultural land and forest land through the evidence of human presence through cultivation. Second, the Bulu system simply equates labour applied to land to the creation of rights, while the 1994 Forest Law is much more complex in the granting of legal title. Third, the fundamental concept of ownership differs; Bulu tenure does not identify exclusive property title to land, while the 1994 Forest Law allows for common, private and state property rights. This challenging, messy and inconsistent institutional context can potentially influence each smallholders’ behaviour in different ways. Indeed, as we designed our survey, we had to investigate whether the local context allowed individuals to express WTA for constraints on land use. Results of key informant interviews, focus groups and pretests indicated that individuals were willing to make such land use decisions (with an exception regarding afan that we discuss below). However, as a result of complications to property rights, we expect that individuals may differ in their perceptions of the security of their tenure to fallow land, and thus the opportunities that they would be foregoing if they accepted the proposed contract. These differences in perceptions could be a source of heterogeneity among the respondents to this survey, and would also be a source of heterogeneity among actual contract holders [37].
Rural smallholders in this region of Cameroon, and many other areas globally, are dependent on land and forest resources for meeting both their income generation and subsistence needs. By entering into a contractual obligation to preserve forests, a smallholder would be making a conscious choice to reduce the amount of land that they could convert to other uses in the near future. Smallholders in Cameroon, as elsewhere, make daily decisions to ensure that there is enough food on the table, that their families are taken care of financially, and that there is hope for the future. Land available for cultivation can be crucial to all of these goals. In situations with missing markets or limited access to substitutes, there are few opportunities for smallholder farmers to find alternatives to traditional food production systems [38]. Moreover, in subsistence-based economies, it may be rare for farmers to have cash to pay for food and food markets may be thinly traded. Yet, in entering into a contract to avoid deforestation, essentially, the smallholder is choosing between the potential to use land versus future cash payments from the contract. The importance of land to livelihoods, and the rarity of cash and prices in such economies could cause smallholders to be hesitant to accept payments for the loss of use of land.

2.3. Data Collection

The field study in Akok was conducted in February and March of 2011 and began with a half-day focus group discussion. Participants provided information about local farming and the Bulu tenure system, which helped to clarify the plausibility of specific forest conservation contracts in that local context. Participants expressed concerns that a forest conservation contract would lead to the Government of Cameroon exercising full control over their shifting cultivation lands (as per the Forest Law of 1994). If they could no longer rely on clearing long-duration fallow to maintain soil fertility on their fields, farmers were concerned that they would not be able to meet the subsistence food needs of their families.
A questionnaire was pre-tested with 29 Akok households. From previous studies in the area, we anticipated finding approximately 200 households in the eight sub-villages and thus chose to implement a census sampling approach. Excluding the 29 households involved in the pre-test, the survey was administered to all of the 169 other households. Only two of the 169 households were unable to complete the survey.
The survey was designed to be conversational, as inconsistent literacy levels across the village required the survey to be administered as face-to-face interviews. Each survey took approximately one hour to complete, and households were compensated for their time with a bar of soap and a pen. Responses were kept anonymous, and respondents were reminded that they were free to stop the interview at any time. Informed consent was obtained through an information/consent form as stipulated by the University of Alberta Ethics Board.
The survey included basic information about the household including demographic information and land holdings. We also asked a number of questions about perceptions related to tenure security and the role of cash in their livelihoods. The WTA questions were framed with the context of a hypothetical forest conservation contract. The contract was described as a ten-year obligation to maintain any forest and fallow lands that were more than ten years old. In other words, the household would forego use of nfos ekotok and nfos afan for ten years, but ekotok (old fallow between 4 and 10 years) would be available for clearing. The household would be directly paid as compensation for forgone use. To illustrate the effects of this undertaking, the enumerators showed respondents a version of Figure 1 without the boxes for esëp and fulu. We noted that participants would receive assistance in the use of new agronomic techniques to sustain food production without the use of long-duration fallows
One challenge in implementing the study was the explanation of REDD+ and payments for ecosystem services to the community. For example, Whittington (1998) note how the concept of payments for ecosystem services is fundamentally difficult to communicate [39]. Our approach was to explain the context at a general level; that an organization would like to develop a program that encourages farmers to keep trees on the land, and that the household would be compensated to make sure that the trees were conserved.
To reduce hypothetical bias, the preamble to the WTA section of the survey contained a ‘cheap talk’ section that reminded respondents of the need to avoid hypothetical bias (Lusk, 2003) [40]. Also, the lead researchers did not accompany the local Bulu-speaking research assistants in order to minimize ‘yea saying’ and to maintain consistency between respondents’ questionnaires.
The WTA question asked was “Would you be willing to accept (some amount) CFA (Central African franc) per hectare per year for 10 years to participate in the contract?” As the values had to be read aloud, all respondents were asked to respond with a “yes” or “no” to each value, beginning with the payment amount set to zero. We used a single-bounded continuous bid sequence presented in a payment card format. A payment card with increasing bids (in CFA francs) was utilized rather than a single-bounded approach in order to reduce starting point bias (Chien et al., 2005), and the potential misunderstandings that could arise in a tight-knit community by administering different double-bounded bids among households [41]. By starting every individual at zero and increasing by the same increments, each smallholder was able to identify their unique bid, rather than being anchored to the first value presented to them.

2.4. Measures and Models

Parametric and non-parametric approaches were used to analyze the WTA data. An advantage of non-parametric methods is that they do not rely on a specific functional form [35]. Furthermore, non-parametric approaches may be simple to calculate [42], which was a substantial advantage during pre-testing for establishing an upper bound bid of 1,000,000 CFA/ha. WTA results were calculated using the non-parametric Turnbull upper bound method. The Turnbull method may be used to capture a monotonically increasing bid continuum [43]. Assuming a normal distribution for the cumulative distribution function (F*j), the expected WTA is:
E ( W T A ) =   j = 0 M * t j   f j + 1 *
where tj is the bid level ($ amount) posed to each respondent and f*j+1 is the probability distribution function for the next highest bid level [44].
For the parametric approach, we estimate a binary logit model that describes the effects of determinants on the probability of accepting a bid:
P   ( Y E S ) =   α +   β 1 B I D +   β 2 C A S H & F O O D +   β 3   P R I C E +   β 4   I N S E C U R E +   β 5   C A S H & L A N D +   β 6   V E R Y O L D F A L L O W +   β 7   Y O U N G & O L D F A L L O W +   β 8   A R E A C O C O A +   β 9 A R E A C U L T I V A T E D +   β 10 D E P E N D E N T S +   β 11   G E N D E R H O U S E H O L D H E A D +   β 12   A G E H O U S E H O L D H E A D +   β 13   M A R R I A G E +   ε
where βs are coefficients, ε is the error term, and the variables are defined in Table 1. We have expected signs for some variables. We expect that the higher the BID value, the more likely a respondent is to accept a bid. For CASH&FOOD, we expect that stronger agreement with being able to substitute market food with home-grown food will increase the probability of accepting the contract which provides cash for purchasing food. For PRICE, we expect that stronger agreement with clearing more land in response to higher prices will decrease the probability of accepting a contract. The other perception variables were also thought to be potentially important, but they could be important for varying reasons causing their expected signs to be ambiguous. For example, INSECURE could have a negative influence on accepting a contract if respondents believed that the land had to be cultivated to maintain rights, so the contract would create insecurity. However, this variable could have the opposite effect if respondents believed that the contract would alleviate the need for them to cultivate the land in order to maintain secure rights. The characteristics of land holdings and households are included as controls for which we have no expectation of signs.
To estimate the costs of avoided carbon dioxide emissions associated with the hypothetical forest conservation contracts, the above-ground time-averaged carbon stocks of land use systems within the ASB benchmark site were applied to the smallholders’ estimated hectares of each land type, and those carbon measures translated into carbon dioxide equivalents. As described in [11], the original ASB team working in Cameroon estimated time-average carbon stocks using the carbon density measurements of [35] and the conversion factor of 3.67 to convert tonnes of carbon into tonnes of carbon dioxide equivalent: tonnes C × 3.67 = tonnes CO2e. Total CO2e stock for the household was calculated for the situation at the time of the survey, and for an avoided future situation in which the areas of nfos ekotok and nfos afan would be replaced with afub owondo. The difference was assumed to the amount of avoided CO2e due to the contract. Each individual household’s lowest value of ‘yes’ for the WTA statement was applied to this estimate of avoided CO2e.
A potential supply curve of land offered into forest conservation contracts for the Akok households was generated from the individual WTA estimates, combined with the number of hectares of fallow managed by each household. Results for the 167 households were ordered from lowest (0 CFA/ha/annum) to highest WTA (>1,000,000 CFA/ha/annum) to create the potential supply curve.
To be comparable to other studies of the costs of REDD+, we translated the WTA estimates from CFA per hectare per year into US Dollar net present value per tonne of CO2e over the 10 years of the hypothetical contract. For each survey respondent who held some area of fallow land at the time of the survey, and accepted one of the bids offered (1,000,000 CFA/hectare or less), we estimated the tonnes of CO2e that they currently hold in fallow and the net present value in USD/tonne of CO2e conserved for the 10 years of the hypothetical contract. To calculate the present value of future annual payments, we followed Swallow et al (2007) [15] in applying discount rates of 0.1 percent (following Stern, 2008 [12]) and 15 percent (following earlier ASB studies).

3. Results

We begin our presentation of results with an overview of some descriptive statistics that provide a characterization of the households’ landholdings. We then discuss the WTA results in terms of dollar amounts and numbers of households that accepted and rejected contracts. Determinants of WTA are then investigated with the binomial logit model. Our results conclude with a discussion of the derived carbon abatement curve.
Respondents were asked to identify the origin of each cultivated field to compare to the shifting cultivation model presented by Brown [33]. These results are summarized in Table 2. Most smallholders convert high forest into transitionary forest fields (60%), however many also use secondary forest (21%) and very old fallow (13%) to create forest fields (Table 2). Mixed food crops were created from several different types of fallow, but most frequently from old fallow (63%). Another type of field (asan) was included, which are “off-season fields that are cultivated in lower lying areas where there is sufficient moisture to carry a crop through the long dry season” (Brown, 2006, p.76) [33]. Although the majority (66%) of these wetlands are cultivated from swamps (merecage), smallholders identified that they are also created from other types of forest and fallow. Cocoa was planted on every original land type, with 47% originating from lands that were fallow for at least 10 years prior to being converted to cocoa (high forest, secondary forest, very old fallow and old fallow).
The mean total land holdings for households in Akok village was 29.0 ha, of which 24.4 ha was fallow and available for future cultivation. The 24.4 ha of fallow was comprised of 11.1 ha of secondary forest, 5.5 ha of very old fallow, 4.4 ha of old fallow, and 3.5 ha of young fallow. For the average household, therefore, the forest conservation contract would mean that only the 3.5 ha of young fallow and 4.4 ha of old fallow would be available for clearing for shifting cultivation within the next ten years. The average household reported to be actively cultivating 4.9 ha of land, including 2.3 ha of cocoa agroforestry, 1.4 ha of forest field, 0.8 ha of mixed food crops, and 0.1 ha of wetland.
Survey results indicate that 94 percent of all respondents would accept the contract within the range of bids offered. However, 10 percent of these respondents accepted a bid of 0. These respondents were then asked whether they were willing to pay to participate in the contract, and all responded “yes.” In contrast, 6% of the sample was not willing to accept the contract for any of the amounts offered.
Figure 2 shows the proportion of respondents that indicated they would be willing to accept a bid amount for each bid level. Results indicate an acceptance rate of greater than 50 percent if compensation value was approximately greater than or equal to 200,000 CFA/ha/annum. The mean WTA was 226,047 CFA/ha/annum, while the median value was 222,416 CFA/ha/annum. At higher bid values, the curve becomes flatter indicating that a relatively small percentage of the respondents (i.e., approximately 10%) required bids of between 500,000 and 1,000,000 CFA/ha/annum to accept the contract.
Table 3 contains the results of the binary logit model on the probability of accepting the contract. Six of the variables are found to be statistically significant at the 5% level of better. BID is shown to be highly significant and displays the expected sign, where higher bids increase the probability of accepting the contract. A number of perception variables are also significant. CASHANDFOOD is negative and significant, indicating that people who are more in agreement with their ability to buy food at the market will be less inclined to accept the contract. This result is contrary to our initial expectations, but could be caused by income effects for which we are not able to control. People who state that they are able to feed their family with market purchased food are likely to have higher incomes, which could decrease their willingness to accept cash for a contract. PRICE is also negative and significant indicating, as expected, that stronger agreement with clearing more land in response to higher prices will decrease the probability of accepting a contract. INSECURE is also significant with a positive sign, perhaps indicating that people tend to believe that the contract will alleviate the need for them to cultivate the land in order to maintain rights.
With respect to types of land holdings, people who had larger areas of YOUNG&OLDFALLOW (fallow less than 10 years) were less likely to accept the contract. Our first hypothesis was that larger areas of young and old fallow would provide farmers with more options for renewing their crop cultivation land if they did enter the contract. This contrary result suggests a different rationale that is consistent with the results from the focus group and survey. As shown in Table 2, forest fields are rarely created from young or old fallow, but instead are created by slash and burn of primary or secondary forests. Respondents may have been worried that young and old fallow areas could be drawn into the contract, thus removing those areas as future options for slash and burn transition into forest fields.
Finally, AGEHOUSEHOLDHEAD was positive and significant, perhaps because older people were more inclined to prefer cash, rather than expending labor to grow their crops.
Figure 3 shows marginal costs of carbon abatement for various amounts of carbon derived from conserving areas of land. Due to missing data for some households, this supply curve is based on 135 the possible 169 households. We estimate that the amount of carbon held in fallows by those households equates to about one million tonnes of CO2e. Across the 135 households, the mean net present value of ten annual payments of the WTA is USD 29.94/t CO2e at a 15% discount rate and USD 55.67/t CO2e at a 0.01% discount rate. However, accounting for the sizes of the fallow areas on each of the 135 farms, the weighted mean net present value of the ten annual payments was USD 11.32/t CO2e at a 15% discount rate and USD 29.94 / t CO2e at a 0.01% discount rate, implying that households with larger areas had lower WTAs. However, the shape of the curve (Figure 3), assuming the 15% discount rate indicates that farmers would be willing to conserve 61% of the standing carbon stock for payments equating to a net present value of less than 10 USD/t CO2.e. Lower payments would still attract considerable interest from area farmers. For example, about 27% of the carbon could be conserved for less than payments equating to a net present value of less than 5 USD / t CO2e. At the other extreme end of the figure, the 18 highest observations of costs per tonne, which range from USD 55 to 675/t CO2e, in the right hand panel of Figure 3, add up to less than 2% of the carbon stock.

4. Discussion

With its high levels of forest carbon stocks, and potential threats of deforestation, Cameroon could make substantial contributions toward realizing the promise of REDD+. Like other African countries with relatively weak governance indicators, however, Cameroon has not attracted large investments in REDD+ [45]. To be more attractive destinations for REDD+ investments, countries such as Cameroon must conserve forested areas in a manner consistent with local institutions and acceptable to those with a stake in the way land is used. Previous studies [18,46] have focused on the institutional arrangements for land and forest governance in Cameroon.
Here, our primary focus is on the farm-level economics of REDD+. In identifying the potential for conserving lands as part of REDD+ programs, costs of lost opportunities are frequently measured by forgone production values for given types of land. However, our results using a WTA approach suggest that there are a number of features of local contexts that could cause opportunity cost approaches to be misleading.
Our estimates, derived from WTA’s, tend to be somewhat higher than previous estimates based on opportunity cost approaches. For example, using a bottom up approach and comparing opportunity costs across locations in Indonesia, Peru and Cameroon, Swallow et al. (2007) [15] found a range of costs of 2 to 10 USD/t CO2e for 20 years of avoided deforestation using an interest rate of 15%. Their estimate for Akok village is around 8 USD/t CO2e. Similarly, Boucher (2008) [47] found a range of costs of 1.84–5.18 USD/t CO2e for 20 years of sequestration and reported results from top-down studies ranging from 7.77 to 18.86 USD/t CO2e for 20 years of sequestration. In contrast, our estimated range of values for a 10-year contract is between 15.79 and 5533.15 USD/t CO2e at a discount rate of 0.1%, and between 7.97 and 2792.25 USD/t CO2e at a discount rate of 15%. Our lower bound estimate of WTA is roughly equal to the estimated opportunity cost for households in Cameroon calculated by Swallow et al. (2017) [15]. We have not adjusted for inflation because the CFA to USD exchange rate changed by less than 10% over this period.
The possibility of low costs per tonne CO2e was one of the factors that originally drew attention to the use of REDD+ as a mitigation option. The results presented in this paper suggest that previous estimates of opportunity costs may have seriously under-estimated the amounts that land users would need to be paid in exchange for farmers giving up discretion over future land use. The relatively high value of opportunity cost derived through the CV stated preference method is also consistent with the general hypothesis posited in this study, that smallholders consider more than the forgone production when considering REDD contract acceptance.
The drivers behind probabilities of accepting a contract provide some insights into local contexts that could be driving up WTA’s. Though higher BID amounts do increase the probability of acceptance, these amounts are having to overcome a number of other drivers that reduce acceptance, likely because households wanted to maintain options to work their land. Local challenging, incomplete and messy institutional and economic contexts are apparent in influencing decisions. Specifically, people who believe more strongly that they have sufficient cash to consider markets as means of contributing to food security (i.e., CASH&FOOD) were less likely to accept a contract. Likewise, people who agreed more that they would want to clear more land if prices improved (i.e., PRICE) were also less likely to lock up their lands in a contract. Moreover, people who agreed less with the need work their land in order to maintain their rights were also less likely to accept a contract. There were also some characteristics of households, and their land holdings, which were found to be impediments. Younger household heads (AGEHOUSEHOLDHEAD) and households with more areas of young and old fallow (YOUNG&OLDFALLOW) were also less likely to accept a contract.
One striking finding is the degree of heterogeneity among values of land to households. The CV approach leads to a diverse range of acceptance for forest carbon conservation. The sample is split roughly into three groups: individuals willing to participate for no compensation, the majority of the sample willing to participate given some compensation, and individuals not willing to participate in the program, or only willing at extremely high levels of compensation relative to the rest of the sample. In the first group, 10% of the sample required no payment, perhaps because they saw the contract as a means of securing tenure to their land. However, there was also 5% of the sample that would not accept any offered amount to accept the contract. Nonetheless, the carbon abatement costs Figure 3) suggests a clear population subset that is willing to enter the proposed deforestation mitigation contract for a relatively low payment. Policy makers would be able to prevent nearly half of the available carbon stock (i.e., approximately 5,000,000 t CO2e ) from being emitted for a 10-year period for approximately 8 USD/t CO2e CO2, considering an interest rate of 15%.
No matter what amount would need to be paid to smallholders to avoid deforestation, an underlying principal, as discussed above, is that of Free, Prior and Informed Consent (FPIC) [9]. Consistent with this principal are contingent valuation approaches that solicit consensual (i.e., willing) values. The heterogeneity among households that arises in identifying consent presents both problems and promise for structuring REDD+ contracts. Promise arises from identifying large numbers of households who would willingly pay cost-effective amounts (relative to other options) to sequester carbon. Problems arise in developing payment schemes that could reflect the heterogeneity in WTA, but that would be deemed equitable among participants.

Acknowledgments

The authors acknowledge generous financial assistance from the University of Alberta and the World Agroforestry Centre. Caitlin Schmidt from the University of Alberta, Doug Brown from World Vision, Zac Tchoundjeu and Serge Ngendakumana from the World Agroforestry Centre, and Valentina Robiglio and Guillaume Lescuyer from the International Institute for Tropical Agriculture (IITA) provided valuable input and guidance for the field studies in Cameroon. Arlette, Chistiane, Yannick and Dominique all supported implementation of the survey in Akok. Two anonymous reviewers provided very helpful comments and suggestions. Of course, the people of Akok are thanked for their participation in the focus group and household survey.

Author Contributions

B.S. conceived this study and secured support from the funders and host organizations. DT., B.S. and M.L. designed the survey with inputs from C.S. D.T. implemented the field studies with those listed in the acknowledgements. D.T. did most of the data analysis with support from B.S. and M.L. D.T. wrote the first draft of the manuscript. B.S. and M.L. revised and refined the manuscript. B.S. is the corresponding author.

Conflicts of Interest

The founding sponsors had no role in the design of the study; in the collection, analyses, or interpretation of data; in the writing of the manuscript, and in the decision to publish the results.

References

  1. Harris, N.; Stolle, F. Forests Are in the Paris Agreement! Now What? World Resources Institute Blog. 5 January, 2016. Available online: http://www.wri.org/blog/2016/01/forests-are-paris-agreement-now-what (accessed on 18 May 2016).
  2. Sandbrook, C.; Nelson, F.; Adams, W.M.; Agrawal, A. Carbon, forests and the REDD paradox. Oryx 2010, 44, 330–334. [Google Scholar] [CrossRef]
  3. Corbera, E.; Schroeder, H. Governing and implementing REDD+. Environ. Sci. Policy 2011, 14, 89–99. [Google Scholar] [CrossRef]
  4. Desbureaux, S.; Brimont, L. Between economic loss and social identity: The multi-dimensional cost of avoiding deforestation in eastern Madagascar. Ecol. Econ. 2015, 118, 10–20. [Google Scholar] [CrossRef]
  5. Griffiths, T. Seeing ‘REDD’? Forests, Climate Change Mitigation and the Rights of Indigenous Peoples and Local Communities; Forest Peoples Programme: Moreton-in-Marsh, UK, 2008. [Google Scholar]
  6. Peskett, L.; Huberman, D.; Bowen-Jones, E.; Edwards, G.; Brown, J. Making REDD Work for the Poor. Prepared on Behalf of the Poverty Environment Partnership; Overseas Development Institute: London, UK, 2008. [Google Scholar]
  7. Karsenty, A.; Ongolo, S. Can ‘fragile states’ decide to reduce their deforestation? The inappropriate use of the theory of incentives with respect to the REDD mechanism. For. Policy Econ. 2012, 18, 38–45. [Google Scholar] [CrossRef]
  8. Ongolo, S. On the banality of forest governance fragmentation: Exploring “gecko politics” as a bureaucratic behaviour in limited statehood. For. Policy Econ. 2015, 53, 12–20. [Google Scholar] [CrossRef]
  9. Mahanty, S.; McDermott, C.L. How does ‘Free, Prior and Informed Consent’ (FPIC) impact social equity? Lessons from mining and forestry and their implications for REDD+. Land Use Policy 2013, 35, 406–416. [Google Scholar] [CrossRef]
  10. Palm, C.A.; Vosti, S.A.; Sanchez, P.A.; Ericksen, P.J. Slash-and-Burn Agriculture: The Search for Alternatives; Columbia University Press: New York, NY, USA, 2005. [Google Scholar]
  11. Grieg-Gran, M. The Cost of Avoiding Deforestation: Update of the Report Prepared for the Stern Review of the Economics of Climate Change; ACM Digital Library: New York, NY, USA, 2008. [Google Scholar]
  12. Stern, N. The Economics of Climate Change: The Stern Review; Cambridge University Press: New York, NY, USA, 2006. [Google Scholar]
  13. Eliasch & Office of Climate Change. The Eliasch Review: Climate Change: Financing Global Forests; H.M. Government: London, UK, 2008. Available online: https://www.gov.uk/government/uploads/system/uploads/attachment_data/file/228833/9780108507632.pdf (accessed on 1 March 2017).
  14. McKinsey & Company. Pathways to a Low-Carbon Economy: Version 2 of Global Greenhouse Gas Abatement Cost Curve. 2009, p. 7. Available online: http://www.mckinsey.com/business-functions/sustainability-and-resource-productivity/our-insights/pathways-to-a-low-carbon-economy (accessed on 3 February 2016).
  15. Swallow, B.; van Noordwijk, M.; Dewi, S.; Murdiyarso, D.; White, D.; Gockowski, J.; Hyman, G.; Budidarsono, S.; Robiglio, V.; Meadu, V.; et al. Opportunities for Avoided Deforestation with Sustainable Benefits: An Interim Report of the ASB Partnership for the Tropical Forest Margins; ASB Partnership for the Tropical Forest Margins: Nairobi, Kenya, 2007. [Google Scholar]
  16. World Bank Institute. Estimating the Opportunity Costs of REDD+: A Training Manual; World Bank Institute, Version 1.3; World Bank: Washington, DC, USA, 2011. [Google Scholar]
  17. Gregersen, H.; El Lakany, H.; Karsenty, A.; White, A. Does the Opportunity Cost Approach Indicate the Real Cost of REDD+? Rights and Resources Initiative: Washington, DC, USA, 2010. [Google Scholar]
  18. Cerbu, G.A.; Sonwa, D.J.; Pokorny, B. Opportunities for and capacity barriers to the implementation of REDD+ projects with smallholder farmers: Case study of Awae and Akok, Centre and South Regions, Cameroon. For. Policy Econ. 2013, 36, 60–70. [Google Scholar] [CrossRef]
  19. Sunderlin, W.D.; Larson, A.M.; Duchelle, A.E.; Resosudarmo, I.A.P.; Huynh, T.B.; Awono, A.; Dokken, T. How are REDD+ proponents addressing tenure problems? Evidence from Brazil, Cameroon, Tanzania, Indonesia, and Vietnam. World Dev. 2014, 55, 37–52. [Google Scholar] [CrossRef]
  20. Fund for Peace. Fragile States Index 2016. Available online: http://fsi.fundforpeace.org/ (accessed on 1 March 2017).
  21. Jagoret, P.; Michel-Dounias, I.; Malézieux, E. Long-term dynamics of cocoa agroforests: A case study in central Cameroon. Agrofor. Syst. 2011, 81, 267–278. [Google Scholar] [CrossRef]
  22. Caravani, A.; Graham, K. Market and Non-Market Costs of REDD+ Perceived by Local Communities: A Case Study in East Cambodia Cambodia. REDDnet Case Study. 2011. Available online: http://theredddesk.org/sites/default/files/resources/pdf/2011/case_study_5_-_cambodia_alice_final.pdf (accessed on 4 January 2017).
  23. Wünscher, T.; Engel, S.; Wunder, S. Spatial targeting of payments for environmental services: A tool for boosting conservation benefits. Ecol. Econ. 2008, 65, 822–833. [Google Scholar] [CrossRef]
  24. Ghazoul, J.; Butler, R.; Mateo-Vega, J.; Pin Koh, L. REDD: A reckoning of environment and development implications. Trends Ecol. Evolut. 2010, 25, 396–402. [Google Scholar] [CrossRef] [PubMed]
  25. Kindermann, G.; Obersteiner, M.; Sohngen, B.; Sathaye, J.; Andrasko, K.; Rametsteiner, E.; Beach, R. Global cost estimates of reducing carbon emissions through avoided deforestation. Proc. Natl. Acad. Sci. 2008, 105, 10302–10307. [Google Scholar] [CrossRef] [PubMed]
  26. Whittington, D.; Pagiola, S. Using contingent valuation in the design of payments for environmental services mechanisms: A review and assessment. World Bank Res. Obs. 2012, 27, 261–287. [Google Scholar] [CrossRef] [Green Version]
  27. Jack, B.K.; Beria, L.; Ferraro, P.J. A revealed preference approach to estimating supply curves for ecosystem services: Use of auctions to set payments for soil erosion control in Indonesia. Conserv. Biol. 2009, 23, 359–367. [Google Scholar] [CrossRef] [PubMed]
  28. Kling, C.L.; List, J.A.; Zhao, J. A dynamic explanation of the willingness to pay and willingness to accept disparity. Econ. Inq. 2013, 51, 909–921. [Google Scholar] [CrossRef]
  29. Kahneman, D.; Tversky, A. Prospect theory: An analysis of decision under risk. Econometrica 1979, 47, 263–291. [Google Scholar] [CrossRef]
  30. Kahneman, D.; Knetch, J.L.; Thaler, R.H. Experimental tests of the endowment effect and the Coase theorem. J. Political Econ. 1990, 98, 1325–1348. [Google Scholar] [CrossRef]
  31. Venkatachalam, L. The contingent valuation method: A review. Environ. Impact Assess. Rev. 2004, 24, 89–124. [Google Scholar] [CrossRef]
  32. Palm, C.A.; Tomich, T.; van Noordwijk, M.; Vosti, S.; Gockowski, J.; Alegre, J.; Verchot, L. Mitigating GHG emissions in the humid tropics: Case studies from the Alternatives to Slash-and-Burn Program (ASB). Environ. Dev. Sustain. 2004, 6, 145–162. [Google Scholar] [CrossRef]
  33. Brown, D.R. Personal preferences and intensification of land use: Their impact on southern Cameroonian slash-and-burn agroforestry systems. Agrofor. Syst. 2006, 68, 53–67. [Google Scholar] [CrossRef]
  34. Robiglio, V.; Mala, W.A.; Diaw, M.C. Mapping landscapes: Integrating GIS and social science methods to model human-nature relationships in southern Cameroon. Small-Scale For. Econ. Manag. Policy 2003, 2, 171–184. [Google Scholar]
  35. Sonwa, D.J. Biomass Management and Diversification within Cocoa Agroforests in the Humid Forest Zone of Southern Cameroon; Cuvillier Verlag: Gottingen, Germany, 2004. [Google Scholar]
  36. Gerber, J.F.; Veuthey, S. Possession Versus Property in a Tree Plantation Socioenvironmental Conflict in Southern Cameroon. Soc. Nat. Resour. 2011, 24, 831–848. [Google Scholar] [CrossRef]
  37. Van den Berg, J. Sustainable Exploitation and Management of Forest Resources: Diverging Perceptions on the Forest. In Forest Management Related Studies of the Tropenbos-Cameroon Programme; Papers Presented at a Joint WAU-Tropenbos Workshop. Available online: www.tropenbos.org/file.php/316/workshop-berg.pdf (accessed on 4 January 2017).
  38. Ndoye, O.; Kaimowitz, D. Macro-economics, markets and the humid forests of Cameroon, 1967–1997. J. Mod. Afr. Stud. 2000, 38, 225–253. [Google Scholar] [CrossRef]
  39. Whittington, D. Administering contingent valuation surveys in developing countries. World Dev. 1998, 26, 21–30. [Google Scholar] [CrossRef]
  40. Lust, J.L. Effects of cheap talk on consumer willingness-to-pay for golden rice. Am. J. Agric. Econ. 2003, 85, 840–856. [Google Scholar]
  41. Chien, Y.L.; Huang, C.J.; Shaw, D. A general model of starting point bias in double-bounded dichotomous contingent valuation surveys. J. Environ. Econ. Manag. 2005, 50, 362–377. [Google Scholar] [CrossRef]
  42. Tambour, M.; Zethraeus, N. Nonparametric willingness-to-pay measures and confidence statements. Med. Decis. Mak. 1998, 18, 330–336. [Google Scholar] [CrossRef] [PubMed]
  43. Kriström, B. A non-parametric approach to the estimation of welfare measures in discrete response valuation studies. Land Econ. 1990, 66, 135–139. [Google Scholar] [CrossRef]
  44. Haab, T.C.; McConnell, K.E. Valuing Environmental and Natural Resources: The Econometrics of Non-Market Valuation; Edward Elgar: Cheltenham, UK, 2002. [Google Scholar]
  45. Cerbu, G.A.; Swallow, B.M.; Thompson, D.Y. Locating REDD: A global survey and analysis of REDD readiness and demonstration activities. Environ. Sci. Policy 2011, 14, 168–180. [Google Scholar] [CrossRef]
  46. Boucher, D.H. Estimating the Cost and Potential of Reducing Emissions from Deforestation. Tropical Forests and Climate, Briefing #1; Union of Concerned Scientists: Washington, DC, USA, 2008. [Google Scholar]
  47. Awono, A.; Somorin, O.A.; Eba’a Atyi, R.; Levang, P. Tenure and Participation in Local REDD+ Projects: Insights from Southern Cameroon. Environ. Sci. Policy 2014, 35, 76–86. [Google Scholar] [CrossRef]
Figure 1. The typical Bulu shifting cultivation system in Southern Cameroon (adapted from Brown, 2006 [33]).
Forests 08 00069 g001
Figure 2. Turnbull upper bound non-parametric WTA (willingness to accept) results for smallholders accepting a deforestation restriction contract in Akok, Cameroon.
Forests 08 00069 g002
Figure 3. Marginal carbon abatement cost curve of land offered into REDD contracts based on smallholder land holdings and the proposed REDD-like contract in Akok village, Cameroon (n = 135). The right hand segment of the graph represents the highest 18 observations.
Forests 08 00069 g003
Table 1. Variables in the binary logit model describing participation in the contract.
VariablesDescription of Variables
Dependent Variable
P(YES)The probability of a smallholder agreeing to enter into a contract at a given bid level
Independent Variables
BIDPayment level that would be paid to the smallholder on an annual basis per hectare (i.e., CFA/ha/year)
Perceptions (higher rating corresponds with agree more)
CASH&FOODSubsistence vs. market food
If I cannot produce enough food to feed everyone in my family, I can buy it at the market
PRICEMarket sensitivity
If the price of one of the crops that I cultivate goes up, I will clear more of my fallow that is 10 years or older
INSECURERisk perceptions of tenure security
If I do not want someone else to be able to cultivate my fallows that are 10 years old and older, I will have to cultivate them”
CASH&LANDCash and land investments
If I receive additional revenue, I will invest in agroforestry
Characteristics of Land Holdings
VERYOLDFALLOWTotal area of currently fallowed land that is older than 10 years (ha)—nfos ekoyok
YOUNG&OLDFALLOWTotal area of currently fallowed land that is 1–10 years (ha)—nyengue and ekotok
AREACOCOATotal area of current cocoa agro-forests (ha)
AREACULTIVATEDTotal area of dedicated food crops that the household is currently cultivating – afub owondo and esëp (ha)
Household Characteristics
DEPENDENTSNumber of dependents in the household (0–14 years old)
GENDERHOUSEHOLDHEADGender of head of household (1 = male, 0 = female)
AGEHOUSEHOLDHEADAge of head of household (years)
MARRIAGEMarital status of head of household (1 = married, 0 = single or widowed)
Table 2. Shifting cultivation transitions between land types.
Current land types
Forest Field (esep)Mixed Food Crops (afub owondo)Wetland (asan)Cocoa
% of small holders transitioning between land types
Original land typeHigh Primary Forest (afan)601718
Secondary Forest (nfos afan)211511
Very Old Fallow (nfos ekotok)131473
Old Fallow (ekotok)663915
Young Fallow (nyegue)1973
Forest Fallow (fulu)0700
Forest Field (esep)-6017
Swamp (merecage)006633
Number of households with this field type13414240133
Table 3. Results of a binary logit model of smallholders’ willingness to accept a bid for a hypothetical deforestation restriction contract.
Explanatory VariablesEstimated CoefficientStandard Error
BID0.0000050797 ***0.0000005464
CASH&FOOD−0.00325 ***0.00073
PRICE−0.00152 ***0.00034
INSECURE0.00106 ***0.00024
CASH&LAND0.093430.13574
VERYOLDFALLOW−0.000250.00046
YOUNG&OLDFALLOW−0.00100**0.00052
AREACOCOA−0.000340.00064
AREACULTIVATED0.000280.00074
DEPENDENTS−0.013680.04407
GENDERHOUSEHOLDHEAD−0.366180.34160
AGEHOUSEHOLDHEAD0.00148 ***0.00038
MARRIAGE−0.000200.00031
Constant−1.1186 ***0.43354
Log likelihood−1479.06
χ2 (9 d.f.)1129.07
McFadden Pseudo R20.2762
Observations (21 × 167)
Median WTA 222416 CFA/ha/annum
(467.27 USD/ha/annum)
***, **, * Significant, respectively, at the 1%, 5% and 10% levels.

