Article

Non-Destructive, Laser-Based Individual Tree Aboveground Biomass Estimation in a Tropical Rainforest

by
Muhammad Zulkarnain Abd Rahman
1,*,
Md Afif Abu Bakar
1,
Khamarrul Azahari Razak
2,
Abd Wahid Rasib
1,
Kasturi Devi Kanniah
1,
Wan Hazli Wan Kadir
1,
Hamdan Omar
3,
Azahari Faidi
3,
Abd Rahman Kassim
3 and
Zulkiflee Abd Latif
4
1
TropicalMap Research Group, Faculty of Geoinformation and Real Estate, Universiti Teknologi Malaysia (UTM), UTM Johor Bahru 81310, Malaysia
2
UTM Razak School of Engineering and Advanced Technology, Universiti Teknologi Malaysia, Jalan Semarak, Kuala Lumpur 54100, Malaysia
3
Forest Research Institute Malaysia (FRIM), Kepong, Selangor 52109, Malaysia
4
Centre of Studies Surveying Science and Geomatics Faculty of Architecture, Planning and Surveying, Universiti Teknologi MARA, Shah Alam, Selangor 40450, Malaysia
*
Author to whom correspondence should be addressed.
Forests 2017, 8(3), 86; https://doi.org/10.3390/f8030086
Submission received: 7 November 2016 / Revised: 8 March 2017 / Accepted: 13 March 2017 / Published: 17 March 2017
(This article belongs to the Special Issue LiDAR Remote Sensing of Forest Resources)

Abstract

:
Recent methods for detailed and accurate biomass and carbon stock estimation of forests have been driven by advances in remote sensing technology. The conventional approach to biomass estimation heavily relies on the tree species and site-specific allometric equations, which are based on destructive methods. This paper introduces a non-destructive, laser-based approach (terrestrial laser scanner) for individual tree aboveground biomass estimation in the Royal Belum forest reserve, Perak, Malaysia. The study area is in the state park, and it is believed to be one of the oldest rainforests in the world. The point clouds generated for 35 forest plots, using the terrestrial laser scanner, were geo-rectified and cleaned to produce separate point clouds for individual trees. The volumes of tree trunks were estimated based on a cylinder model fitted to the point clouds. The biomasses of tree trunks were calculated by multiplying the volume and the species wood density. The biomasses of branches and leaves were also estimated based on the estimated volume and density values. Branch and leaf volumes were estimated based on the fitted point clouds using an alpha-shape approach. The estimated individual biomass and the total above ground biomass were compared with the aboveground biomass (AGB) value estimated using existing allometric equations and individual tree census data collected in the field. The results show that the combination of a simple single-tree stem reconstruction and wood density can be used to estimate stem biomass comparable to the results usually obtained through existing allometric equations. However, there are several issues associated with the data and method used for branch and leaf biomass estimations, which need further improvement.

1. Introduction

Estimation of carbon stock in forests is usually obtained from the measurement of above-ground biomass [1]. The destructive method is still considered as the most accurate method for biomass estimation via cutting down trees and weighting their parts [2]. Larger-scale biomass estimation is carried out by relating detailed measurements obtained from the destructive approach with the more easily derived biophysical properties of trees such as diameter at breast height (DBH), tree height, and crown size via biometric measurements. The relationship is explained by a specific function called an allometric equation. The Malaysian rainforest is well known for its tree species diversity and until now, there is still a limited number of allometric equations available. Therefore, efforts are still required in developing species-specific allometric equations that at least account for dominant tree species in Malaysia. Until now, the most cited allometric equations for biomass estimation in South East Asia were only obtained from certain studies that cover certain tree species in specific areas [1,3]. Remote sensing offers effective solutions for biomass estimation at various scales. Terrestrial sensors have been used for a large-scale biomass estimation, and the upscaling process of such measurements over larger area is usually done using airborne and spaceborne remote sensing data. Previous studies have shown that remote sensing data can be used to estimate aboveground biomass by relating individual tree properties (e.g., tree height, DBH, crown size and etc.) and optical properties of reflection collected over forested areas [1,4,5,6,7,8].
Unlike image-based remotely sensed data, light detection and ranging (LiDAR) provides detailed information on forest structure with good laser penetration under various forest canopy conditions. LiDAR can be operated from three different platforms, namely the ground (terrestrial), airborne and satellite platforms. These LiDAR operating platforms provide different scales and details of three-dimensional measurements of forest structure and canopy that are useful for forest inventory parameter estimation [8]. Terrestrial LiDAR can be classified based on the measuring techniques, i.e., pulse ranging or time-of-flight (TOF) and the phase difference technique [9]. The latter is capable of producing range measurements at a very high rate with a high degree of accuracy but only operates over short distances. The TOF method allows range measurements of longer distances (i.e., hundreds of meters) with a much reduced measurement rate and lower accuracy compared to the phase difference method. Terrestrial laser scanning (TLS), a ground-based LiDAR system has been utilized in many applications, e.g., building reconstruction, virtual reality of the earth’s surface, architecture, civil engineering, archeology, plant design, automation systems and forestry. In forestry, TLS can provide detailed measurements of individuals and group of trees. At the plot level, TLS can be used to estimate several useful tree parameters, for example, the number of trees and their position, tree height, DBH, tree volume and so on [2,10].
TLS has the potential to provide accurate positions of trees and their structure, including how the foliage and stems are arranged [11,12]. The TLS system can also allow three-dimensional modelling and geometrical characterization of trees that could replace the manual practice of conventional forest surveys [13]. Many studies have successfully derived detailed individual tree measurements using terrestrial LiDAR, such as branch and trunk diameter at different distance intervals, tree height, tree volume, individual tree biomass [2,11,13,14,15] and crown volume [16]. However, only a few studies have focused on individual total tree above ground biomass (TAGB) estimation using tree geometry reconstruction and measurement using dense point clouds of TLS. A previous study used TLS for individual tree biomass estimation of Scots pine and Norway spruce [2]. TAGB is composed of the biomass of living branches, dead branches, bark and stem. New models for above ground biomass (AGB) were introduced and compared with the existing models that were normally based on DBH, height, and species. The results showed that the newly developed model that included several new independent variables, i.e., stem curve and crown size derived from TLS, improved the estimation accuracies, especially for branch biomass. Some of the tested variables of crown geometry of the newly developed models were suitable to improve current allometric equations for TAGB estimation. The study focused only on a single tree and tree measurements from point clouds without geometric reconstruction of the tree.
Another study estimated residual biomass from individual tree architecture in an urban forest using TLS and ground measurements [13]. The biomass of the trimmed tree crown was measured in the field and compared to the value obtained by modelling the point clouds of TLS. The tree crown was reconstructed, and its volume was measured using convex-hull, triangulation and voxel modelling of point clouds. The results showed good potential of TLS measurements for biomass estimation of pruned crowns. There is a method to calculate individual tree wood volume using TLS [17]. The point clouds were used to reconstruct the geometry of the entire woody parts of a tree by generating different resolutions of voxels in the point clouds. The total volume was calculated by the total volume of the voxels. A previous study applied sectional volumes based on measured diameter at several heights using cylinder fitting and estimated biomass by multiplying the volume estimated with wood specific density [18]. However, this study did not include information for the crown structure when crown biomass was based on the assumption that crown biomass accounts for 20% of total aboveground biomass. There was also a study that aimed to estimate tree branch biomass using TLS with different scanning resolutions [19]. The complexity of tree branches was simulated using logging residuals, and the scanning was done at different scanning distances. The results showed that biomass estimation was not affected by scanning distances, and the method successfully estimated the biomass with an accuracy of 95%.
In another study, a single-scan experimental echidna validation instrument (EVI) was used to estimate the biomass of conifer and broadleaves trees; a high correlation with field-measured biomass was achieved (r2 = 0.85). This study used horizontal slices for diameter at breast height measurements and employed allometric models for EVI biomass estimation. A multi-scan approach provides more detailed datasets that can be used in tree reconstruction to measure wood and leaf volume directly from the point clouds, providing a more geometrical-based biomass estimation rather than depending on allometric equations. Several studies have been devoted to biomass estimation of shrubs. There was a study that utilized TLS for shrub biomass estimations using volumetric surface differencing and voxel counting [20]. Both methods produced strong relationships between harvested and estimated biomass. Point clouds obtained from airborne LiDAR and TLS were combined to estimate the biomass of sagebrush based on regression models between voxel-volume, TIN-volume, convex hull-volume, airborne LiDAR-derived percent vegetation cover (PVC) and harvested biomass [21]. The results showed the voxel-volume approach produced better results for individual shrub biomass estimation. The PVC method showed a good correlation with the field-measured shrub biomass at the plot scale. In another study, the aboveground biomass of sagebrush was estimated using regression models between shrub volume estimated using voxel, convex hull and harvested biomass [22]. The biomass estimate obtained using the convex-hull volume outperformed the voxel approach. The methods used for shrub volume estimation could be used for tree crown biomass estimation in forest areas.
Tropical rainforests are known for their dense forest cover and understorey vegetation. This condition would limit the visibility of the TLS, which might cause imperfect distribution of point clouds over individual trees. This can complicate detailed tree measurements and the biomass estimation process that relies on the generated point clouds. Besides the destructive method, previous recommended laser-based methods have shown that useful allometric equations for individual tree biomass estimation can be developed and extended using the non-destructive approach. However, most of the previous studies were conducted using residuals, individual tree and area covered by low and sparse shrubs, which has different challenges compared to work carried out in tropical rain forests, especially in The Royal Belum forest reserve, one of the oldest rainforests in the world. This study aims to estimate individual tree biomass of various species of trees in a tropical rain forest in Malaysia using point clouds generated from TLS. With additional information from individual tree measurements, several species-specific allometric equations for above ground biomass estimation have been produced in this study.

2. Materials and Methods

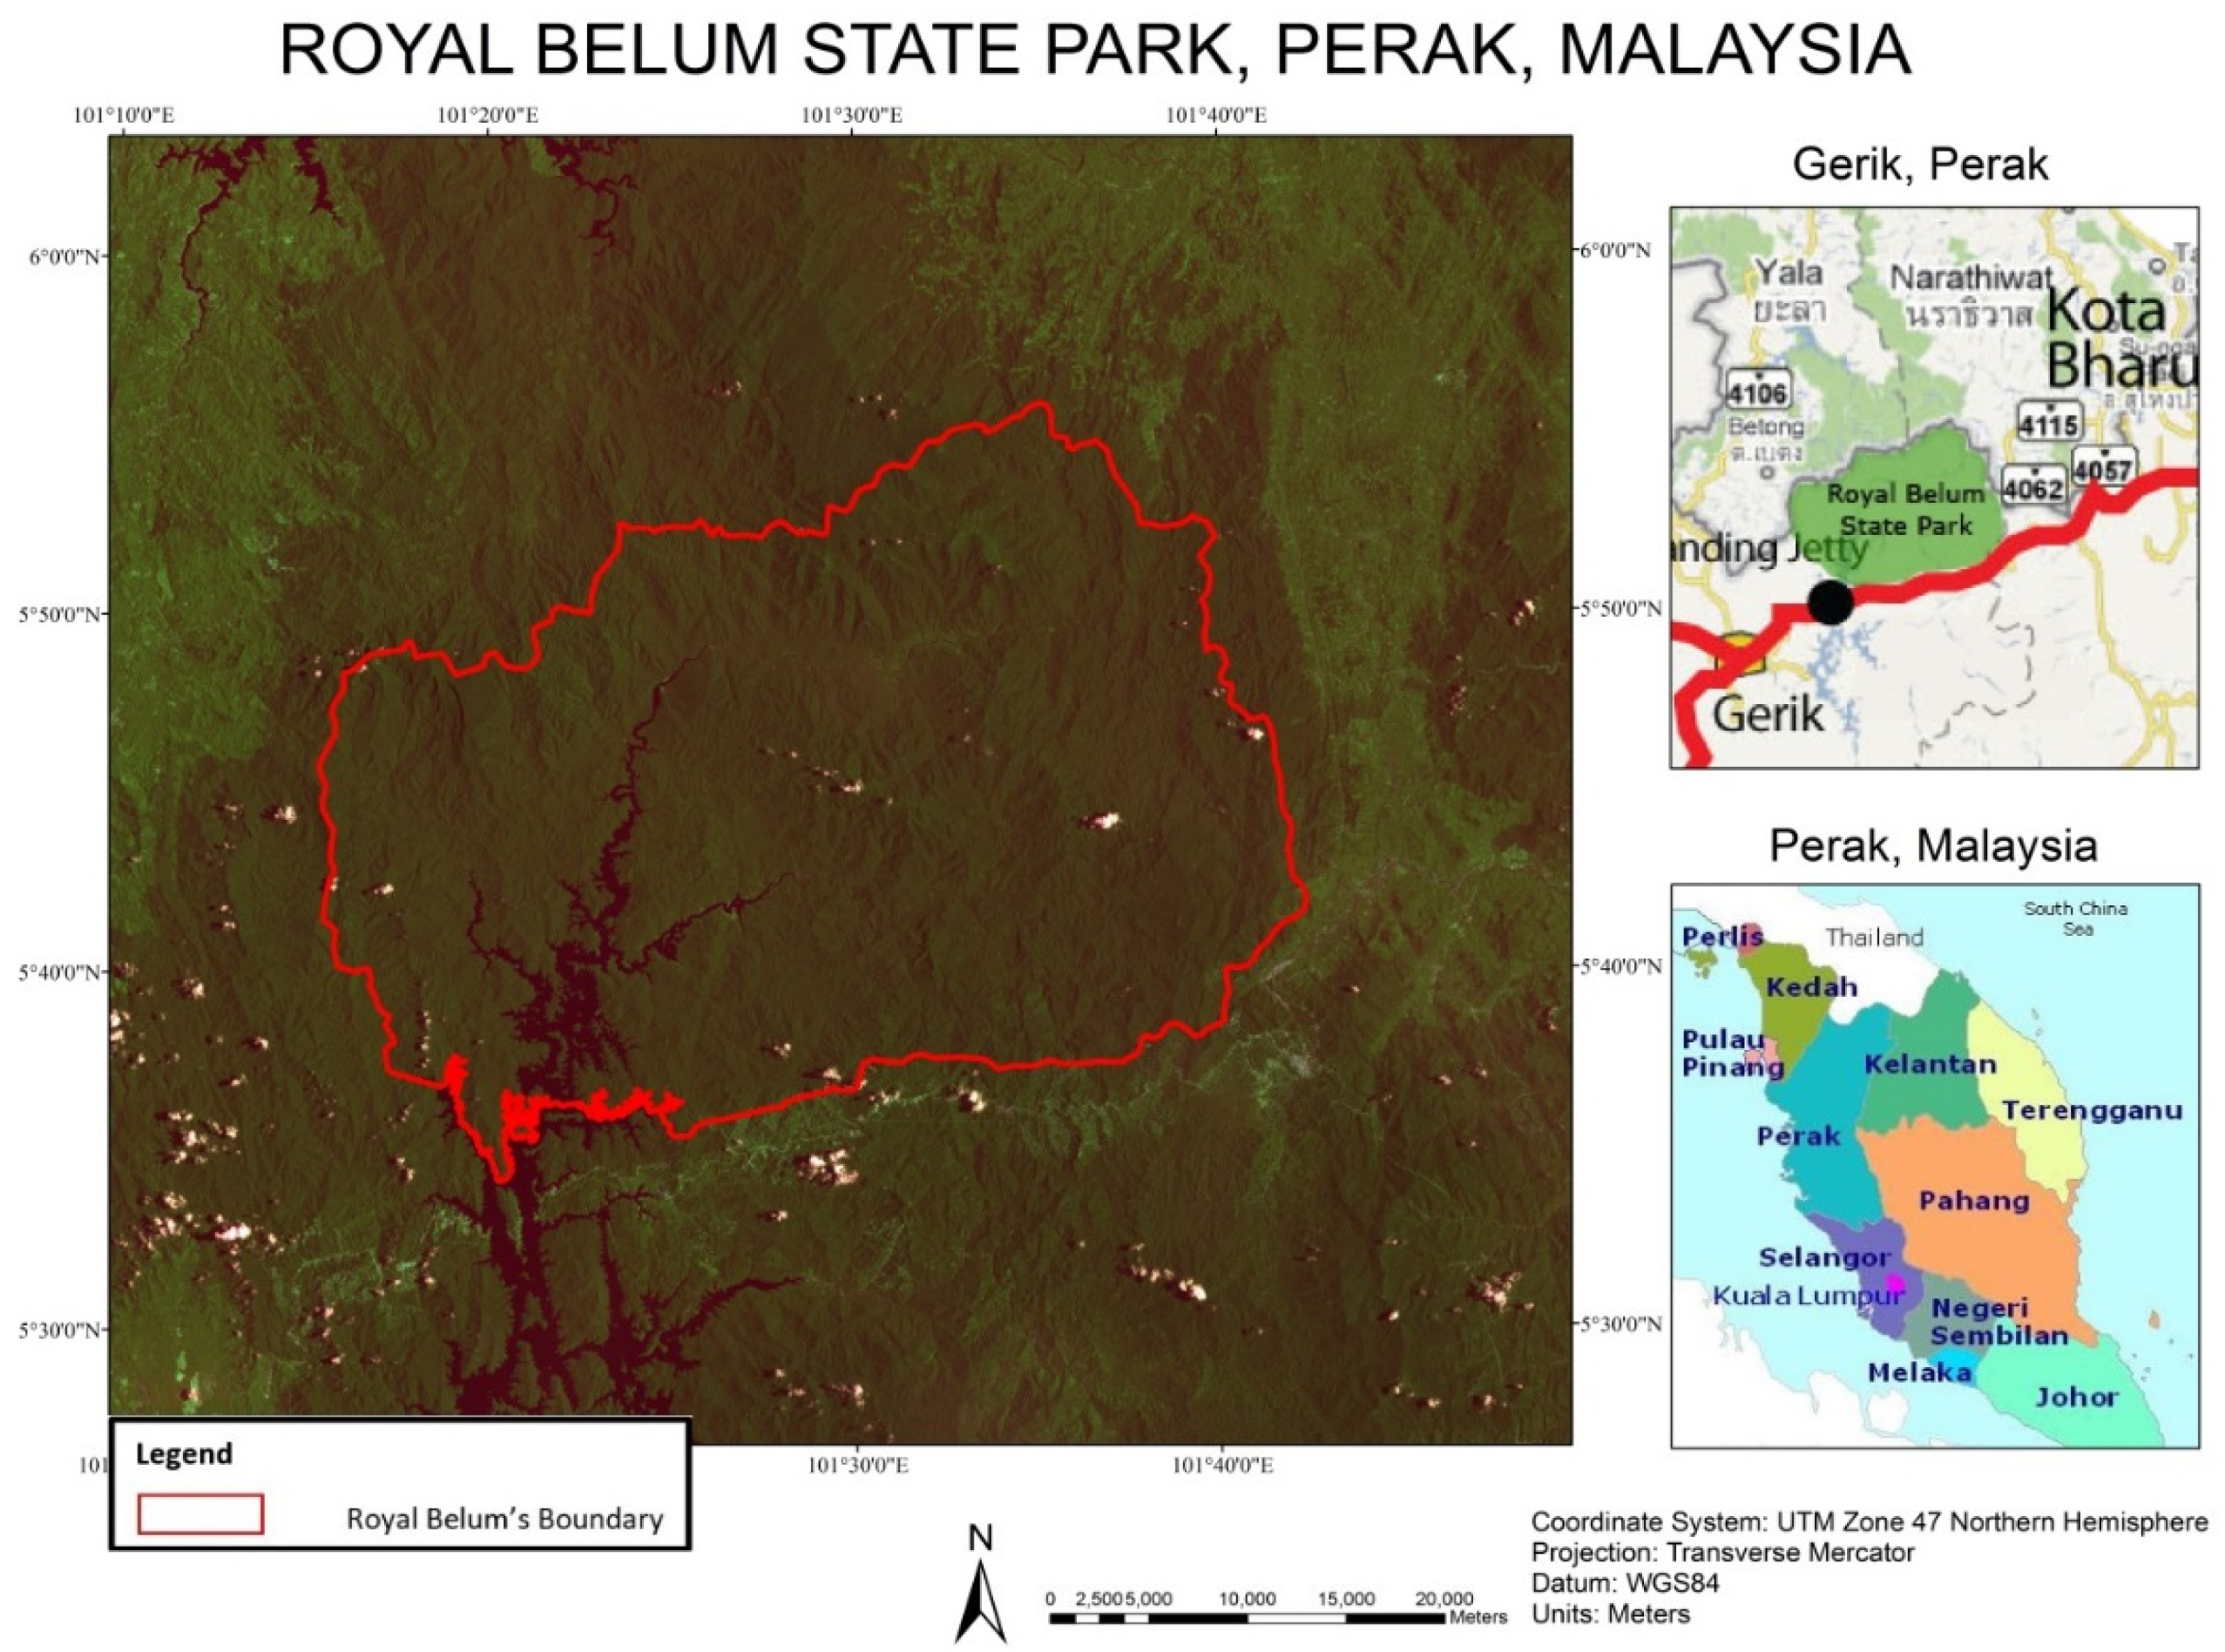
The Royal Belum forest reserve consists of 300,000 hectares of tropical rainforest, believed to exist for over 130 million years. The forest reserve is located in Gerik, Perak state of Peninsular Malaysia (Figure 1). The forest is covered by dense dipterocarp forest and is home to at least 14 threatened tree species [23]. Furthermore, it is also known to be an area rich in endangered animals such as Malayan Tigers, Asian Elephants and Sumatran Rhinoceroses. The area remains warm and humid throughout the year; the temperature ranges from 23 °C to 32 °C, with 2205 mm average rainfall, and the highest altitude of the study area is 1533 m.
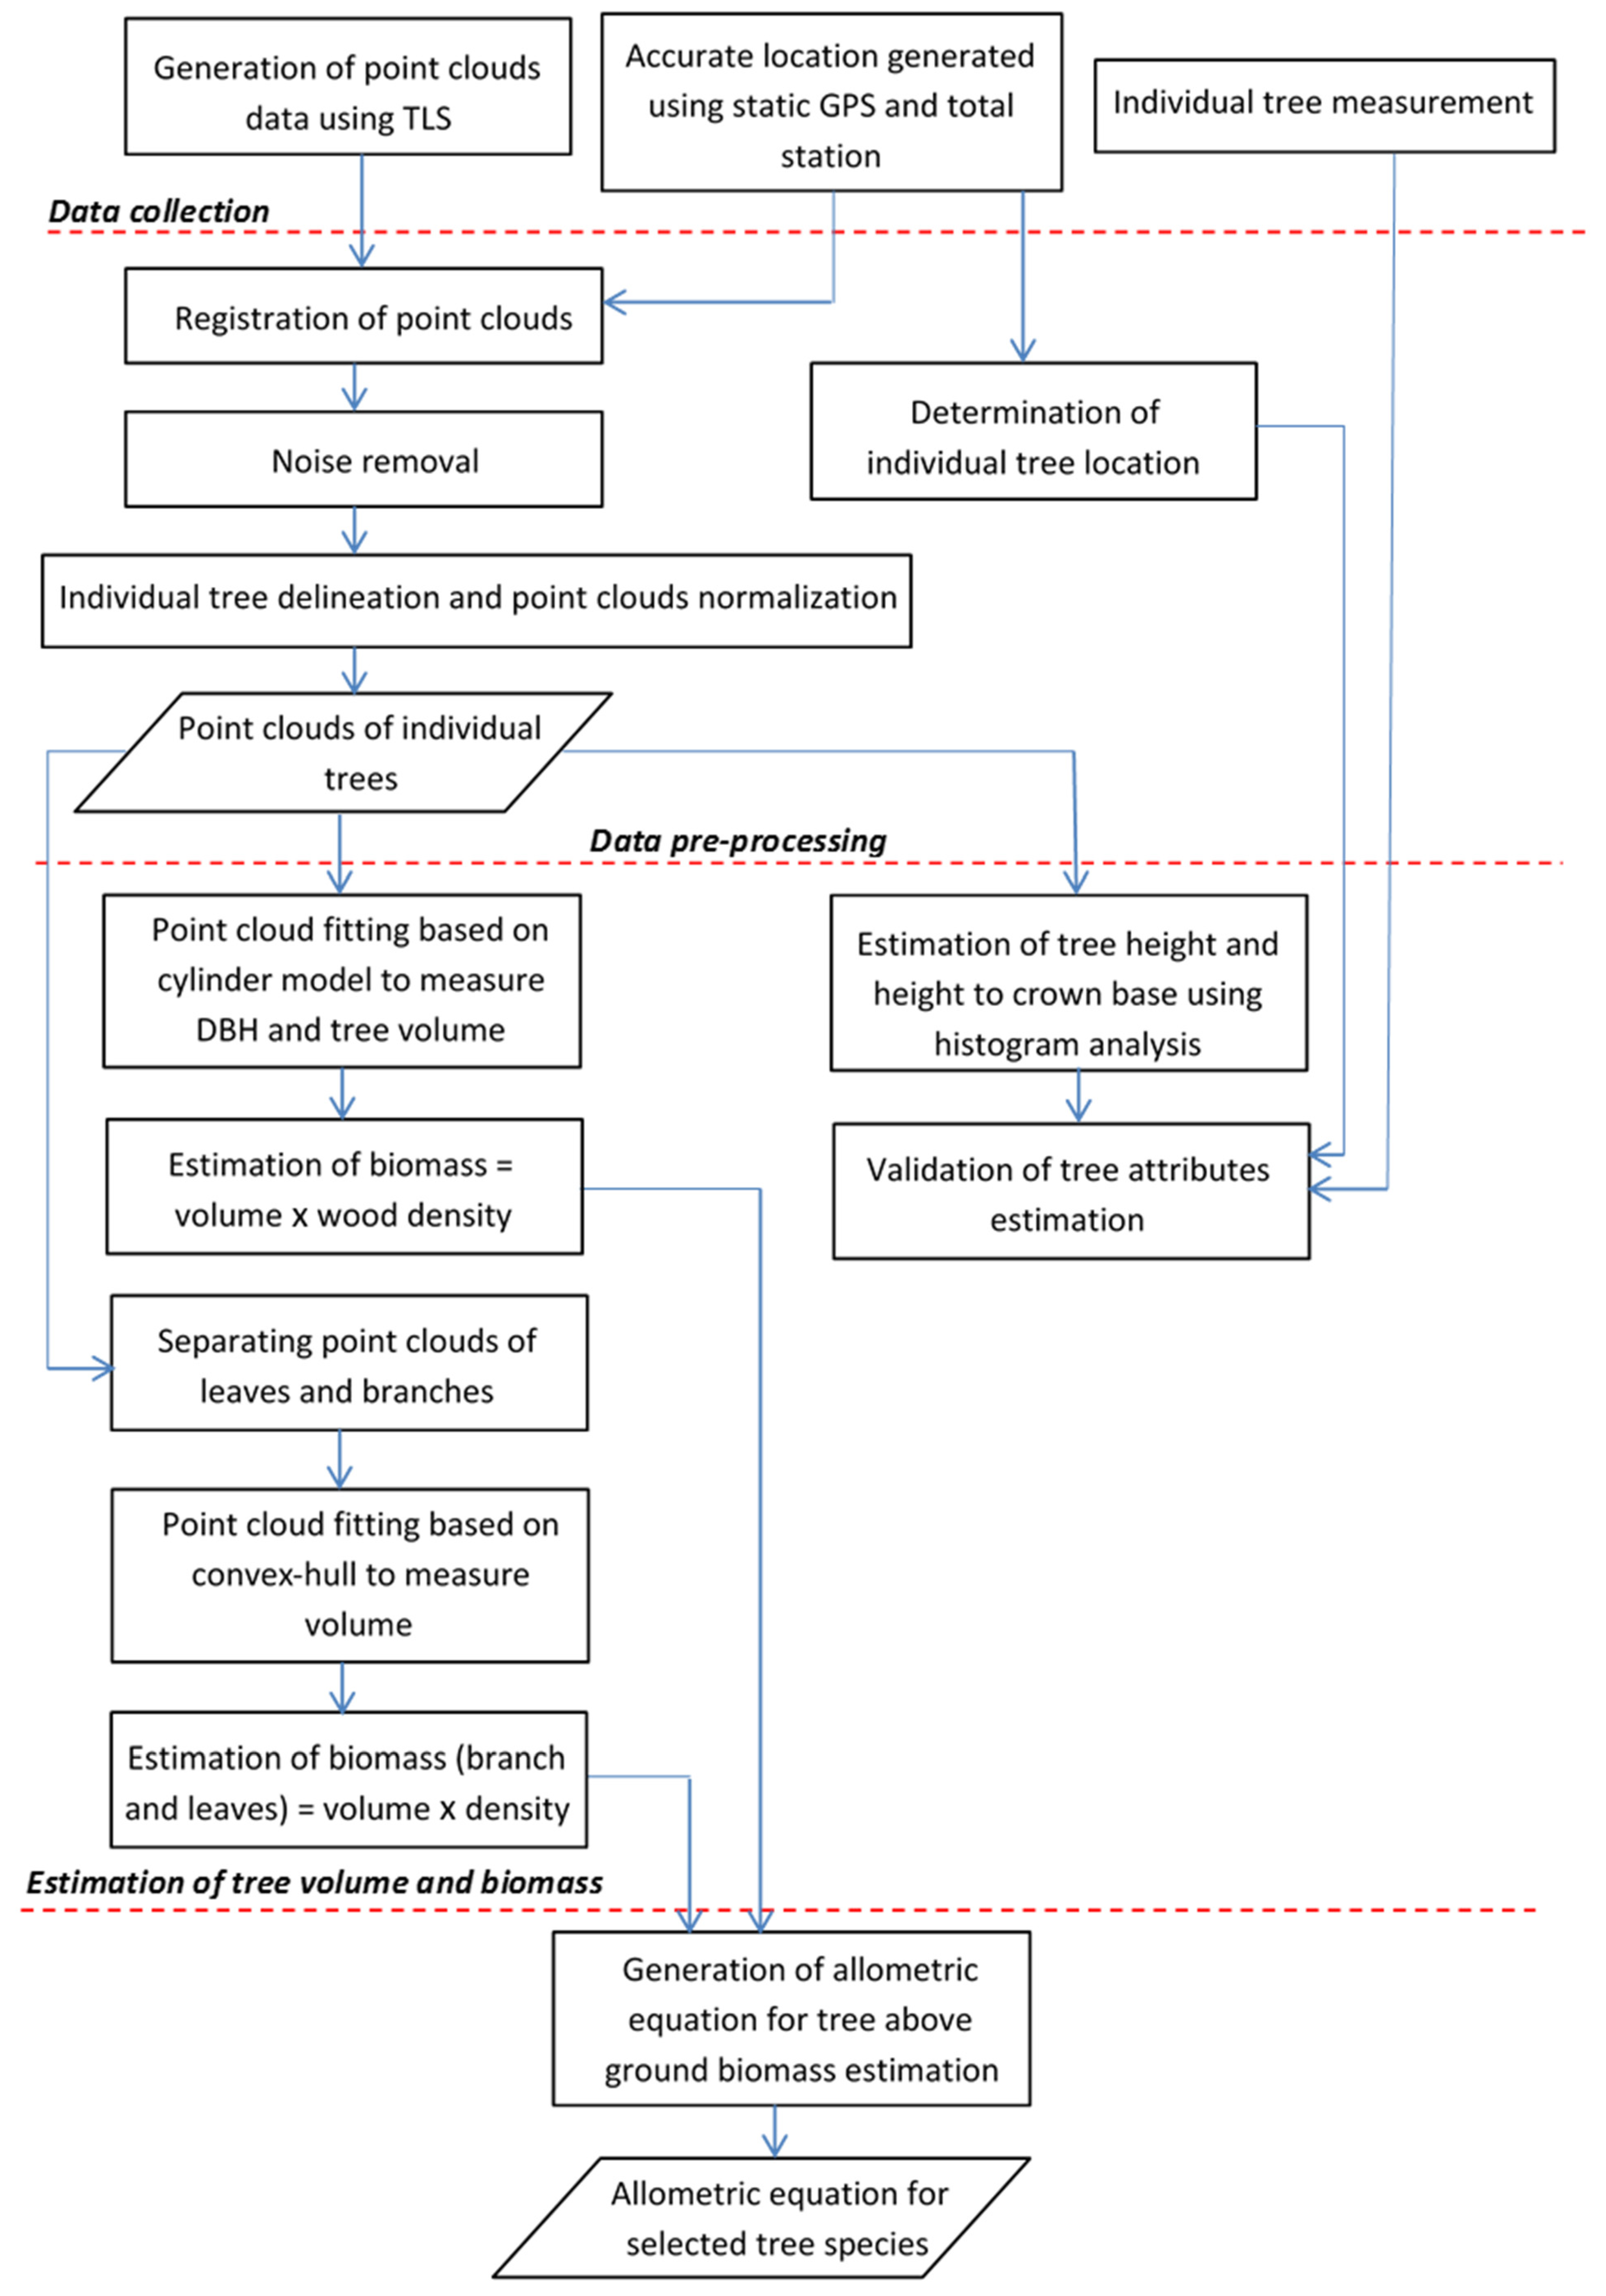
In general, the methodology used to obtain tree biometric parameters and estimate the total above ground biomass (TAGB) in the Royal Belum reserve forest can be divided into four major steps, namely, data collection, data pre-processing, estimation of tree volume and biomass, and development of allometric equations for selected tree species (see Figure 2). The first stage focused on the generation of point cloud data and individual tree measurements of forest plots. The data were used for geometric reconstruction of individual trees and validation of estimated tree properties, i.e., tree location, DBH, tree height, and height to crown base. In the data pre-processing stage, the raw point clouds were registered using accurate locations given by global positioning system (GPS) and the total station method. A similar approach of location determination was used for individual tree location. In the third stage, different parts of individual tree volumes and biomass were estimated. This non-destructive approach of biomass estimation requires wood and leaf density to be estimated for different tree species. Finally, a new set of allometric equations was generated based on tree DBH, height, crown size, and height to crown base. The estimated tree AGB was compared with the value estimated using different allometric equations that have been developed for tropical forests. A more detailed description of each of the steps is provided in the following sub sections.

2.1. Individual Tree Inventory: A Conventional Approach

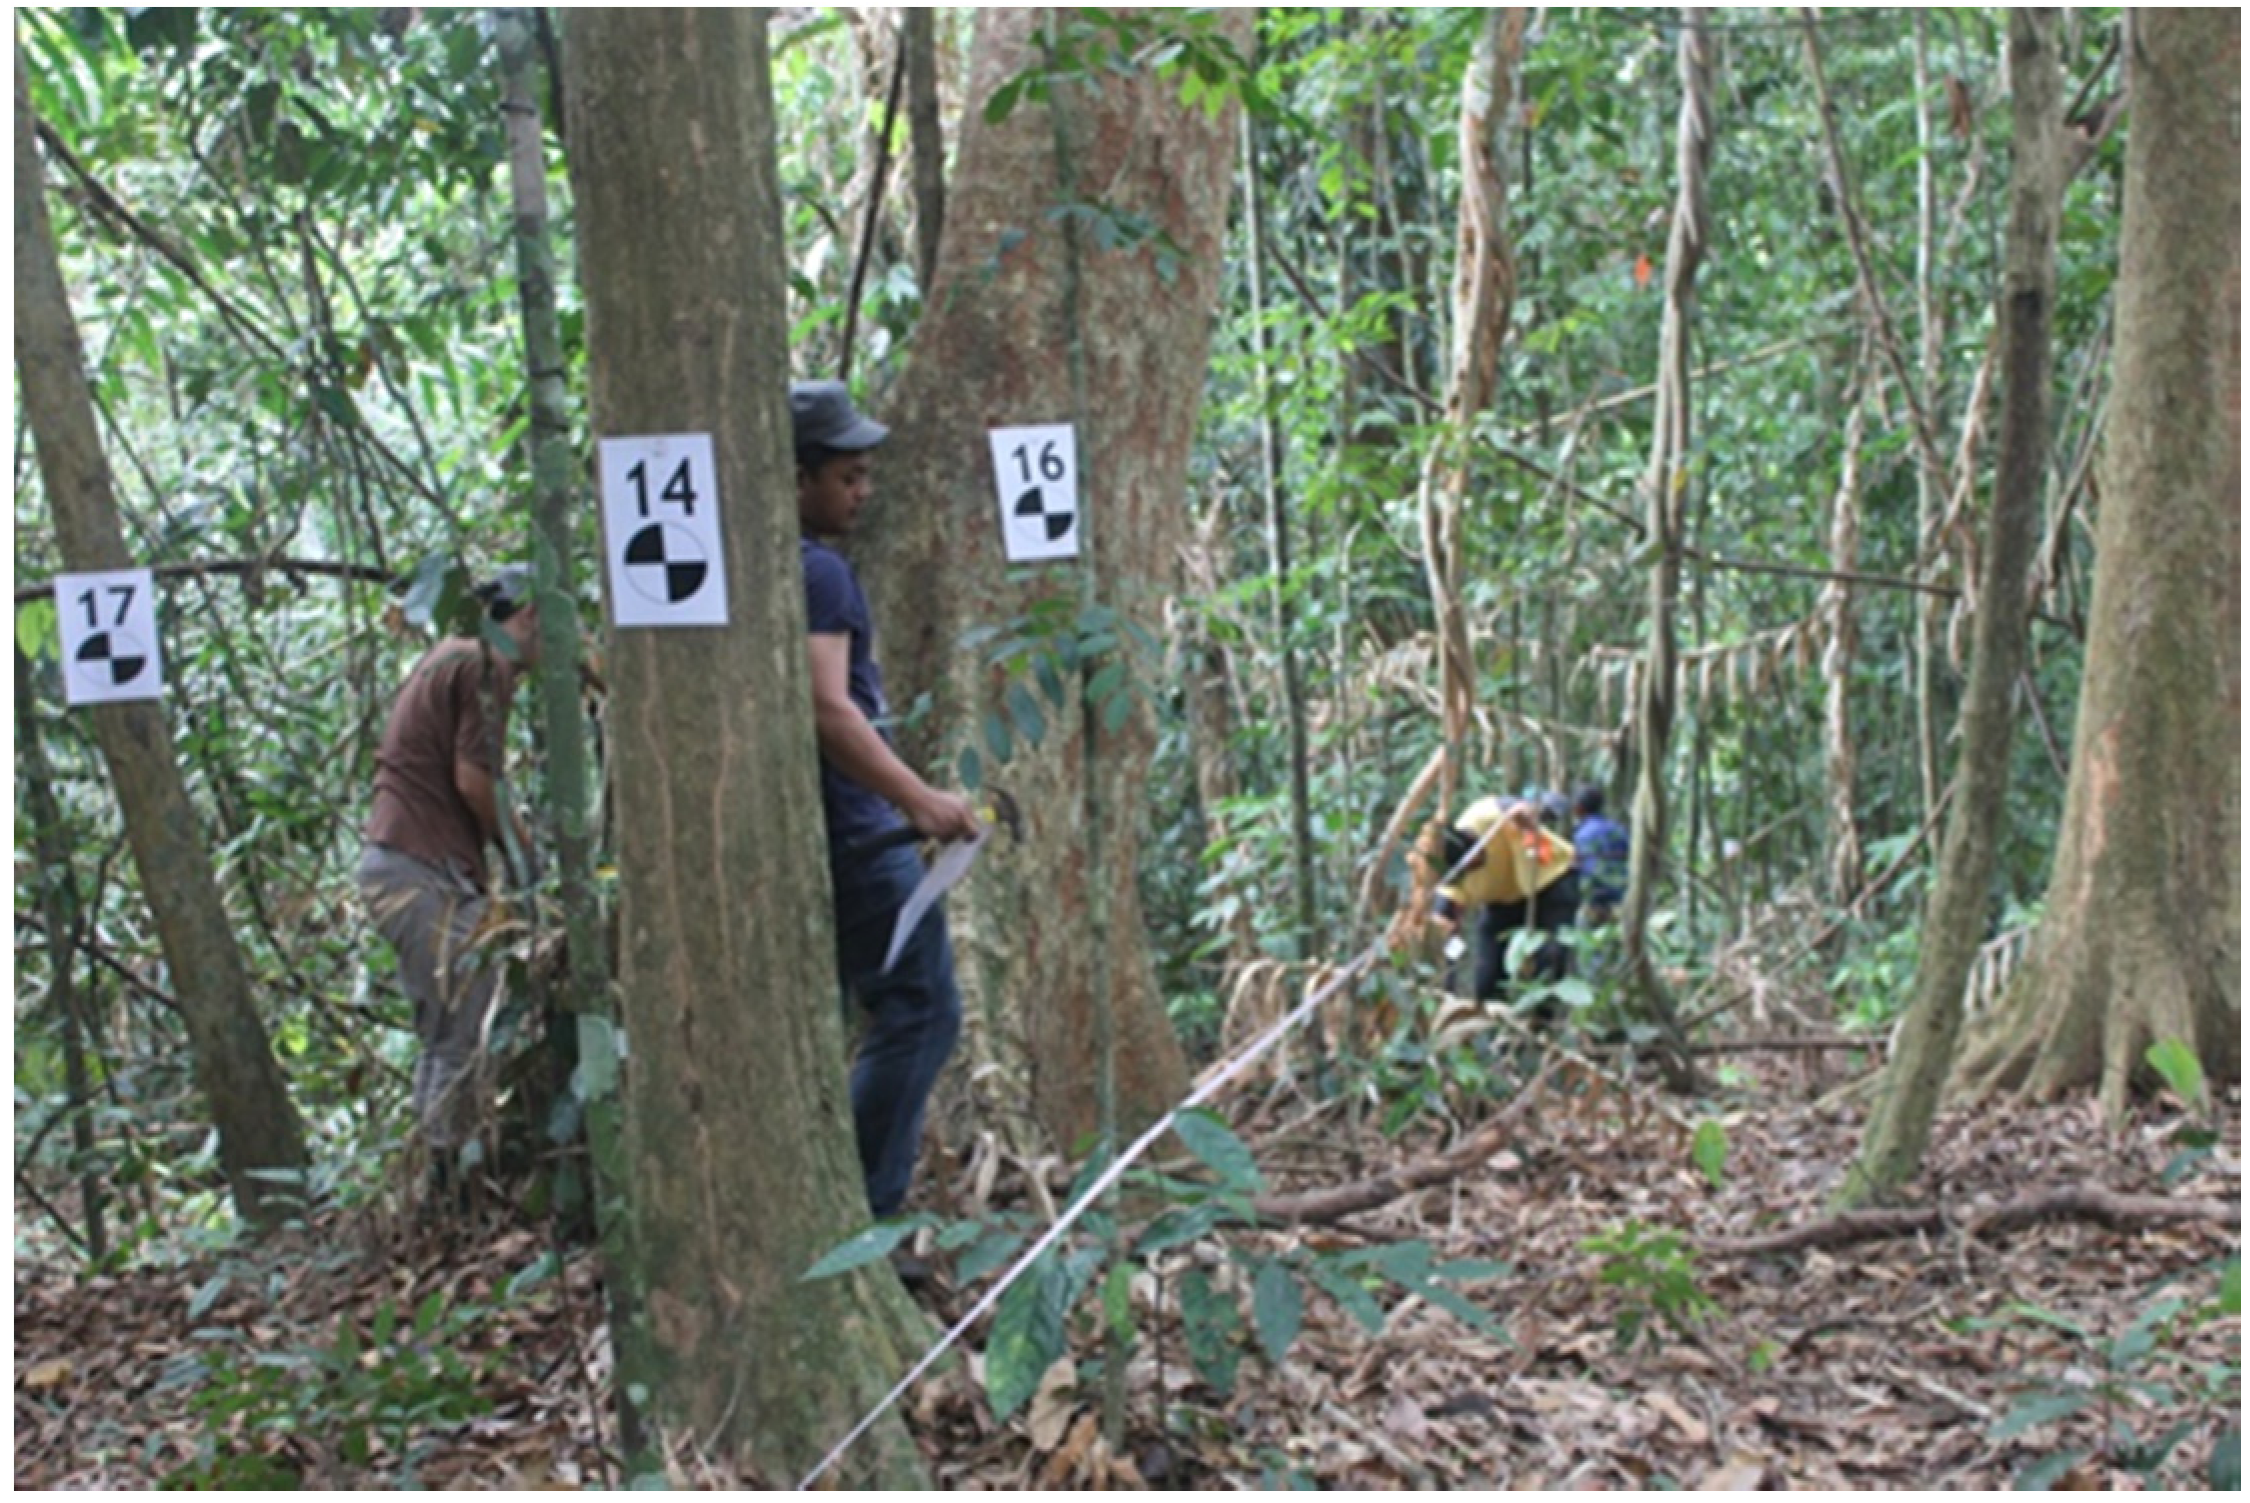
The individual tree measurements were completed for 36 plots, which were randomly selected over the study area. Each plot has a circular shape with a diameter of approximately 30 m. During the inventory process, trees with 10-cm DBH were labelled with unique signage (see Figure 3), and tree attributes such as tree height, DBH, tree species, height to crown base, and location were recorded. Tree height was measured using a clinometer and laser-aided hypsometer. Tree DBH was measured using a diameter measuring tape, and the tree position was recorded by using a combination of static GPS and reflectorless total station. The static measurement of GPS was carried out in an open space usually located at the edge of the forest area. The accurate local coordinates were transferred to the specific forest plot and individual trees using reflectorless total station.

2.2. Generation of Point Clouds in Sample Plots

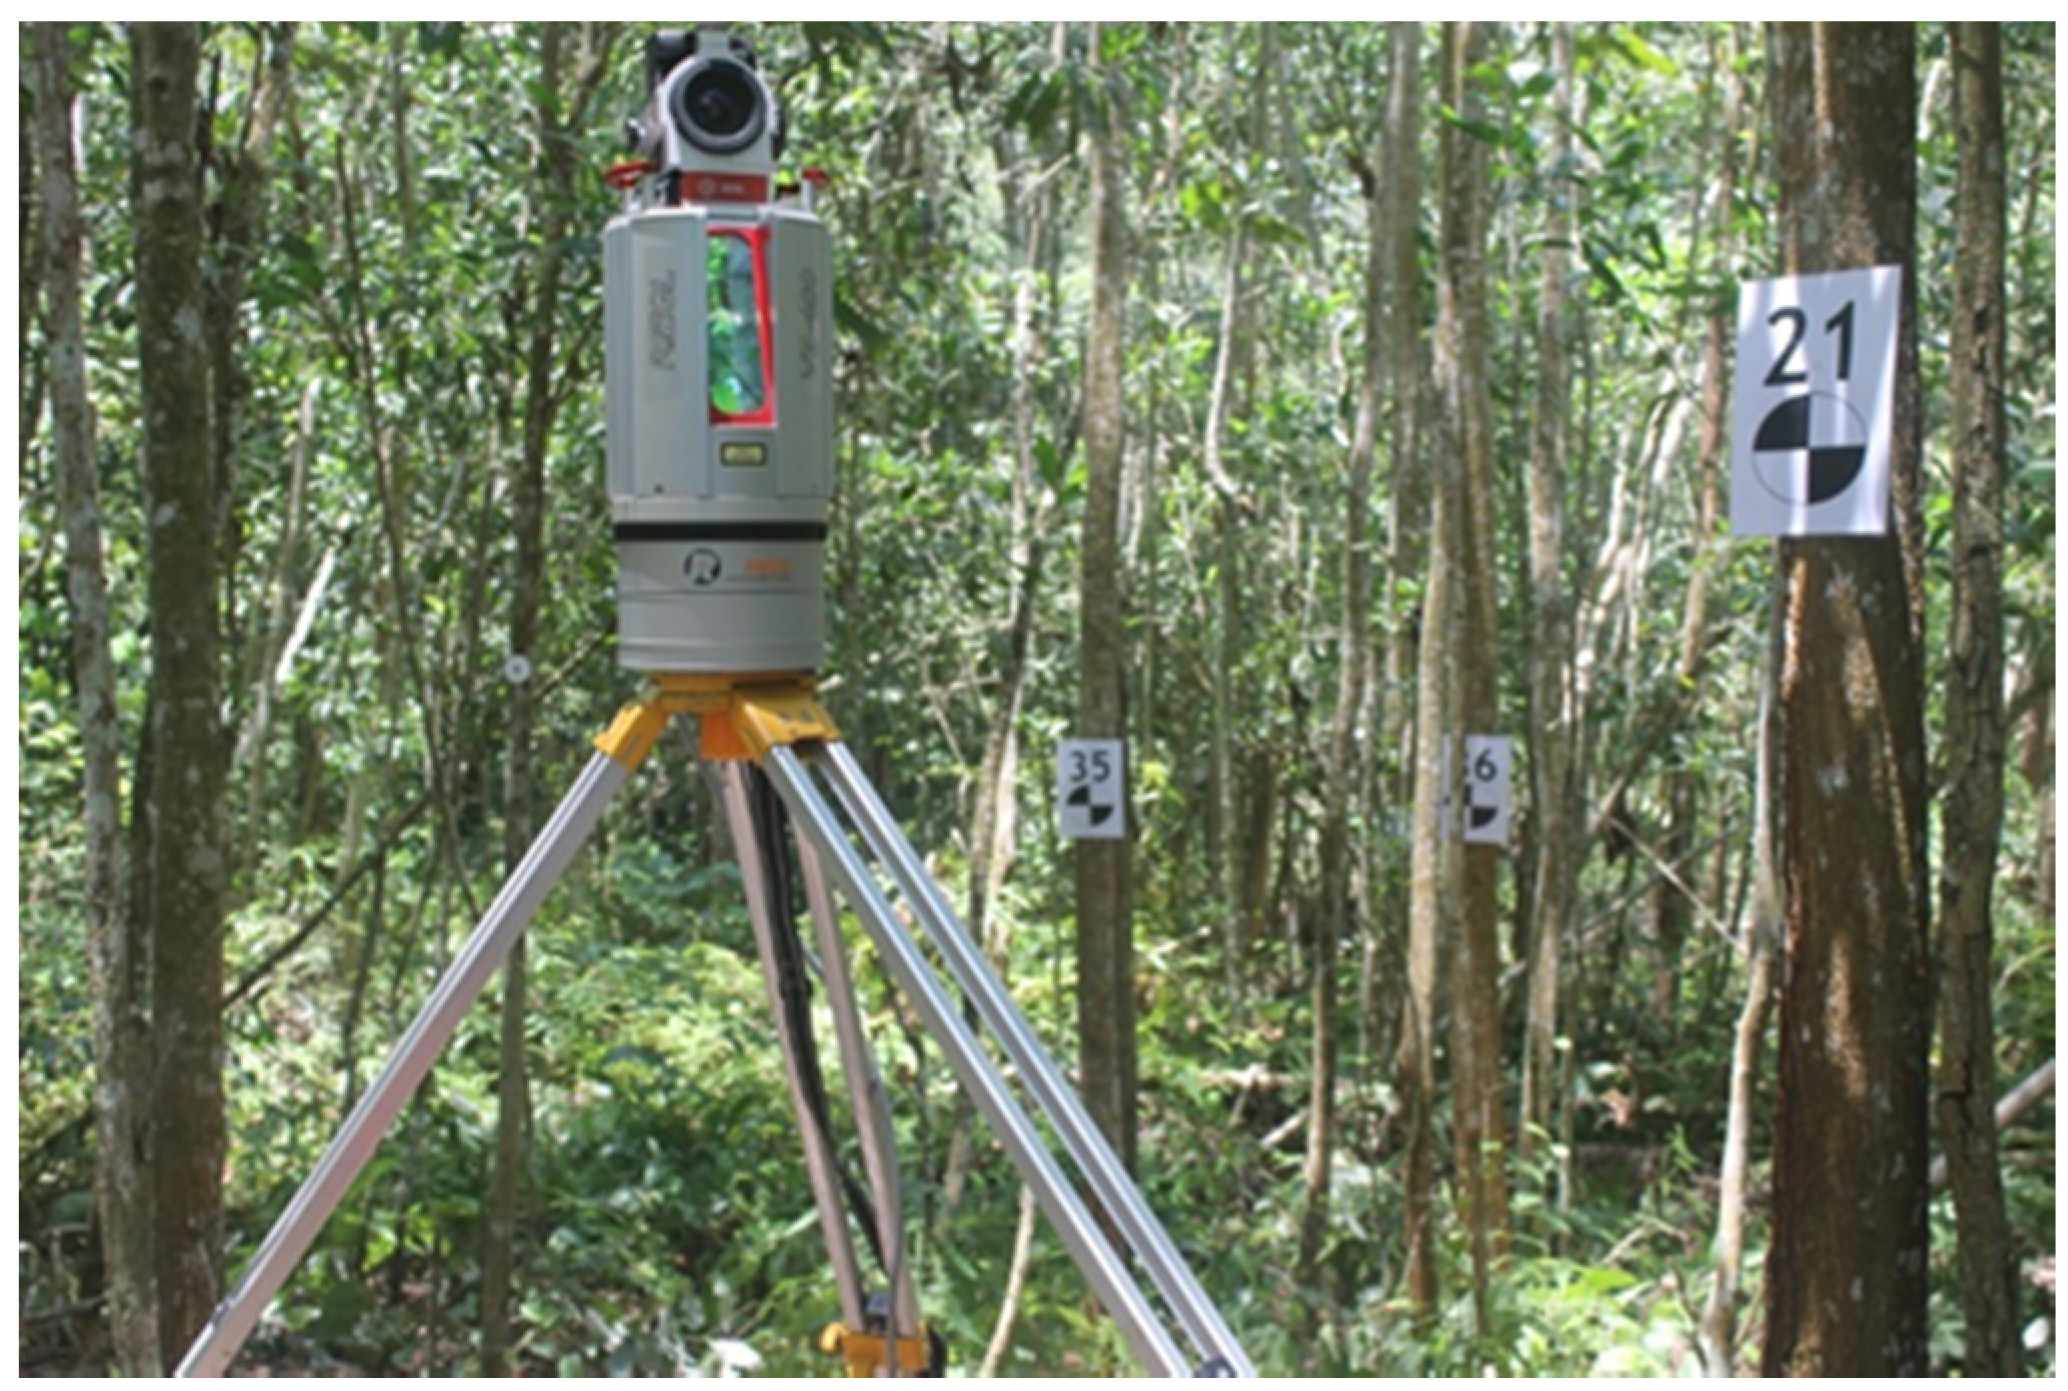
Manual tree biometric measurements were accompanied by a semi-automatic laser-based approach, which allows detailed measurements of individual trees. The semi-automatic measurement approach was carried out on point clouds generated using VZ-400 Riegl TLS (Riegl, Austria) (see Figure 4). During the fieldwork, we scanned all 36 forest plots with the TLS that includes various sizes of dominant trees and understorey vegetation. Sample plots with relatively dense understorey vegetation were cleared to facilitate the scanning process. Each plot was scanned with 4 positions, which covered the centre and 3 edge locations of the forest plot with a distance approximately 14.6 m from the centre. Each scanning position was selected based on the location of trees and the condition of the terrain. The TLS should be placed on firm and relatively flat stable ground to ensure a consistent measurement process. The coordinate of each scanning position was determined using a total station and static Global Positioning System (GPS). The static measurement of GPS was carried out in an open space usually located at the edge of the forest area. These accurate positioning data were transferred to a specific forest plot by using reflectorless total station (TS).
Generation of point clouds of trees in the forest area using TLS requires multiple scanning processes with careful selection of scanning positions. This is very important to ensure that the scanning process will be able to produce dense point clouds for individual trees. Each point cloud set produced by separate scanning processes was combined and registered using common tie points located in the selected points in each sample plot. Tie points created using a cylindrical shape reflector were located randomly in each forest plot and could be seen by all scanning positions. The point clouds were transferred to the local ground coordinate system by using the real coordinate measurements produced by TS and GPS.
Furthermore, for individual tree identification and extraction, each tree was marked with reference signage with a unique number. The unique signage is required to assist the matching process of trees as identified from the point clouds and field observations. The purpose of the tree matching process is to extract individual trees from the point clouds and to compare the estimated forest attributes with the field measurements. This signage can also be used as additional tie points for the point cloud registration process. For accurate and dense point cloud generation, the scanning mode was set to discrete with full-waveform approaches. The discrete scanning approach was accompanied by red, green and blue (RGB) data that give colour to individual points. The discrete mode of scanning requires longer operation compared to full-waveform mode as it generates detailed waveforms of signals reflected by different parts of the forest.

2.3. Semi-Automatic Approach for Individual Tree Measurement

2.3.1. Pre-Processing of Point Cloud Data

The pre-processing stage involved preparation of the raw point cloud data for further processing such as aligning all scanning positions together and removing unnecessary point clouds. For the purpose of point cloud registration, tie points were used as a reference to merge the point clouds obtained from all scanning positions into one projected coordinate system. The process is known as point cloud registration. The first scan was registered as a reference, and the subsequent scans were registered relative to the first scan. The minimum number of tie points required to register two scanning positions is three, and these tie points were set up at several locations at a height approximately 1.5 m above ground. In the case of dense tropical rainforests (such as the case of this study), additional control points were located with large size reflective cylinders to facilitate the registration process.
After registration, noise or unnecessary point clouds originating from neighboring trees, understory trees and the ground surface were removed so that further processing focused on a single tree. The noise was removed manually by a careful inspection of every single tree marked in the field based on the trees and the signs that could be seen in the point clouds. The cleaned point clouds were then separated into individual trees for tree attribute estimation. Further cleaning processes for leaf and small branches were required to separate the trunk and branches prior to diameter estimation at different height intervals. The filtered point clouds of individual trees were then normalized by subtracting the base elevation of the tree from the elevation values of point clouds belonging to a particular tree. This process transforms the elevation value of point clouds to height information.

2.3.2. Estimation of Individual Tree Attributes

Estimation of individual tree attributes was divided into: (1) tree location; (2) height to crown base; (3) DBH; (4) tree trunk volume (5) branch volume; (6) leaf volume; and (7) tree height. Tree height and height to crown base were estimated using histogram analysis of the point cloud height values. The branch and leaf volumes were estimated based on the convex-hull volume pertaining to the point clouds. Estimations of DBH and tree trunk volume were based on the cylindrical models fitted to point clouds.
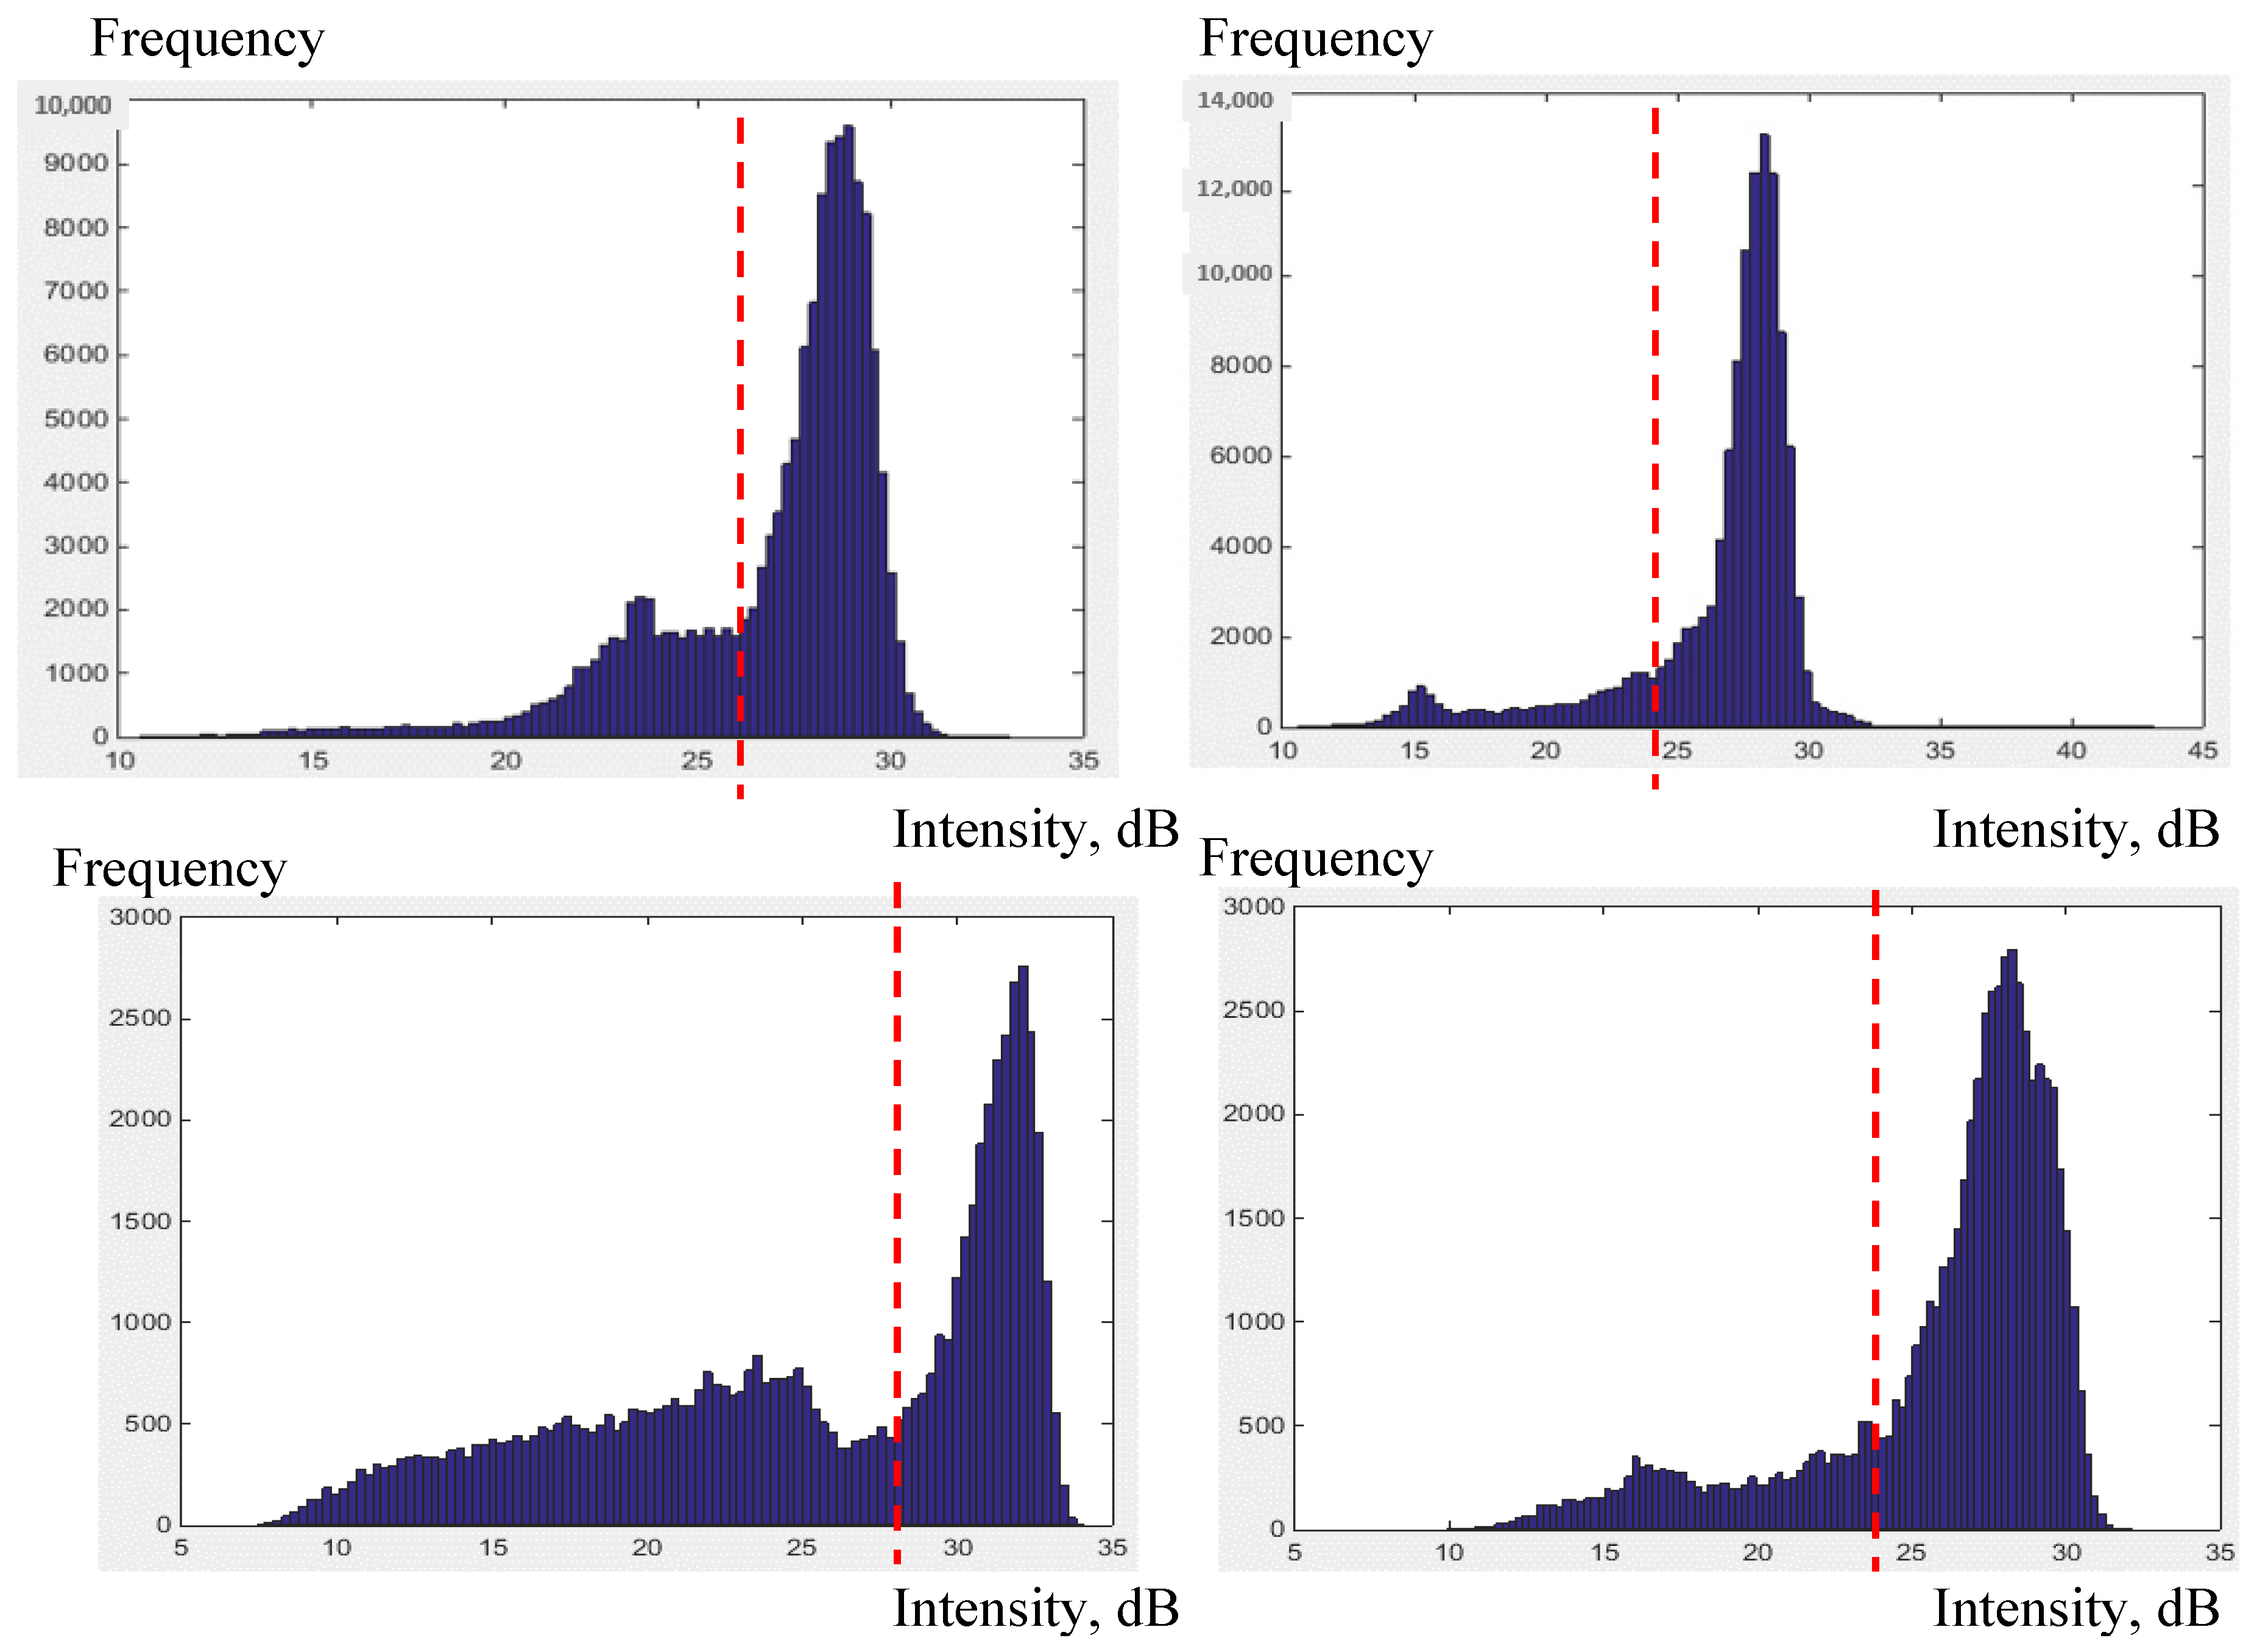
Prior to the tree attribute estimation process, the point clouds of a single tree were divided into branches, leaves and the tree trunk. The intensity values of point clouds were used to separate tree branches from leaves. The process relies on the assumption that the recorded near infrared intensity of leaves would have higher value compared to tree branches. The histogram of intensity values of the tree crown was used to manually define a suitable threshold value for this purpose (Figure 5). The point clouds with an intensity value above the threshold were classified into leaves, and the rest were assigned to branches. Each tree has a different shape of the intensity histogram, requiring different values of the threshold to separate leaves and branches. This might be due to the reflectivity from various scanning distances between trees, the scanner and variation in the infrared reflectivity from the leaves.
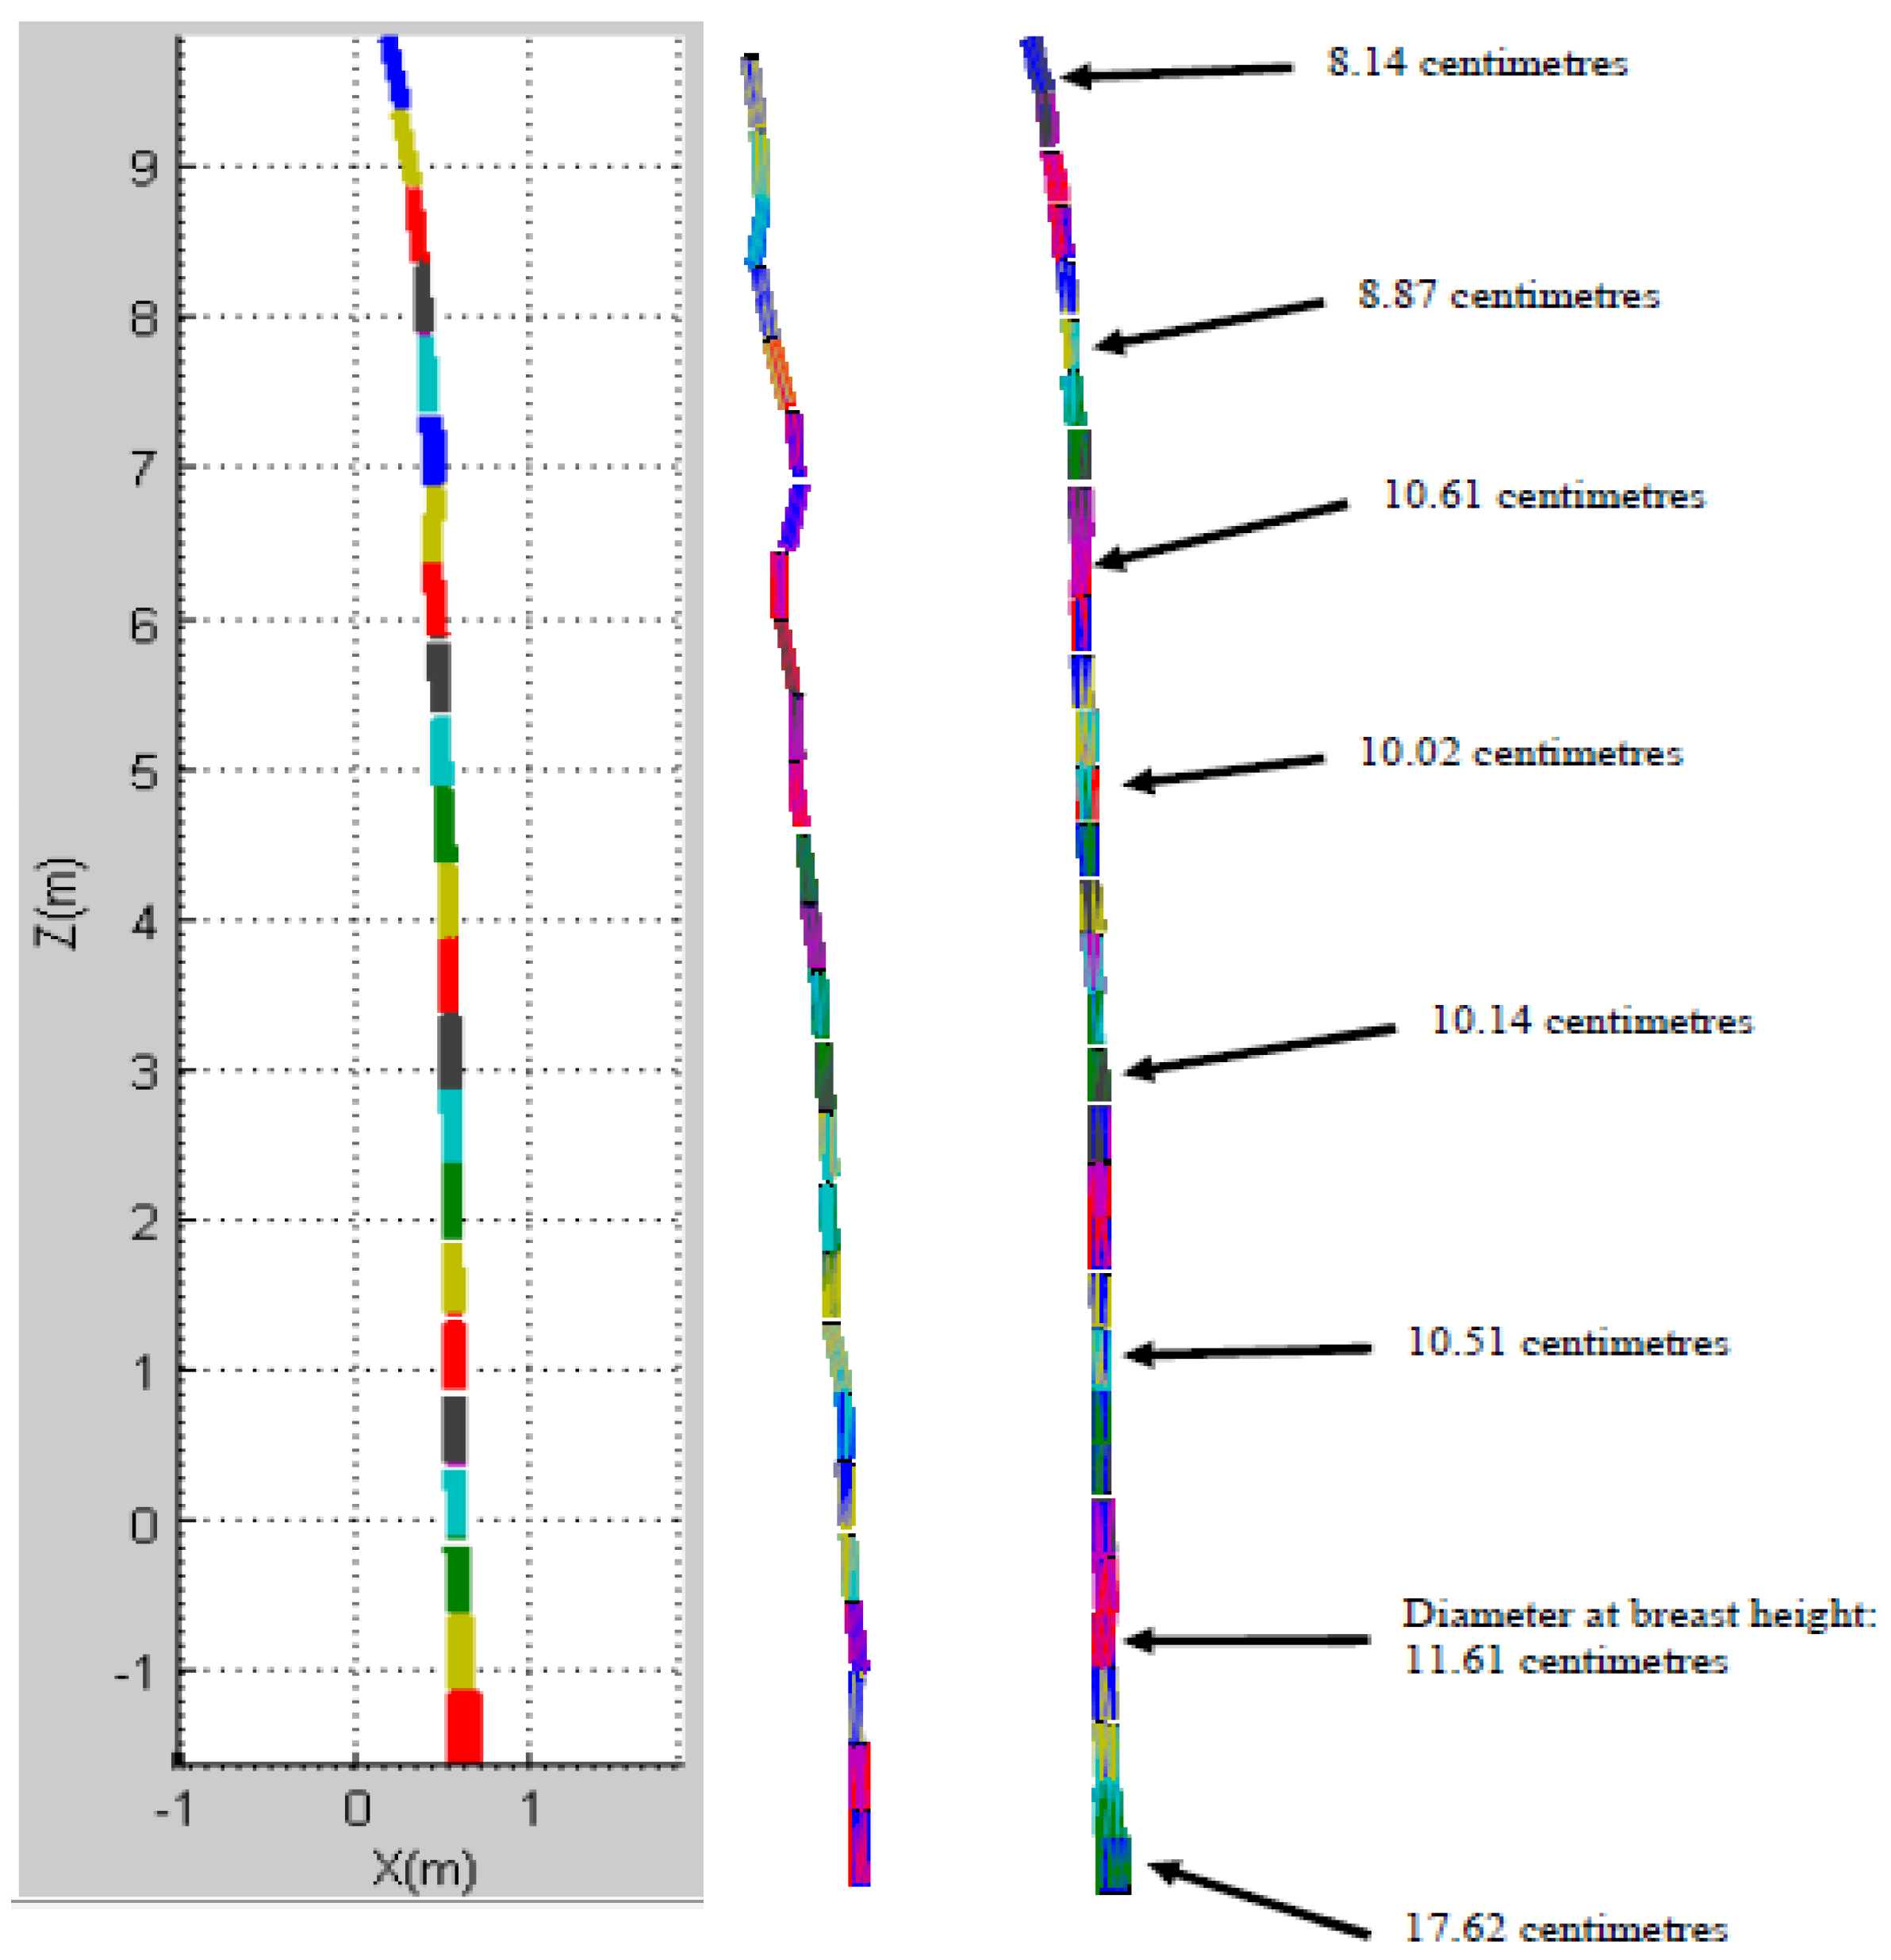
The fitting process of point clouds that belong to the tree trunk was done using a cylinder model at different height intervals. The fitting process requires two input parameters, namely a distance interval and axis (X, Y or Z), where the point clouds will be partitioned. Tree trunk diameter and total trunk volume were estimated based on the cylinder diameter at a selected height and the total volume of the fitted cylinder models, respectively. Methods for tree height and crown base height estimation were adopted from a previous study [
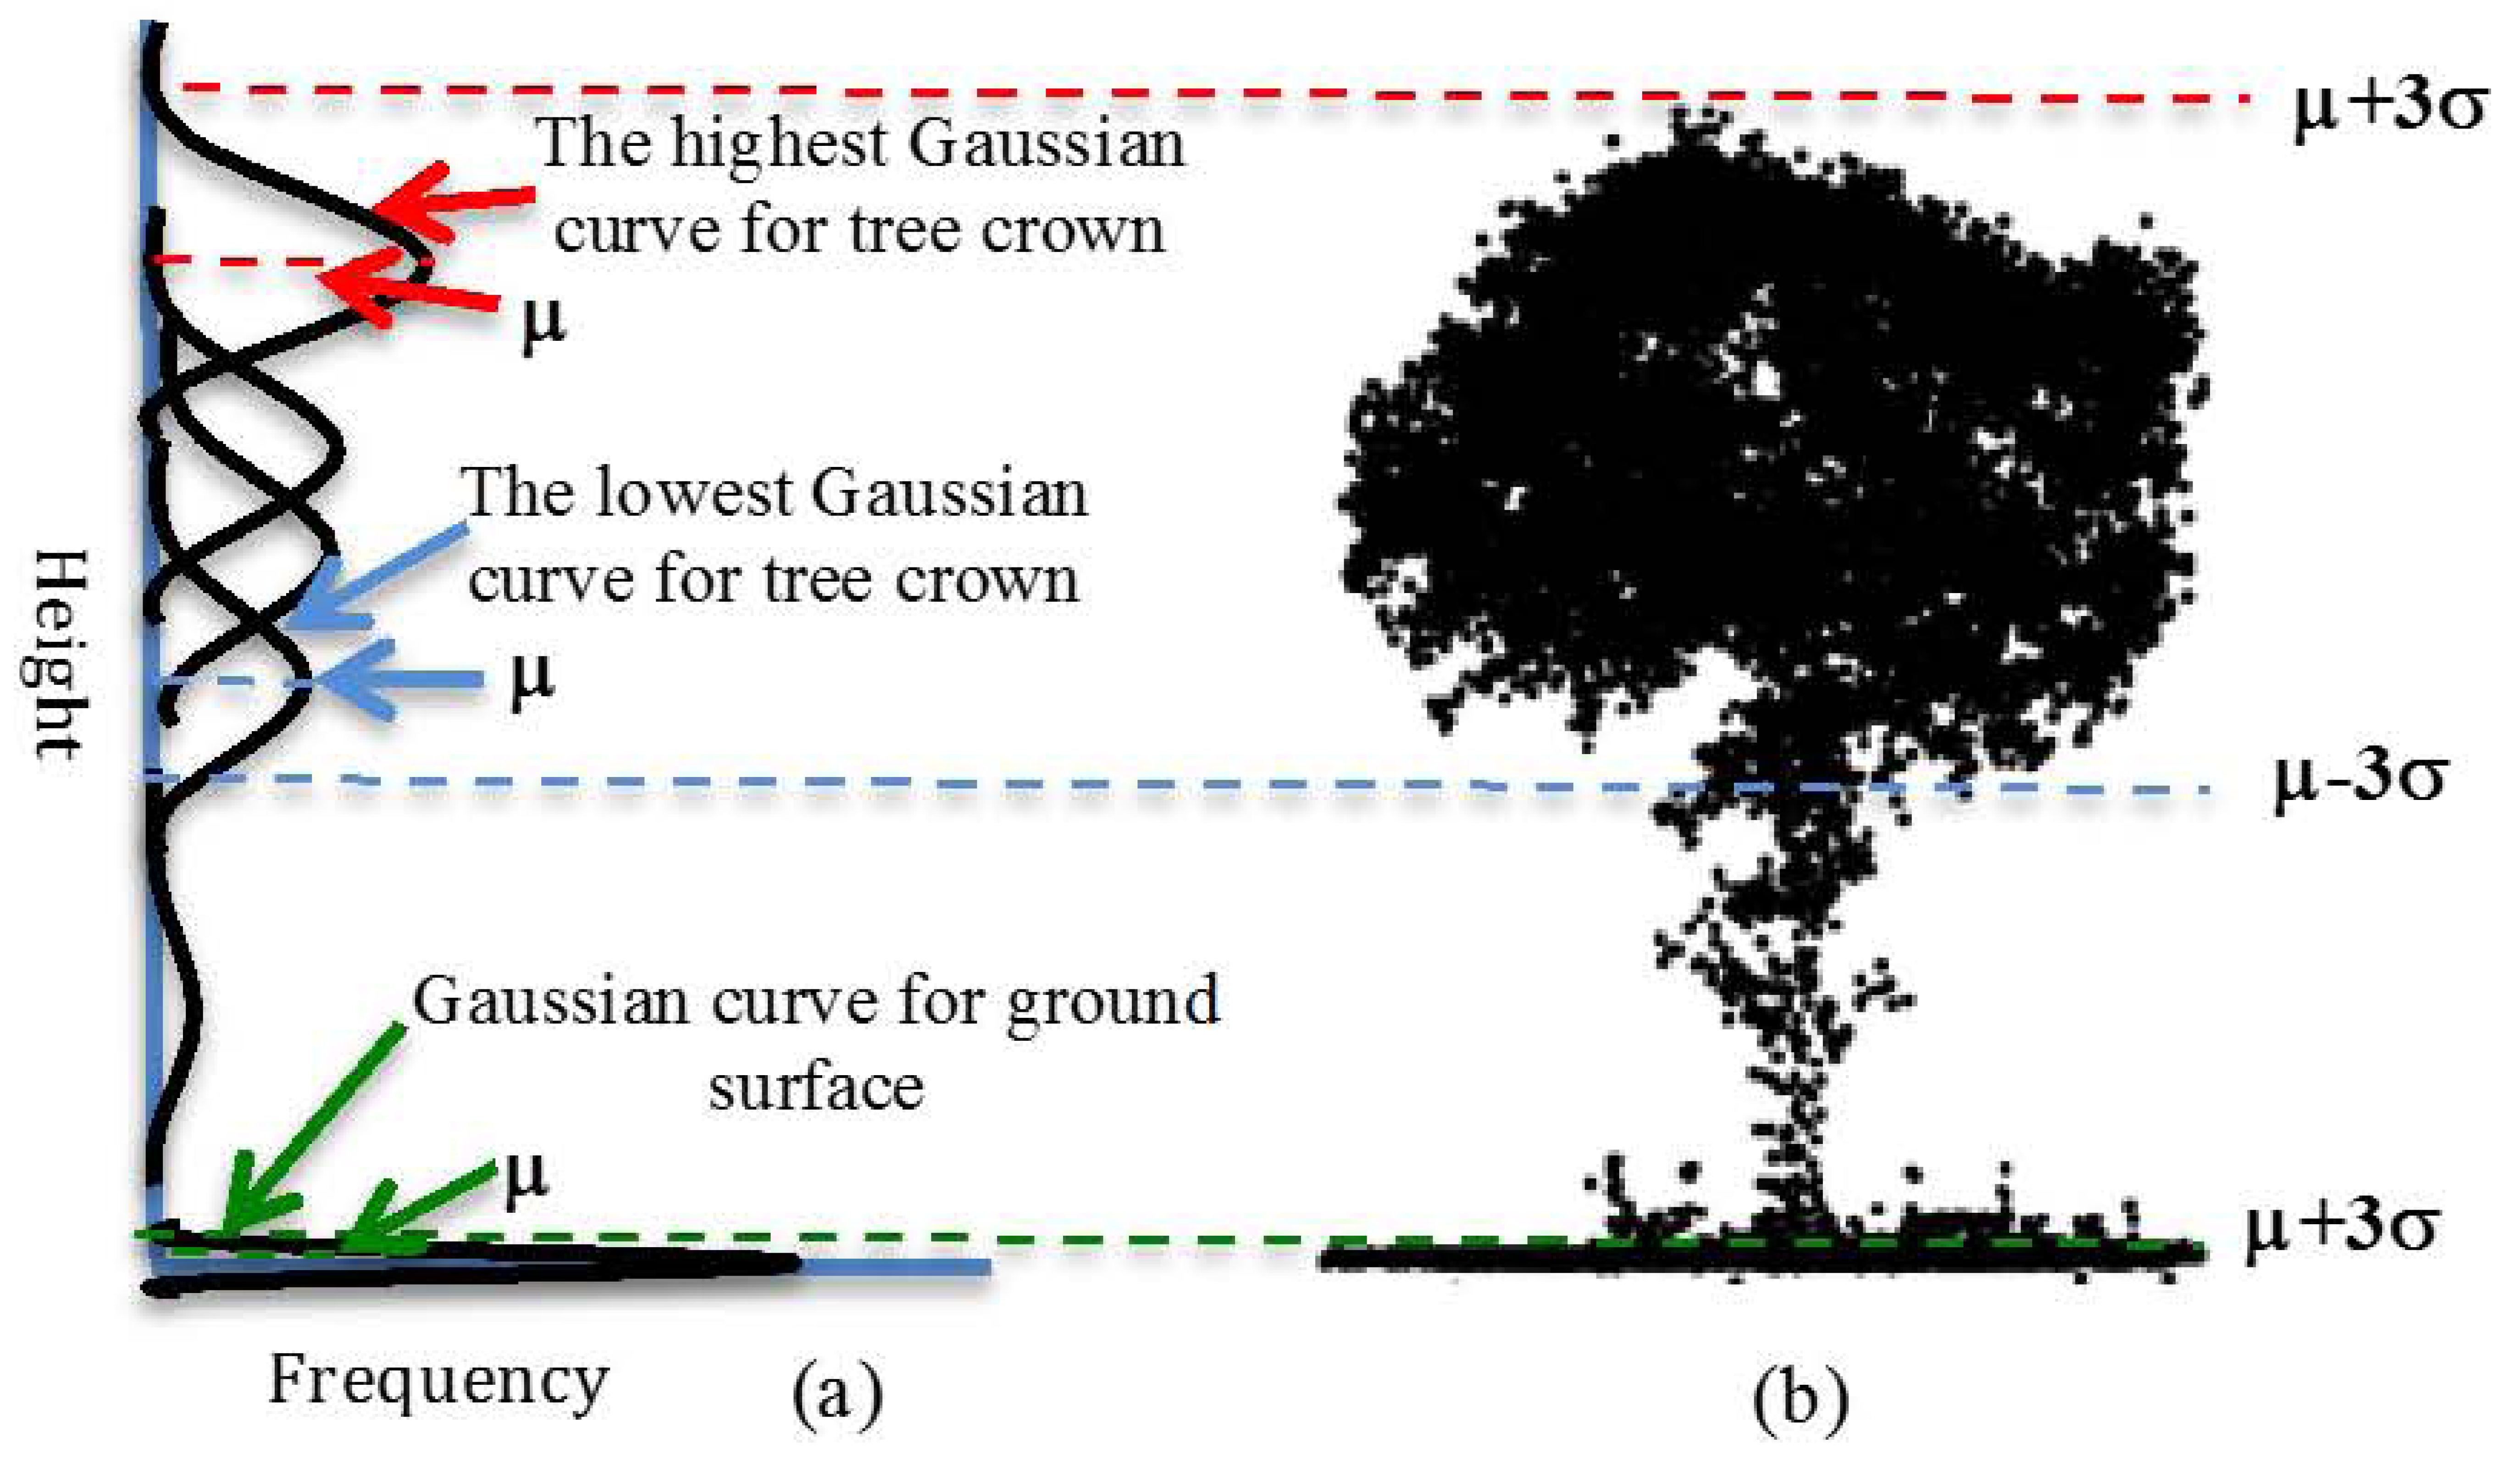
24]. The method employs a Gaussian model fitted to the histogram of elevation that marks the height boundary of tree height and crown base height. Figure 6 shows an example of a histogram constructed based on point clouds obtained for a single tree. The histogram was fitted with multiple Gaussian functions, in which the crown base height is marked by two Gaussian curves of the tree crown and ground surface. The initial boundary for crown base height was determined by subtracting three standard deviations from the mean value of the lowest Gaussian function from the tree crown. The end point that marked the ground surface was determined by adding three standard deviations to the mean value of the Gaussian function of the ground surface. Finally, the crown base height was calculated by subtracting the value of the end boundary from the start boundary. Tree height was calculated based on the highest Gaussian function of the tree crown. The height was determined by adding three standard deviations to the mean value of the Gaussian function.
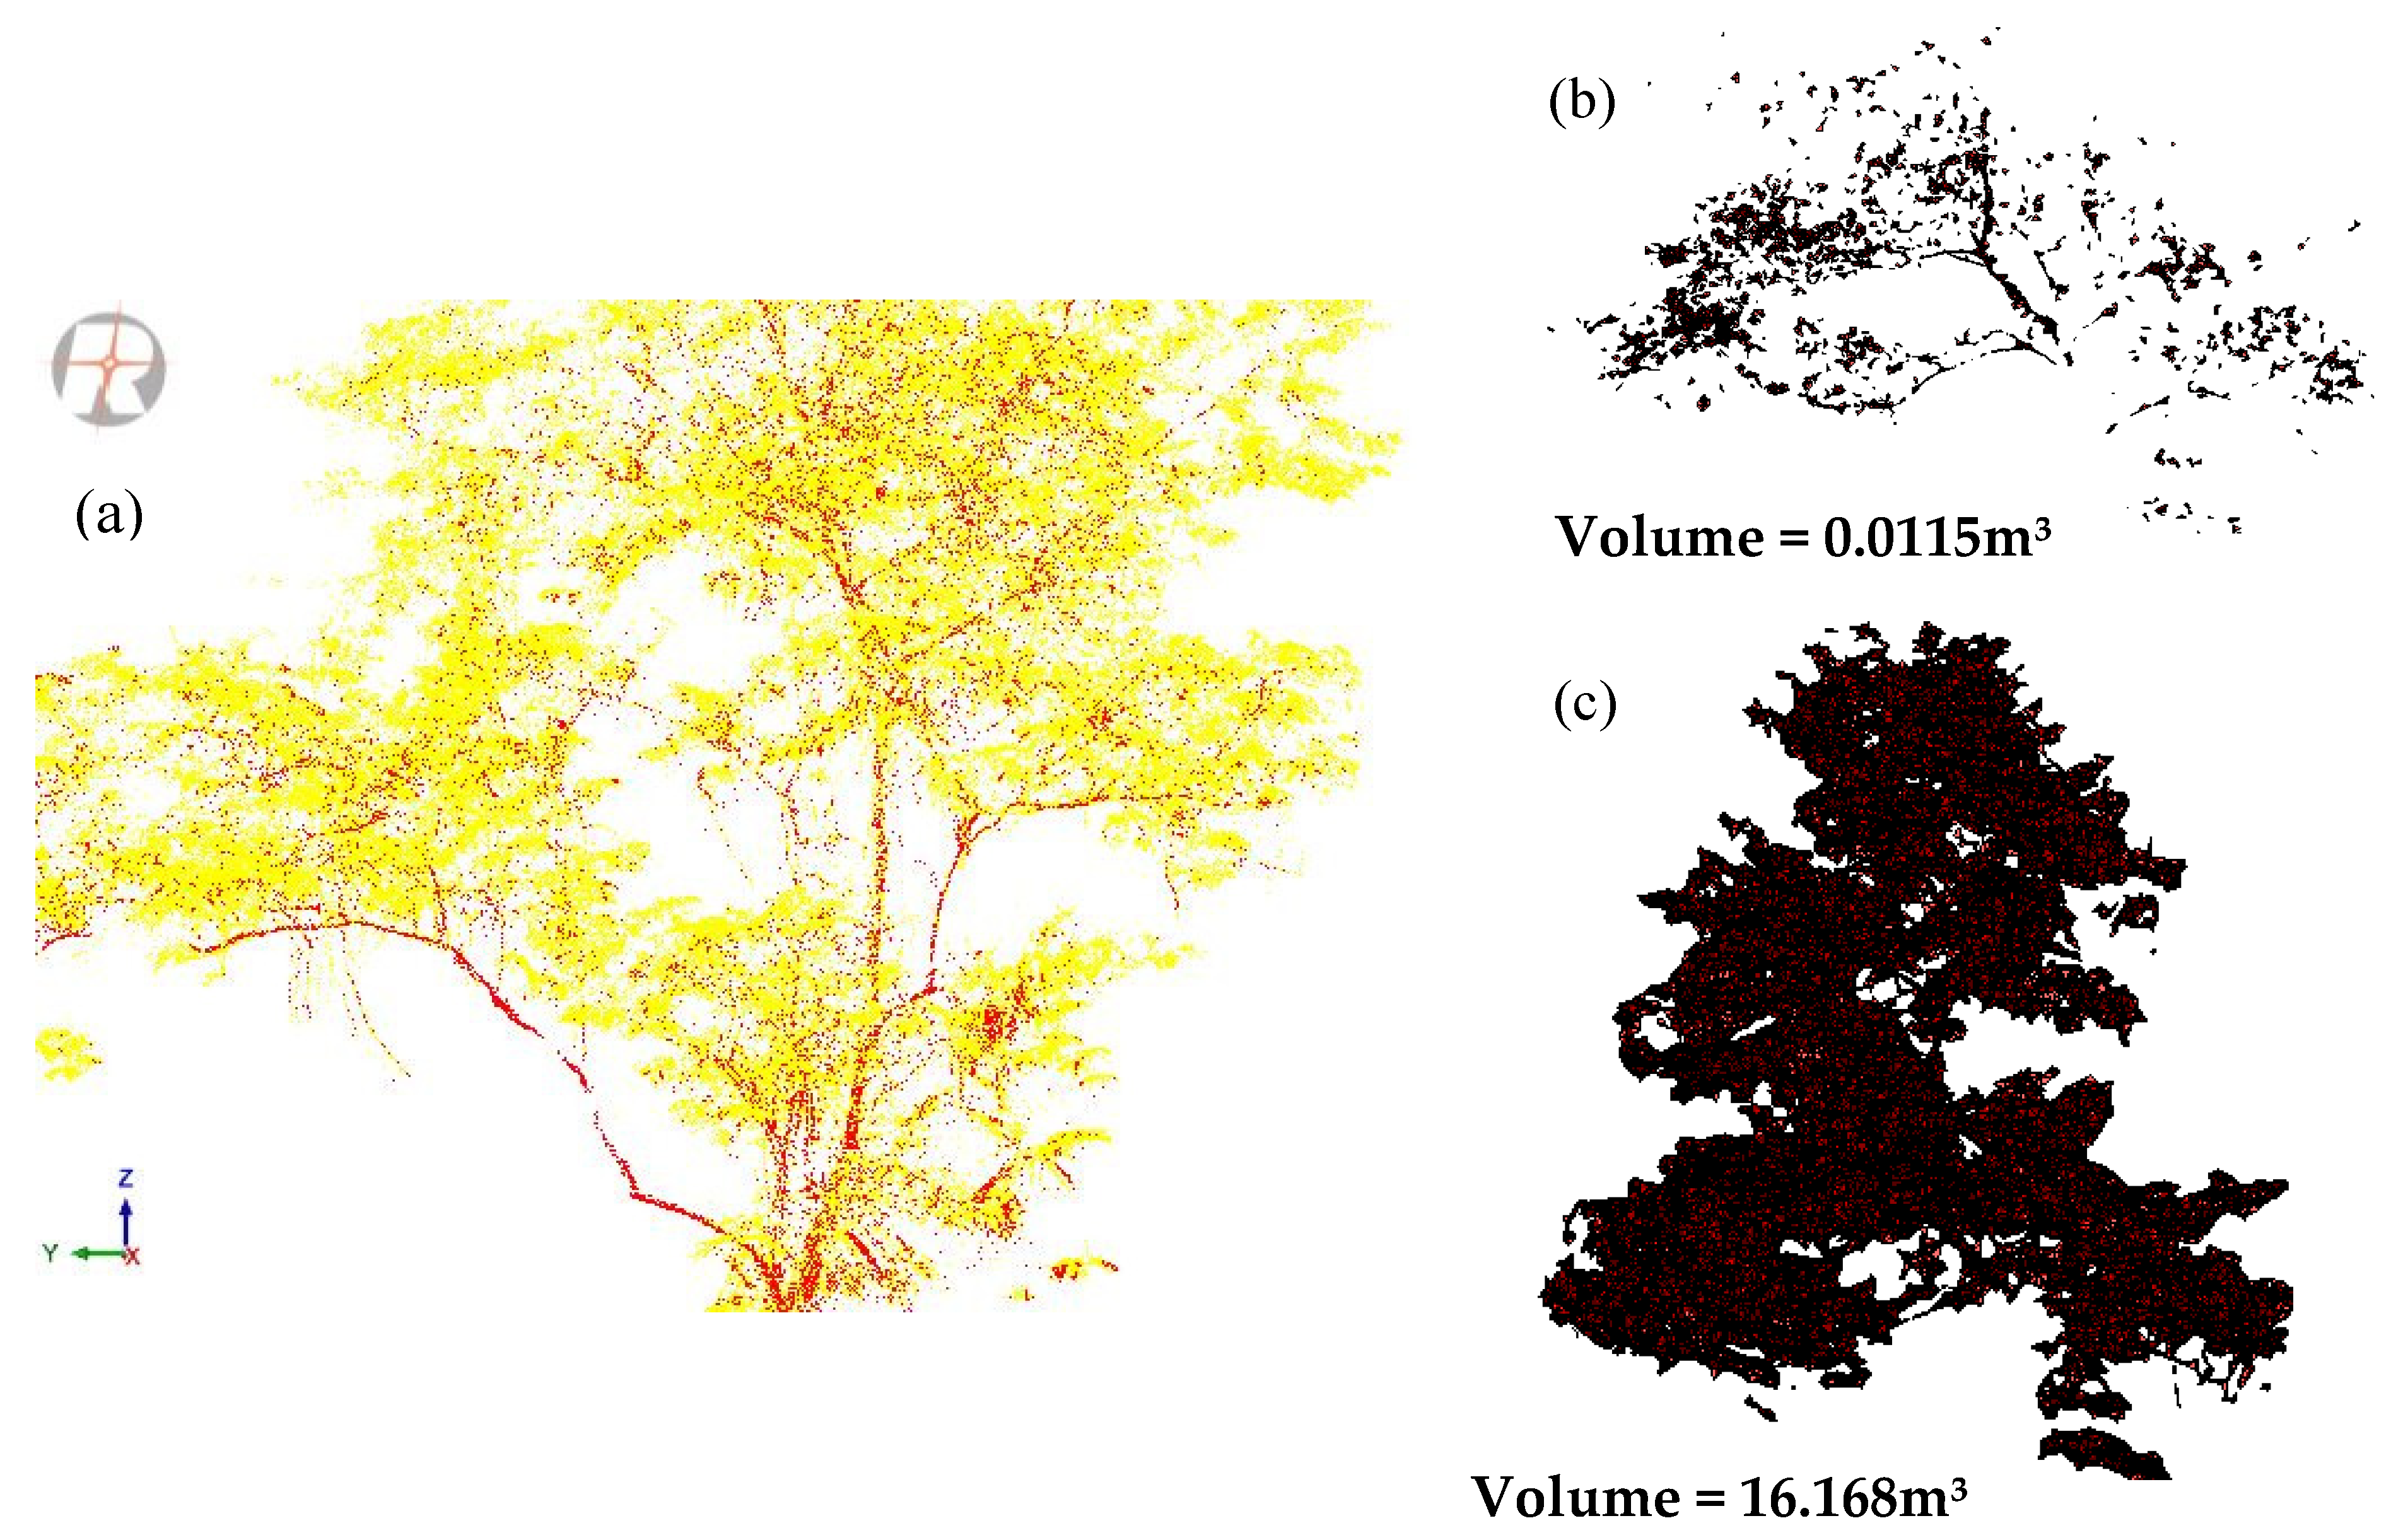
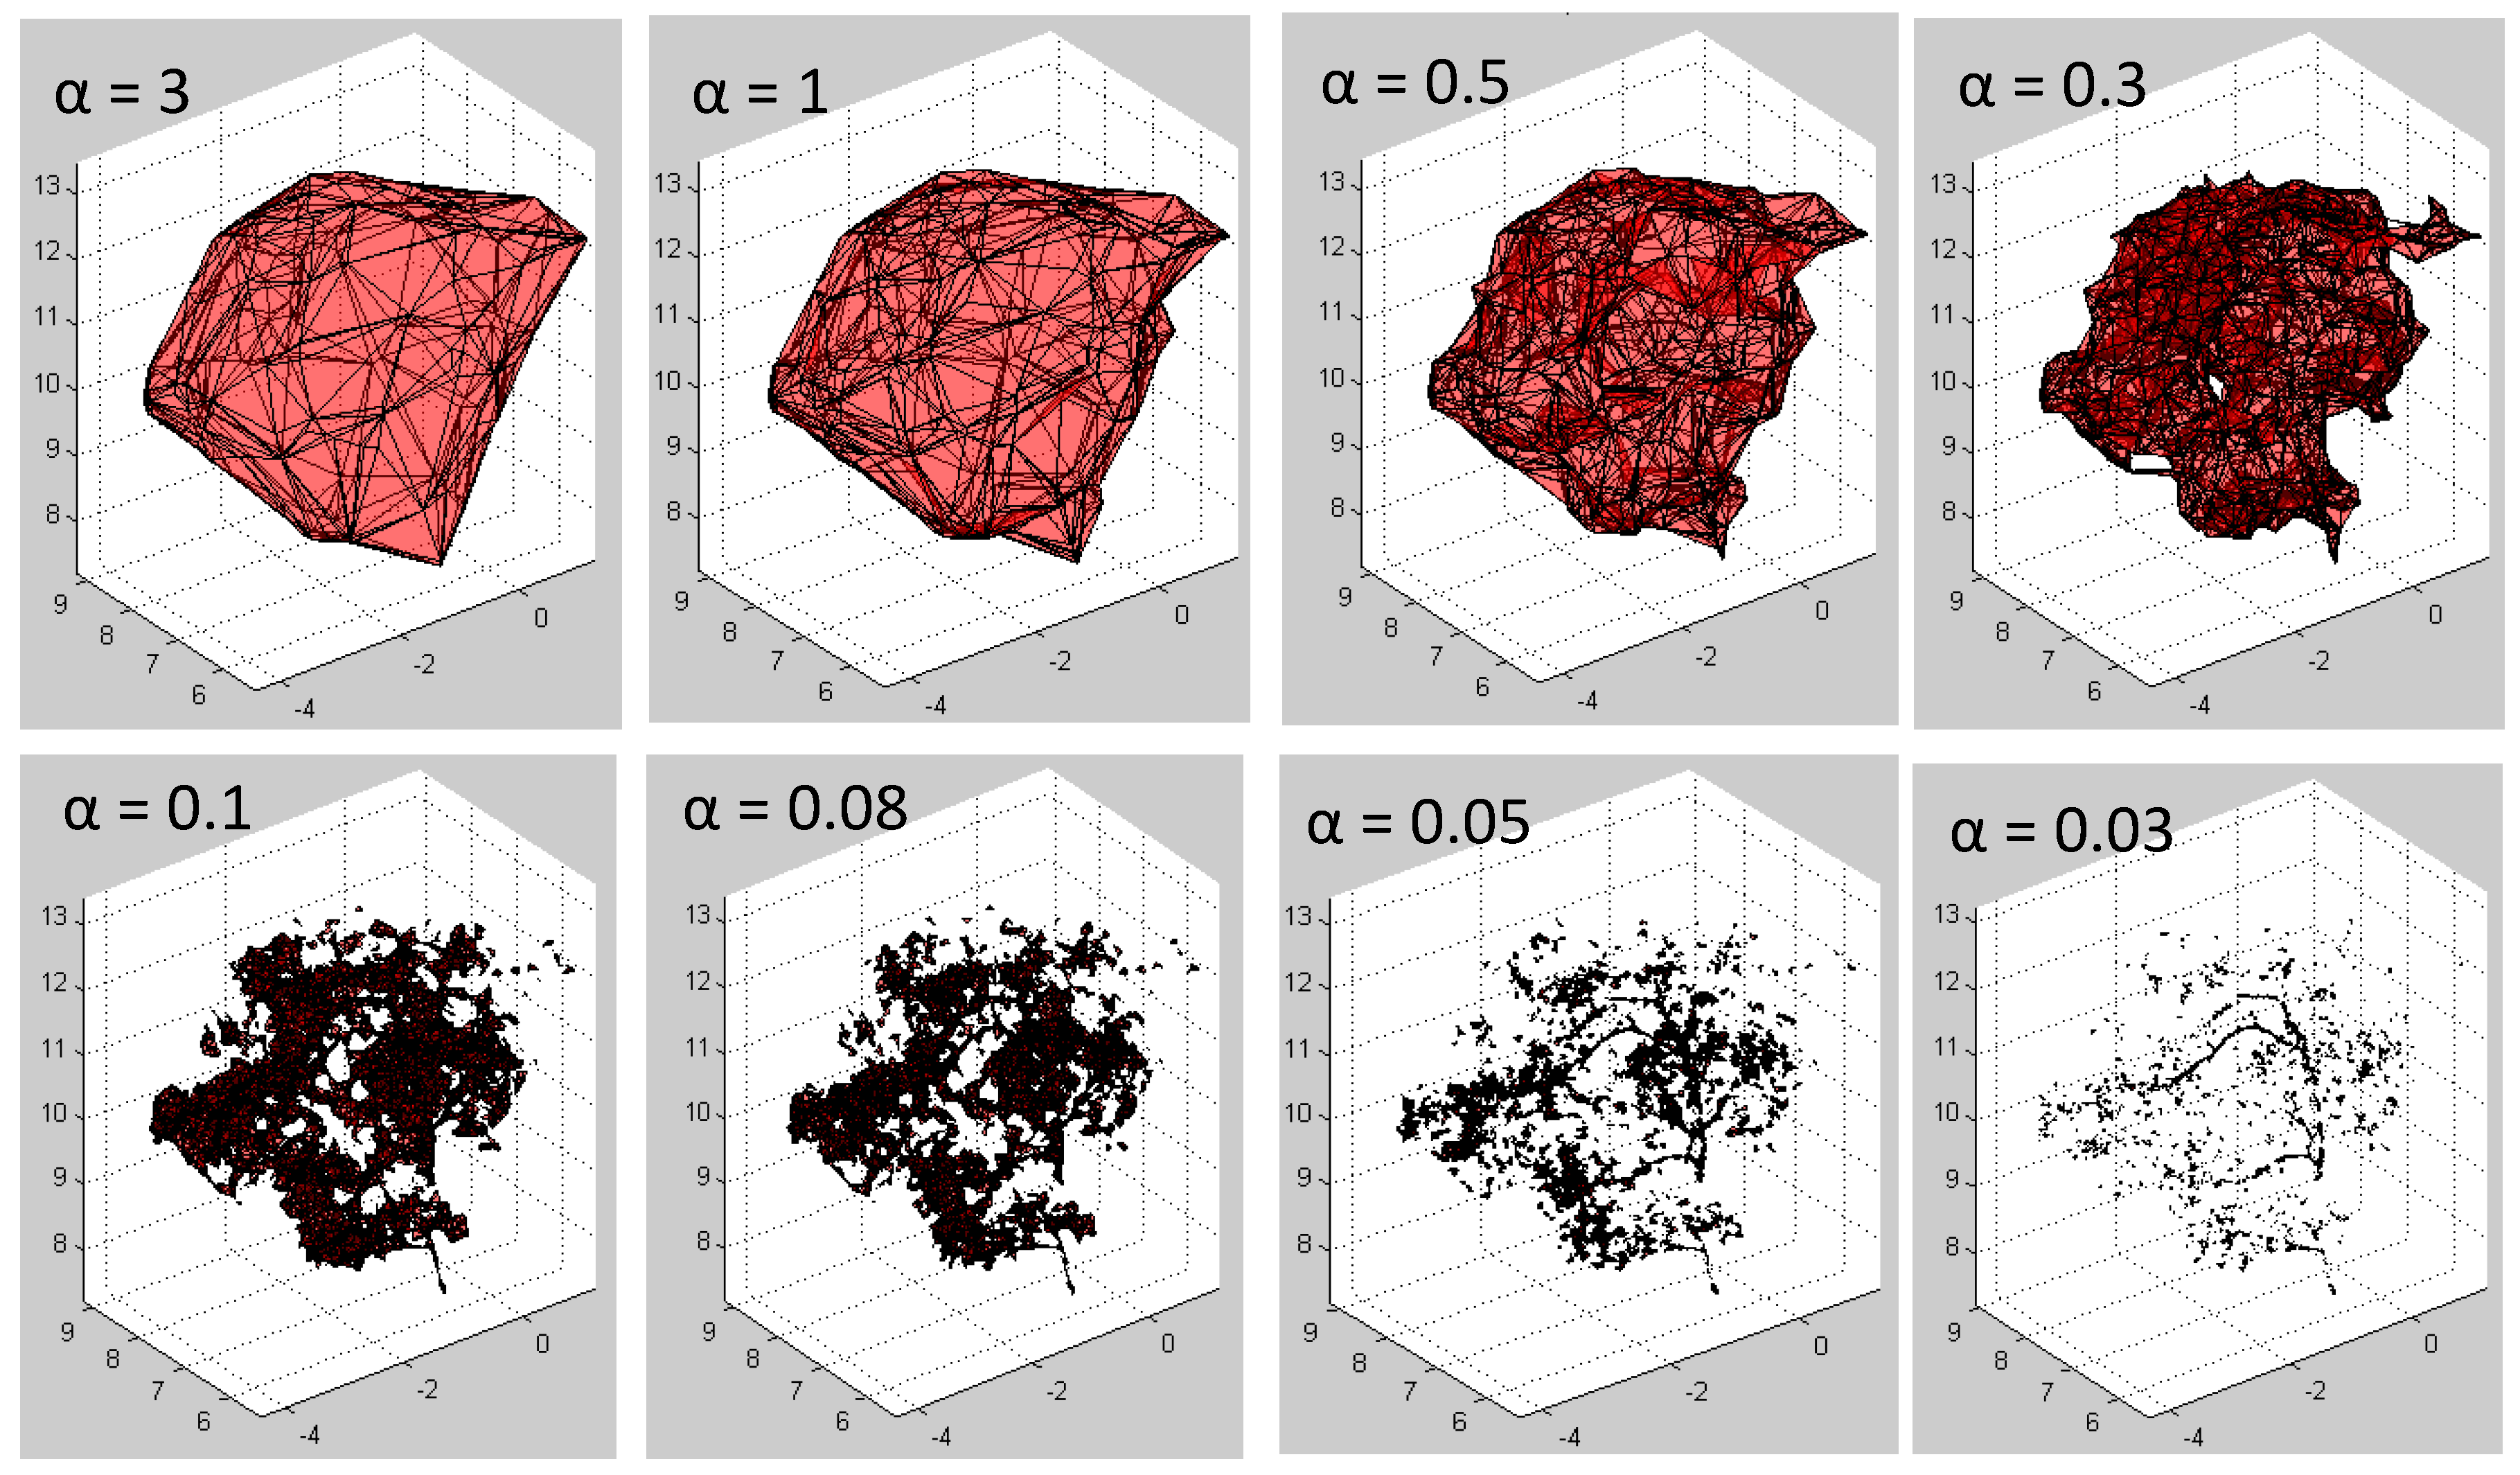
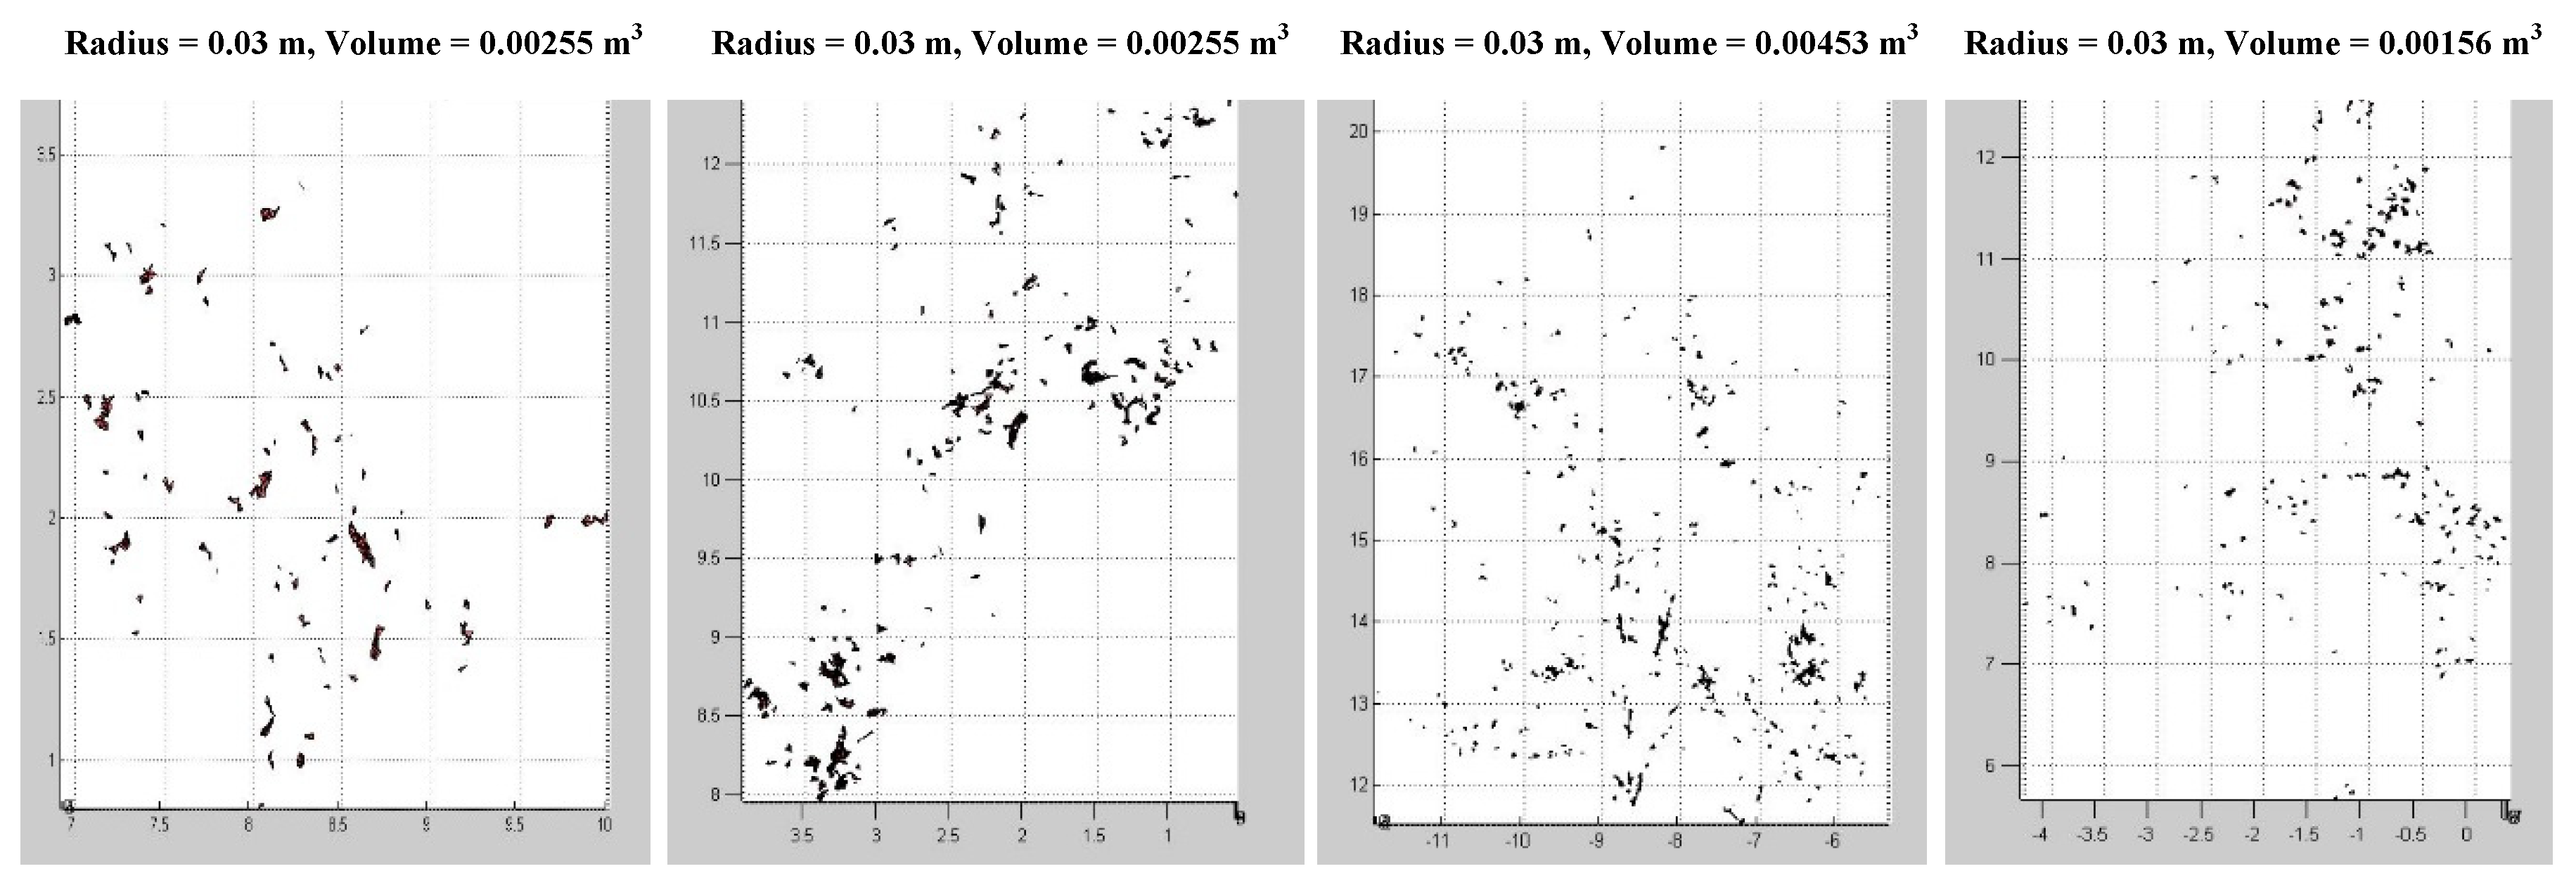
Branch and leaf volumes were estimated using a convex hull algorithm, which constructs the three-dimensional boundary of a closed convex surface based on Delaunay Triangulations of the outer points. The convex hull algorithm was applied to points belonging to branches and leaves. The tree branches and leaf volumes were estimated from the volume of the closed triangulated surface.

2.4. Individual Tree Biomass Estimation Using a Reconstructed Tree Model

Estimation of above ground biomass for individual trees is divided into tree stem, branches and leaves. The total volume for tree stem was estimated based on the volume of the tree stem estimated as the total volume of fitted cylindrical models over point clouds of TLS data (Equation (1)). The above ground biomass for tree stem ( B S ) was then estimated by multiplying the total volume with the wood density ( D W ) [24] of a specific tree species. Biomasses of tree branches ( B B ) and leaves ( B L ) were estimated by multiplying the total branch volume ( V B ) with wood density ( D W ) and ( V L ) leaf density ( D L ) [21,22,23] of a specific tree species (Equations (2) and (3)). The total above ground biomass ( T A G B ) of a single tree is defined as in Equation (4).
B S = ( i   =   1 n π r i 2 h i ) D W
B B   =   V B   ×   D W
B L   =   V L   ×   D L
T A G B   =   B S   +   B B   +   B L
Secondary level allometric equations were generated based on the regression analyses between estimated biomass values and tree biometric parameters obtained from TLS data. Wood density was chosen based on different tree species (see Table 1), while leaf density was taken as the mean value of 0.41 g·cm−3 [25,26]. The biomass of these individual components was assessed with values calculated using allometric equations developed by [27]. These allometric equations (Equations (5) to (8)) were developed based on data collected in the Pasoh reserve forest in Malaysia.

2.5. Individual Tree Biomass Estimation Using Field-Collected Tree Attributes

Biomass estimation from field-collected tree attributes is required to validate the estimation using TLS data. Activities in and disturbances to the ecosystem are not allowed in Royal Belum State Park, which limits this study to develop primary allometric equations, which require destructive methods. Therefore, existing allometric equations [27] were used to validate the estimation of the weight of stems, branches, leaves, and TAGB from TLS data. Equations (5) to (9) show the allometric equation introduced by [27], and the input parameters were obtained from the field measurements.
W s   =   0.0313 ( ( d b h 2 ) h ) 0.9733
W b   =   0.136 ( W s ) 1.07
1 W l   =   1 0.124 W s 0.794   +   1 125
T A G B   =   W s   +   W b   +   W l
where Ws is the weight of the stem (kg), Wb is the weight of branches (kg), Wl is the weight of leaves (kg), dbh is the diameter at breast height (cm), h is the tree height (m) and 
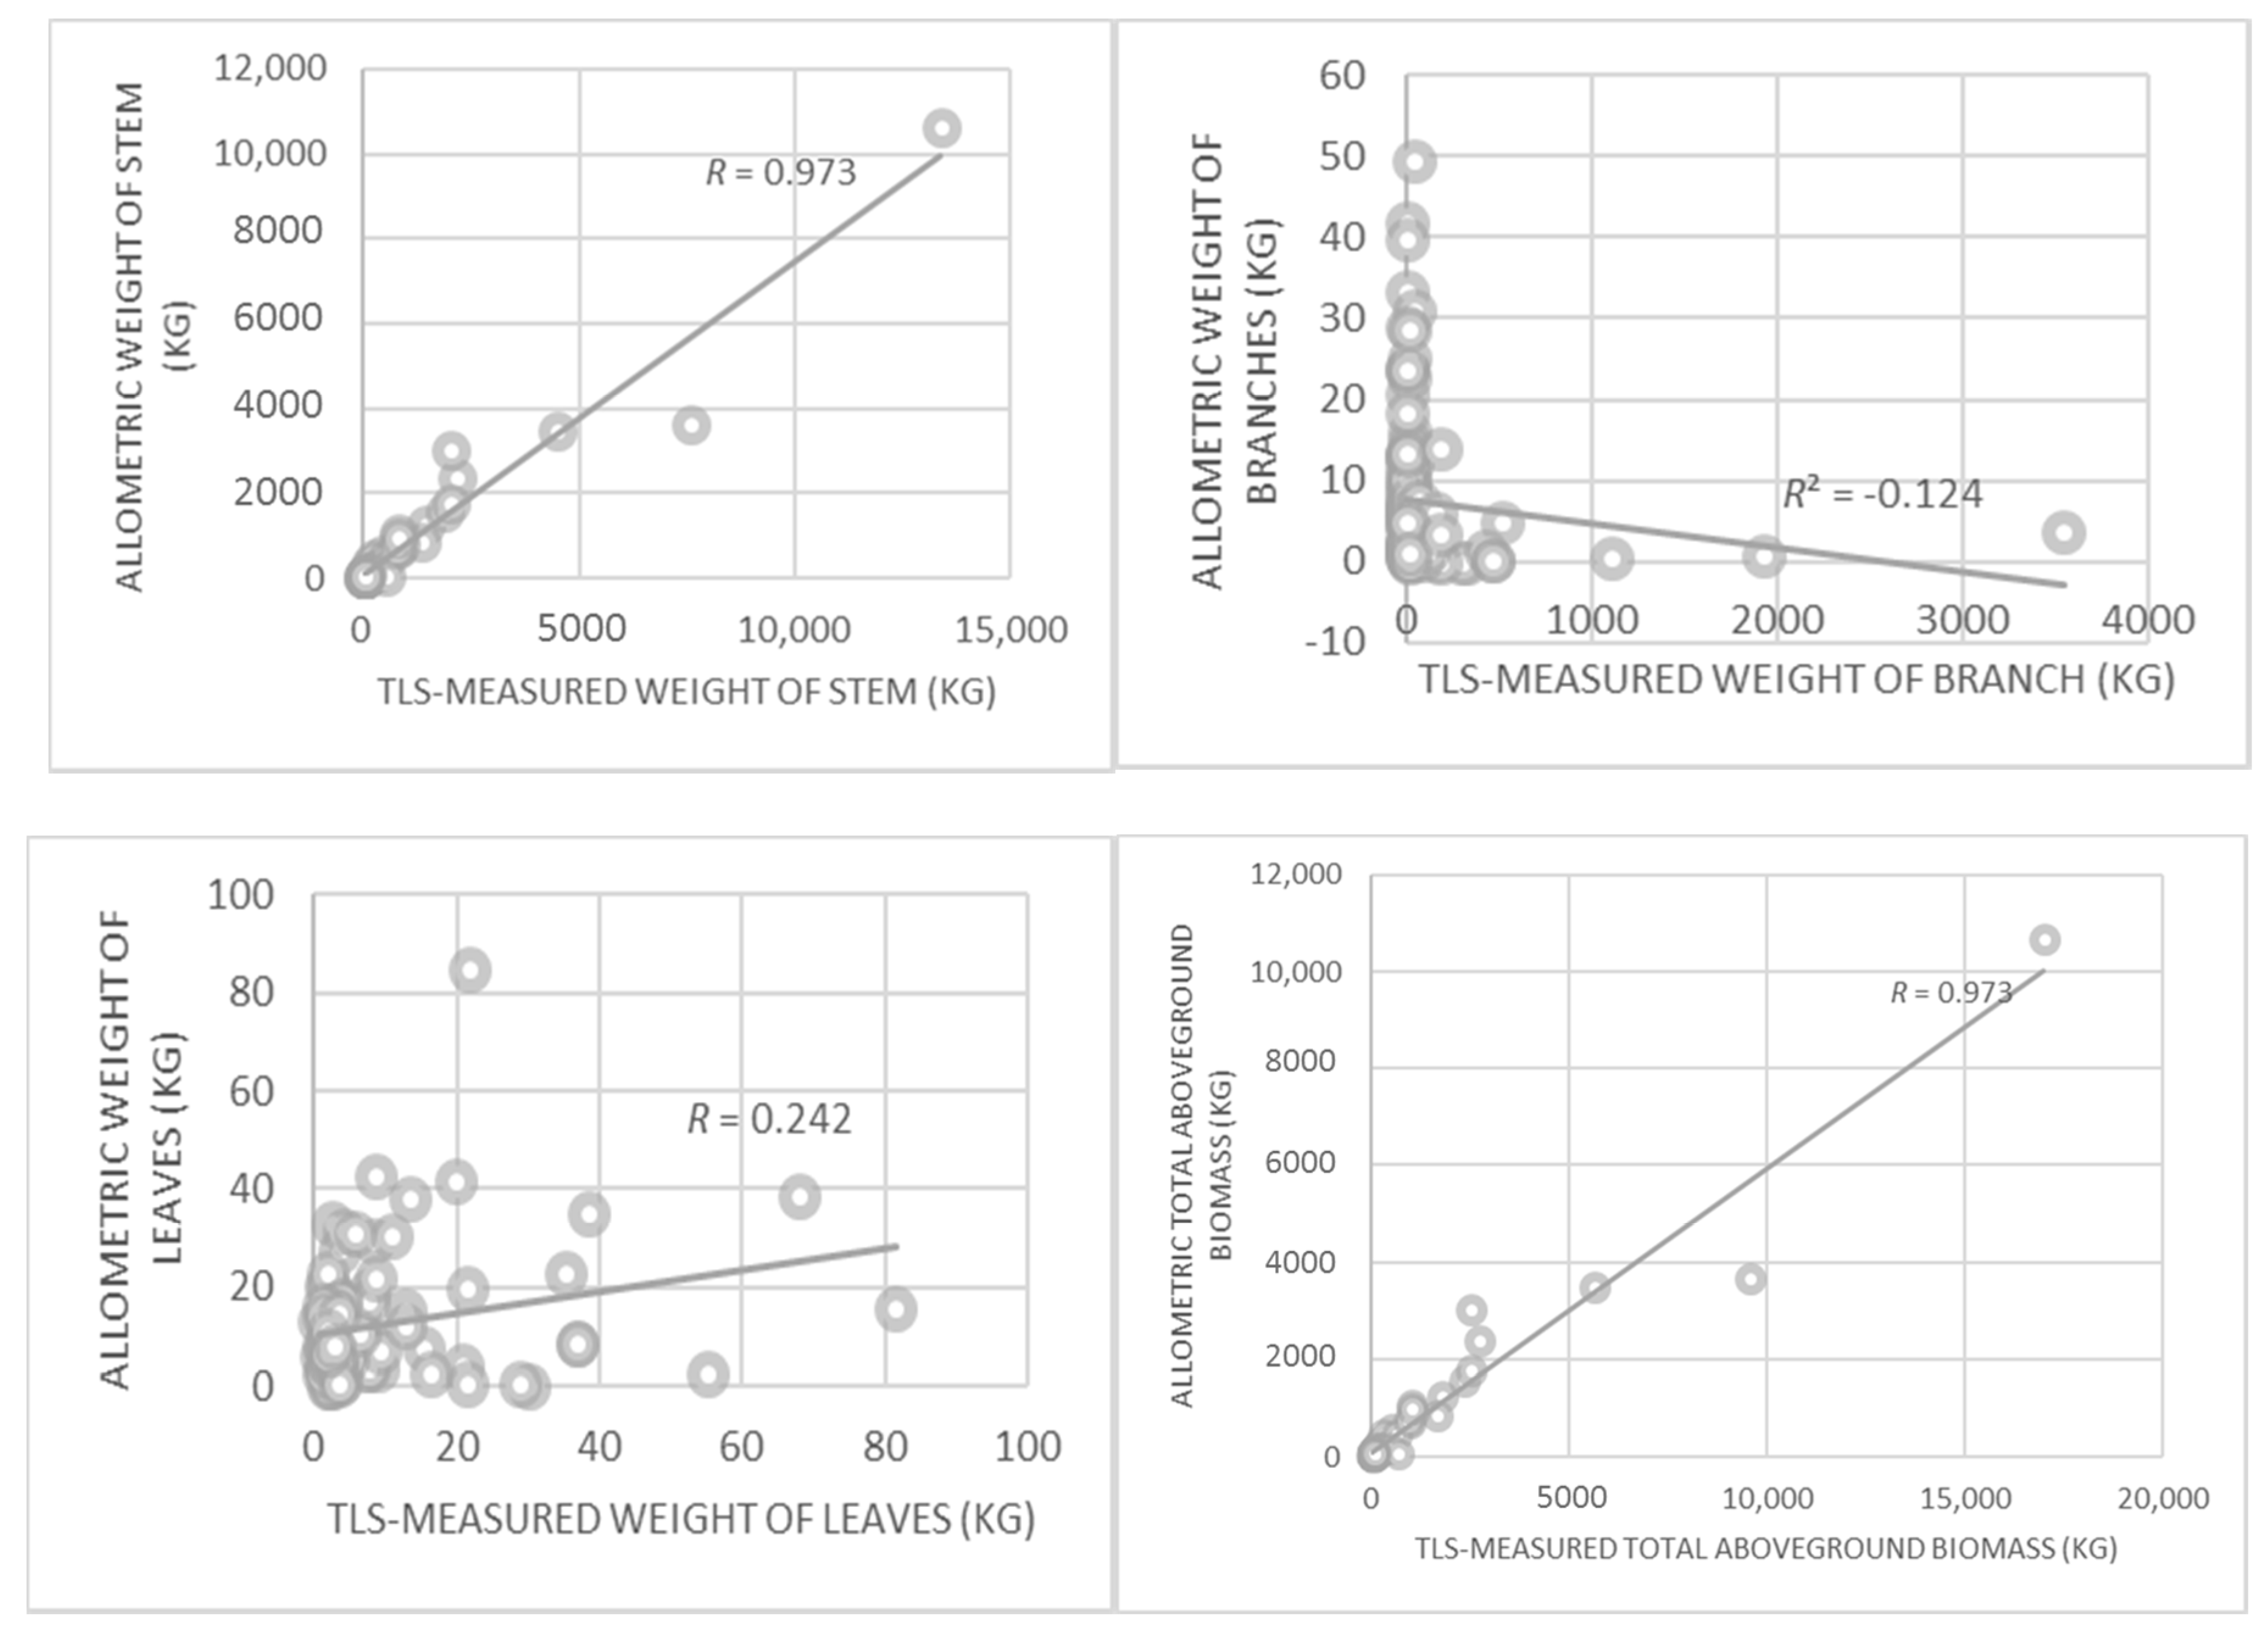
TAGB is the total above-ground biomass (kg). The allometric equations were developed based on tree information collected in the Pasoh reserve forest in Malaysia. In the study, the ABG was calculated based on a destructive method over 2 different samplings conducted in February-March 1971 and March-April 1973, with 73 and 83 trees, respectively. The differences between the estimated and the harvested dry weight of stems, branches, and leaves without lianas were 3266 kg, 1736 kg, and 71 kg, respectively. With lianas, the differences between the harvested and estimated dry weight of stems with branches and leaves without lianas were 6289 kg and 26 kg, respectively. The allometric equations allow AGB estimations for different tree parts, i.e., stem, branch and leaf.

3. Results and Discussion

3.1. Validation of the Estimated Tree Parameters from Point Clouds

Validation of the estimated tree parameters from point clouds using tree parameters measured in the field is summarized in Table 2. The root mean square errors (RMSEs) for the estimated DBH, tree height and CBH were 0.062 cm, 7.104 m, and 4.310 m, respectively. The tree height and CBH estimation methods tended to overestimate the field-collected height by 3.065 m and 1.050 m, respectively. Field tree height and CBH were only measured on selected trees. However, uncertainties occurred in both measurements because some trees were too tall, with multilayered tree canopies and very sparse tree crowns.
The underestimation of DBH measurement was caused by the cylinder fitting in which cylinders were mostly fitted to the inner side of the point clouds. Another problem is that occluded tree stems or uneven distributions of point clouds within the area of the tree trunk for DBH measurements produced caused improper fitting of the cylinder, which resulted in errors in DBH estimation. This problem was reduced by calculating the average trunk diameter from the surrounding cylinders. The mean absolute error (MAE) value was close to RMSE, which reflects less extreme residual values that affect the error assessment. The results suggest that TLS is potential technology that is useful for DBH estimation in tropical forests.

3.2. Individual Tree Biomass Estimation Using Point Clouds

The results of cylinder fitting applied to the point clouds of the stem truncated at specified intervals are shown in Figure 7. The stem volume was calculated as the total volume of the cylinders, and its weight was obtained by multiplying volume and wood density. The delineated branches and leaves are shown in Figure 8a, represented by varying colours. Optimal alpha shapes were applied to the classified point clouds to determine the branch and leaf volume. Selection of the optimal radius for alpha shapes was based on visual inspection and standardized radius. Optimal radii of 0.3 and 0.03 were used in this study for estimation of branch and leaf volume, respectively (Figure 9).
The weight of branches estimated from point clouds saturated at low biomass, with a maximum value of 49.45 kg, while the allometric weight of branches showed maximum value of more than 3000 kg. Derivation of weight of branches from allometric equations uses the weight of the stem as an input to calculate branch weight. Therefore, allometric weights of branches closely followed the stem weight trend. However, branch weight calculated from point clouds depends on the volume estimated from the point clouds, and the point clouds of branches are highly susceptible to occlusion effects. Besides, taller trees will have a lower branch point density compared to shorter trees. Thus, this cannot resemble the real size of the branches, leading to high underestimation of branch biomass (Table 3). These problems are clearly shown by the low correlation values between TLS-measured weight values and the weight values obtained from allometric equations for both branch and leaf.
The results show a good correlation (0.973) between stem weight obtained from point clouds and the allometric equation (Table 3 and Figure 10). Large deviations between RMSE and MAE values suggest that the residuals for both measurements contain high numbers of extreme values. The same results are shown by the estimated weight of branches and total aboveground biomass. In this case, MAE serves as a better indicator of accuracy compared to RMSE. It was observed that high MAE values of stem weight resulted mainly from large trees.
Low correlation was observed between the TLS-derived weight of branches and leaves and allometric-derived values. However, the results still show a high correlation with total aboveground biomass. This indicates that crown biomass does not contribute as much as stem biomass to total aboveground biomass. Tree-crown point clouds need to be improved, which still requires further investigation with respect to suitable scanning configurations, TLS and methods of crown biomass estimation using TLS. The optimal alpha radius value is also a contributing factor in determining the accuracy of branch and leaf biomass, as different alpha radii give different volume estimations. A fixed value of the alpha radius produces varying point cloud density distributions within plots that depends on the distance between the object and the scanner. This leads to an overestimation of volume for point clouds close to the scanner and underestimation for point clouds located farther from the scanner (tall trees).

3.3. TLS-Derived Allometric Equations for Biomass Estimation

Table 4 summarizes allometric equations for individual tree biomass generated for all 16 species. The individual tree aboveground, stem, branch and leaf biomasses obtained using allometric equations were used together with tree properties estimated using TLS to generate new allometric equations for biomass estimation. The results show that TLS-derived DBH and stem volumes, in most of the cases, resulted in better correlation coefficients with the stem, branch, leaf and total aboveground biomasses. Stem volume had a better relationship compared to DBH for stem and branch weight estimation. However, the relationship for stem volume was slightly lower than that for the DBH with respect to the leaf weight estimation.
The estimated tree height and crown base height from the point clouds showed acceptable relationships with the weight from different tree compartments and total aboveground biomass. Tree height and crown base height can be estimated directly from airborne LiDAR data, which provides a direct estimation of the total aboveground biomass. Regression models between branch volume and branch weight or leaf volume and leaf weight showed poor correlations, which indicates that the tree crown point clouds obtained from the TLS could not be used for tree crown biomass estimation. Therefore, supplementary information, i.e., diameter at breast height and stem volume, can provide more accurate estimations of branch and leaf biomass. The weight of the crown is a combination of the weight of branches and leaves, and regression models have strong relationships with DBH, stem volume and tree height.

3.4. Individual Tree Biomass Estimation Using Point Clouds for Each Tree Species

By comparing the results of the biomass assessed using the generalized equation (Table 3) and biomass assessed by species-specific equations (Table 5), significant changes in accuracy were observed for the majority of the species. Stem weight estimated from a combination of all tree species had RMSE and MAE values higher than 500 kg, which are close to the average total aboveground biomass of a single tree in Royal Belum. Separate measurements of tree species show reductions in the weight of stem RMSE and MAE for the majority of the species except for Kempas and trees classified as others. This is due to several large trees that may have errors in DBH measurements in the field caused by difficulties in measuring diameter above buttresses or swelling on the lower portion of tree stem as required according to the standard procedure of forest mensuration. The uneven surface of buttresses cannot be properly fitted by cylinders, as most cylinders will significantly underestimate the volume measurements. This causes large gaps between RMSE and MAE values; thus, MAE is a better indicator of accuracy for Kempas and ‘Other’ species.
Bias in stem weight estimation for Akasia, Resak and Medang shows that TLS-based stem biomass estimation leads to overestimation, compared with underestimation for other species compared with allometric-based values. The overestimation and underestimation of TLS-based stem biomass might be due to the uneven shape of tree stems, which causes difficulties in fitting the conventional cylinder shape to the point clouds. This would be reduced by increasing the point density of laser scanning, which allows the real shape of the tree stem to be captured by the point clouds. In this case, the fitting process can be done based on the outer part of flattened point clouds at certain stem levels. Finally, the volume of the stem at certain height intervals can be calculated by multiplying the flattened area and the height interval. The TLS-based weight of branch estimation tends to underestimate the allometric-based value, especially for species with large and tall trees due to lower point density of branches (Figure 11). The TLS-based weight of leaves in most of the cases tends to overestimate the values compared with the allometric-based values. With reference to the percentage RMSE relative to the mean values, the TLS-based weights of branches and leaves were severely affected by low point density. Therefore, for branch and leaf biomass estimation, we suggest integrating TLS with airborne LiDAR data, mainly to increase point clouds in the upper parts of forests.
Furthermore, large errors in the leaf and branch biomass estimation can also be due to the separation process of branches and leaves based on the near infrared intensity value, which shoud be based on the standard value obtained using field spectral measurements of leaves and branch samples. In addition, the TLS-based weight approach for branches and leaves can be validated using control experiments of leaf and branch residuals of the same tree species in another area. In the experiment, the residuals should be scanned by the TLS, and the estimated biomass value should be compared with the measured value. TLS-based total aboveground biomass (TAGB) estimation showed overestimation for most of the species except for species with large trees, in which highest RMSE value and significant underestimation were observed. Table A1, Table A2, Table A3, Table A4, Table A5, Table A6, Table A7 and Table A8 show the TLS-derived allometric equations for stem, branch, and leaf weight, TAGB and crown biomass for each tree species.

4. Conclusions

Terrestrial laser scanner (TLS) allows high-density point clouds to be collected for different types of objects including trees. The scanning process in a dense natural forest area is very challenging due to dense understorey vegetation, uneven tree distribution and growth, which causes occlusion of TLS observations and uneven densities of point clouds for each tree. Moreover, an intensive cleaning process should be done for points reflected by vegetation that grows near observed trees. The point clouds of branches and leaves are consistently affected by this occlusion effect, which significantly decreases the point density obtained. In this study, we used multi-station scanning techniques at a specified distance from the scanning centre, which allows better distribution of point clouds over trees in a plot. The combination of a simple, single-tree stem reconstruction and wood density can be used to estimate stem biomass comparable to the results that are usually obtained through existing allometric equations. However, serious errors were discovered for branch and leaf biomass estimations, mainly due to limited numbers of point clouds in the upper part of the forest. The results show that the serious error in leaf and branch biomass disappeared after combination with stem biomass. We have highlighted several limitations and issues related to branch and leaf biomass estimation, which requires further improvements in data acquisition and the processing step as recommended in this study.
It has been shown that better estimation of stem biomass requires detailed TLS observations and models for volume calculation. The TLS-based biomass estimation method introduced in this study can be used for the generation of general allometric equations and species-specific allometric equations. However, to strengthen the quality of the allometric equations, they should be calibrated and validated by means of destructive biomass methods in another area. Stem weight estimated from a combination of all tree species had RMSE and MAE values higher than 500 kg, which are close to the average total aboveground biomass of a single tree in Royal Belum. DBH, stem volume and tree height consistently produced good biomass estimation results for all tree species. This study also suggests that the laser-based biomass estimation method produced better results when the estimation process was done separately for each tree species. However, the findings also suggest that the upscaling process of biomass using airborne LiDAR data might have to take into account information about tree species.

Acknowledgments

We would like to thank the reviewers for their comments that helped to improve the quality of the manuscript. The study is fully supported by several research grants (grant number: R.J130000.7827.4F310, Q.J130000.2427.02G20 and FRGS/1/2015/WAB07/UiTM/02/1) awarded by the Ministry of Higher Education of Malaysia.

Author Contributions

M.Z.A.R. performed literature research, developed tools to process TLS data and organized discussion. M.A.A.B. processed the entire TLS data, assisted in results compiling and developed the figures. K.A.R. organized field data collection with different agencies. A.W.R. selected suitable plots for forest inventory process and collected field data., K.D.K. organized the entire structure of the manuscript and proofread. W.H.W.K. processed the field data. H.O., A.F. and A.R.K. provided information on the tree species and designed the forest plot survey. Z.A.L. collected field data.

Conflicts of Interest

The authors declare no conflict of interest.

Appendix A

Table A1. Allometric equation generated for Akasia with tree variables obtained from TLS.
BiomassVariableRegression ModelsR2
Weight of Stem (Ws), kgDiameter at breast height (dbh), cmWs = 0.6417(dbh)2 − 12.374(dbh) + 97.0820.960
Tree Height (th), mWs = 3.6791e0.1998(th)0.356
Crown Base Height (cbh), mWs = 7.2717(cbh) + 20.6240.060
Stem Volume (sv), m3Ws = 489.48(sv) + 10.7270.959
Weight of Branches (Wb), kgDiameter at breast height (dbh), cmWb = 0.1394(dbh)2 − 2.7953(dbh) + 20.5850.967
Tree Height (th), mWb = 3.9972(th) − 39.2760.256
Crown Base Height (cbh), mWb =1.4604(cbh) + 3.27920.055
Stem Volume (sv), m3Wb =102.74(sv) + 0.77630.961
Branches Volume (bv), m3Wb = −3.39ln(bv) − 5.5440.055
Weight of Leaves (Wl), kgDiameter at breast height (dbh), cmWl = 0.0161(dbh)2 − 0.2385(dbh) + 2.93980.920
Tree Height (th), mWl = 0.6151(th) − 4.83450.289
Crown Base Height (cbh), mWl = 0.2617(cbh) + 1.48710.084
Stem Volume (sv), m3Wl = 14.65(sv) + 1.47550.937
Leaves Volume (lv), m3Wl = 0.0019(lv)2 − 0.0669(lv) + 2.93650.795
Total Aboveground Biomass (TAGB), kgDiameter at breast height (dbh), cmTAGB = 0.7972(dbh)2 − 15.407(dbh) + 120.610.961
Tree Height (th), mTAGB = 4.5336e0.1999(th)0.356
Crown Base Height (cbh), mTAGB = 30.665e0.1083(cbh)0.167
Stem Volume (sv), m3TAGB = 606.87(sv) + 12.9790.960
Crown Volume (cv), m3TAGB = 0.0171(cv)2 − 1.1185(cv) + 71.1090.908
Crown Biomass (CB), kgDiameter at breast height (dbh), cmCB = 0.1555(dbh)2 − 3.0338(dbh) + 23.5250.962
Tree Height (th), mCB = 1.7768ln(th) + 8.58120.356
Crown Base Height (cbh), mCB = 5.8073e0.1083(cbh)0.167
Stem Volume (sv), m3CB = 117.39(sv) + 2.25180.960
Crown Volume (cv), m3CB = 0.0033(cv)2 − 0.2183(cv) + 13.5430.911
Table A2. Allometric equation generated for Balik Angin with tree variables obtained from TLS.
BiomassVariableRegression ModelsR2
Weight of Stem (Ws), kgDiameter at breast height (dbh), cmWs = 11.255(dbh) − 89.9180.693
Tree Height (th), mWs = 13.21(th) − 107.190.636
Crown Base Height (cbh), mWs = 13.144(cbh) − 23.1720.464
Stem Volume (sv), m3Ws = 549.25(sv) + 9.5640.840
Weight of Branches (Wb), kgDiameter at breast height (dbh), cmWb = 2.2341(dbh) − 18.6120.692
Tree Height (th), mWb = 0.4813(dbh) − 3.17910.611
Crown Base Height (cbh), mWb = 2.6304(cbh) − 5.48110.470
Stem Volume (sv), m3Wb = 109.68(sv) + 1.08780.848
Branches Volume (bv), m3Wb = 0.028e−0.071(bv)0.131
Weight of Leaves (Wl), kgDiameter at breast height (dbh), cmWl = 0.4187(dbh) − 2.65660.694
Tree Height (th), mWl = 2.6368(th) − 22.2160.642
Crown Base Height (cbh), mWl = 0.4736(cbh) − 0.08740.436
Stem Volume (sv), m3Wl = 19.976(sv) + 1.07830.804
Leaves Volume (lv), m3Wl = 0.8481(lv)0.27640.097
Total Aboveground Biomass (TAGB), kgDiameter at breast height (dbh), cmTAGB = 13.907(dbh) − 111.190.693
Tree Height (th), mTAGB = 16.328(th) − 132.590.636
Crown Base Height (cbh), mTAGB = 16.248(cbh) − 28.7410.464
Stem Volume (sv), m3TAGB = 678.9(sv) + 11.730.841
Crown Volume (cv), m3TAGB = 7.393(cv)0.46990.194
Crown Biomass (CB), kgDiameter at breast height (dbh), cmCB = 0.2611(dbh) + 9.3750.693
Tree Height (th), mCB = 0.2044(th) + 9.50690.638
Crown Base Height (cbh), mCB = 3.104(cbh) − 5.56840.465
Stem Volume (sv), m3CB = 0.0065(sv) − 0.00240.842
Crown Volume (cv), m3CB = 1.4053(cv)0.4690.192
Table A3. Allometric equation generated for Resak with tree variables obtained from TLS.
BiomassVariableRegression ModelsR2
Weight of Stem (Ws), kgDiameter at breast height (dbh), cmWs = 16.094(dbh) − 164.090.900
Tree Height (th), mWs = 18.201(th) − 129.050.751
Crown Base Height (cbh), mWs = −1.8538(cbh) + 125.420.002
Stem Volume (sv), m3Ws = 640.26(sv) + 6.18760.816
Weight of Branches (Wb), kgDiameter at breast height (dbh), cmWb = 3.2656(dbh) − 34.4790.897
Tree Height (th), mWb = 3.694(th) − 27.3770.749
Crown Base Height (cbh), mWb = −0.4088(cbh) + 24.590.003
Stem Volume (sv), m3Wb = 130.17(sv) + 0.03350.816
Branches Volume (bv), m3Wb = 234.44(bv) + 17.4470.073
Weight of Leaves (Wl), kgDiameter at breast height (dbh), cmWl = 0.5499(dbh) − 4.62290.911
Tree Height (th), mWl = 0.6214(th) − 3.41910.759
Crown Base Height (cbh), mWl = −0.0414(cbh) + 5.05120.001
Stem Volume (sv), m3Wl = 21.711(sv) + 1.22160.814
Leaves Volume (lv), m3Wl = 2.8525e0.01(lv)0.073
Total Aboveground Biomass (TAGB), kgDiameter at breast height (dbh), cmTAGB = 11.433e0.1653(dbh)0.652
Tree Height (th), mTAGB = 22.517(th) − 159.840.751
Crown Base Height (cbh), mTAGB = 45.06ln(cbh) + 234.780.010
Stem Volume (sv), m3TAGB = 0.001(sv) + 0.02120.816
Crown Volume (cv), m3TAGB = 60.498e0.0092(cv)0.323
Crown Biomass (CB), kgDiameter at breast height (dbh), cmCB = 5.2179(dbh)0.30290.651
Tree Height (th), mCB = 9.8085(th)0.17750.497
Crown Base Height (cbh), mCB = −0.4502(cbh) + 29.6410.002
Stem Volume (sv), m3CB = 0.0545e0.0337(sv)0.819
Crown Volume (cv), m3CB = 11.44e0.0093(cv)0.323
Table A4. Allometric equation generated for Kelat with tree variables obtained from TLS.
BiomassVariableRegression modelsR2
Weight of Stem (Ws), kgDiameter at breast height (dbh), cmWs = 7.628(dbh) − 11.8850.285
Tree Height (th), mWs = 11.861(th) − 78.1380.648
Crown Base Height (cbh), mWs = 102.94ln(cbh) − 109.190.506
Stem Volume (sv), m3Ws = 614.81(sv) + 19.5050.530
Weight of Branches (Wb), kgDiameter at breast height (dbh), cmWb = 1.5456(dbh) − 3.65290.291
Tree Height (th), mWb = 2.3576(th) − 16.3990.636
Crown Base Height (cbh), mWb = 20.603ln(cbh) − 22.8570.504
Stem Volume (sv), m3Wb = 122.78(sv) + 2.93460.525
Branches Volume (bv), m3Wb = −237.49(lv) + 21.2150.054
Weight of Leaves (Wl), kgDiameter at breast height (dbh), cmWl = 0.2626(dbh) + 0.60730.263
Tree Height (th), mWl = 0.4387(th) − 2.12320.689
Crown Base Height (cbh), mWl = 3.714ln(cbh) − 3.08490.512
Stem Volume (sv), m3Wl = 22.333(sv) + 1.5390.544
Leaves Volume (lv), m3Wl = 1.3139(lv)0.35660.220
Total Aboveground Biomass (TAGB), kgDiameter at breast height (dbh), cmTAGB = 9.4361(dbh) − 14.9310.286
Tree Height (th), mTAGB = 14.658(th) − 96.660.647
Crown Base Height (cbh), mTAGB = 27.337e0.1584(cbh)0.460
Stem Volume (sv), m3TAGB = 0.0529e0.006(sv)0.557
Crown Volume (cv), m3TAGB = 11.434(cv)0.5950.332
Crown Biomass (CB), kgDiameter at breast height (dbh), cmCB = 0.1587(dbh) + 10.7140.287
Tree Height (th), mCB = −0.0102(th)2 + 0.7471(th) + 4.86830.819
Crown Base Height (cbh), mCB = 24.317ln(cbh) − 25.9420.505
Stem Volume (sv), m3CB = 0.0189(sv)0.60110.564
Crown Volume (cv), m3CB = 2.1641(cv)0.59580.330
Table A5. Allometric equation generated for Medang with tree variables obtained from TLS.
BiomassVariableRegression ModelsR2
Weight of Stem (Ws), kgDiameter at breast height (dbh), cmWs = 1.8818(dbh)2 − 37.269(dbh) + 225.410.830
Tree Height (th), mWs = 5.0971e0.1528(th)0.655
Crown Base Height (cbh), mWs = 20.699(cbh) − 90.3480.455
Stem Volume (sv), m3Ws = 1.4941(sv) + 19.9320.155
Weight of Branches (Wb), kgDiameter at breast height (dbh), cmWb = 0.4089(dbh)2 − 8.2824(dbh) + 49.150.838
Tree Height (th), mWb = 0.7769e0.1635(th)0.655
Crown Base Height (cbh), mWb = 4.323(cbh) − 20.3630.454
Stem Volume (sv), m3Wb = 0.3166(sv) + 2.48730.160
Branches Volume (bv), m3Wb = −235.98(bv) + 20.7530.040
Weight of Leaves (Wl), kgDiameter at breast height (dbh), cmWl = 0.0473(dbh)2 − 0.8183(dbh) + 5.76610.794
Tree Height (th), mWl = 0.4756e0.1162(th)0.653
Crown Base Height (cbh), mWl = 0.6303(cbh) − 1.57250.453
Stem Volume (sv), m3Wl = 0.0428(sv) + 1.89170.136
Leaves Volume (lv), m3Wl = 0.102(lv) + 1.64590.090
Total Aboveground Biomass (TAGB), kgDiameter at breast height (dbh), cmTAGB = 2.3379(dbh)2 − 46.37(dbh) + 280.330.830
Tree Height (th), mTAGB = 6.2626e0.153(th)0.655
Crown Base Height (cbh), mTAGB = 25.653(cbh) − 112.280.455
Stem Volume (sv), m3TAGB = 0.001(sv) + 0.02480.933
Crown Volume (cv), m3TAGB = 1.8535(cv) + 24.3110.156
Crown Biomass (CB), kgDiameter at breast height (dbh), cmCB = 0.1408(dbh) + 9.98890.712
Tree Height (th), mCB = 0.1322(th) + 13.460.609
Crown Base Height (cbh), mCB = 4.9533(cbh) − 21.9360.454
Stem Volume (sv), m3CB = 0.0053(sv) + 0.02610.934
Crown Volume (cv), m3CB = 0.3594(cv) + 4.3790.157
Table A6. Allometric equation generated for Kempas with tree variables obtained from TLS.
BiomassVariableRegression ModelsR2
Weight of Stem (Ws), kgDiameter at breast height (dbh), cmWs = 1.6625(dbh)2 − 44.183(dbh) + 452.490.993
Tree Height (th), mWs = 5.0013e0.2009(th)0.710
Crown Base Height (cbh), mWs = 4.3661e0.3589(cbh)0.665
Stem Volume (sv), m3Ws = 956.68(sv) − 140.950.996
Weight of Branches (Wb), kgDiameter at breast height (dbh), cmWb = 0.471(dbh)2 − 15.264(dbh) + 157.650.993
Tree Height (th), mWb = 0.7613e0.215(th)0.710
Crown Base Height (cbh), mWb = 0.6583e0.384(cbh)0.665
Stem Volume (sv), m3Wb = 254.17(sv) − 67.2840.994
Branches Volume (bv), m3Wb = 37415(bv) + 76.3820.237
Weight of Leaves (Wl), kgDiameter at breast height (dbh), cmWl = 0.0015(dbh)2 + 1.0511(dbh) − 9.98920.976
Tree Height (th), mWl = 0.8091e0.1227(th)0.634
Crown Base Height (cbh), mWl = 0.6533e0.2283(cbh)0.666
Stem Volume (sv), m3Wl = 5.3073(sv) + 11.4430.876
Leaves Volume (lv), m3Wl = 0.182(lv) + 10.0010.165
Total Aboveground Biomass (TAGB), kgDiameter at breast height (dbh), cmTAGB = 2.132(dbh)2 − 58.395(dbh) + 600.160.993
Tree Height (th), mTAGB = 6.0646e0.202(th)0.710
Crown Base Height (cbh), mTAGB = 5.3052e0.3607(cbh)0.665
Stem Volume (sv), m3TAGB = 0.0008(sv) + 0.17220.995
Crown Volume (cv), m3TAGB = 177.3e0.0158(cv)0.342
Crown Biomass (CB), kgDiameter at breast height (dbh), cmCB = 4.7122(dbh)0.36720.955
Tree Height (th), mCB = 3.4552ln(th) + 6.39630.713
Crown Base Height (cbh), mCB = 0.9459e0.3678(cbh)0.664
Stem Volume (sv), m3CB = 0.0038(cbh) + 0.22720.995
Crown Volume (cv), m3CB = 33.828e0.0161(cv)0.342
Table A7. Allometric equation generated for Mempening with tree variables obtained from TLS.
BiomassVariableRegression ModelsR2
Weight of Stem (Ws), kgDiameter at breast height (dbh), cmWs = 1.2341e0.2733(dbh)0.725
Tree Height (th), mWs = 1.4142e0.2742(th)0.298
Crown Base Height (cbh), mWs = 23.03(cbh) − 67.830.348
Stem Volume (sv), m3Ws = 4473.7(sv)2 − 37.922(sv) + 25.4140.941
Weight of Branches (Wb), kgDiameter at breast height (dbh), cmWb = 0.1703e0.2925(dbh)0.725
Tree Height (th), mWb = 0.1971e0.2934(th)0.298
Crown Base Height (cbh), mWb = 4.6707(cbh) − 14.6980.347
Stem Volume (sv), m3Wb = 975.62(sv)2 − 25.158(sv) + 4.90990.947
Branches Volume (bv), m3Wb = 0.0009(bv)−2.0870.765
Weight of Leaves (Wl), kgDiameter at breast height (dbh), cmWl = 0.1558e0.2103(dbh)0.723
Tree Height (th), mWl = 0.1726e0.2112(th)0.298
Crown Base Height (cbh), mWl = 0.7919(cbh) − 1.52880.350
Stem Volume (sv), m3Wl = 104.51(sv)2 + 11.348(sv) + 1.17120.910
Leaves Volume (lv), m3Wl = 7.3105e−0.047(lv)0.504
Total Aboveground Biomass (TAGB), kgDiameter at breast height (dbh), cmTAGB = 1.5193e0.2735(dbh)0.726
Tree Height (th), mTAGB = 1.7419e0.2744(th)0.298
Crown Base Height (cbh), mTAGB = 28.493(cbh) − 84.0560.348
Stem Volume (sv), m3TAGB = 0.0006(sv) + 0.02650.911
Crown Volume (cv), m3TAGB = 152.6e−0.027(cv)0.268
Crown Biomass (CB), kgDiameter at breast height (dbh), cmCB = 5.4682(dbh) − 55.2620.707
Tree Height (th), mCB = 5.3067(th) − 50.2550.272
Crown Base Height (cbh), mCB = −1.879ln(cbh) + 9.89380.299
Stem Volume (sv), m3CB = 5.3067(sv) − 50.2550.2721
Crown Volume (cv), m3CB = 28.835e−0.027(cv)0.264
Table A8. Allometric equation generated for other trees with tree variables obtained from TLS.
BiomassVariableRegression ModelsR2
Weight of Stem (Ws), kgDiameter at breast height (dbh), cmWs = 37.123e0.0694(dbh)0.835
Tree Height (th), mWs = 0.0074(th)3.46990.759
Crown Base Height (cbh), mWs = 0.4531(cbh)2.62520.655
Stem Volume (sv), m3Ws = 171.13(sv)2 + 59.232(sv) + 175.240.928
Weight of Branches (Wb), kgDiameter at breast height (dbh), cmWb = 6.5022e0.0742(dbh)0.835
Tree Height (th), mWb = 0.0007(th)3.71270.759
Crown Base Height (cbh), mWb = 0.0583(cbh)2.80890.655
Stem Volume (sv), m3Wb = 47.588(sv)2 − 10.914(sv) + 40.8010.921
Branches Volume (bv), m3Wb = 4.362(bv)−0.4430.177
Weight of Leaves (Wl), kgDiameter at breast height (dbh), cmWl = 2.373e0.0469(dbh)0.802
Tree Height (th), mWl = 0.0063(th)2.40120.764
Crown Base Height (cbh), mWl = 0.1091(cbh)1.81760.666
Stem Volume (sv), m3Wl = −0.2529(sv)2 + 11.424(sv) + 4.11540.950
Leaves Volume (lv), m3Wl = 6.999e0.009(lv)0.129
Total Aboveground Biomass (TAGB), kgDiameter at breast height (dbh), cmTAGB = 45.642e0.0696(dbh)0.835
Tree Height (th), mTAGB = 0.0089(th)3.48330.759
Crown Base Height (cbh), mTAGB = 26.096e0.2001(cbh)0.655
Stem Volume (sv), m3TAGB = 1180(sv) − 208.060.856
Crown Volume (cv), m3TAGB = 15.196(cv)0.83520.286
Crown Biomass (CB), kgDiameter at breast height (dbh), cmCB = 8.5276e0.0708(dbh)0.837
Tree Height (th), mCB = 2.1908e0.1516(th)0.754
Crown Base Height (cbh), mCB = 4.8349e0.2034(cbh)0.655
Stem Volume (sv), m3CB = 243.23(sv) − 47.8640.846
Crown Volume (cv), m3CB = 2.7984(cv)0.84840.286

References

  1. Basuki, T.M.; van Laake, P.E.; Skidmore, A.K.; Hussin, Y.A. Allometric equations for estimating the above-ground biomass in tropical lowland Dipterocarp forests. For. Ecol. Manag. 2009, 257, 1684–1694. [Google Scholar] [CrossRef]
  2. Kankare, V.; Holopainen, M.; Vastaranta, M.; Puttonen, E.; Yu, X.; Hyyppä, J.; Vaaja, M.; Hyyppä, H.; Alho, P. Individual tree biomass estimation using terrestrial laser scanning. ISPRS J. Photogramm. Remote Sens. 2013, 75, 64–75. [Google Scholar] [CrossRef]
  3. Chave, J.; Andalo, C.; Brown, S.; Cairns, M.A.; Chambers, J.Q.; Eamus, D.; Fölster, H.; Fromard, F.; Higuchi, N.; Kira, T.; et al. Tree allometry and improved estimation of carbon stocks and balance in tropical forests. Oecologia 2005, 145, 87–99. [Google Scholar] [CrossRef] [PubMed]
  4. Lucas, R.M.; Cronin, N.; Lee, A.; Moghaddam, M.; Witte, C.; Tickle, P. Empirical relationships between AIRSAR backscatter and LiDAR-derived forest biomass, Queensland, Australia. Remote Sens. Environ. 2006, 100, 407–425. [Google Scholar] [CrossRef]
  5. Næsset, E.; Gobakken, T. Estimation of above- and below-ground biomass across regions of the boreal forest zone using airborne laser. Remote Sens. Environ. 2008, 112, 3079–3090. [Google Scholar] [CrossRef]
  6. Ni-Meister, W.; Lee, S.; Strahler, A.H.; Woodcock, C.E.; Schaaf, C.; Yao, T.; Ranson, K.J.; Sun, G.; Blair, J.B. Assessing general relationships between aboveground biomass and vegetation structure parameters for improved carbon estimate from lidar remote sensing. J. Geophys. Res. 2010, 115, 1–12. [Google Scholar] [CrossRef]
  7. Frazer, G.W.; Magnussen, S.; Wulder, M.A.; Niemann, K.O. Simulated impact of sample plot size and co-registration error on the accuracy and uncertainty of LiDAR-derived estimates of forest stand biomass. Remote Sens. Environ. 2011, 115, 636–649. [Google Scholar] [CrossRef]
  8. Popescu, S.C.; Zhao, K.; Neuenschwander, A.; Lin, C. Satellite lidar vs. small footprint airborne lidar: Comparing the accuracy of aboveground biomass estimates and forest structure metrics at footprint level. Remote Sens. Environ. 2011, 115, 2786–2797. [Google Scholar] [CrossRef]
  9. Petrie, G.; Toth, C.K. Terrestrial Laser Scanner. Citeseer 2008, 46, 87–128. [Google Scholar]
  10. Lefsky, M.; McHale, M.R. Volume estimates of trees with complex architecture from terrestrial laser scanning. J. Appl. Remote Sens. 2008, 2, 23521. [Google Scholar]
  11. Bucksch, A.; Fleck, S. Automated Detection of Branch Dimensions in Woody Skeletons of Fruit Tree Canopies. Photogramm. Eng. Remote Sens. 2011, 77, 229–240. [Google Scholar] [CrossRef]
  12. Yao, T.; Yang, X.; Zhao, F.; Wang, Z.; Zhang, Q.; Jupp, D.; Lovell, J.; Culvenor, D.; Newnham, G.; Ni-Meister, W.; et al. Measuring forest structure and biomass in New England forest stands using Echidna ground-based lidar. Remote Sens. Environ. 2011, 115, 2965–2974. [Google Scholar] [CrossRef]
  13. Fernández-Sarría, A.; Velázquez-Martí, B.; Sajdak, M.; Martínez, L.; Estornell, J. Residual biomass calculation from individual tree architecture using terrestrial laser scanner and ground-level measurements. Comput. Electron. Agric. 2013, 93, 90–97. [Google Scholar] [CrossRef]
  14. Holopainen, M.; Kankare, V.; Vastaranta, M.; Liang, X.; Lin, Y.; Vaaja, M.; Yu, X.; Hyyppä, J.; Hyyppä, H.; Kaartinen, H.; et al. Tree mapping using airborne, terrestrial and mobile laser scanning—A case study in a heterogeneous urban forest. Urban For. Urban Green. 2013, 12, 546–553. [Google Scholar] [CrossRef]
  15. Dassot, M.; Colin, A.; Santenoise, P.; Fournier, M.; Constant, T. Terrestrial laser scanning for measuring the solid wood volume, including branches, of adult standing trees in the forest environment. Comput. Electron. Agric. 2012, 89, 86–93. [Google Scholar] [CrossRef]
  16. Fernández-Sarría, A.; Martínez, L.; Velázquez-Martí, B.; Sajdak, M.; Estornell, J.; Recio, J.A. Different methodologies for calculating crown volumes of Platanus hispanica trees using terrestrial laser scanner and a comparison with classical dendrometric measurements. Comput. Electron. Agric. 2013, 90, 176–185. [Google Scholar] [CrossRef]
  17. Hosoi, F.; Nakai, Y.; Omasa, K. 3-D voxel-based solid modeling of a broad-leaved tree for accurate volume estimation using portable scanning lidar. ISPRS J. Photogramm. Remote Sens. 2013, 82, 41–48. [Google Scholar] [CrossRef]
  18. Feliciano, E.A.; Wdowinski, S.; Potts, M.D. Assessing Mangrove Above-Ground Biomass and Structure using Terrestrial Laser Scanning: A Case Study in the Everglades National Park. Wetlands 2014, 34, 955–968. [Google Scholar] [CrossRef]
  19. Olschofsky, K.; Mues, V.; Kohl, M. Operational assessment of aboveground tree volume and biomass by terrestrial laser scanning. Comput. Electron. Agric. 2016, 127, 699–707. [Google Scholar] [CrossRef]
  20. Greaves, H.E.; Vierling, L.A.; Eitel, J.U.H.; Boelman, N.T.; Magney, T.S.; Prager, C.M.; Griffin, K.L. Estimating aboveground biomass and leaf area of low-stature Arctic shrubs with terrestrial LiDAR. Remote Sens. Environ. 2015, 164, 26–35. [Google Scholar] [CrossRef]
  21. Li, A.; Glenn, N.F.; Olsoy, P.J.; Mitchell, J.J.; Shrestha, R. Aboveground biomass estimates of sagebrush using terrestrial and airborne LiDAR data in a dryland ecosystem. Agric. For. Meteorol. 2015, 213, 138–147. [Google Scholar] [CrossRef]
  22. Olsoy, P.J.; Glenn, N.F.; Clark, P.E.; Derryberry, D.R. Aboveground total and green biomass of dryland shrub derived from terrestrial laser scanning. ISPRS J. Photogramm. Remote Sens. 2014, 88, 166–173. [Google Scholar] [CrossRef]
  23. Fei, L.K. Save the Belum-Temengor Rainforest. Available online: http://mns.my/article.php?aid=2455 (accessed on 11 February 2015).
  24. Rahman, M.Z.A.; Gorte, B.; Menenti, M.; Ibrahim, A.L. A generic approach in estimating vegetation density for hydrodynamic roughness parameterization using high density airborne laser scanning data. J. Hydroinform. 2013, 15, 446–463. [Google Scholar] [CrossRef]
  25. Capuzzo, J.P.; Rossatto, D.R.; Franco, A.C. Differences in morphological and physiological leaf characteristics between Tabebuia aurea and T. impetiginosa is related to their typical habitats of occurrence. Acta Bot. Brasilica 2012, 26, 519–526. [Google Scholar] [CrossRef]
  26. Sereneski-de Lima, C.; Torres-Boeger, M.R.; Larcher-de Carvalho, L.; Pelozzo, A.; Soffiatti, P. Sclerophylly in mangrove tree species from South Brazil. Rev. Mex. Biodivers. 2013, 84, 1159–1166. [Google Scholar] [CrossRef]
  27. Kato, R.; Tadaki, Y.; Ogawa, H. Plant biomass and growth increment studies in Pasoh Forest. Malay. Nat. J. 1978, 30, 211–224. [Google Scholar]
  28. Chave, J.; Coomes, D.; Jansen, S.; Lewis, S.L.; Swenson, N.G.; Zanne, A.E. Towards a worldwide wood economics spectrum. Ecol. Lett. 2009, 12, 351–366. [Google Scholar] [CrossRef] [PubMed]
Figure 1. Royal Belum forest reserve, Perak, Malaysia.
Forests 08 00086 g001
Figure 2. Flow chart of general methodology.
Forests 08 00086 g002
Figure 3. Individual tree measurements in a forest plot aided by a special signage located on selected trees.
Forests 08 00086 g003
Figure 4. Individual tree measurement in a sample plot.
Forests 08 00086 g004
Figure 5. Manually define threshold for the histogram of intensity values differentiating point clouds of branches and leaves.
Forests 08 00086 g005
Figure 6. (a) Histogram for elevation value of point clouds fitted with multiple Gaussian models and (b) the corresponding point clouds of a single tree [24].
Forests 08 00086 g006
Figure 7. Cylinder fitting applied to point clouds of the stem showing the diameter profile from the bottom to the top of a stem.
Forests 08 00086 g007
Figure 8. Delineation of branches and leaves from TLS-generated cloud points: (a) classified branches in red and leaves in yellow; (b) volume of branches and (c) volume of leaves, estimated using alpha shapes.
Forests 08 00086 g008
Figure 9. Alpha applied to the convex hull to refine the detail volume estimation for crown components.
Forests 08 00086 g009
Figure 10. Correlation between total aboveground biomass, Weight of Stem, Weight of Branches and Weight of Leaves estimated using allometric equations and those determined using TLS-derived values.
Forests 08 00086 g010
Figure 11. Manually observed low point density of branches affected by longer distances from the scanner and obstruction by leaves.
Forests 08 00086 g011
Table 1. List of tree species and wood density [28].
Tree SpeciesWood Density (g·cm−3)No. of TreesMean DBH (cm)
Akasia (Acacia auriculiformis A. Cunn. ex Benth.)0.682314.2
Balik Angin (Mallotus paniculatus (Lam.) Müll.Arg.)0.501613.9
Resak (Vatica umbonata (Hook.f.) Burck)0.791616.8
Keruing (Dipterocarpus costatus Gaertn.f.)0.76331.4
Mempening (Lithocarpus kingianus (Gamble) A. Camus)0.80615.0
Kelat (Eugenia filiformis Wall. ex Duthie var. clavimyrtus (Koord. & Valeton) M.R. Hend.)0.711317.3
Merbau (Intsia palembanica Miq.)0.63383.2
Sepetir (Sindora echinocalyx (Benth.) Prain)0.61518.82
Medang (Alseodaphne insignis Gamble)0.711116.0
Temponek (Artocarpus rigidus Blume)0.55113.6
Pelung (Pentaspadon motleyi Hook.f.)0.50338.4
Kempas (Koompassia malaccensis Maing. ex Benth.)0.76944.8
Perah (Elateriospermum tapos Blume)0.65335.5
Keledang (Artocarpus gomezianus Wall. ex Trécul)0.5418.49
Mempisang (Goniothalamus giganteus Hook.f. & Thomson)0.38426.1
Nyatoh (Palaquium clarkeanum King & Gamble)0.66135.5
Table 2. RMSE, MAE Bias and correlation estimates for DBH, tree height and CBH *.
Tree AttributeRMSE% RMSE to MeanMAE% MAE to MeanMean BiasCorrelation
Diameter at Breast Height (DBH), cm0.06229.00.04119.0−0.0320.969
Tree Height, m7.10446.95.04237.43.0650.616
Crown Base Height (CBH), m4.31042.63.02029.91.0500.590
* RMSE and MAE denote root mean square error and mean absolute error.
Table 3. Comparison of total above ground biomass (TAGB) and weight of stem, branches and leaves for all tree species between TLS-measured values and values obtained from allometric equations.
Biomass RMSE (kg)% RMSE to MeanMAE (kg)% MAE to MeanMean Bias (kg)Correlation
Weight of stem (kg)1751.666410.0512.015119.8−59.0750.973
Weight of branches (kg)399.777396.499.03598.2−93.438−0.124
Weight of leaves (kg)15.528194.910.294129.23.9730.242
Total aboveground biomass (kg)842.674157.2197.85536.9−154.9120.973
Table 4. General allometric equation for all tree species with tree variables obtained from TLS.
BiomassVariableRegression ModelsR2
Weight of Stem (Ws), kgDiameter at breast height (dbh), cmWs = 1.7016(dbh)2 − 57.964(dbh) + 527.850.918
Tree Height (th), mWs = 5.2021e0.174(th)0.758
Crown Base Height (cbh), mWs = 15.348e0.1994(cbh)0.439
Stem Volume (sv), m3Ws = 637.93(sv) + 14.6170.937
Weight of Branches (Wb), kgDiameter at breast height (dbh), cmWb = 0.4672(dbh)2 − 17.634(dbh) + 160.170.913
Tree Height (th), mWb = 0.7941e0.1861(th)0.758
Crown Base Height (cbh), mWb = 2.5271e0.2134(cbh)0.439
Stem Volume (sv), m3Wb = 147.06(sv) − 0.33870.940
Branches Volume (bv), m3Wb = 2.1588(bv)−0.3720.200
Weight of Leaves (Wl), kgDiameter at breast height (dbh), cmWl = 0.8032(dbh) − 6.84350.914
Tree Height (th), mWl = 0.5582e0.122(th)0.742
Crown Base Height (cbh), mWl = 1.1945e0.1403(cbh)0.446
Stem Volume (sv), m3Wl = 11.88(sv) + 2.64750.885
Leaves Volume (lv), m3Wl = 2.9449e0.0101(lv)0.105
Total Aboveground Biomass (TAGB), kgDiameter at breast height (dbh), cmTAGB = 2.172(dbh)2 − 75.055(dbh) + 684.180.917
Tree Height (th), mTAGB = 6.3679e0.1746(th)0.759
Crown Base Height (cbh), mTAGB = 18.84e0.2001(cbh)0.439
Stem Volume (sv), m3TAGB = 1154.4(sv) − 123.890.984
Crown Volume (cv), m3TAGB = 60e0.0114(cv)0.236
Weight of Crown (Wc) = WI + Wb, kgDiameter at breast height (dbh), cmTAGB = 0.5079(dbh)2 − 21.867(dbh) + 215.570.954
Tree Height (th), mWc = 0.8818e0.1865(th)0.882
Crown Base Height (cbh)Wc = 2.7528ln(cbh) + 1.2850.656
Stem Volume (sv), m3Wc = 0.0059(sv) + 0.00570.939
Crown Volume (cv), m3Wc = 20.4ln(cbh) − 5.23610.237
Table 5. Assessment of biomass from different compartments and total aboveground biomass of different tree species.
Tree SpeciesBiomassRMSE (kg)% RMSE to MeanMAE (kg)% MAE to MeanMean Bias (kg)Correlation (R)
Acacia auriculiformis (Akasia)Weight of Stem (kg)35.81454.922.39734.311.2020.979
Weight of Branches (kg)19.055155.79.13274.6−6.218−0.167
Weight of Leaves (kg)8.439272.95.760186.34.7720.731
TAGB (kg)27.79434.522.08627.48.1970.980
Mallotus paniculatus (Balik Angin)Weight of Stem (kg)23.25746.518.52937.0−13.1930.917
Weight of Branches (kg)14.185154.79.822107.11.623−0.265
Weight of Leaves (kg)14.424565.611.813463.211.8130.094
TAGB (kg)29.22147.323.85338.60.2430.896
Vatica spp. (Resak)Weight of Stem (kg)42.79640.030.69128.722.1100.904
Weight of Branches (kg)20.11298.015.58675.9−9.7540.270
Weight of Leaves (kg)13.682294.99.905213.59.2850.490
TAGB (kg)44.87334.033.32425.221.6410.911
Eugenia filiformis (Kelat)Weight of Stem (kg)40.02941.030.94231.7−7.4190.728
Weight of Branches (kg)18.50699.914.94880.7−10.476−0.232
Weight of Leaves (kg)10.020229.07.457170.56.5770.289
TAGB (kg)53.70444.640.14833.3−11.3180.669
Cinnamomum spp. (Medang)Weight of Stem (kg)28.21530.822.58024.67.9830.966
Weight of Branches (kg)28.656162.019.419109.8−8.462−0.199
Weight of Leaves (kg)6.726170.56.044153.25.2980.293
TAGB (kg)42.77037.735.58231.44.8180.975
Koompassia malaccensis (Kempas)Weight of Stem (kg)930.07642.8435.70520.1−334.2960.998
Weight of Branches (kg)1200.291219.5545.27399.7−545.2730.444
Weight of Leaves (kg)27.190112.019.15878.9−13.3380.248
TAGB (kg)2139.21478.0947.83934.6−892.9070.997
Litocarpus Kingianus (Mempening)Weight of Stem (kg)33.29145.027.49037.2−5.8510.954
Weight of Branches (kg)19.505138.713.88198.7−3.213−0.647
Weight of Leaves (kg)8.498253.86.479193.55.835−0.473
TAGB (kg)55.07360.246.91351.3−3.2280.936
OthersWeight of Stem (kg)873.46088.3338.77934.2−207.8220.905
Weight of Branches (kg)487.298208.6232.33599.5−229.473−0.178
Weight of Leaves (kg)21.532126.414.30784.0−2.0470.279
TAGB (kg)1319.042106.4501.30440.4−439.3410.905

