
Distribution of Soil Organic Carbon in Riparian Forest Soils Affected by Frequent Floods (Southern Québec, Canada)

Abstract
:1. Introduction
2. Materials and Methods
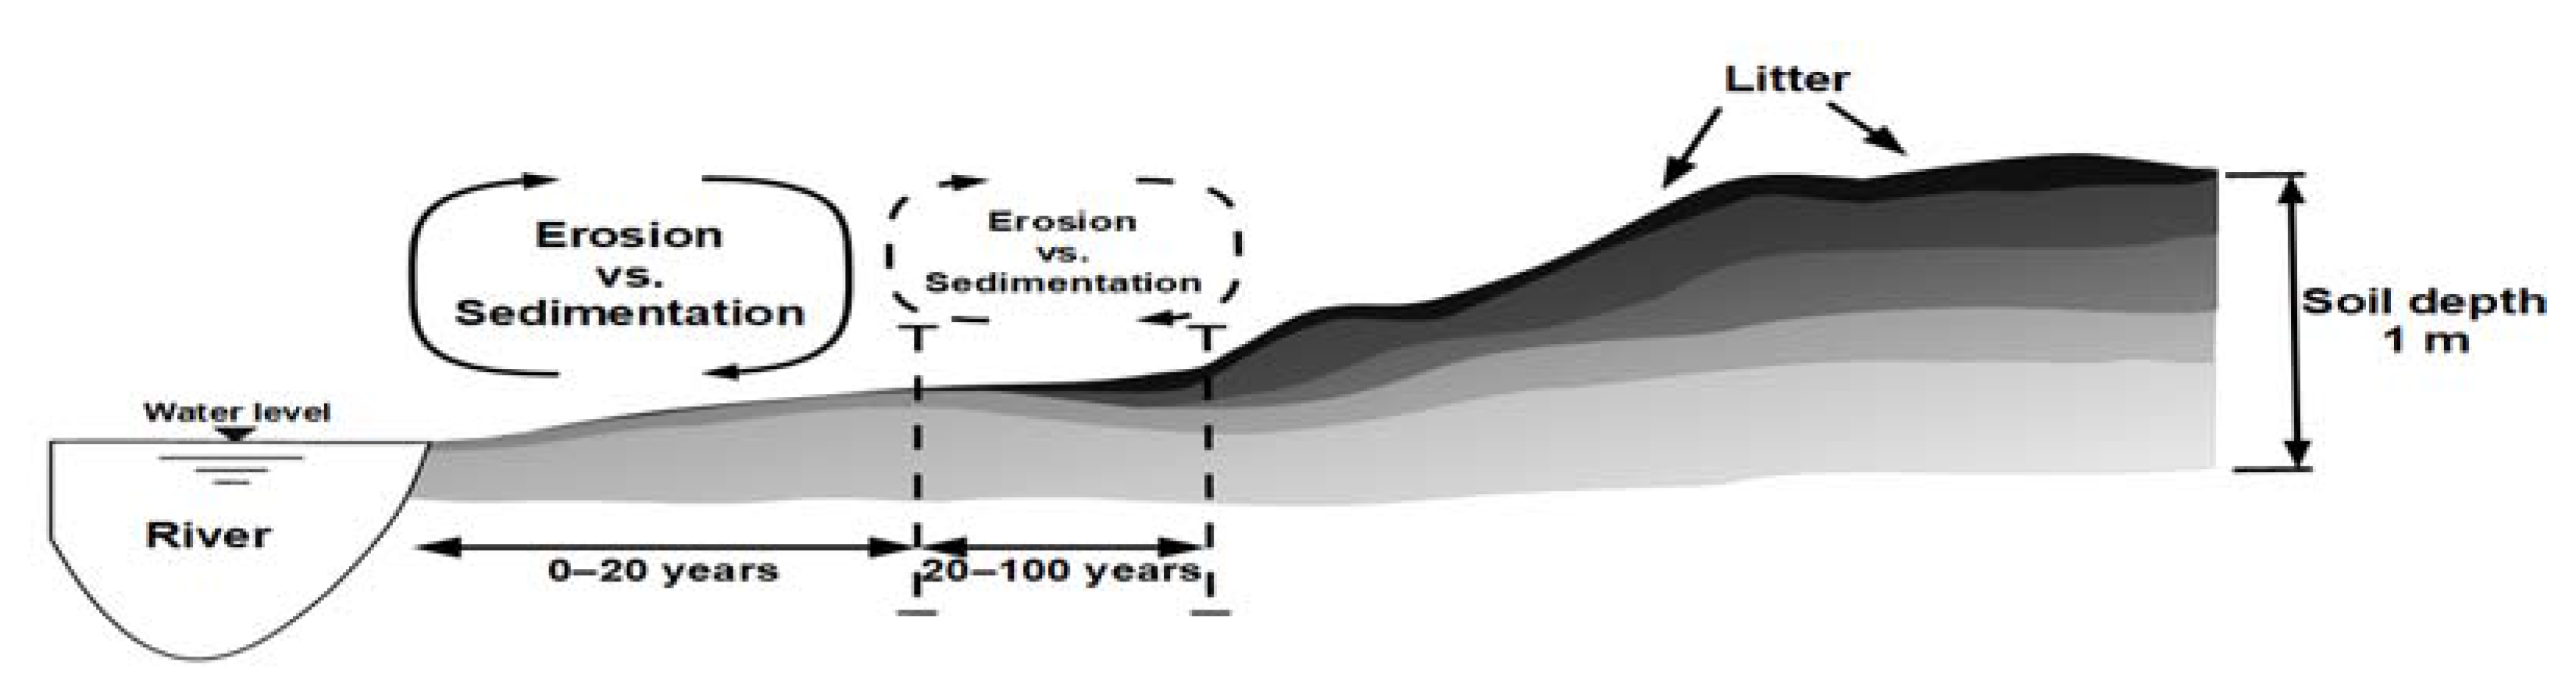
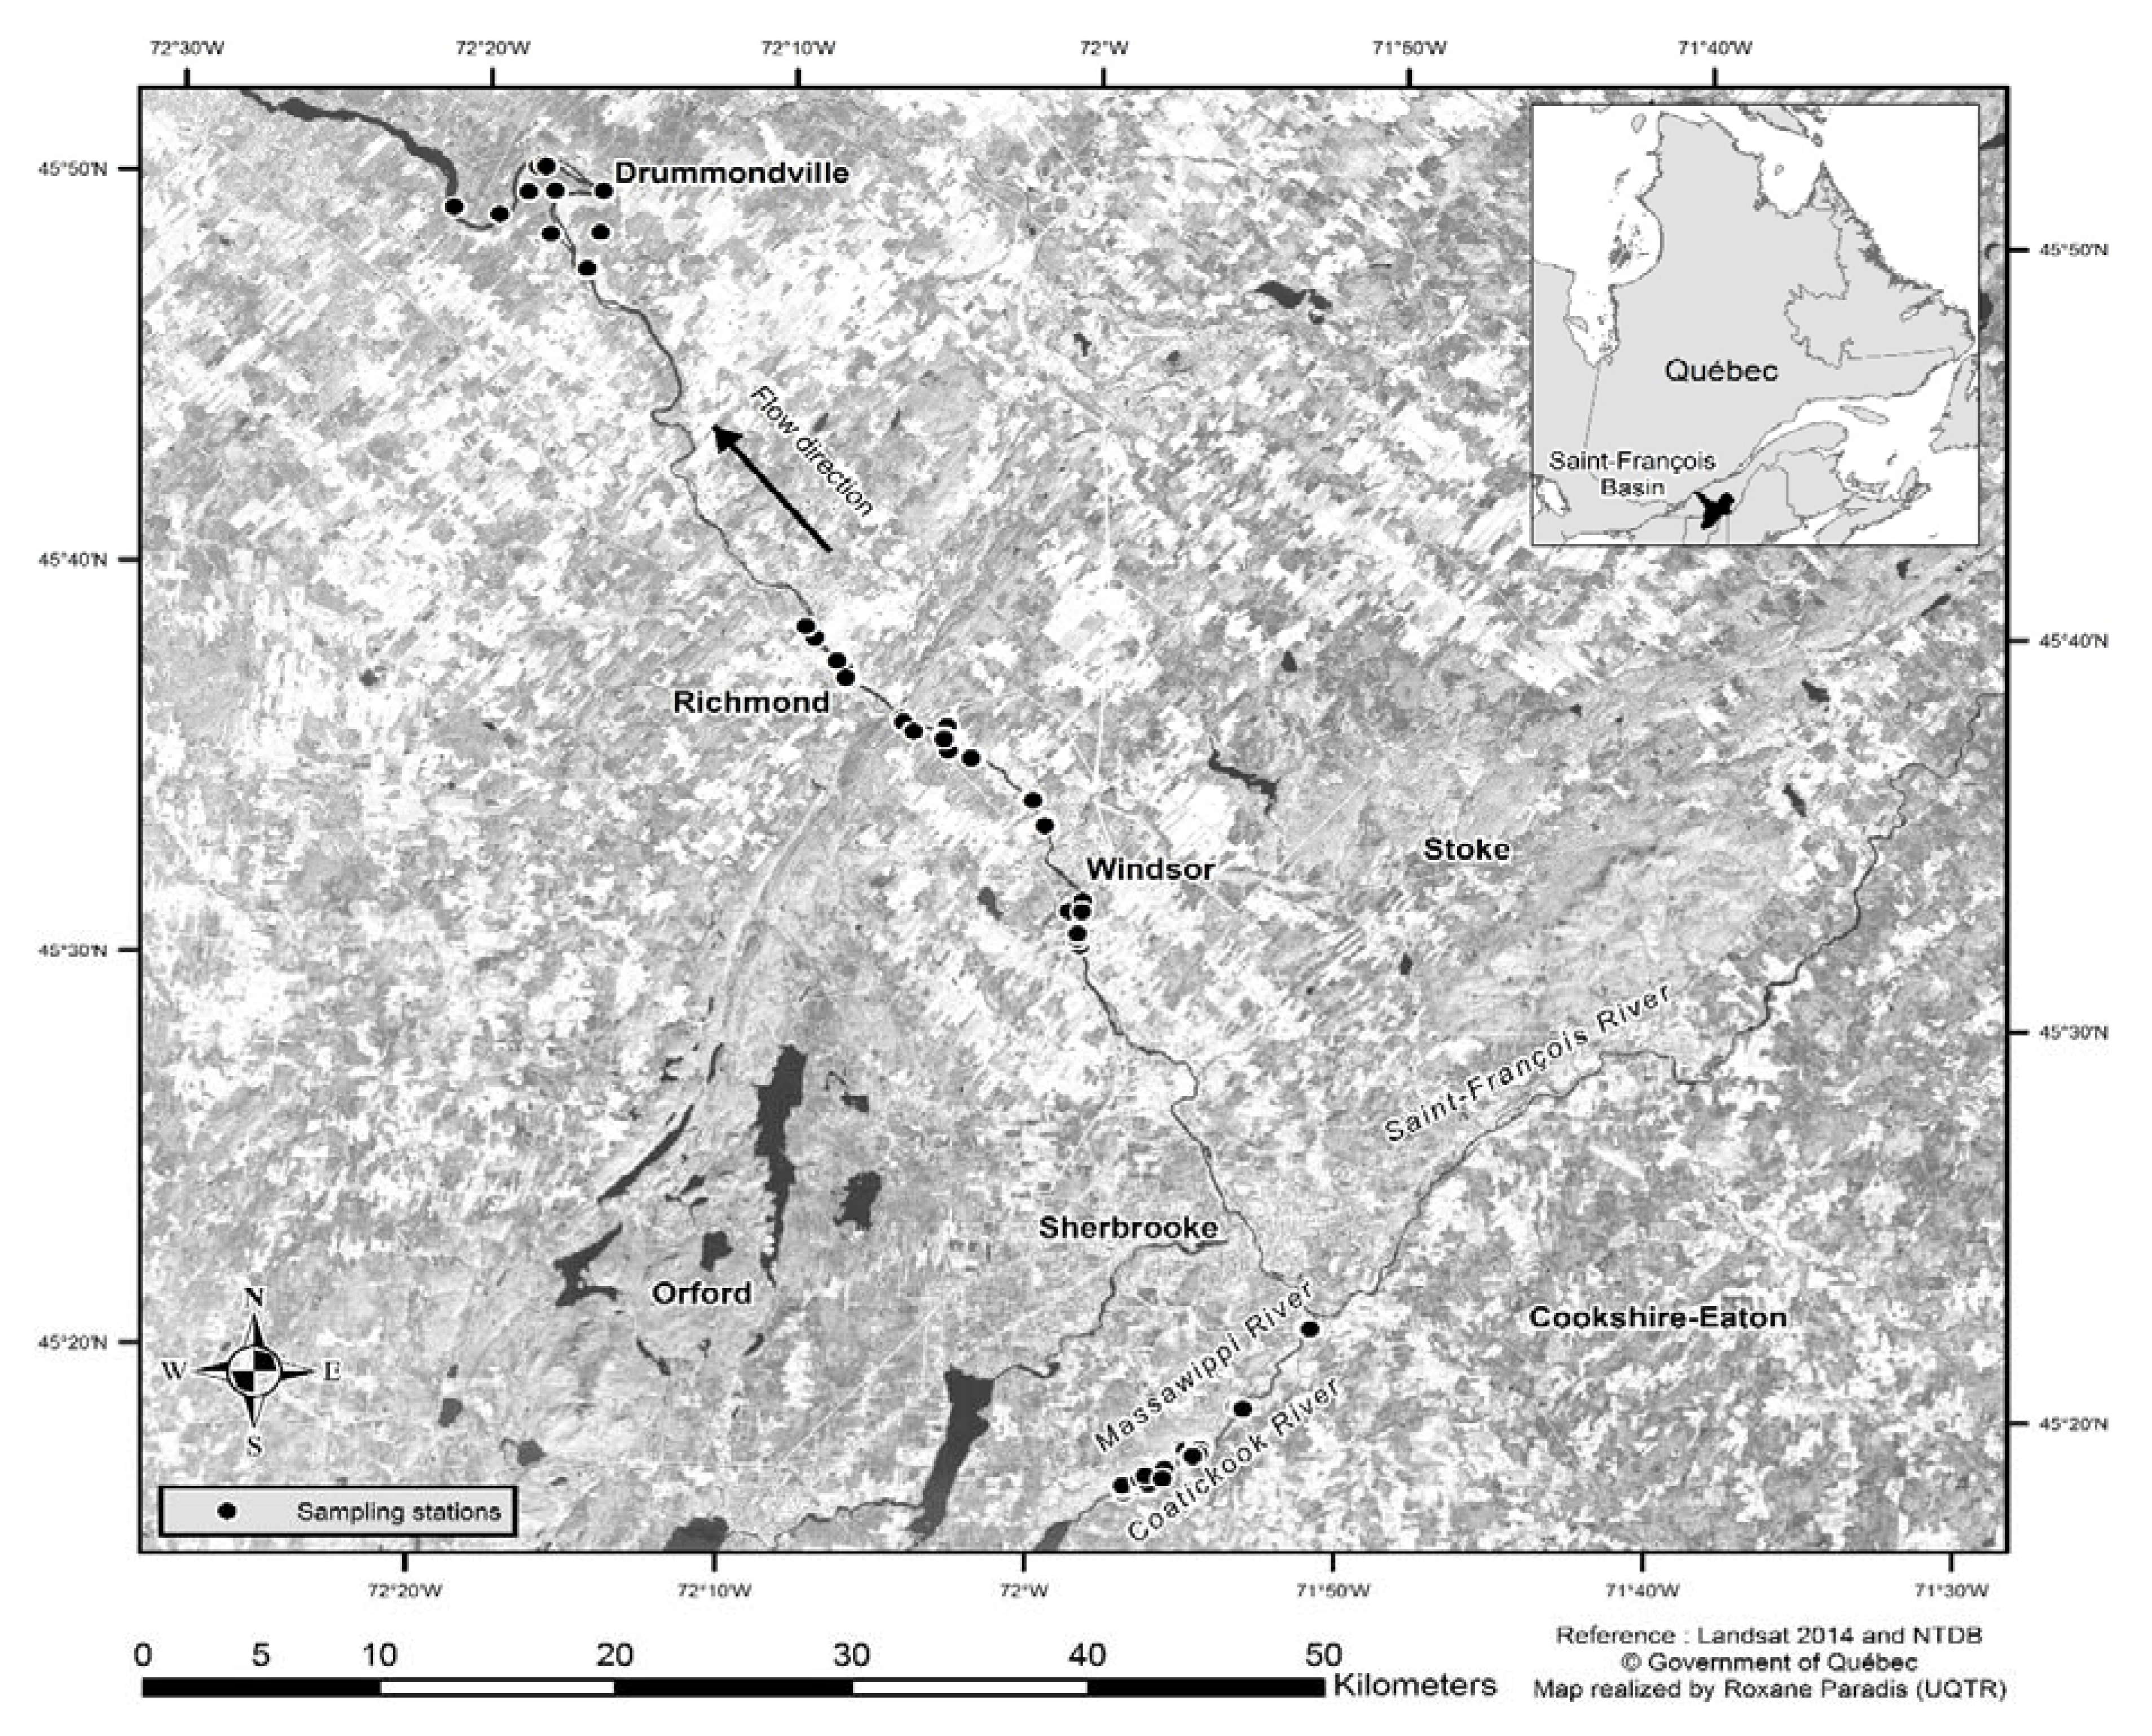
2.1. Study Area
2.2. Sampling Sites
2.3. Soil sample Analysis
2.4. Data Analysis
3. Results
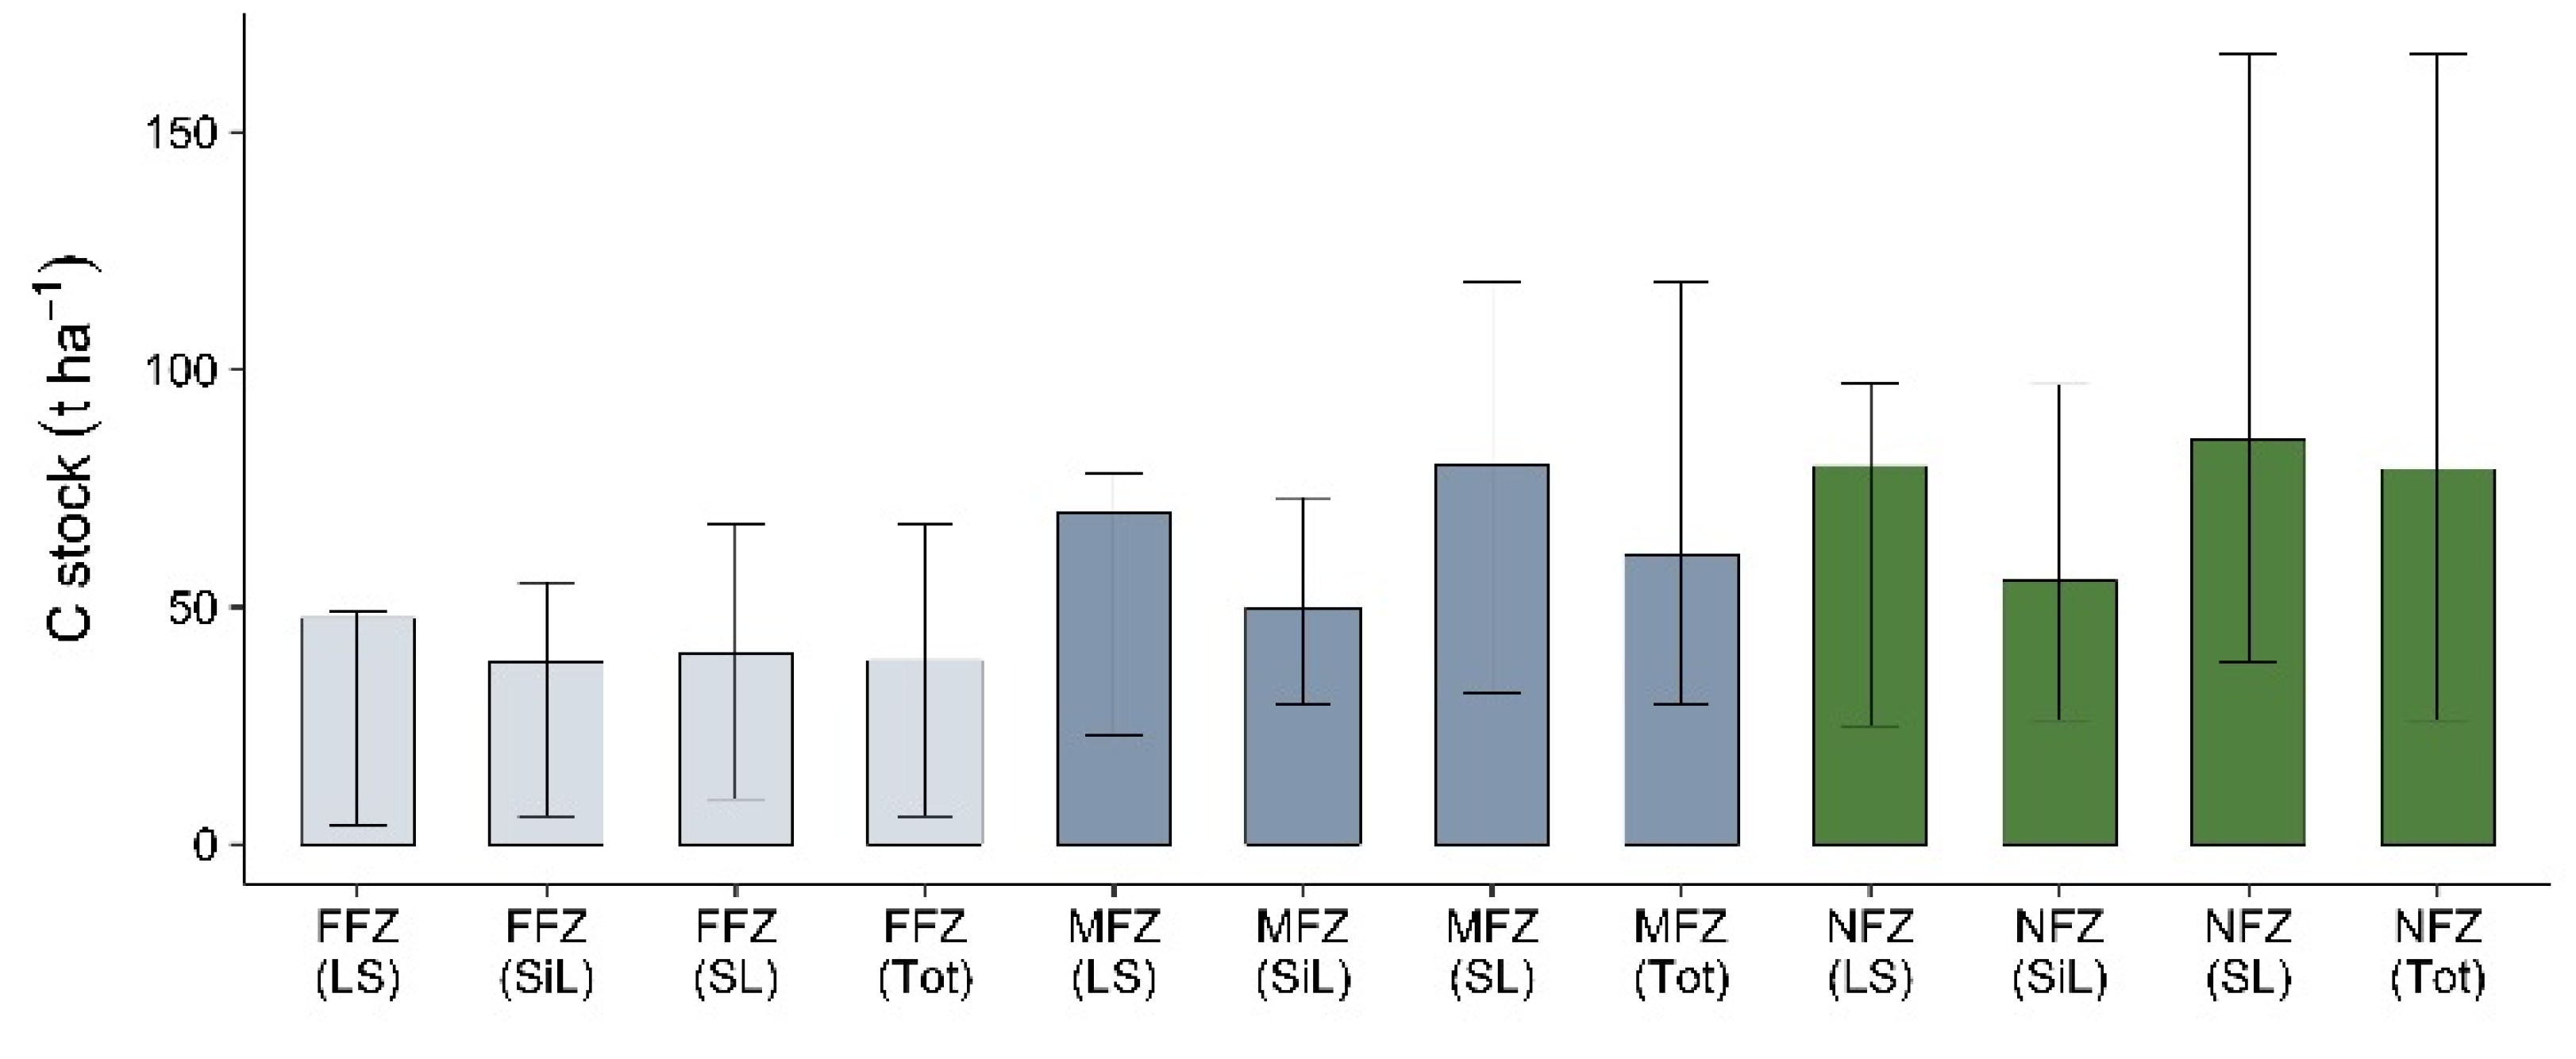
3.1. SOC Content
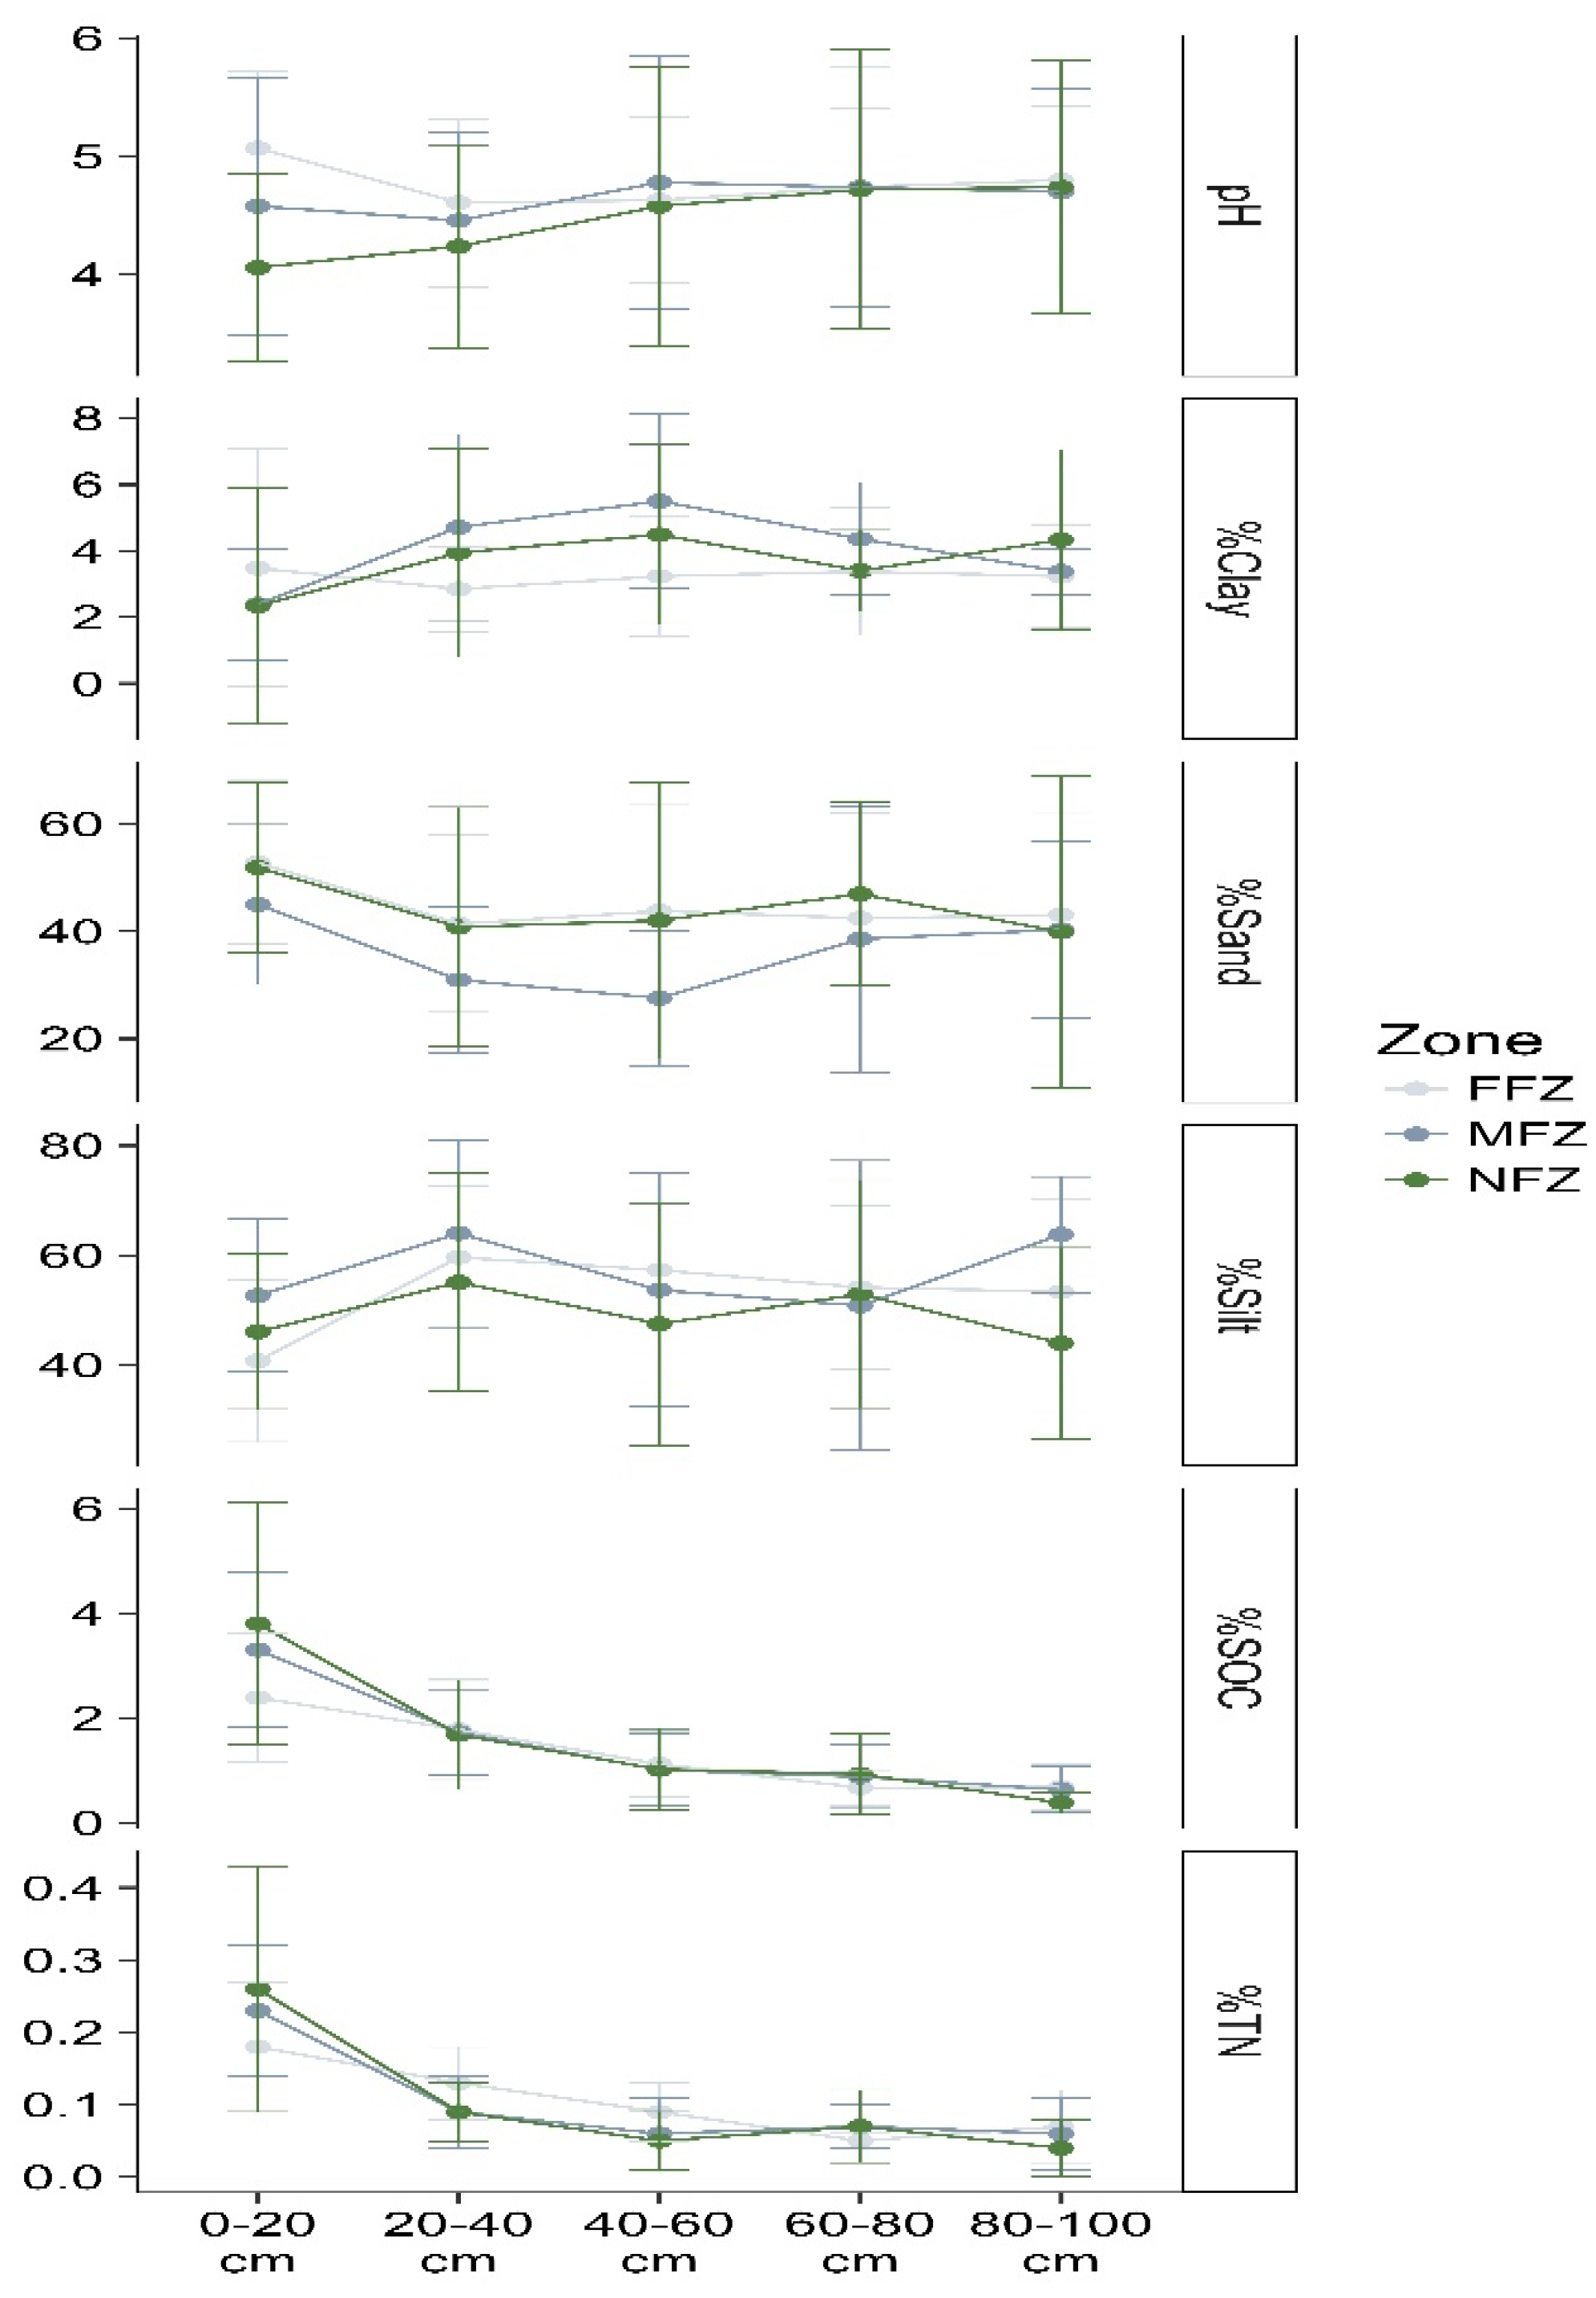
3.2. Soil Properties in Inundated and Non-Inundated Zones
3.3. SOC, TN, and C/N Ratio
3.4. Variability in Soil Profiles
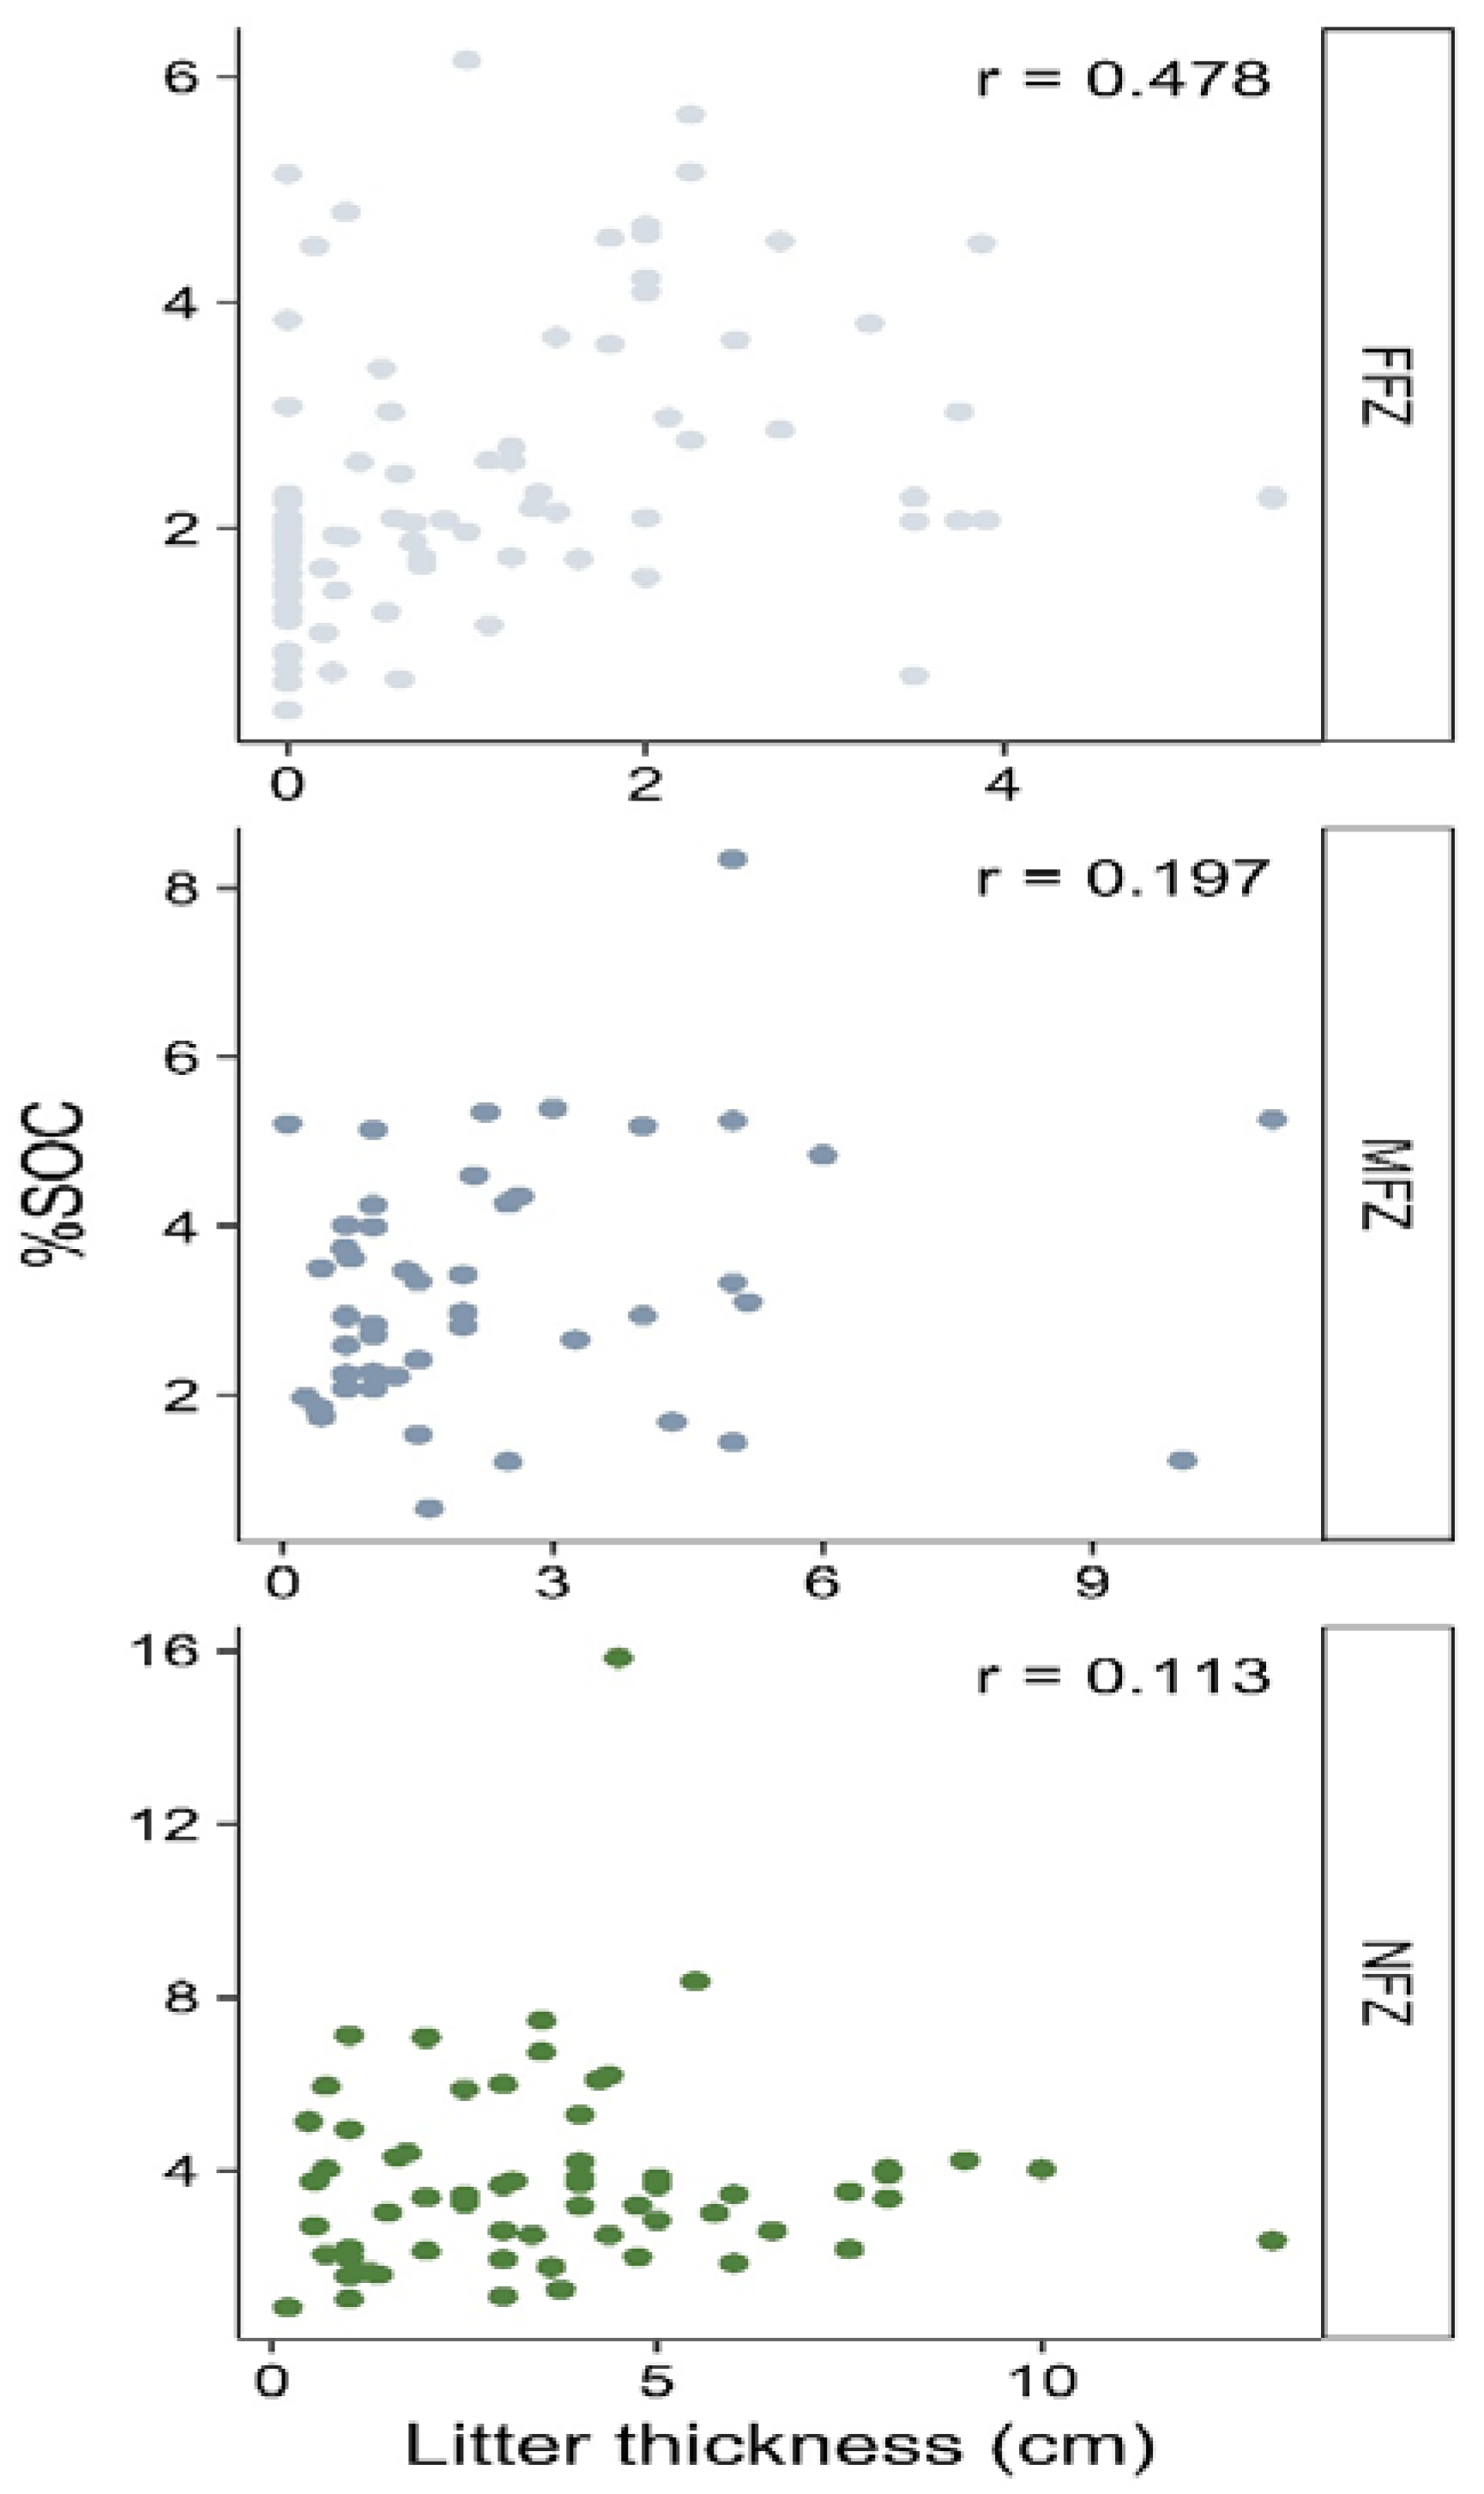
3.5. Litter in Inundated and Non-Inundated Zones
4. Discussion
4.1. Variability in SOC and N
4.2. Litter
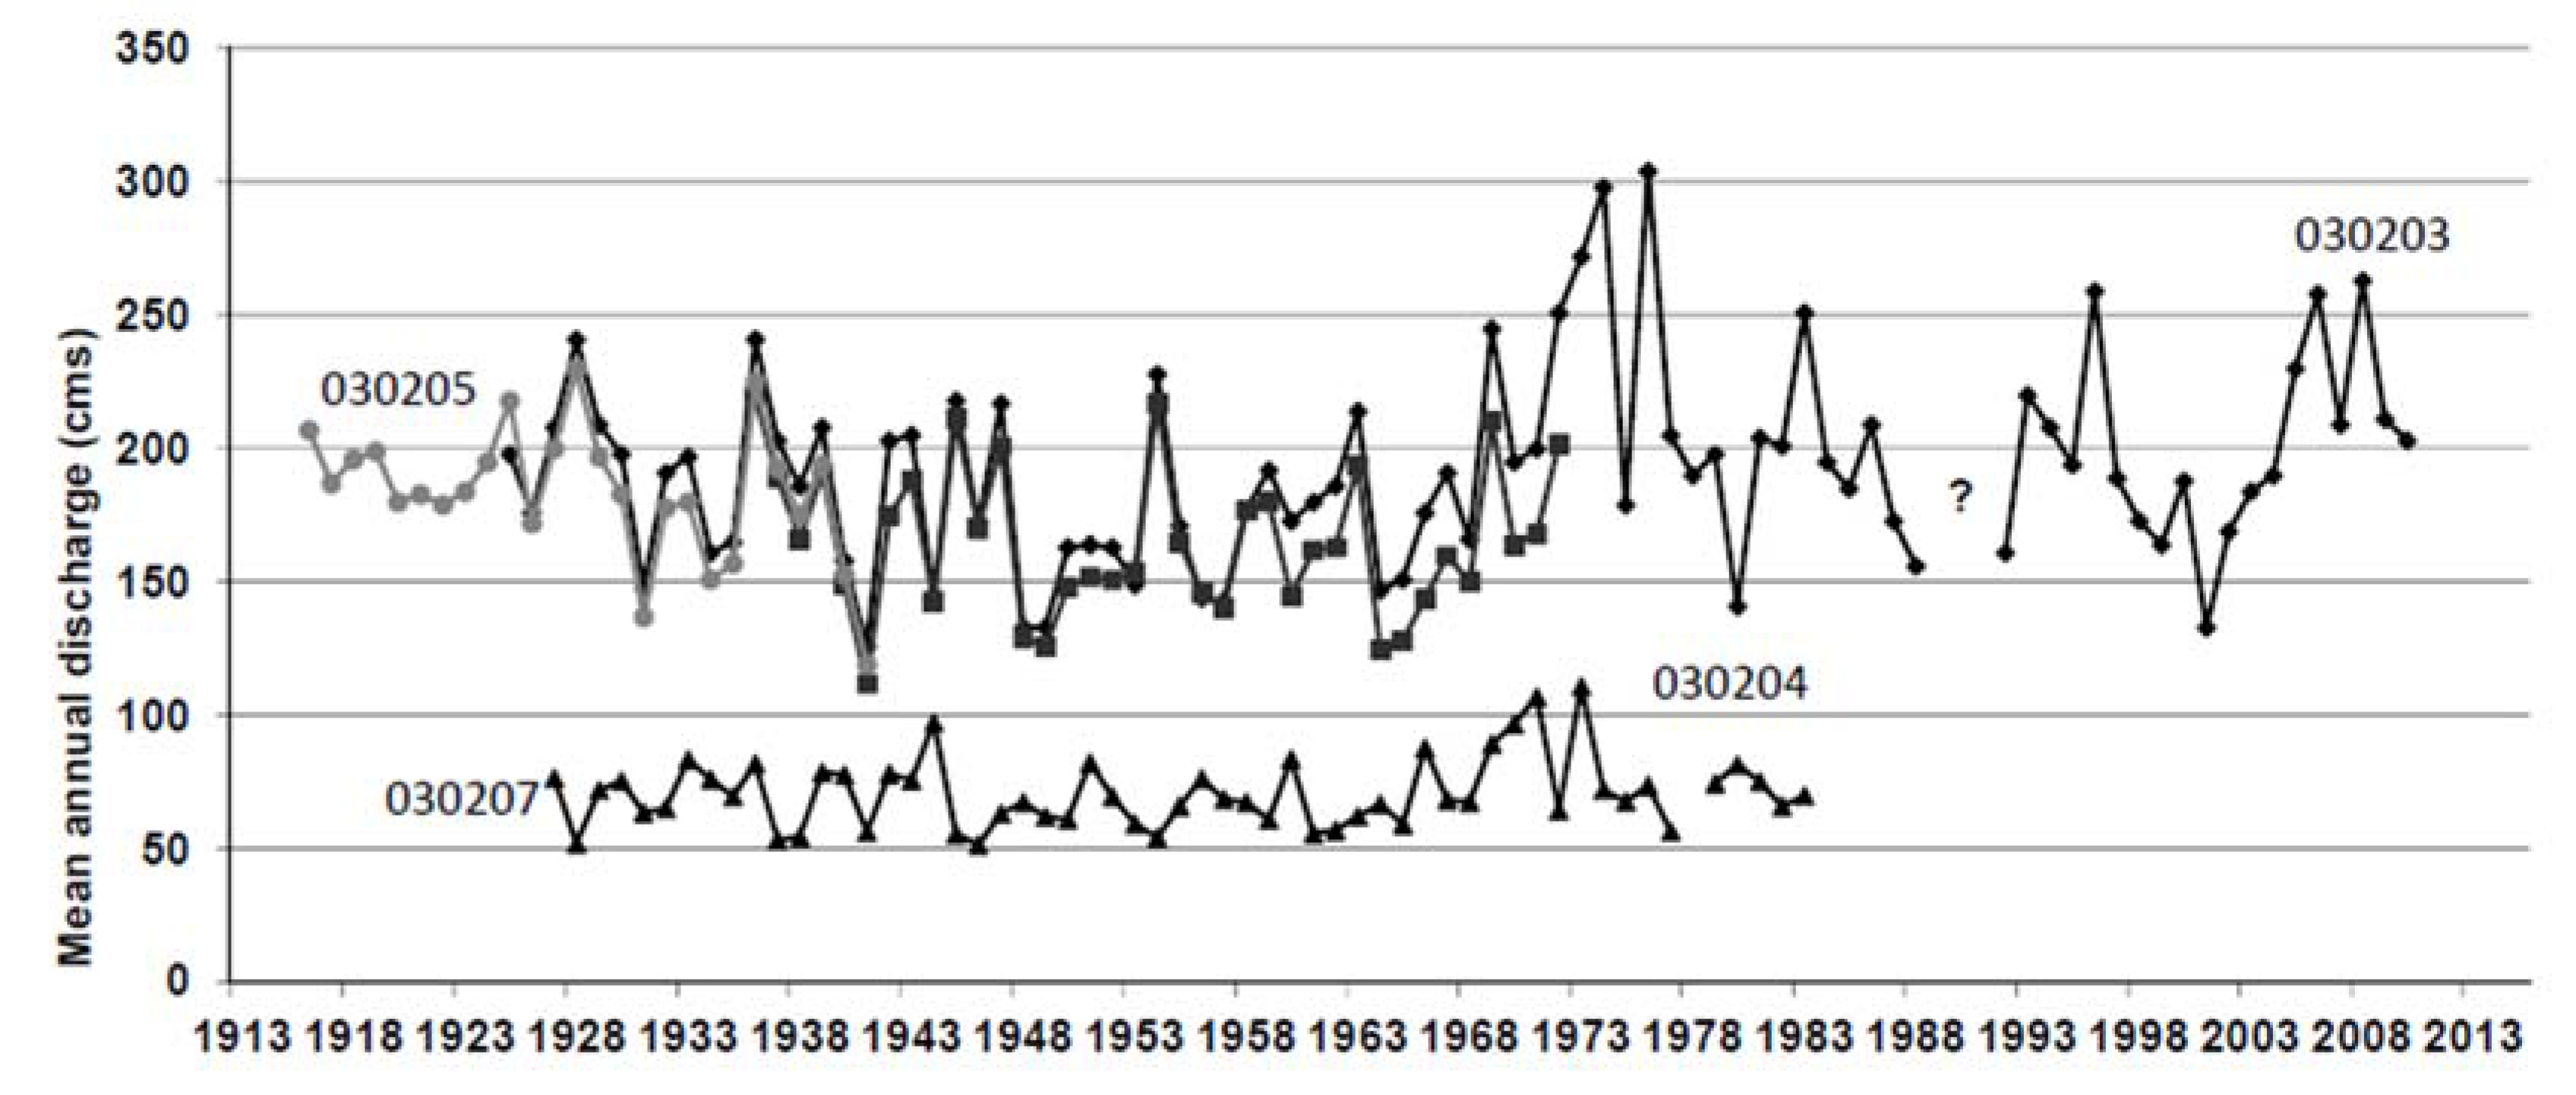
4.3. Flood Events
5. Conclusions
Acknowledgments
Author Contributions
Conflicts of Interest
Abbreviations
| FFZ | Frequent flood zone |
| MFZ | Moderate flood zone |
| NFZ | No-flood zone |
| SOC | Soil organic carbon |
| GPS | Global positioning system |
| UTM | Universal transverse Mercator |
References
- Sarmiento, J.L.; Gloor, M.; Gruber, N.; Beaulieu, C.; Jacobson, A.R.; Fletcher, S.E.M.; Pacala, S.; Rodgers, K. Trends and regional distributions of land and ocean carbon sinks. Biogeosciences 2010, 7, 2351–2367. [Google Scholar] [CrossRef]
- Pan, Y.; Birdsey, R.A.; Fang, J.; Houghton, R.; Kauppi, P.E.; Kurz, W.A.; Phillips, O.L.; Shvidenko, A.; Lewis, S.L.; Canadell, J.G.; et al. A large and persistent carbon sink in the world’s forests. Science 2011, 333, 988–993. [Google Scholar] [CrossRef] [PubMed]
- Metsaranta, J.M.; Kurtz, W.A.; Neilson, E.T.; Stinson, G. Implications of future disturbance regimes on the carbon balance of Canada’s managed forest (2010–2100). Tellus. Ser. B Chem. Phys. Meteorol. 2010, 62, 719–728. [Google Scholar] [CrossRef]
- Grosse, G.; Harden, J.; Turetsky, M.; David, A.; McGuire, A.; Camill, P.; Tarnocai, C; Frolking, S.; Schuur, W.A.G.; Jorgenson, T.; et al. Vulnerability of high-latitude soil organic carbon in North America to disturbance. J. Geophys. Res. 2011, 116. [Google Scholar] [CrossRef]
- De Marco, A.; Fioretto, A.; Giordano, M.; Innangi, M.; Menta, C.; Papa, S.; Virzo de Santo, A.C. Stocks in Forest Floor and Mineral Soil of Two Mediterranean Beech Forests. Forest 2016, 7, 181. [Google Scholar] [CrossRef]
- Kondo, M.; Saitohb, T.M.; Satoa, H.; Ichiia, K. Comprehensive synthesis of spatial variability in carbon flux across monsoon Asian forests. Agric. For. Meteorol. 2017, 232, 623–634. [Google Scholar] [CrossRef]
- Conant, R.T.; Smith, G.R.; Paustian, K. Spatial variability of soil carbon in forested and cultivated sites: Implications for change detection. J. Environ. Qual. 2003, 32, 278–286. [Google Scholar] [CrossRef] [PubMed]
- Don, A.; Schumacher, J.; Scherer-Lorenzen, M.; Scholten, T.; Schulze, E.-D. Spatial and vertical variation of soil carbon at two grassland sites: Implications for measuring soil carbon stocks. Geoderma 2007, 141, 272–282. [Google Scholar] [CrossRef]
- Wiesmeier, M.; Munro, S.; Barthold, F.; Steffens, M.; Schad, P.; Kögel-Knabner, I. Carbon storage capacity of semi-arid grassland soils and sequestration potentials in northern China. Glob. Chang. Biol. 2015, 21, 3836–3845. [Google Scholar] [CrossRef] [PubMed]
- Fan, S.; Guan, F.; Xu, X.; David, I.; Forrester, D.I.; Ma, W.; Tang, X. Ecosystem Carbon Stock Loss after Land Use Changing Subtropical Forests in China. Forests 2016, 7, 142. [Google Scholar] [CrossRef]
- Rodríguez-Murillo, J.C. Organic carbon content under different types of land use and soil in Peninsular Spain. Biol. Fertil. Soils 2001, 33, 53–61. [Google Scholar] [CrossRef]
- Conforti, M.; Lucà, F.; Scarciglia, F.; Matteucci, G.; Buttafuico, G. Soil carbon stocks in relation to soil properties and landscape position in a forest ecosystem in southern Italy (Calabria region). Catena 2016, 144, 23–33. [Google Scholar] [CrossRef]
- Bedison, J.E.; Scatena, F.N.; Mead, J.V. Influences on the spatial pattern of soil carbon and nitrogen in forested and non-forested riparian zones in the Atlantic coastal plain of the Delaware River Basin. For. Ecol. Manag. 2013, 302, 200–209. [Google Scholar] [CrossRef]
- Schilling, K.E.; Palmer, J.A.; Bettis, E.A.; Jacobson, P.; Schultz, R.C.; Isenhart, T.M. Vertical distribution of total carbon, nitrogen and phosphorus in riparian soils of Walnut Creek, Southern Iowa. Catena 2009, 77, 266–273. [Google Scholar] [CrossRef]
- Jobbàgy, E.G.; Jackson, R.B. The vertical distribution of soil organic carbon and its relation to climate and vegetation. Ecol. Appl. 2000, 10, 423–436. [Google Scholar] [CrossRef]
- Kalinina, O.; Goryachkin, S.V.; Lyuri, D.I.; Giani, L. Post-agrogenic development of vegetation, soils, and carbon stocks under self-restoration in different climatic zones of European Russia. Catena 2015, 129, 18–29. [Google Scholar] [CrossRef]
- Knoepp, J.D.; Barton, D.; Clinton, B. Riparian zones in southern Appalachian headwater catchments: Carbon and nitrogen responses to forest cutting. For. Ecol. Manag. 2009, 258, 2282–2293. [Google Scholar] [CrossRef]
- Cierjacks, A.; Kleinschmit, B.; Kowarik, I.; Graf, M.; Lang, F. Organic matter distribution in floodplains can be predicted using spatial and vegetation structure data. River Res. Appl. 2011, 27, 1048–1057. [Google Scholar] [CrossRef]
- Berhongaray, G.; Alvarez, R.; De Paepe, J.; Caride, C.; Cantet, R. Land use effects on soil carbon in the Argentine Pampas. Geoderma 2013, 192, 97–110. [Google Scholar] [CrossRef]
- Gabarrón-Galeote, M.A.; Trigalet, S.; van Wesemael, B. Effect of land abandonment on soil organic carbon fractions along a Mediterranean precipitation gradient. Geoderma 2015, 249–250, 69–78. [Google Scholar] [CrossRef]
- Myster, R.W. Comparing and contrasting flooded and unflooded forests in the Peruvian Amazon: Seed rain. N. Z. J. For. Sci. 2015, 45, 1–9. [Google Scholar] [CrossRef]
- Pereira, G.H.A.; Jordão, H.C.K.; Sivla, V.F.V.; Pereira, M.G. Litter and nutrient flows in tropical upland forest flooded by a hydropower plant in the Amazonian basin. Sci. Total Environ. 2016, 572, 157–168. [Google Scholar] [CrossRef] [PubMed]
- Cierjacks, A.; Kleinschmit, B.; Babinsky, M.; Kleinschroth, F.; Markert, A.; Menzel, M.; Ziechmann, U.; Schiller, T.; Graf, M.; Lang, F. Carbon stocks of soil and vegetation on Danubian floodplains. J. Plant Soil Sc. 2010, 173, 644–653. [Google Scholar] [CrossRef]
- Giese, L.A.B.; Aust, W.M.; Kolka, R.K.; Trettin, C.C. Biomass and carbon pools of disturbed riparian forests. For. Ecol. Manag. 2003, 180, 493–508. [Google Scholar] [CrossRef]
- Bayley, S.E.; Guimond, J.K. Aboveground biomass and nutrient limitation in relation to river connectivity in Montane floodplain marshes. Wetlands 2003, 29, 1243–1254. [Google Scholar] [CrossRef]
- Drouin, A.; Saint-Laurent, D.; Lavoie, L.; Ouellet, C. High-precision elevation model to evaluate the spatial distribution of soil organic carbon in active floodplains. Wetlands 2011, 31, 1151–1164. [Google Scholar] [CrossRef]
- Gervais-Beaulac, V.; Saint-Laurent, D.; Berthelot, J.-F. Organic carbon distribution in alluvial soils according to different flood risk zones. J. Soil Sci. Environ. Manag. 2013, 4, 169–177. [Google Scholar] [CrossRef]
- Saint-Laurent, D.; Mesfioui, M.; Evin, G. Hydroclimatic variability and relation with flood events (Southern Québec, Canada). Water Res. 2009, 36, 43–56. [Google Scholar] [CrossRef]
- Saint-Laurent, D.; Lavoie, L.; Drouin, A.; St-Laurent, J.; Ghaleb, B. Floodplain sedimentation rates, soil properties and recent flood history in southern Québec. Glob. Planet Chang. 2010, 70, 76–91. [Google Scholar] [CrossRef]
- CEHQ (Centre D’expertise Hydriques du Québec). Gouvernement du Québec. 2015. Available online: https://www.cehq.gouv.qc.ca/hydrometrie/historique_donnees/fiche_station.asp?NoStation=030205 (accessed on 10 December 2016).
- Cogesaf (Comité de Gestion du Bassin de la Rivière Saint-François). Analyse du Bassin Versant de la Rivière Saint-François. 2006. Available online: http://www.cogesaf.qc.ca/Analyse_web/Partie_1_ analyse.pdf (accessed on 12 May 2016).
- MER (Ministère de l’Énergie et des Ressources). Compilation de la Géologie du Quaternaire (1: 50,000). Service de la Géoinformation, Gouvernement du Québec; MER: Québec, QC, Canada, 1983.
- Lavoie, L.; Saint-Laurent, D.; St-Laurent, J. Analyse pédologique et sédimentologique des sols alluviaux et paléosols des terrasses d'inondation. Can. J. Soil Sci. 2006, 86, 1–14. [Google Scholar] [CrossRef]
- MDDELCC. Normales Climatiques du Québec 1981–2010. Gouvernement du Québec. 2015. Available online: http://www.mddelcc.gouv.qc.ca/climat/normales/sommaire.asp (accessed on 21 November 2016).
- EC-MENV (Environment Canada and Ministry of Environment). Flood Risk Map: Saint-François River Basin (Scales 1: 15,000, 1:10,000); Government of Canada and Government of Québec: Québec, QC, Canada, 1982.
- SAD (Schémas D’aménagement et de Développement). Affaires Municipales et Occupation du Territoire. Gouvernement du Québec. 2015. Available online: http://www.mamrot.gouv.qc.ca/amenagement-du-territoire/ (accessed on 10 June 2016).
- McKeague, J.A. Manual on Soil Sampling and Methods of Analysis, 2th ed.; Soil Research Institute: Ottawa, ON, Canada, 1978. [Google Scholar]
- Agriculture and Agri-Food Canada. CSSC (Canadian System of Soil Classification), 3rd ed.; Agriculture and Agri-Food Canada: Ottawa, ON, Canada, 1998; 187p.
- FAO (Food and Agriculture Organization). Universal Soil Classification. 2015. Available online: http://www.fao.org/soils-portal/soil-survey/soil-classification/universal-soil-classification/en/ (accessed on 13 October 2016).
- Yeomans, J.C.; Bremner, J.M. A rapid and precise method for routine determination of organic carbon in soil. Commun. Soil Sci. Plant Anal. 1988, 19, 1467–1476. [Google Scholar] [CrossRef]
- Zellweger Analytics Inc. Determination of Total Kjeldahl Nitrogen in Soil and Plants by Flow Injection Analysis. QuikChem Method 13-107-06-2D; Zellweger Analytics Inc.: Milwaukee, WI, USA, 1996. [Google Scholar]
- Carter, M.R.; Gregorich, J.M. Soil Sampling and Methods of Analysis, Canadian Society of Soil Science, Second Edition ed; Taylor and Francis Group: Boca Raton, FL, USA, 2006. [Google Scholar]
- Ross, G.J.; Wang, C. Extractable Al, Fe, Mn, Si. In Soil Sampling and Methods of Analysis; Carter, M.R., Ed.; Lewis Publishers: Boca Raton, FL, USA, 1993. [Google Scholar]
- Tremblay, S.; Ouimet, R.; Houle, D. Modèle Simple Pour Estimer la Quantité de Carbone Organique Dans Les Horizons Minéraux de sol Forestier à Partir de son Relevé Pédologique; Note de recherche forestière; Direction de la Recherche Forestière, Gouvernement du Québec: Chicoutimi, QC, Canada, 1995. [Google Scholar]
- Brady, N.C.; Weil, R.R. The Nature and Properties of Soils, 14th ed.; Prentice-Hall: London, UK, 2007. [Google Scholar]
- McKeague, J.A.; Brydon, J.E. Differentiation of Forms of Extractable Iron and Aluminum in Soils. Soil Sci. Soc. Am. J. 1971, 35, 33. [Google Scholar] [CrossRef]
- Iqbal, J.; Thomasson, J.A.; Jenkins, J.N.; Owens, P.R.; Whisler, F.D. Spatial variability analysis of soil physical properties of alluvial soils. Soil Sci. Soc. Am. J. 2005, 69, 1338–1350. [Google Scholar] [CrossRef]
- Curtin, D.; Trolove, S. Predicting pH buffering capacity of New Zealand soils from organic matter content and mineral characteristics. Soil Res. 2013, 51, 494–502. [Google Scholar] [CrossRef]
- Corre, M.D.; Schnabela, R.R.; Shaffer, J.A. Evaluation of soil organic carbon under forests, cool-season and warm-season grasses in the northeastern US. Soil Biol. Biochem. 1999, 31, 1531–1539. [Google Scholar] [CrossRef]
- Johnson, W.C. Tree recruitment and survival in rivers: Influence of hydrological processes. Hydrol. Process. 2000, 14, 3051–3074. [Google Scholar] [CrossRef]
- Penne, C.; Ahrends, B.; Deurer, M.; Böttcher, J. The impact of the canopy structure on the spatial variability in forest floor carbon stocks. Geoderma 2010, 158, 282–297. [Google Scholar] [CrossRef]
- Stinson, G.; Kurz, W.A.; Smyth, C.E.; Neilson, E.T.; Dymond, C.C.; Metsaranta, J.; Boisvenue, C.; Rampley, G.J.; Li, Q.; White, T.M.; et al. An inventory-based analysis of Canada’s managed forest carbon dynamics, 1990 to 2008. Glob. Chang. Biol. 2011, 17, 2227–2244. [Google Scholar] [CrossRef]
- Hart, P.B.S.; Clinton, P.W.; Allen, R.B.; Nordmeyer, A.H.; Evans, G. Biomass and macro-nutrients (above- and below-ground in a New Zealand beech (Nothofagus) forest escosystem: Implication for carbon storage and sustainable forest management. For. Ecol. Manag. 2003, 174, 281–294. [Google Scholar] [CrossRef]
- Frank, D.A.; Pontes, A.W.; McFarlane, K.J. 2 Controls on soil organic carbon stocks and Turnover among North American Ecosystems. Ecosystems 2012, 15, 604–615. [Google Scholar] [CrossRef]
- Inagakia, Y.; Miuraa, S.; Kohzub, A. Effects of forest type and stand age on litterfall quality and soil N dynamics in Shikoku district, southern Japan. For. Ecol. Manag. 2004, 202, 107–117. [Google Scholar] [CrossRef]
- Rieger, I.; Lang, F.; Kowarika, I.; Cierjacks, A. The interplay of sedimentation and carbon accretion in riparian forests. Geomorphology 2014, 214, 157–167. [Google Scholar] [CrossRef]
- Hazlett, P.W.; Gordon, A.M.; Sibley, P.K.; Buttle, J.M. Stand carbon stocks and soils carbon and nitrogen storage for riparian and upland forests of boreal lakes in northeastern Ontario. For. Ecol. Manag. 2005, 219, 56–68. [Google Scholar] [CrossRef]
- Saint-Laurent, D.; Gervais-Beaulac, V.; Bertelot, J.-S. Variability of soil properties in different flood-risk zones and link with hydroclimatic changes (Southern Québec, Canada). Geoderma 2014, 214–215, 80–90. [Google Scholar] [CrossRef]
- Rousseau, A.N.; Klein, I.M.; Freudiger, D.; Gagnon, P. Development of a methodology to evaluate probable maximum precipitation (PMP) under changing climate conditions: Application to southern Quebec. J. Hydrol. 2014, 519, 3094–3109. [Google Scholar] [CrossRef]
- Yagouti, A.; Boulet, G.; Vincent, L.; Vescovi, L.; Mekis, E. Observed changes in daily temperature and precipitation indices for Southern Québec, 1960–2005. Atmos. Ocean 2008, 46, 243–256. [Google Scholar] [CrossRef]
- Berthelot, J.-S.; Saint-Laurent, D.; Gervais-Beaulac, V. A comparison of the composition and diversity of tree populations along a hydrological gradient in floodplains. Forests 2015, 6, 929–956. [Google Scholar] [CrossRef]


| Sector | Minimum | Maximum | Mean | Standard Deviation | CV (%) | Coefficient of Skewness | Coefficient of Kurtosis |
|---|---|---|---|---|---|---|---|
| Coaticook | 0.70 | 5.66 | 2.93 | 1.43 | 0.49 | 0.10 | −1.10 |
| Drummondville | 0.81 | 4.80 | 2.00 | 0.97 | 0.48 | 2.09 | 5.75 |
| Eaton | 0.92 | 1.57 | 1.27 | 0.33 | 0.26 | −0.67 | - |
| Massawippi | 0.53 | 5.13 | 2.58 | 1.16 | 0.45 | 0.34 | −0.45 |
| Richmond | 0.17 | 4.60 | 1.71 | 0.76 | 0.44 | 1.13 | 3.65 |
| Sherbrooke | 1.51 | 2.16 | 1.80 | 0.33 | 0.18 | 0.91 | - |
| Windsor | 0.63 | 5.15 | 2.05 | 1.01 | 0.49 | 1.35 | 1.73 |
| Material Parental | Frequent Flood Zone (FFZ) | Moderate Flood Zone (MFZ) | No-Flood Zone (NFZ) (n = 33) |
|---|---|---|---|
| Recent Fluvial Deposits | Recent Fluvial Deposits | Glaciolacustrine, Ancient Fluvial Deposits, Remaining Tills | |
| Particle size (%) | |||
| Clay | 3.48 ± 3.59 | 2.39 ± 1.68 | 2.34 ± 3.57 |
| Sand | 52.79 ± 15.23 | 44.96 ± 14.88 | 51.89 ± 15.89 |
| Silt | 41.82 ± 15.06 | 52.65 ± 13.89 | 45.77 ± 14.23 |
| Bulk density (g·cm−3) | 0.96 ± 0.25 | 0.92 ± 0.36 | 1.12 ± 0.18 |
| pH (CaCl2) | 5.01 ± 0.67 | 4.58 ± 0.98 | 3.97 ± 0.74 |
| Soil organic carbon (%) | 2.29 ± 1.64 | 3.14 ± 1.39 | 3.83 ± 2.22 |
| Total soil nitrogen (%) | 0.18 ± 0.09 | 0.23 ± 0.09 | 0.26 ± 0.17 |
| C/N ratio | 13.75 ± 3.58 | 13.56 ± 2.59 | 15.92 ± 4.14 |
| C stock (t·ha−1) | 38.22 ± 10.40 | 40.27 ± 20.25 | 79.75 ± 29.47 |
| CEC (cmol·kg−1) | 8.94 ± 5.43 | 7.99 ± 6.28 | 4.02 ± 5.13 |
| Al + Fe (pyro.%) | 0.41 ± 0.27 | 0.66 ± 0.40 | 0.96 ± 0.55 |
| Litter thickness (cm) | 1.09 ± 1.33 | 2.38 ± 2.35 | 3.70 ± 2.64 |
| Comparison Between the Three Zones | Average a | p-Value b | |||||||
|---|---|---|---|---|---|---|---|---|---|
| Soil Surface (0–20 cm) and Litter | FFZ | MFZ | NFZ | FFZ | MFZ | NFZ | FFZ | MFZ | NFZ |
| pH | 5.01 | 4.58 | 3.97 | 0.0001 ** | 0.0000 ** | 0.0000 ** | |||
| %SOC | 2.29 | 3.14 | 3.83 | 0.0000 ** | 0.0000 ** | 0.1928 * | |||
| %TN | 0.18 | 0.23 | 0.26 | 0.0001 ** | 0.0000 ** | 0.9916 * | |||
| C/N ratio | 13.75 | 13.56 | 15.92 | 0.9210 * | 0.0000 ** | 0.0000 ** | |||
| %Al + Fe | 0.41 | 0.66 | 0.96 | 0.0231 ** | 0.0000 ** | 0.0327 ** | |||
| Bulk density (g·cm−3) | 0.96 | 0.92 | 1.12 | 0.1854 * | 0.0007 ** | 0.0001 ** | |||
| C stock (t·ha−1) | 38.22 | 40.27 | 79.75 | 0.0057 ** | 0.0001 ** | 0.5548 * | |||
| Litter thickness (cm) | 1.09 | 2.38 | 3.70 | 0.0001 ** | 0.0000 ** | 0.0305 ** | |||
© 2017 by the authors. Licensee MDPI, Basel, Switzerland. This article is an open access article distributed under the terms and conditions of the Creative Commons Attribution (CC BY) license (http://creativecommons.org/licenses/by/4.0/).
Share and Cite
Saint-Laurent, D.; Gervais-Beaulac, V.; Paradis, R.; Arsenault-Boucher, L.; Demers, S. Distribution of Soil Organic Carbon in Riparian Forest Soils Affected by Frequent Floods (Southern Québec, Canada). Forests 2017, 8, 124. https://doi.org/10.3390/f8040124
Saint-Laurent D, Gervais-Beaulac V, Paradis R, Arsenault-Boucher L, Demers S. Distribution of Soil Organic Carbon in Riparian Forest Soils Affected by Frequent Floods (Southern Québec, Canada). Forests. 2017; 8(4):124. https://doi.org/10.3390/f8040124
Chicago/Turabian StyleSaint-Laurent, Diane, Vernhar Gervais-Beaulac, Roxane Paradis, Lisane Arsenault-Boucher, and Simon Demers. 2017. "Distribution of Soil Organic Carbon in Riparian Forest Soils Affected by Frequent Floods (Southern Québec, Canada)" Forests 8, no. 4: 124. https://doi.org/10.3390/f8040124