
REDD+ Contribution to Well-Being and Income Is Marginal: The Perspective of Local Stakeholders
by
 ,
,
William D. Sunderlin
1,*, 
Claudio De Sassi
1,2,
Andini Desita Ekaputri
3,
Mara Light
4 and
Christy Desta Pratama
5 1
Center for International Forestry Research, Jalan Cifor, Situ Gede, Bogor Barat, Jawa Barat 16115, Indonesia
2
Swiss Federal Office for the Environment, Worblentalstrasse 68, 3063 Ittigen, CH-3003 Bern, Switzerland
3
Indonesian Institute of Sciences, Jalan Gatot Subroto No.10, Jakarta Selatan 12710, Indonesia
4
Fireman Hospitality Group, 310 Greenwich Street, New York, NY 10013, USA
5
Conservation Strategy Fund, Sahid Sudirman Center, 11th Floor, Suite 11A. Jalan Jendral Sudirman 86, Jakarta 10220, Indonesia
*
Author to whom correspondence should be addressed.
Forests 2017, 8(4), 125; https://doi.org/10.3390/f8040125
Submission received: 2 February 2017
/
Revised: 15 March 2017
/
Accepted: 23 March 2017
/
Published: 19 April 2017
Abstract
:In addition to being a global strategy for reducing greenhouse gas emissions from tropical deforestation, Reducing Emission from Deforestation and Degradation (REDD+) intends to protect and improve the well-being and income of local stakeholders. The intention is to provide livelihood support in exchange for local stakeholder involvement in protecting forests. Eleven years after the launch of REDD+ at COP 11 in Montreal, the degree of success in meeting well-being and income goals is examined in six countries (Brazil, Peru, Cameroon, Tanzania, Indonesia, Vietnam) at 22 initiatives, 149 villages, and approximately 4000 households through a counter-factual approach. Half the villages and households are inside and half are outside the sphere of REDD+. Measurements are made at two points in time (2010–2012, and 2013–2014). This paper focuses on measurement of the subjective perception of local stakeholders. The study finds that REDD+ has not contributed significantly to perceived well-being and income sufficiency, in spite of the fact that most households have not only engaged with REDD+ interventions, but view them favorably. REDD+’s limited achievement to date is due to unavailability of funding, among other obstacles. Recommendations are made for enhanced attention to well-being and income sufficiency in the event that REDD+ eventually takes off.
1. Introduction
Climate change is a grave environmental crisis that threatens to undermine ecological stability, food production, economic growth, and stability of governance across the globe in coming decades [1]. The forest sector is a crucial part of the problem, with land use conversion accounting for 12% of annual greenhouse gas emissions in the period 2000 to 2009 [2] (p. 825). The forest sector is also the source of one of the most promising early frontline approaches to mitigate climate change through efforts to reduce tropical deforestation and forest degradation, and to enhance forest cover, commonly known as REDD+. A core idea in REDD+ has been to create a system of conditional, performance-based incentives whereby people living in and near forests are rewarded for keeping forests standing and/or for enhancing forest cover [3] (p. xii), [4] (p. 381). By creating a large stream of funding, REDD+ has intended to pay for the opportunity costs of foregone forest conversion and greatly reduce forest-based greenhouse gas emissions [5].
Does this mean that REDD+ will inevitably protect and/or increase the well-being and income of local stakeholders who are involved in the program? This is not a foregone conclusion, for two reasons.
First, REDD+ has had difficulty moving from the “readiness” phase to the delivery of conditional, performance-based incentives. Across all REDD+ sub-national initiatives, only 26% were selling forest carbon credits in 2014 [6] (p. 149). A key obstacle to REDD+ moving forward as originally planned has been lack of funding [7] (p. 2). However, in spite of this, there has been substantial effort by REDD+ proponents toward livelihood support. The reason is that, in practice, REDD+ incorporates a wide range of interventions, including non-conditional livelihood enhancements. Most REDD+ sub-national initiatives are elaborations of a pre-existing integrated conservation and development project (ICDP) at the same site [8] (p. 27), an approach to stopping deforestation widely applied in the 1980s and 1990s [9,10,11]. In ICDP, local stakeholders are provided an alternative livelihood to compensate them for reduced clearing of forests or reliance on forest resources. This tandem of incentive and disincentive is essential to how REDD+ operates on the ground. This is true not just at the many pre-existing ICDPs that have taken on board the REDD+ innovation, but also at initiatives that began as REDD+. Why have so many ICDPs re-geared themselves as REDD+? It is likely they did so to gain access to promised REDD+ funding to support their conservation efforts, and it is likely that some wanted to apply the idea of performance-based incentives to see if this provided greater leverage toward realizing their conservation goals. In addition to the incentives and disincentives just mentioned, REDD+ initiatives deploy other interventions that can potentially affect well-being and income—among them: tenure clarification, forest enhancement, and environmental education.
Second, on the one hand, as explained by Lawlor et al. [12] (p. 3), “the well-being of forest people may be integral to the overall success of programs in reducing deforestation”. On the other hand, as explained by Campbell [13] (p. 397), “While all agree that emissions reductions must be effective and efficient, there is less consensus on whether REDD should be pro-poor or merely designed to not harm the poor”. Indeed, there is an enormous difference between improving well-being and doing no harm. Furthermore, at least in principle, it cannot be taken for granted that REDD+ can assure that there will be no harm. It is useful to conduct a brief review of the factors that promote attention to income and well-being in REDD+, and the factors that make this goal elusive.
There are some clear reasons why the implementation of REDD+ could lead to protection and enhancement of the income and well-being of local stakeholders. As noted above, a reward system to local stakeholders (whether conditional or non-conditional) is the heart and soul of the REDD+ idea. Wunder [14] (p. 279), commenting on the development of payments for environmental services, remarked optimistically that: “… there is good reason to believe that poor service providers can broadly gain access to (PES) schemes, and generally become better off from that participation, in both income and non-income terms”. It is not just the fulfillment of economic and/or conservation goals that motivates REDD+ proponents to pay attention to the well-being of local stakeholders. Many REDD+ organizations are non-governmental organizations that are as ideologically committed to poverty alleviation, cultural survival, and rights as they are to environmental conservation. Furthermore, the fulfillment of the interests of local stakeholders is driven not just by proponent organizations, but also by external third-party certification schemes such as Climate, Community & Biodiversity Alliance (CCBA) and Verified Carbon Standard (VCS) [15,16], and by organizations committed to applying social safeguards in REDD+ [17,18]. Social safeguards for REDD+, codified in the Cancun Agreement of the United Nations Framework Convention on Climate Change [19] stipulate that no harm is the mandatory minimum requirement for REDD+, while allowing enhancement of well-being to be an aspirational choice [16] (p. iv), [20] (p. 654).
Yet for all of the factors that appear to promise attention to the interests of small-scale local stakeholders, there are others that make it difficult to realize this objective. A large percentage of local stakeholders rely on agriculture and forest clearing for their livelihoods, so restrictions on forest access and conversion (the disincentive in REDD+) present a direct threat to their income and well-being [5] (pp. 1–8), [21] (p. 432). Worries of local stakeholders about the potential effect of REDD+ on income has been documented [22]. The reward system in REDD+ must be large, stable, and durable enough to adequately offset loss of forest income, especially when there are competing options. Referring to REDD+ in Ghana, Campbell [13] (p. 397) remarked that “Smallholders will not opt for REDD if it means that they cannot expand their fields, unless carbon prices are very high and cocoa prices are very low”. In various villages in Indonesia, REDD+ income cannot compete with higher income offered by oil palm developers, and local stakeholders willingly opt for the latter [23] (p. 346) [24] (p. 394). Mahanty et al. [25] (p. 38) have documented cases where REDD+ payments were well below the opportunity costs faced by participants over the life of the scheme, threatening to diminish positive impacts on local livelihoods and undermine the stability of the schemes. REDD+ proponent efforts to increase local incomes and well-being face many daunting challenges, including claims made on local forests made by neighboring villagers, migrants, and large businesses [26,27]; a difficult institutional and governance environment with unclear tenure [28], corruption [29,30], and insufficient national-level support and coordination [31]; and not least, the failure of a robust market in forest carbon offsets to materialize and the decline in funding for REDD+ in recent years [7,8].
In this paper, we ask: Has REDD+ in fact, from the perspective of local stakeholders, succeeded in protecting and improving the well-being and income of local stakeholders? We conduct this study through the approach of measuring subjective well-being (SWB), which is to say, by asking local stakeholders to evaluate the status of their well-being overtime. The SWB approach has been defined as recording “… evaluations, positive and negative, that people make of their lives and the affective reactions … to their experiences; it includes first and foremost measures of how people experience their life as a whole” [32] (p. 10).
The SWB approach has grown rapidly since the mid-1990s, with implementation at the national and international levels [33] (p. 3), [34] (p. 1), [35] (p. 1), [36] (pp. 2–3). The approach has been validated in part through the strong correlation of SWB measures with objective well-being indicators such as income, individualism, human rights, and equality [37] (p. 851) [38], (pp. 68–69) and through test–retest correlations [34] (p. 9), and has been judged to meet the basic standard of “fitness for purpose” [32] (p. 12).
We have chosen to use this approach for four reasons. First and foremost, we believe there is inherent high value in the opinions of respondents about their life circumstances and why they change. We agree with the view that the approach is democratic because it grants respect to what people think and feel about their lives [38] (p. 64), [35] (p. 4). Moreover, SWB data confer an invaluable perspective that is not available through objective data [39]. Second, the SWB data can be paired with our objective data for comparison, contrast, and mutual corroboration. SWB data provide an external check on economic indicators [33] (p. 4). Third, SWB data allow us to understand the drivers of quality of life changes [40] (p. 16), [32] (p. 13). Lastly, the SWB approach provides the widest possible template (completely open-ended question about what matters in quality of life) for measuring whether REDD+ is or is not important in people’s lives.
In our study, we ask household respondents to specify the direction of change of their well-being and (separately) income sufficiency in the two years prior to the interview; in the case of well-being, we ask those respondents who have answered “better” or “worse” to explain the reasons for their well-being change.
The following three questions are subordinate to our overarching inquiry:
- How have perceived well-being and income sufficiency changed over time in intervention and control households?
- What explains the change in perceived well-being in intervention and control households?
- What are the perceived impacts of REDD+ interventions on the well-being of intervention households?
By “intervention households” we mean those that are subject to the intention to treat by proponent organizations in REDD+ intervention villages. Control households are those in non-REDD+ control villages—out of the reach of the intention to treat by REDD+ proponent organizations. This definition holds for questions 1 and 2. In question 3, we narrow our attention to those households in intervention villages that have actually been engaged with specific REDD+ interventions. The types of interventions under study are seen not just in REDD+ intervention but also in the control villages, however they are deployed far more intensively in intervention as compared to control villages [41].
In question 1, we ask both about well-being and income sufficiency because, while closely related, they are not identical, and it is important to distinguish one from the other. (See our definitions of both terms in the methods section.) Gathering data on both enables us to compare and contrast them.
Question 2 enables us to identify and measure all reasons for well-being change over time—not just those related to REDD+. This approach provides a metric for knowing the true relevance of REDD+ against the widest possible backdrop.
Question 3 allows us to drill down and specify which particular kinds of REDD+ interventions have a positive or negative effect on the well-being of intervention households.
The paper includes the following sections: sample and methods, results (answers to the subordinate and primary questions), discussion of the results, and conclusions and recommendations.
2. Sample and Methods
This study was carried about by the module on subnational initiatives of the Global Comparative Study on REDD+ (GCS), Center for International Forestry Research (CIFOR). The aim of the field research was to evaluate the performance of REDD+ subnational initiatives on the basis of 3E+ criteria (effectiveness, efficiency, equity, and protection and enhancement of livelihoods, tenure rights, and biodiversity). The counterfactual method used is “before–after/control–intervention” (BACI), constructed to fit a “difference in difference” (DiD) design for analysis and impact evaluation.
The GCS approach to DiD analysis is elaborated in Jagger et al. [42], and the broader technical guidelines of the study are explained in Sunderlin et al. [6]. A test on the suitability of the BACI method, and in particular of the GCS sample to examine REDD is given in Sills et al. [43].
The research was done in six countries (Brazil, Peru, Cameroon, Tanzania, Indonesia, Vietnam) that were selected purposively. The justification for this set of countries is that they are among the key tropical forest countries, including those that have a lead role in pioneering REDD+ (Brazil, Indonesia). We sought a balance across the three main tropical regions (Latin America, Africa, Asia), and aimed for diversity in the forest transition (e.g., high deforestation in Indonesia and stable forest cover in Vietnam). We sought countries where there was strong donor interest (e.g., Norway investment in Brazil, Tanzania, Vietnam) and where CIFOR had offices (Brazil, Peru, Cameroon, Indonesia, Vietnam).
In those countries, we collected data for the DiD analysis at 22 initiative sites, encompassing 149 villages and over 4000+ households. Approximately half the villages and households are within the sphere of REDD+ (intervention) and half outside (control). The initiatives were chosen purposively on the basis of six criteria [6] (pp. 19–21); the villages were selected through an approach that combined purposive criteria, random sampling, and statistical matching of intervention and control [6] (pp. 21–28); and households (30 in each intervention and control village) where chosen through simple random sample at 13 sites, and through stratified random sample at three [6] (pp. 28–29). The statistical matching of villages was done on the basis of 22 key characteristics (with data obtained from secondary sources, key informant interviews, and rapid rural appraisal surveys) and aimed to identify matched samples of intervention and control villages, which were, on average, similar (or balanced) in terms of those characteristics. Both household-level and village-level data were collected at 17 “intensive” sites, whereas only village-level data were collected at five “extensive” sites [6] (p. 27).
Of the total GCS sample of 23 sites, including one not included in this paper (In this paper we exclude one site (Bolsa Floresta in Brazil) because it had already begun at the time of the Phase 1 research and could therefore not be included in a “before–after” comparison), 17 are private (of which 13 are non-profit and four are for-profit); six are public; 12 are located (at least partly) in a protected area; 11 are seeking or have third party carbon certification; 18 are seeking to sell forest carbon credits and four have begun to do so; eight have introduced conditional rewards of all kinds (i.e., not just those related the carbon market); and the area of the 23 sites is 47% of the total world area of REDD+ initiatives [6] (p. 148). Through comparison with the ID-RECCO global data on subnational initiatives [8], we determined that the GCS sample is “a reasonable if imperfect representation of the wider universe of subnational REDD+” [6] (p. 154). The location of the 22 sites included in this paper is shown in Figure 1.
The field research focuses on the activities of small-scale local actors in spite of the fact that large-scale actors have had a dominant role in tropical deforestation in recent decades [44]. This approach is justified because REDD+ at the subnational level places emphasis on changing the behavior of small-scale actors, and the reward stream of REDD+ is rightly targeted at smallholders. This study is limited to evaluating the effort of REDD+ proponents in addressing the well-being and income of small-scale local stakeholders.
The field research was done in two phases. The “before” data (prior to the introduction of REDD+ conditional incentives) were collected in the first phase (2010–2012) and the “after” data in the second phase (2013–2014). Data were collected in 150 villages in the first phase and in 149 villages during the second phase. (One village in Tanzania chose not to cooperate in the second phase.) A total of 4183 households were surveyed in the first phase and 3988 households in the second phase. Some households were lost in the second phase due to attrition, and were partially replaced [6] (pp. 94–95).
The data presented in this paper are drawn almost wholly from the survey of households, limited to 17 of the 22 sites. The village survey data (all 22 sites) are used to supply a part of the answer to question 2 (see below).
We now supply the details on the data sources and approach to answering each of the three subordinate research questions.
2.1. Question 1: How Have Perceived Well-Being and Income Sufficiency Changed over Time in Intervention and Control Households?
In the household survey, we asked “Overall, what is the well-being of your household today compared with the situation two years ago?” Three closed-option responses were possible: “better off now”; “about the same”; or “worse off now”. We defined “well-being” broadly as “the state of being happy, healthy and prosperous” [45]. We asked “Has your household’s income over the past two years been sufficient to cover the needs of the household?” Three closed-option responses were possible: “yes”; “reasonable (just about sufficient)”; or “no”. We defined “income” as the aggregate of production and cash income of the household.
In conducting the analysis for question 1, we were faced with a dilemma. Should we display the results on the basis of all three possible answers (more complete, rich in detail, and makes evident whether the extremes change as a result of each other or modification of the middle category, but can be overly complex). Or should we display the answers on the basis of a count of the positive (“better off”, “yes”) responses (more simple and intuitive, but sacrifices some of the detail). We decided on the first option for the tabular results (Table 1 below) and on the second option for the graphical results (Figure 2 below), as the graphical interpretation of changes over three levels would be unnecessarily difficult. In spite of this dissimilarity of the two representations of the results, they draw from the same data, say essentially the same thing, and are compatible with each other.
2.2. Question 2: What Explains the Change in Perceived Well-Being in Intervention and Control Households?
Those respondents who answered “better off now” to the question about well-being (see above) were asked to state the main reasons why the household is better-off now compared to two years ago. Those who answered “worse-off now” were asked to state the main reasons why the household is worse-off now. Up to three answers were allowed for each household. Note that we only sought to know the reasons for well-being change, and not for change in the sufficiency of income.
The enumerators were instructed to avoid any prompting of answers about REDD+. We sought to understand all explanations for changes in perceived well-being, not just those concerning REDD+. If the enumerator suspected an answer might concern REDD+ but it was not clear, it was permitted to ask a clarifying question.
In order to interpret our results on perceived income sufficiency change, we make reference to various kinds of survey data that provide contextual indicators. These data are net annual income of the households in the 12-month period prior to the interview; village data on access to piped water, hygienic services (type of toilet), electricity, cooking fuel used, schools, health facilities, improved roads; phone service; and the condition of the house owned by the respondent household.
2.3. Question 3: What Are the Perceived Impacts of REDD+ Interventions on the Well-Being of Intervention Households?
Prior to the beginning of the second phase of research, we identified all specific forest conservation interventions being implemented in both control and intervention villages. We classified these interventions into the following categories: restrictions on forest access and/or conversion; forest enhancement; non-conditional livelihood enhancement; conditional livelihood enhancement; environmental education; tenure clarification; and other intervention. In the household survey carried out in the second phase, we asked respondents: “What is your evaluation of the effect of (name of intervention) on the well-being of your household?” Six closed option responses were possible: “very negative”; “negative”; “no effect”; “positive”; “very positive”; or both negative and positive”. In this paper, we limit ourselves to forest conservation interventions implemented in the name of REDD+, and present only data on intervention households.
2.4. Data Analysis
All regression analyses were carried out in R [46], using the glmer function in the lme4 package [47] for non-linear mixed effect models. All models were fitted with a yes/no response variable predicted by intervention status, time period and their interaction as fixed effects and binomial error. Country-level models were fitted with initiative site and village as nested fixed effects. Pooled models also included country as an additional nested random effect. The DiD analysis is based on only 16 sites, as we excluded one site in Brazil (Jari/Amapá) for which we have no control households.
3. Results
3.1. Question 1: How Have Perceived Income and Well-Being Changed over Time in Intervention and Control Households?
Table 1 shows change in the perceived well-being and income sufficiency from phase 1 to phase 2 at control and intervention households at the aggregate level (pooled) and by country, specified by three closed-option responses. Significant changes (at the 5% level) are indicated by a minus sign (“−“) or a plus sign (“+”).
The pooled results (aggregate results of all countries) show that there was no significant change in perceived well-being, but there was significant improvement in perceived income sufficiency. (See the “Before–After” line.) However, the perceived well-being and income sufficiency were higher in intervention households in phase 1, possibly reflecting a selection bias in the proponents’ choice of villages to include in their REDD+ intervention areas. (See the “baseline C/I” line).
This demonstrates the importance of both pre-matching the sample on observable characteristics and analyzing changes from baseline (or “differences”) in order to net out any unobservable time-invariant characteristics. If we had not examined differences, then we may have incorrectly attributed the higher well-being and income sufficiency among intervention households to the REDD+ intervention, rather than to selection into REDD+. By analyzing differences in differences in a matched sample, we show that REDD+ has no significant influence on the underlying trend of improvements in perceived well-being and income sufficiency over time. (See the BACI line.)
Looking at country-specific results, we see a wide diversity. Peru and Brazil show a significant worsening in perceived well-being (Before–After) whereas the other countries do not. All countries, with the exception of Vietnam, show improved perceived income sufficiency (Before–After), as indicated by “insufficient” decreasing or “sufficient” increasing. In the smaller country samples, we only detect possible well-being selection bias (intervention households with higher perceived well-being scores in the before phase) in Vietnam, whereas income sufficiency is higher among intervention households at baseline in both Cameroon and Vietnam (see “baseline C/I” lines). Significant effects of REDD+, indicated as a change over time in intervention areas compared to their control, can be seen only in the case of Tanzania, with “worse off” and “insufficient” both decreasing.
Figure 2 shows the percent change in perceived well-being and income sufficiency from phase 1 to phase 2 at control and intervention households at the aggregate level (pooled) and by country, specified by change in positive responses (“better off”, “yes” (income sufficiency)). At the aggregate (pooled) level, the positive change of income sufficiency over time is not matched by a similar change in perceived well-being. Across the countries, we see that there is a general tendency for perceived well-being and income sufficiency to change in the same direction, with the exception of Brazil, and to a smaller extent Cameroon and Vietnam. The cases of uniformly positive change (for both well-being and income sufficiency, and both control and intervention) are Tanzania and Indonesia. The mixed cases (both increase and decrease for either well-being or income sufficiency, or for control or intervention) are Brazil, Cameroon, and Vietnam. The only case of uniformly negative change (for both well-being and income sufficiency, and both control and intervention) is Peru.
3.2. Question 2: What Explains the Change in Perceived Income and Well-Being in Intervention and Control Households?
Figure 3 shows the top ten reasons for perceived improved well-being in phase 2 in both control and intervention households. We decided to combine the responses of both control and intervention households because REDD+ did not figure in the top ten reasons (if looking at intervention households only), because REDD+ does not have a significant bearing on the difference between control and intervention (see results for question 1), and to maximize the sample and the robustness of the results. These responses encompass about 60% of all 3547 reasons offered.
The most frequent reasons are “Income, assets, savings, capital are adequate or increased or secure” (490 responses), followed by “Good/increased/stable income from agriculture” (401 responses). The importance of agricultural income is easily understandable given that households in both control and intervention households tend to be dependent on agriculture for their livelihoods. Occupying third, fourth, and fifth positions respectively are “Good/better health/illness overcome” (169); “Able to buy/build own house or improve condition of house or housing” (n = 155); and “Got (new/additional/different) employment or income/increased work opportunities” (n = 145). Rounding out the top ten with approximately the same scores are “Increased size of household labor force” (n = 123); “Education or training gotten or accessible” (n = 113); “Good/increased service or support from government” (n = 113); “Family harmony/togetherness” (n = 108); and “Children now (increasingly) grown/independent” (n = 103).
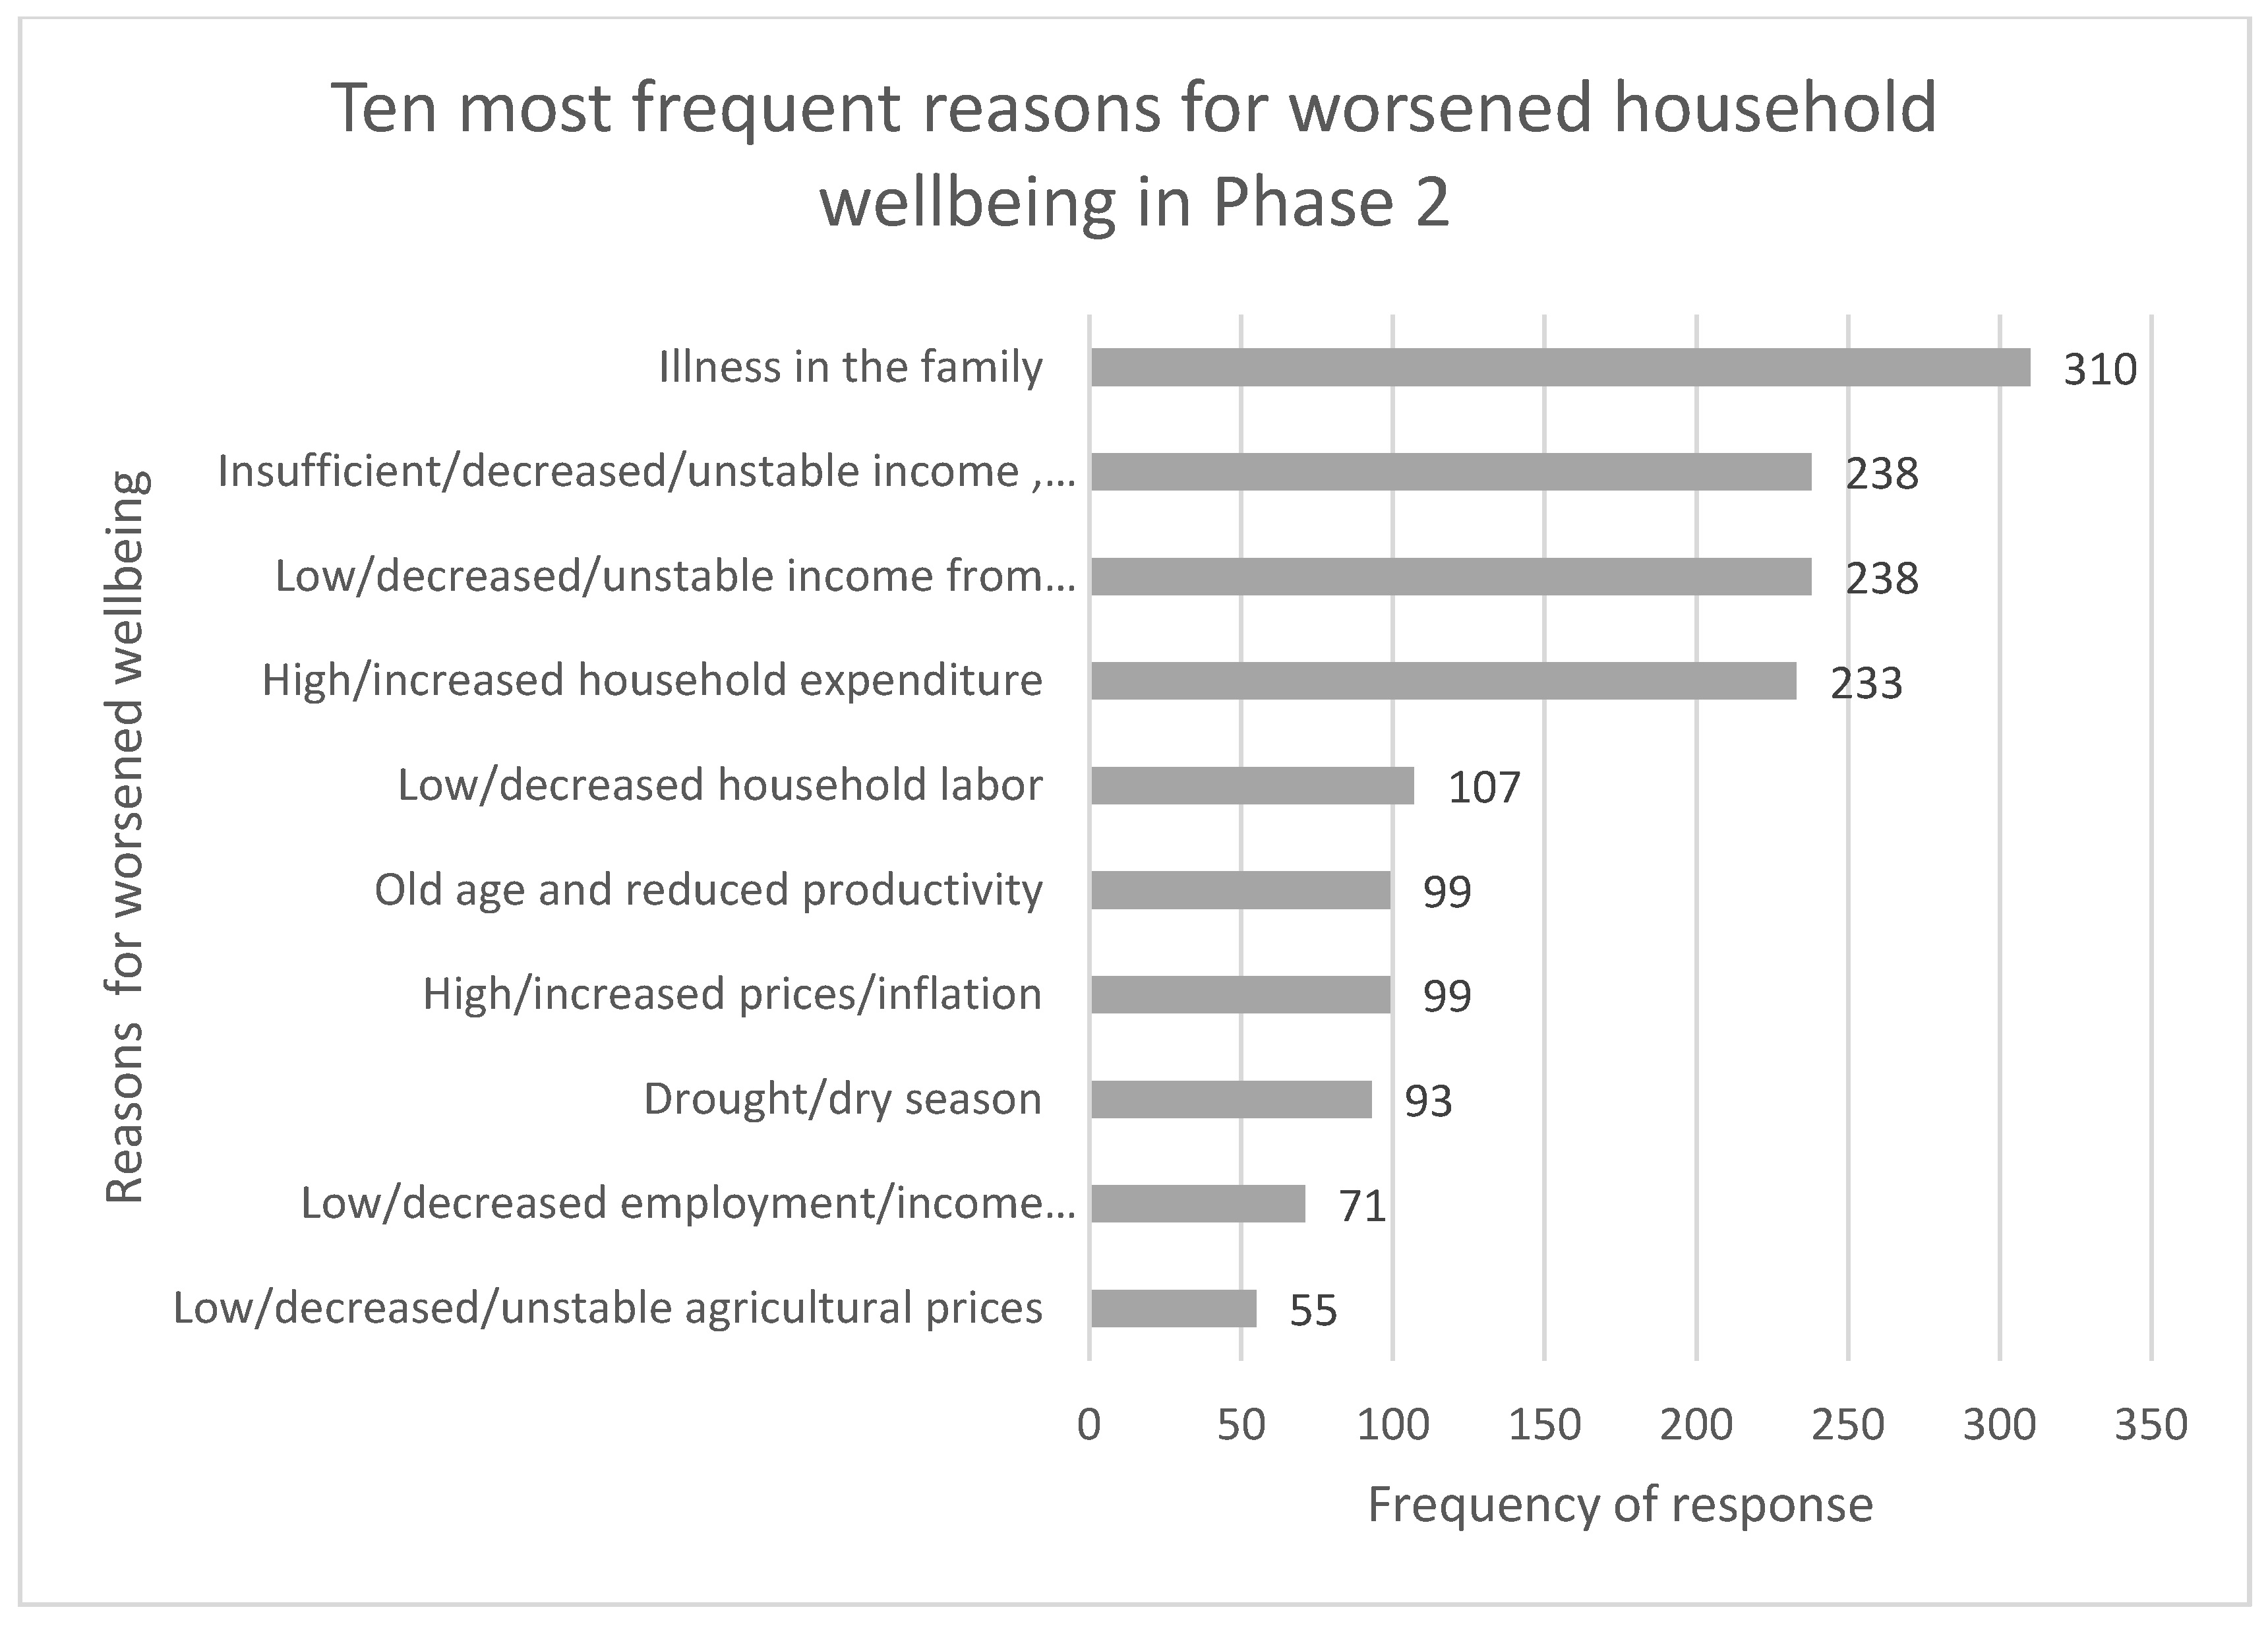
Figure 4 shows the top ten reasons for perceived worsened well-being in phase 2 in both control and intervention households. These responses encompass about 60% of the 2377 reasons given.
The most frequent response is “Illness in the family” (n = 310), followed by “Insufficient/decreased/unstable income, assets, or savings” and “Low/decreased/unstable income from agriculture” (n = 238 for both). Note that these two reasons mirror the top two reasons for perceived improved well-being. The next most frequent reason is “High/increased household expenditure” (n = 233), which refers to expenditure burdens unrelated to price increases or inflation (see below). Rounding out the top reasons are “Low/decreased household labor” (n = 107); “High/increased prices/inflation” and “Old age and reduced productivity” (n = 99 for both); “Drought/dry season” (n = 93); “Low/decreased/unstable income from agriculture” (n = 71); and “Low/decreased/unstable agricultural prices” (n = 55).
Given that REDD+ does not figure in the top ten reasons for perceived change in well-being, we dug into the data to better understand REDD+’s role.
Only 65 (1.8%) of the 3547 reasons for perceived improved well-being are related to REDD+. The top reason given is “Good/increased service or support from REDD+” (14 responses). The other reasons given are more specific, for example, REDD+’s role in providing or improving income, assets, savings, or capital; in providing or increasing income in agriculture, animal husbandry, fishing or aquaculture; in assisting with support from the government, in helping to improve or stabilize agricultural prices, or to making education or training accessible.
Only 34 (1.4%) of the 2377 reasons for perceived worsened well-being are related to REDD+. Most of the responses referred to restricted access to forests and prohibition against the conversion of forests to non-forest uses, with consequent decreasing income from forest resources, agriculture, and in one case, from fisheries. Two responses held REDD+ accountable for “Insufficient/decreased/unstable income, assets, or savings” and one for having a role in causing a drought.
3.3. Question 3: What Are the Perceived Impacts of REDD+ Interventions on the Well-Being of Intervention Households?
Table 2 shows the impact of specific REDD+ intervention types on perceived well-being in all intervention households. Of the total 2118 phase 2 intervention households, 1511 or 71.3% were subject to and involved in at least one of the interventions reported in this table.
The assessment of the impact of REDD+ is, on the whole, favorable, with a “positive” assessment accounting for almost 50% of the total across all types of interventions. The approval is even higher if we join “positive” and “very positive” together. By contrast, the joint “negative” and “very negative” scores across all intervention types falls short of 10%. Restricting our view to the “positive” assessment, the ranking of the interventions from most to least positive is forest enhancement (66.2%); conditional livelihood enhancement (57.2%); tenure clarification (53.8%); environmental education (47.8%); non-conditional livelihood enhancement (47.1%); restrictions on forest access and conversion (37.5%); and other interventions (34.7%). It makes sense that restrictions on forest access and conversion would have a low rating given the potential effects on household well-being. (Recall that the few negative appraisals of REDD+ in response to question 2 concern these restrictions.) This notwithstanding, the positive assessments of this intervention far exceed the negative assessments. This is because the restrictions are sometimes directed at outsiders (e.g., neighboring villagers, companies), rather than the respondent household.
If we look at the appraisal of the impact of all interventions on household well-being differentiated by country (see Appendix C), the view is, by and large, strongly positive. The joint positive assessment (“positive” and “very positive”) exceeds 50% in all countries with the exception of Brazil. This less positive appraisal of REDD+ interventions in Brazil is because, in that country, restrictions on forest access and conversion are widely applied and more directly restrict household income opportunities by reducing the ability to clear forests, and are therefore a potential threat to the fulfillment of social safeguards [48].
4. Discussion
On the basis of the answers to the subordinate research questions, we can now address the over-arching question, which was: “Has REDD+ in fact succeeded in protecting and improving the well-being and income of local stakeholders?” On the basis of the SWB approach and data, by and large, the answer is no.
We have seen that REDD+ has not significantly increased either perceived well-being or income sufficiency at the aggregate level, and at the country level, only the Tanzania households have been affected positively (with respect to perceived well-being) (Table 1 and Figure 2). The SWB analysis is corroborated by our preliminary quantitative analysis of net household income change, which finds that at most of our initiative sites, changes attributable to REDD+ were negligible when viewed against the much larger temporal effect [49]. Across all households (control and intervention), there has not been a significant increase in perceived well-being, but there has been a significant increase in perceived income sufficiency—again, not attributable to REDD+. This too is corroborated by our preliminary analysis of net household income change, which finds an increase in income unrelated to REDD+ in most countries and at the aggregate level [49]. REDD+ intervention households have a “head start” in the sense that they have higher well-being and income sufficiency scores in the “before” phase, meaning before REDD+ initiatives started any activities on the ground.
By and large, the reasons for perceived improvement and worsening household well-being have almost nothing to do with REDD+ (Figure 3 and Figure 4). This finding risks distorting and obscuring the role of REDD+, because in fact 71.3% of all intervention households have been exposed to REDD+, and on the whole they have a very positive view of the interventions carried out (Table 2 and Appendix C).
We now turn our attention to three questions raised by the results: (1) What explains the significant improvement in income sufficiency across all households (control and intervention)?; (2) What explains the “head start” of intervention over control households?; and (3) Why has the impact of REDD+ been so low in spite of being underway for a decade and so many households being involved in REDD+ interventions?
4.1. What Explains the Significant Improvement in Perceived Income Sufficiency across All Households (Control and Intervention)?
In the period 1990 to 2015, there has been dramatic progress toward meeting the Millennium Development Goals. In that period, about 1 billion people worldwide rose out of extreme poverty. The extreme poverty rate declined from almost 50% to 14%, under-nourishment declined from 23.3% to 12.9%, the child mortality rate declined from 90 to 43 per 1000 live births, the literacy rate for people aged 15–24 increased from 83% to 91%, the share of people with access to clean water and sanitation has risen, and the incidence of preventable diseases such as AIDS, malaria, and tuberculosis has fallen [50] (pp. 4–7) [51] (pp. xv, 3–4).
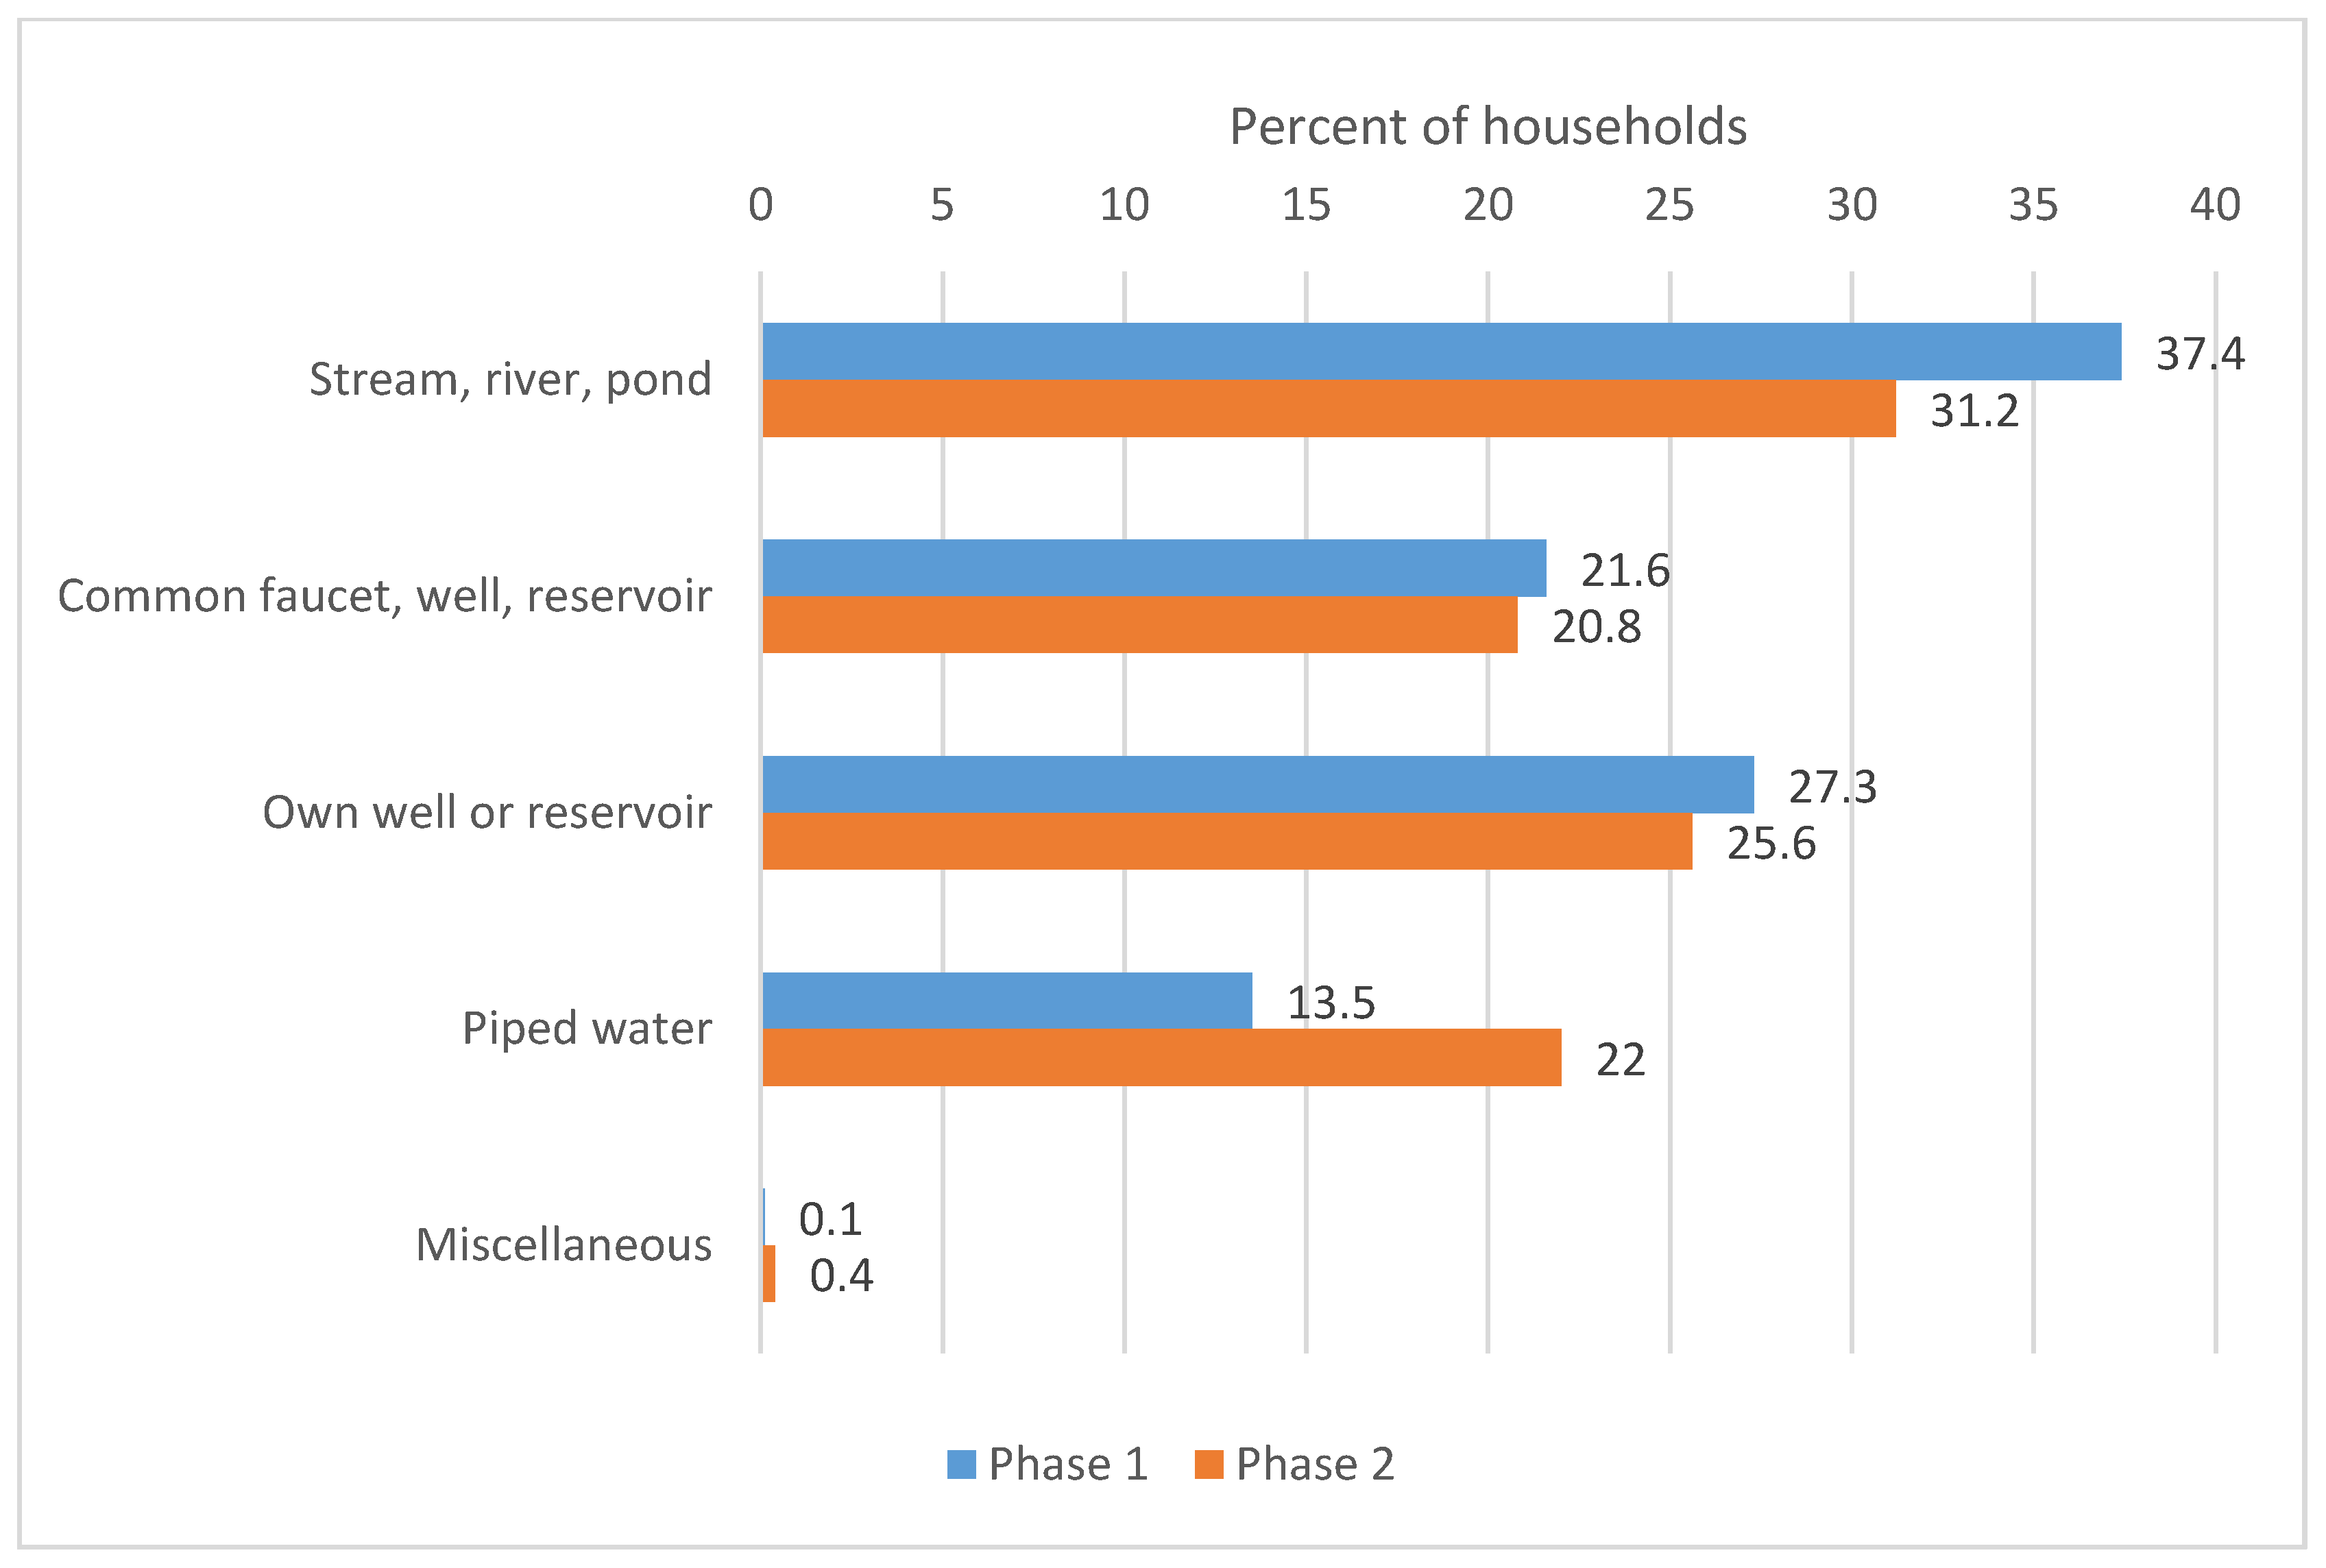
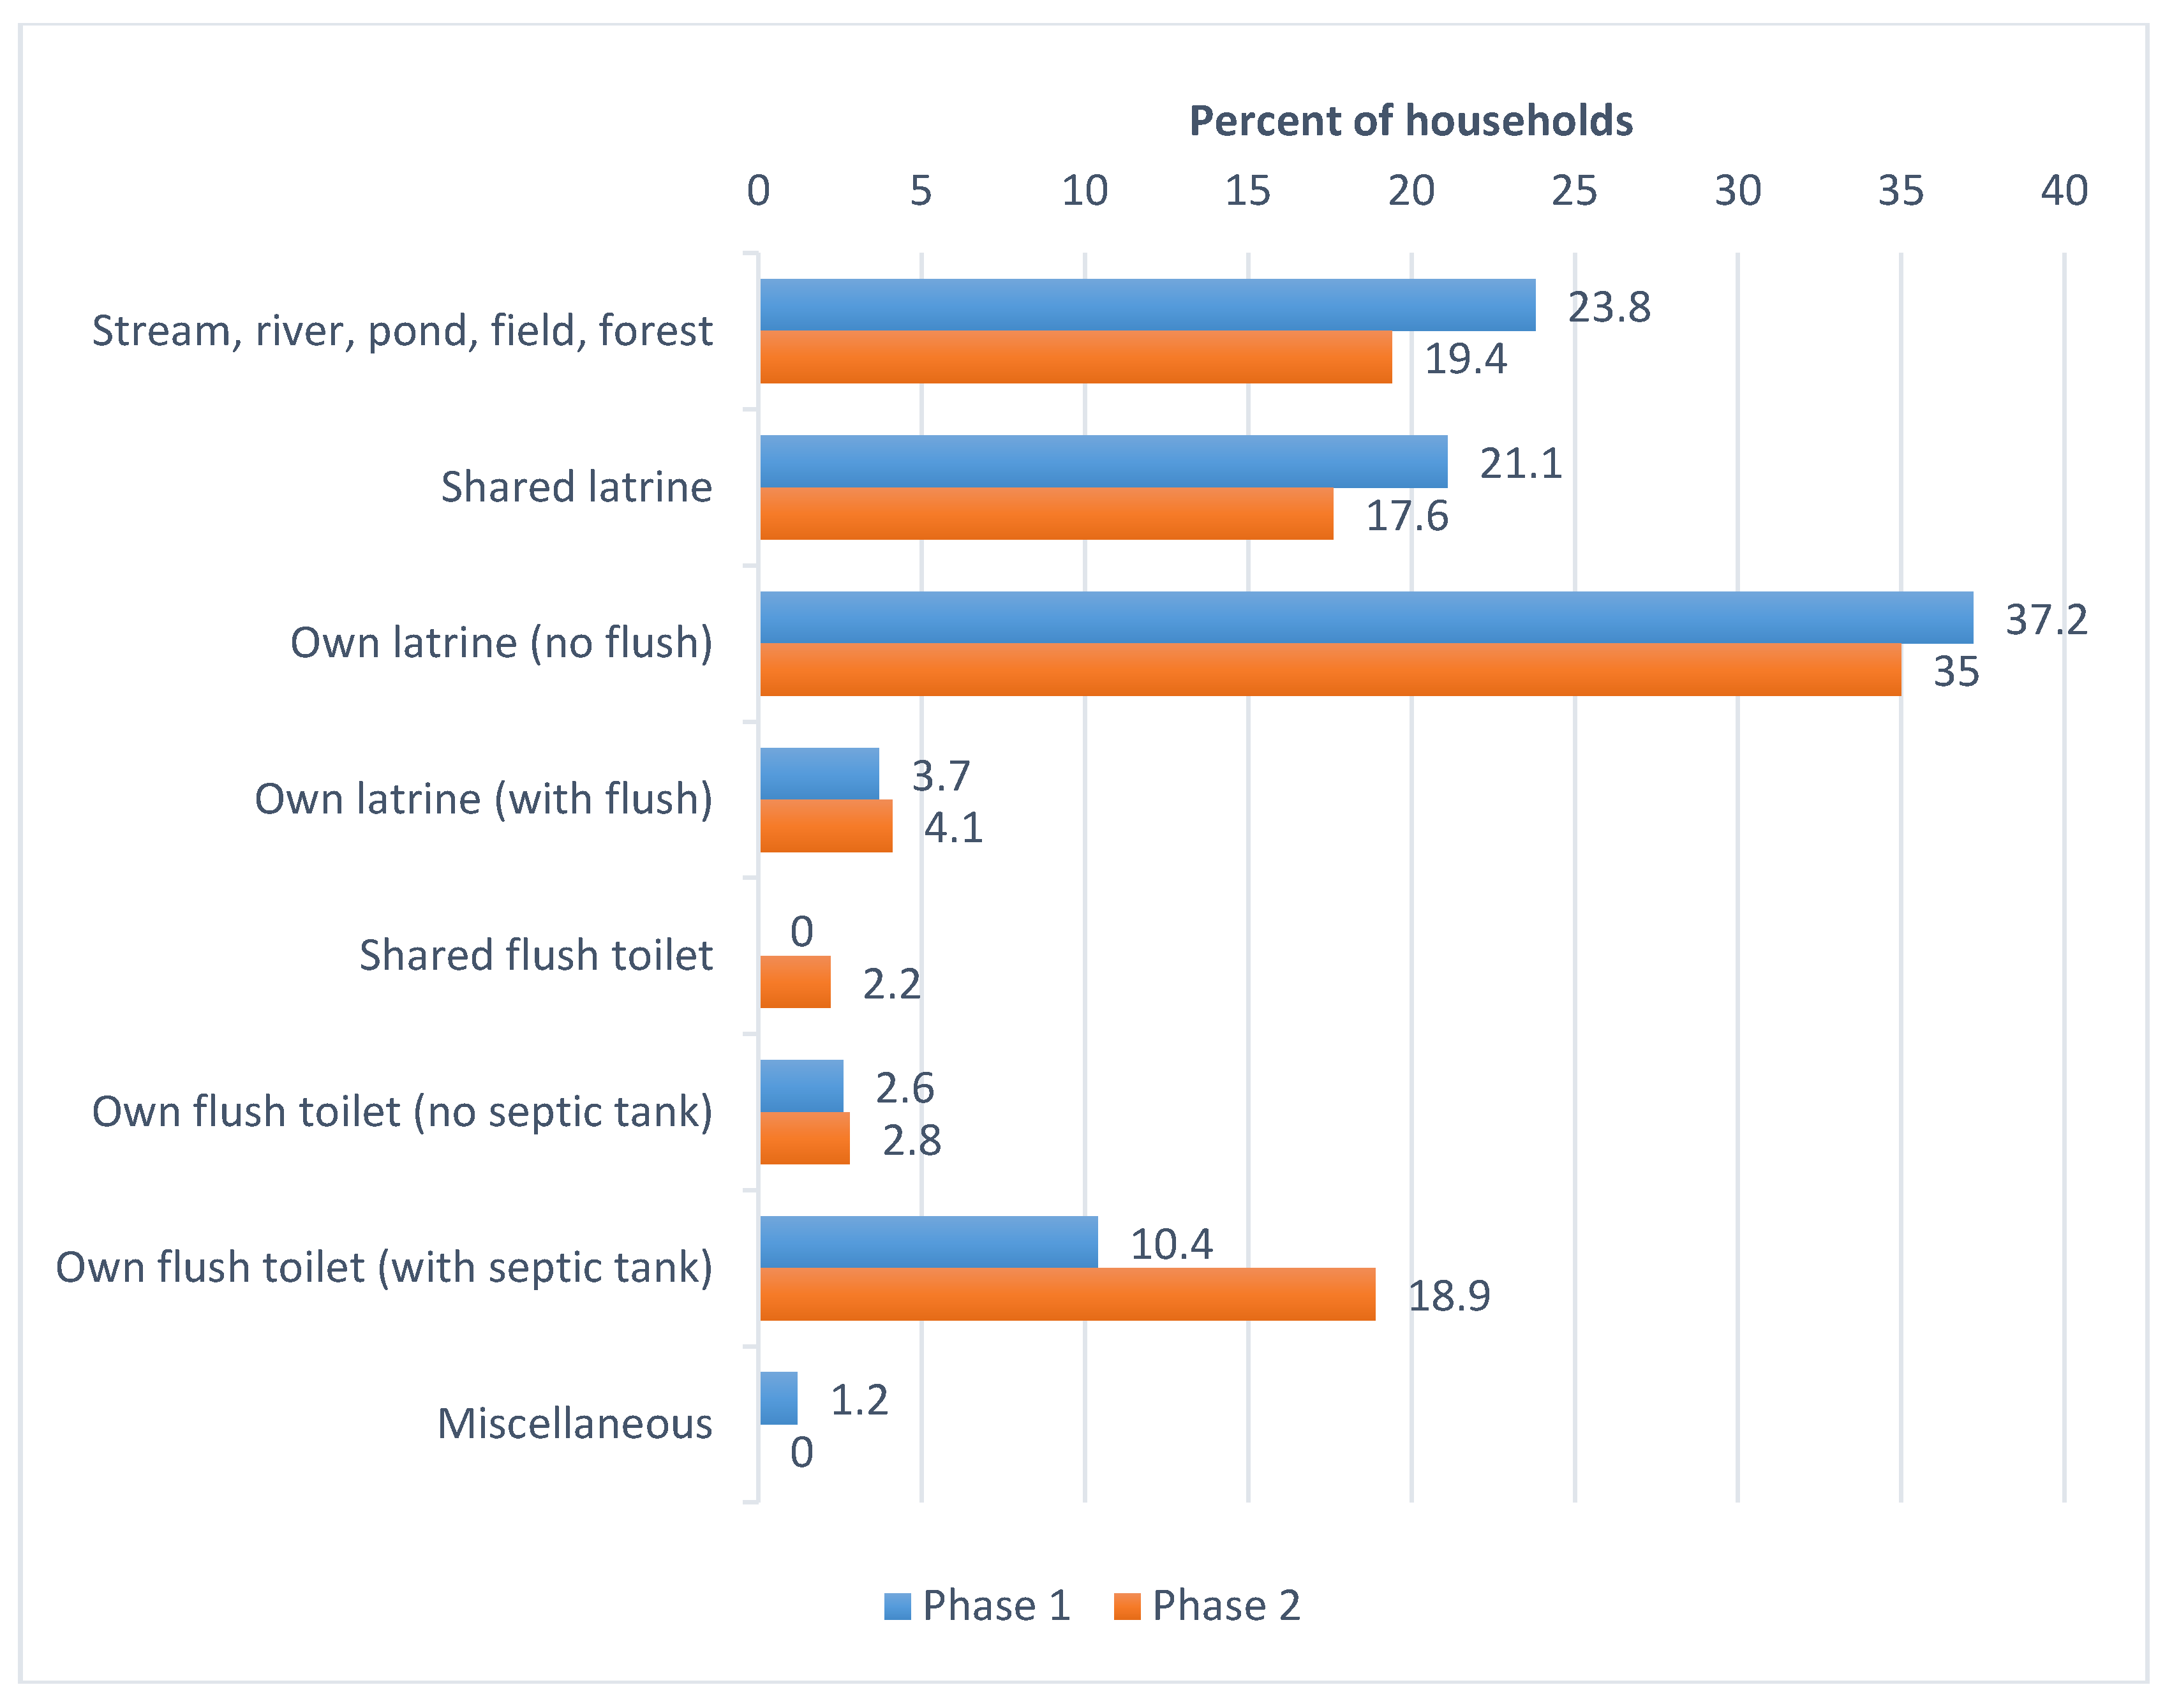
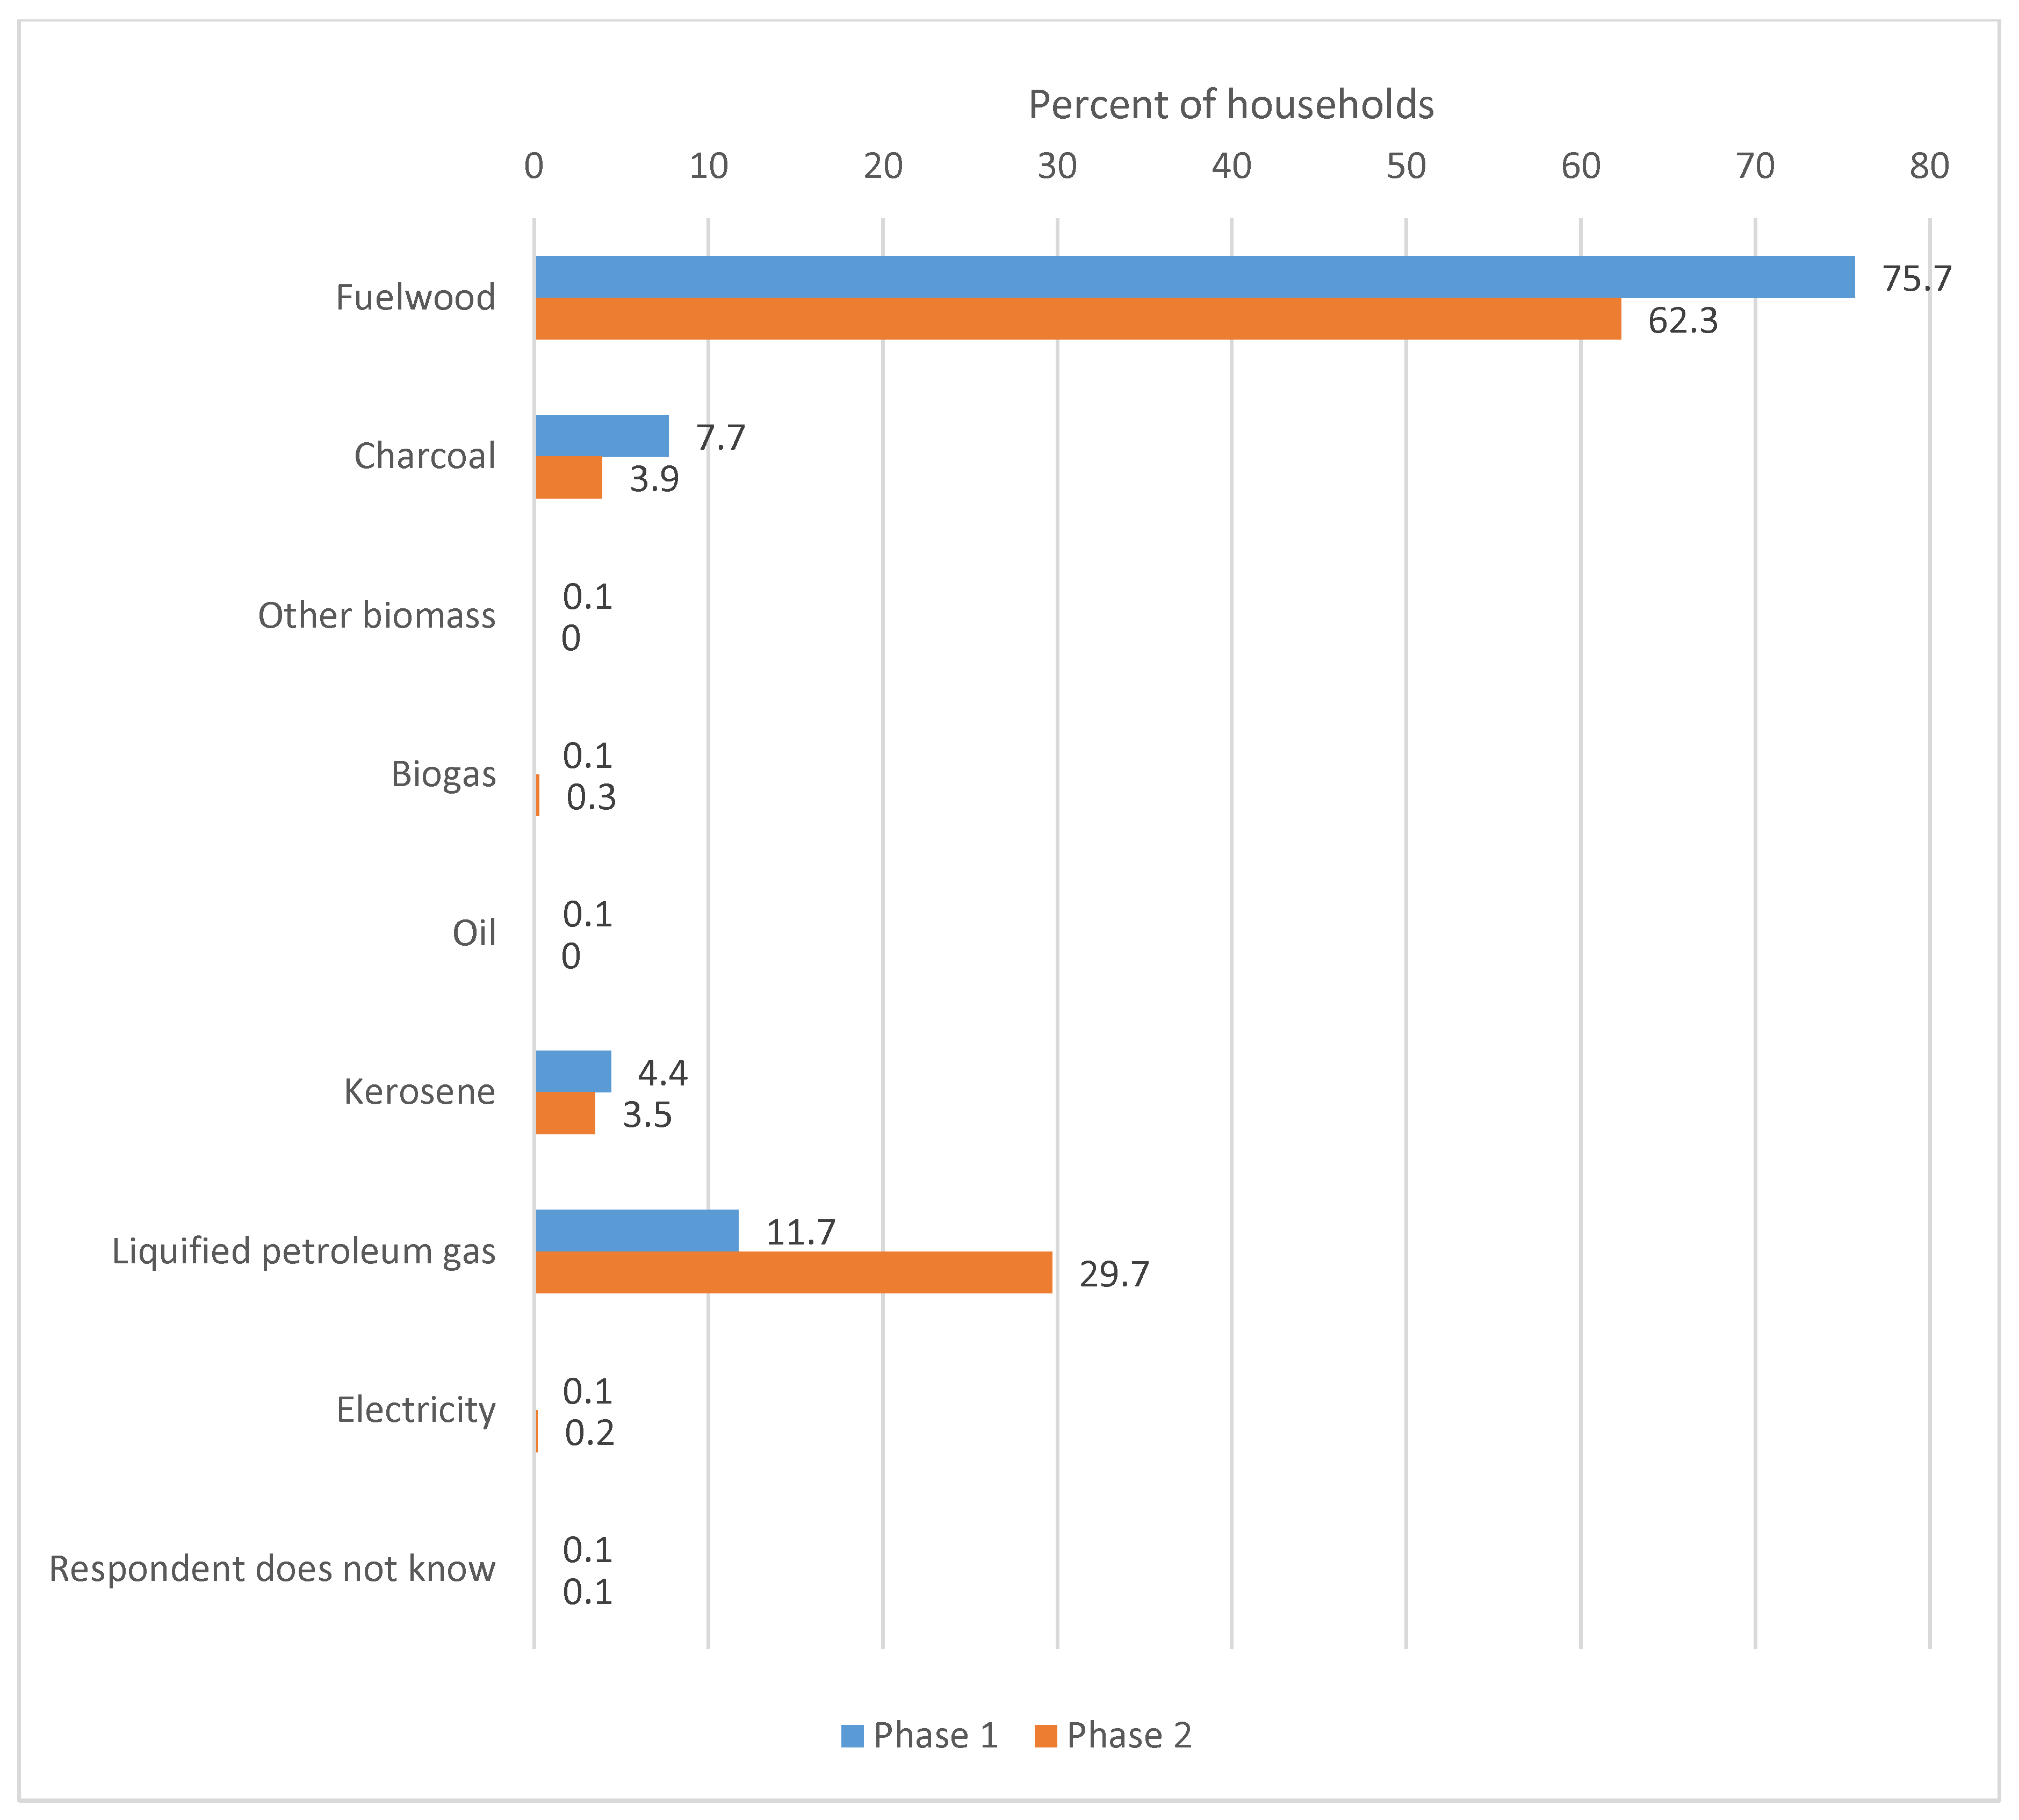
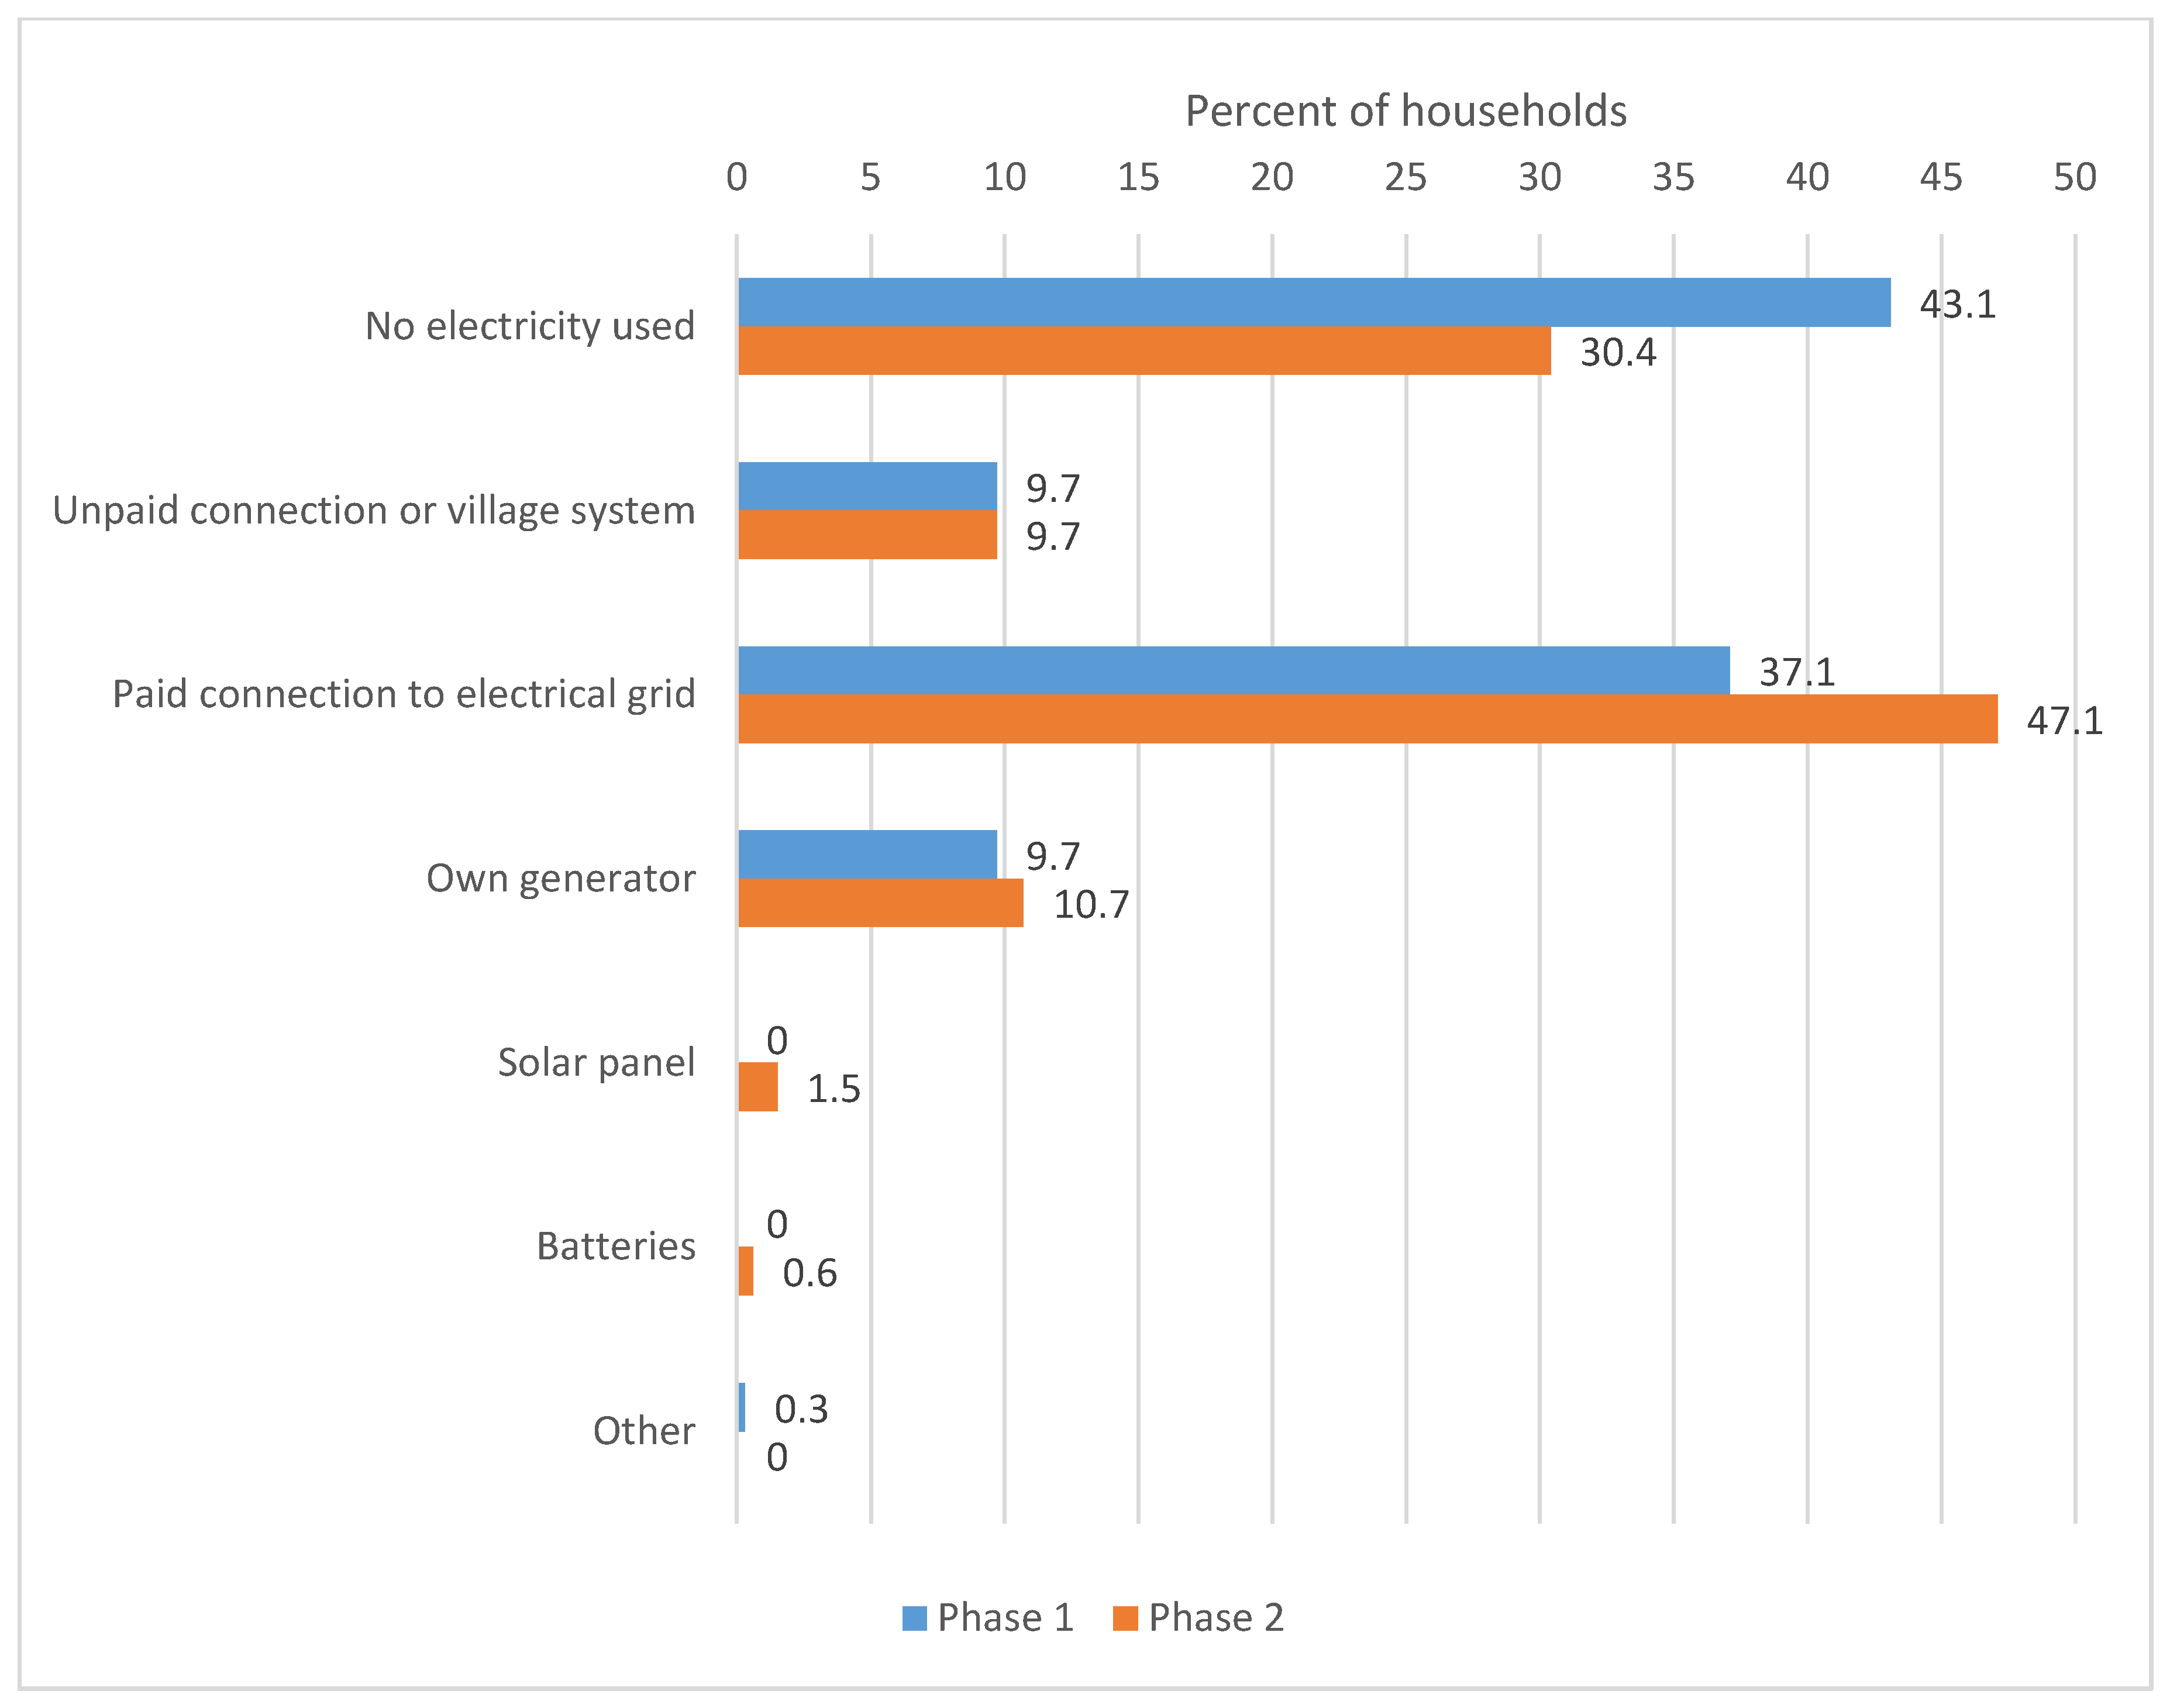
The GCS data on development indicators reflect these trends. In the period that encompasses phase 1 and phase 2, access to piped water has increased from 13.5% to 22.0% of households (see Appendix D), access to a private toilet with a septic tank has increased from 10.4% to 18.9% of households (Appendix E), households without electricity have shrunk from 43.1% to 30.4% of the total (Appendix F), the proportion of households using fuelwood has declined from 75.7% to 62.3%, while the proportion using liquefied petroleum gas has increased from 11.7% to 29.7% (Appendix G). Although the percentage of all study villages with a primary school has declined from 83.4% to 81.3%, the percentage with secondary schools has increased from 30.5% to 34.7% (Appendix H). There has been an increased percentage of study villages with a health care center (+9.0%), an improved road (+6.4%), access to phone use of any kind (+5.8%), and of access to cell phone use (+4.3%) (Appendix H). There has been a shift away from low quality materials toward medium and high quality materials in the floors, walls, and roofs of the houses of household respondents (Appendix I).
These findings leave an open question as to why these development gains translated into increased perceived income sufficiency, but not increased perceived well-being.
4.2. What Explains the “Head Start” of Intervention over Control Households?
As explained in the introduction, many REDD+ initiatives not only incorporate the main approach of ICDPs (tandem of negative and positive incentives), but many REDD+ initiatives are actually a continuation of an ICDP operating at the same location. This is true at the international level [8] (p. 27), and also for the GCS sample. Forest protection activities (whether undertaken by the proponent organization or by others) were underway at 20 of the sites before the subnational REDD+ initiative was established. Forest protection activities began at five of the sites in the 1980s or 1990s, and at 15 of the sites ten or more years ago [52] (p. 9). This pre-history of forest protection and linked development activities at REDD+ initiatives might explain why—in spite of our efforts to make control and intervention villages statistically identical in terms of observable characteristics with the exception of REDD+ interventions—there is a higher amount of development activity in the intervention villages [43]. This, in turn, might explain why intervention households have a higher rate of perceived well-being and income sufficiency in phase 1 (see Table 1).
4.3. Why Has the Impact of REDD+ Been So Low in Spite of Being Underway for a Decade and So Many Households Being Involved in REDD+ Interventions?
First, REDD+ has not only incorporated the ICDP approach, but in some ways has not moved much beyond it. This being the case, what we call “REDD+” (but which in fact is mainly ICDP) may have fallen victim to the well-documented limitations of the ICDP model, both for protecting forests and for improving the livelihoods of stakeholders. Second, a core idea of REDD+ at the outset was to generate a large amount of funding and to underpin a stream of rewards for protecting forests. For the most part, this has not come to pass. Various analysts have documented the substantial shortfall of REDD+ funding in comparison to expectations [7,53]. This funding shortfall has, in turn, made some proponent organizations delay implementation of the innovative (REDD+) portion of their activity portfolio for fear of raising and then dashing expectations at the community level [21] (p. 435). In the extreme case, the funding shortfall has meant that proponent organizations were forced to discontinue their activities and cease operations [54] (p. 232) [55] (p. 282). Five of the initiatives in the GCS sample have stopped functioning. Most importantly, the slow advancement in establishing an international and national policy architecture for REDD+, together with the funding shortfall and other impediments, e.g., the sudden turn away from REDD+ in some countries (Bolivia, Australia), lack of advancement on Measuring, Reporting and Verification systems [56,57], and on benefit sharing systems, have made proponents cautious and hesitant to move forward. In carrying out their REDD+ interventions, they often stayed in an experimental mode rather than move to full implementation, and have limited the deployment of their investments, waiting for a future time that is more propitious. This may explain why the impact of REDD+ has not yet been significant, even though the interventions have reached many households. This might also explain why the “head start” for REDD+ in phase 1 did not confer a phase 2 performance advantage for REDD+ in intervention as compared to control households.
5. Conclusions and Recommendations
The results of our study show that REDD+ has not contributed significantly to the perceived well-being and income sufficiency of its stakeholders. On average, there have been significant development inroads of various kinds across the study households (part and parcel of a trend across developing countries), but for the most part these gains are not attributable to REDD+. This notwithstanding, most intervention households have been engaged in REDD+ interventions, and stakeholders have, by and large, viewed these activities quite favorably. How are we to understand that there was no significant REDD+ impact on well-being and income sufficiency in spite of the wide reach of REDD+ interventions that were viewed favorably? Probably because although the reach was wide, it was also shallow and tentative. Proponent organizations have been hesitant to bring REDD+ to scale unless and until conditions are more favorable.
Although the outlook for REDD+ has been gloomy in recent years, owing mainly to the funding shortfall, there have been some recent developments that may underpin revived optimism and enthusiasm. A global agreement to address climate change, long elusive, was finally reached in Paris in December 2015. The Green Climate Fund has come into being and will be one of the primary funding mechanisms for REDD+ [58] (p. 1). Most importantly, 60 countries have included forests and REDD+ in their national climate change mitigations as part of the Paris Agreement [59,60].
The findings of this paper provide some possibly useful insights to proponent organizations on how they might better serve the needs and interests of their stakeholders. The agricultural livelihoods of participants must be protected given this sector’s pivotal role in the reasons for both improved and worsened well-being. Proponents should also increase their attention to health maintenance and support, even though it is not currently (or not necessarily) part of their remit, because illness stands out as a key reason for decreased well-being across the countries and households. Lastly, the proponents would do well to heed the words of the World Bank and IMF, who point out that although there have been dramatic development gains in the 1990–2015 period, there remains a vast portion of developing country populace suffering from poverty and they are at risk of being left behind [49] (pp. ix, xv). This risk is evident in our data. Although there have been notable gains in access to piped water, electricity, toilets, and modern cooking fuel in the study period, more than half of all households still lack these benefits that are considered key to improving well-being.
Acknowledgments
This research is part of CIFOR’s Global Comparative Study on REDD+ (www.cifor.org/gcs). The funding partners that have supported this research include the Norwegian Agency for Development Cooperation (Norad), the Australian Department of Foreign Affairs and Trade (DFAT), the European Commission (EC), the International Climate Initiative (IKI) of the German Federal Ministry for the Environment, Nature Conservation, Building and Nuclear Safety (BMUB), the United Kingdom Department for International Development (UKAID), and the CGIAR Research Program on Forests, Trees and Agroforestry (CRP-FTA), with financial support from the donors contributing to the CGIAR Fund.
Author Contributions
W.D.S. conceived, composed the field research questions, and wrote technical guidelines for field research on subjective well-being, income sufficiency, and REDD+. W.D.S and A.D.E. pretested the questionnaires and coordinated implementation of the field research. C.D.S. coordinated data encoding and data quality review. M.L. and C.D.P. coded the qualitative data on subjective well-being. C.D.S. conducted the regression analysis. C.D.S. and A.D.E. conducted various other analyses and produced tables and figures. W.D.S. wrote the paper. All authors provided critical comments and suggestions for revisions to the manuscript.
Conflicts of Interest
The authors declare no conflict of interest.
Appendix A. Regression coefficients for results on perceived well-being that serve as inputs to Table 1.

Table A1.
Positive change in well-being (better off).
| Country | Treatment | Estimate | Std. Error | z Value | Pr(>|z|) |
|---|---|---|---|---|---|
| Pooled | (Intercept) | −0.73 | 0.25 | −2.89 | 0.0038 |
| Before–After | 0.08 | 0.07 | 1.10 | 0.2704 | |
| baseline C/I | 0.22 | 0.09 | 2.44 | 0.0148 * | |
| BACI | −0.09 | 0.10 | −0.97 | 0.3329 | |
| Brazil | (Intercept) | 0.39 | 0.11 | 3.60 | 0.0003 |
| Before–After | −0.02 | 0.13 | −0.18 | 0.8550 | |
| baseline C/I | 0.12 | 0.15 | 0.80 | 0.4248 | |
| BACI | −0.09 | 0.18 | −0.52 | 0.6022 | |
| Peru | (Intercept) | −0.58 | 0.29 | −2.02 | 0.0435 |
| Before–After | −0.54 | 0.20 | −2.69 | 0.0071 ** | |
| baseline C/I | 0.41 | 0.26 | 1.54 | 0.1226 | |
| BACI | −0.13 | 0.28 | −0.47 | 0.6387 | |
| Cameroon | (Intercept) | −0.53 | 0.24 | −2.21 | 0.0273 |
| Before–After | 0.04 | 0.20 | 0.21 | 0.8331 | |
| baseline C/I | 0.11 | 0.27 | 0.43 | 0.6666 | |
| BACI | 0.13 | 0.27 | 0.48 | 0.6310 | |
| Tanzania | (Intercept) | −1.64 | 0.21 | −7.97 | 0.0000 |
| Before–After | 0.24 | 0.26 | 0.93 | 0.3524 | |
| baseline C/I | −0.06 | 0.30 | −0.21 | 0.8338 | |
| BACI | 0.15 | 0.36 | 0.41 | 0.6805 | |
| Indonesia | (Intercept) | −1.02 | 0.25 | −4.13 | 0.0000 |
| Before–After | 0.38 | 0.12 | 3.07 | 0.0021 ** | |
| baseline C/I | 0.17 | 0.17 | 1.02 | 0.3098 | |
| BACI | −0.12 | 0.17 | −0.72 | 0.4716 | |
| Vietnam | (Intercept) | −1.19 | 0.22 | −5.51 | 0.0000 |
| Before–After | −0.01 | 0.31 | −0.02 | 0.9829 | |
| baseline C/I | 0.94 | 0.29 | 3.29 | 0.0010 ** | |
| BACI | −0.44 | 0.41 | −1.07 | 0.2847 |
Asterisks show significance at p < 0.05 (*), p < 0.01 (**), p < 0.001 (***).
Table A2.
No change in well-being (about the same).
| Country | Treatment | Estimate | Std. Error | z Value | Pr(>|z|) |
|---|---|---|---|---|---|
| Pooled | (Intercept) | −0.61 | 0.18 | −3.34 | 0.0008 |
| Before–After | −0.02 | 0.07 | −0.30 | 0.7607 | |
| baseline C/I | −0.22 | 0.09 | −2.55 | 0.0107 * | |
| BACI | 0.11 | 0.10 | 1.14 | 0.2543 | |
| Brazil | (Intercept) | −1.05 | 0.13 | −7.83 | 0.0000 |
| Before–After | 0.10 | 0.15 | 0.68 | 0.4993 | |
| baseline C/I | −0.09 | 0.17 | −0.55 | 0.5841 | |
| BACI | −0.10 | 0.20 | −0.51 | 0.6078 | |
| Peru | (Intercept) | −0.05 | 0.47 | −0.10 | 0.9204 |
| Before–After | −0.18 | 0.19 | −0.95 | 0.3426 | |
| baseline C/I | −0.38 | 0.23 | −1.66 | 0.0975 | |
| BACI | 0.47 | 0.27 | 1.74 | 0.0819 | |
| Cameroon | (Intercept) | −1.58 | 0.20 | −7.77 | 0.0000 |
| Before–After | 0.49 | 0.23 | 2.16 | 0.0305 * | |
| baseline C/I | 0.04 | 0.23 | 0.16 | 0.8757 | |
| BACI | −0.29 | 0.32 | −0.90 | 0.3657 | |
| Tanzania | (Intercept) | −0.48 | 0.20 | −2.45 | 0.0143 |
| Before–After | −0.15 | 0.21 | −0.72 | 0.4685 | |
| baseline C/I | −0.39 | 0.28 | −1.41 | 0.1576 | |
| BACI | 0.74 | 0.30 | 2.48 | 0.0132 * | |
| Indonesia | (Intercept) | −0.29 | 0.22 | −1.34 | 0.1806 |
| Before–After | −0.03 | 0.12 | −0.23 | 0.8205 | |
| baseline C/I | −0.14 | 0.14 | −0.96 | 0.3358 | |
| BACI | 0.03 | 0.16 | 0.18 | 0.8598 | |
| Vietnam | (Intercept) | 0.20 | 0.19 | 1.06 | 0.2874 |
| Before–After | −0.57 | 0.27 | −2.11 | 0.0350 * | |
| baseline C/I | −0.82 | 0.28 | −2.93 | 0.0033 ** | |
| BACI | 0.09 | 0.39 | 0.24 | 0.8119 |
Asterisks show significance at p < 0.05 (*), p < 0.01 (**), p < 0.001 (***).
Table A3.
Negative change in well-being (worse off).
| Country | Treatment | Estimate | Std. Error | z Value | Pr(>|z|) |
|---|---|---|---|---|---|
| Pooled | (Intercept) | −0.97 | 0.25 | −3.93 | 0.0001 |
| Before–After | −0.07 | 0.08 | −0.85 | 0.3961 | |
| baseline C/I | 0.01 | 0.09 | 0.07 | 0.9436 | |
| BACI | −0.02 | 0.11 | −0.19 | 0.8477 | |
| Brazil | (Intercept) | −1.80 | 0.16 | −11.56 | 0.0000 |
| Before–After | −0.12 | 0.19 | −0.62 | 0.5333 | |
| baseline C/I | −0.12 | 0.18 | −0.64 | 0.5195 | |
| BACI | 0.35 | 0.25 | 1.39 | 0.1642 | |
| Peru | (Intercept) | −1.89 | 0.40 | −4.68 | 0.0000 |
| Before–After | 0.95 | 0.23 | 4.05 | 0.0001 *** | |
| baseline C/I | −0.05 | 0.26 | −0.17 | 0.8632 | |
| BACI | −0.33 | 0.34 | −0.97 | 0.3305 | |
| Cameroon | (Intercept) | −0.16 | 0.14 | −1.19 | 0.2344 |
| Before–After | −0.37 | 0.19 | −1.95 | 0.0514 * | |
| baseline C/I | −0.17 | 0.18 | −0.92 | 0.3551 | |
| BACI | 0.06 | 0.26 | 0.22 | 0.8277 | |
| Tanzania | (Intercept) | −0.22 | 0.19 | −1.17 | 0.2405 |
| Before–After | −0.01 | 0.20 | −0.03 | 0.9791 | |
| baseline C/I | 0.40 | 0.28 | 1.44 | 0.1493 | |
| BACI | −0.79 | 0.29 | −2.72 | 0.0066 ** | |
| Indonesia | (Intercept) | −0.95 | 0.17 | −5.47 | 0.0000 |
| Before–After | −0.39 | 0.13 | −2.99 | 0.0028 ** | |
| baseline C/I | −0.01 | 0.17 | −0.04 | 0.9670 | |
| BACI | 0.09 | 0.18 | 0.49 | 0.6246 | |
| Vietnam | (Intercept) | −1.29 | 0.22 | −5.80 | 0.0000 |
| Before–After | 0.70 | 0.30 | 2.35 | 0.0187 * | |
| baseline C/I | −0.04 | 0.32 | −0.11 | 0.9088 | |
| BACI | 0.28 | 0.42 | 0.67 | 0.5031 |
Asterisks show significance at p < 0.05 (*), p < 0.01 (**), p < 0.001 (***).
Appendix B. Regression coefficients for results on income sufficiency that serve as inputs to Table 1.
Table A4.
Income sufficient.
| Country | Treatment | Estimate | Std. Error | z Value | Pr(>|z|) |
|---|---|---|---|---|---|
| Pooled | (Intercept) | −1.62 | 0.22 | −7.23 | 0.0000 |
| Before–After | 0.46 | 0.08 | 5.90 | 0.0000 * | |
| baseline C/I | 0.19 | 0.09 | 2.04 | 0.0415 * | |
| BACI | −0.12 | 0.11 | −1.10 | 0.2729 | |
| Brazil | (Intercept) | −0.86 | 0.15 | −5.72 | 0.0000 |
| Before–After | 0.29 | 0.14 | 2.08 | 0.0379 * | |
| baseline C/I | −0.13 | 0.15 | −0.84 | 0.3989 | |
| BACI | −0.05 | 0.19 | −0.28 | 0.7820 | |
| Peru | (Intercept) | −1.69 | 0.51 | −3.31 | 0.0009 |
| Before–After | −0.08 | 0.25 | −0.33 | 0.7409 | |
| baseline C/I | 0.33 | 0.27 | 1.23 | 0.2202 | |
| BACI | −0.52 | 0.34 | −1.52 | 0.1296 | |
| Cameroon | (Intercept) | −1.64 | 0.20 | −8.15 | 0.0000 |
| Before–After | 0.22 | 0.24 | 0.90 | 0.3691 * | |
| baseline C/I | 0.05 | 0.28 | 0.17 | 0.8651 | |
| BACI | 0.11 | 0.33 | 0.32 | 0.7459 | |
| Tanzania | (Intercept) | −2.86 | 0.29 | −10.03 | 0.0000 |
| Before–After | 1.36 | 0.34 | 3.96 | 0.0001 * | |
| baseline C/I | 0.43 | 0.38 | 1.13 | 0.2588 | |
| BACI | −0.03 | 0.46 | −0.05 | 0.9562 | |
| Indonesia | (Intercept) | −1.26 | 0.30 | −4.24 | 0.0000 |
| Before–After | 0.68 | 0.13 | 5.38 | 0.0000 * | |
| baseline C/I | 0.30 | 0.16 | 1.90 | 0.0572 | |
| BACI | −0.17 | 0.17 | −1.00 | 0.3153 | |
| Vietnam | (Intercept) | −2.40 | 0.33 | −7.26 | 0.0000 * |
| Before–After | 0.37 | 0.44 | 0.83 | 0.4063 | |
| baseline C/I | 0.60 | 0.42 | 1.42 | 0.1571 | |
| BACI | −0.09 | 0.57 | −0.16 | 0.8732 |
Asterisks show significance at p < 0.05 (*), p < 0.01 (**), p < 0.001 (***).
Table A5.
Income just about reasonable.
| Country | Treatment | Estimate | Std. Error | z Value | Pr(>|z|) |
|---|---|---|---|---|---|
| Pooled | (Intercept) | −0.63 | 0.19 | −3.24 | 0.0012 |
| Before–After | 0.05 | 0.07 | 0.68 | 0.4941 | |
| baseline C/I | −0.03 | 0.08 | −0.40 | 0.6872 | |
| BACI | 0.04 | 0.09 | 0.45 | 0.6554 | |
| Brazil | (Intercept) | −0.42 | 0.13 | −3.31 | 0.0009 |
| Before–After | −0.10 | 0.14 | −0.73 | 0.4650 | |
| baseline C/I | 0.02 | 0.13 | 0.15 | 0.8812 | |
| BACI | 0.13 | 0.18 | 0.74 | 0.4589 | |
| Peru | (Intercept) | −0.93 | 0.39 | −2.39 | 0.0167 |
| Before–After | 0.57 | 0.20 | 2.89 | 0.0038 * | |
| baseline C/I | −0.14 | 0.22 | −0.60 | 0.5467 | |
| BACI | 0.26 | 0.28 | 0.92 | 0.3587 | |
| Cameroon | (Intercept) | −2.00 | 0.35 | −5.67 | 0.0000 |
| Before–After | 0.66 | 0.26 | 2.50 | 0.0125 * | |
| baseline C/I | 0.62 | 0.29 | 2.16 | 0.0305 * | |
| BACI | −0.69 | 0.34 | −2.05 | 0.0407 * | |
| Tanzania | (Intercept) | −0.92 | 0.15 | −6.17 | 0.0000 |
| Before–After | 0.30 | 0.21 | 1.43 | 0.1522 | |
| baseline C/I | −0.46 | 0.22 | −2.05 | 0.0403 * | |
| BACI | 0.46 | 0.31 | 1.49 | 0.1355 | |
| Indonesia | (Intercept) | 0.03 | 0.13 | 0.27 | 0.7859 |
| Before–After | −0.23 | 0.11 | −2.07 | 0.0383 * | |
| baseline C/I | −0.15 | 0.13 | −1.17 | 0.2435 | |
| BACI | 0.09 | 0.16 | 0.56 | 0.5778 | |
| Vietnam | (Intercept) | −0.29 | 0.20 | −1.41 | 0.1575 |
| Before–After | 0.11 | 0.27 | 0.39 | 0.6932 | |
| baseline C/I | 0.36 | 0.29 | 1.24 | 0.2143 | |
| BACI | −0.46 | 0.38 | −1.21 | 0.2258 |
Asterisks show significance at p < 0.05 (*), p < 0.01 (**), p < 0.001 (***).
Table A6.
Income insufficient.
| Country | Treatment | Estimate | Std. Error | z Value | Pr(>|z|) |
|---|---|---|---|---|---|
| Pooled | (Intercept) | −0.161 | 0.310 | −0.521 | 0.6025 |
| Before–After | −0.461 | 0.074 | −6.254 | 0.0000 * | |
| baseline C/I | −0.089 | 0.080 | −1.105 | 0.2692 | |
| BACI | 0.029 | 0.101 | 0.288 | 0.7730 | |
| Brazil | (Intercept) | −0.826 | 0.099 | −8.378 | 0.0000 |
| Before–After | −0.199 | 0.146 | −1.362 | 0.1733 | |
| baseline C/I | 0.085 | 0.130 | 0.651 | 0.5147 | |
| BACI | −0.081 | 0.193 | −0.419 | 0.6749 | |
| Peru | (Intercept) | 0.136 | 0.632 | 0.214 | 0.8302 |
| Before–After | −0.529 | 0.199 | −2.651 | 0.0080 * | |
| baseline C/I | −0.120 | 0.198 | −0.606 | 0.5448 | |
| BACI | 0.091 | 0.281 | 0.324 | 0.7457 | |
| Cameroon | (Intercept) | 0.924 | 0.174 | 5.312 | 0.0000 |
| Before–After | −0.523 | 0.199 | −2.632 | 0.0085 * | |
| baseline C/I | −0.488 | 0.223 | −2.183 | 0.0290 * | |
| BACI | 0.337 | 0.267 | 1.263 | 0.2067 | |
| Tanzania | (Intercept) | 0.676 | 0.140 | 4.832 | 0.0000 |
| Before–After | −0.798 | 0.203 | −3.937 | 0.0001 * | |
| baseline C/I | 0.266 | 0.210 | 1.265 | 0.2059 | |
| BACI | −0.549 | 0.292 | −1.880 | 0.0601 | |
| Indonesia | (Intercept) | −1.241 | 0.328 | −3.783 | 0.0002 |
| Before–After | −0.518 | 0.144 | −3.594 | 0.0003 * | |
| baseline C/I | −0.070 | 0.178 | −0.396 | 0.6921 | |
| BACI | 0.004 | 0.205 | 0.021 | 0.9833 | |
| Vietnam | (Intercept) | −0.062 | 0.190 | −0.326 | 0.7444 |
| Before–After | −0.231 | 0.270 | −0.854 | 0.3932 | |
| baseline C/I | −0.595 | 0.275 | −2.165 | 0.0304 * | |
| BACI | 0.441 | 0.380 | 1.159 | 0.2466 |
Asterisks show significance at p < 0.05 (*), p < 0.01 (**), p < 0.001 (***).
Appendix C
Table A7.
Effect of REDD+ interventions on perceived household well-being, by country.
| Evaluation | Country | Total | ||||||
|---|---|---|---|---|---|---|---|---|
| Brazil | Cameroon | Indonesia | Peru | Tanzania | Vietnam | |||
| very negative | Count | 84 | 5 | 1 | 12 | 2 | 1 | 105 |
| % | 5.20% | 0.50% | 0.10% | 2.10% | 0.50% | 1.70% | 2.30% | |
| negative | Count | 169 | 52 | 20 | 80 | 4 | 1 | 326 |
| % | 10.40% | 5.10% | 2.20% | 13.90% | 0.90% | 1.70% | 7.00% | |
| neutral | Count | 657 | 228 | 399 | 148 | 136 | 5 | 1573 |
| % | 40.60% | 22.20% | 43.50% | 25.70% | 31.70% | 8.50% | 34.00% | |
| positive | Count | 547 | 650 | 465 | 319 | 195 | 39 | 2215 |
| % | 33.80% | 63.20% | 50.70% | 55.40% | 45.50% | 66.10% | 47.80% | |
| very positive | Count | 163 | 94 | 32 | 17 | 92 | 13 | 411 |
| % | 10.10% | 9.10% | 3.50% | 3.00% | 21.40% | 22.00% | 8.90% | |
| Total | Count | 1620 | 1029 | 917 | 576 | 429 | 59 | 4630 |
| % | 100.00% | 100.00% | 100.00% | 100.00% | 100.00% | 100.00% | 100.00% | |
Appendix D
Figure A1.
Source of water: change from Phase 1 to Phase 2

Appendix E
Figure A2.
Type of toilet: change from Phase 1 to Phase 2

Appendix F
Figure A3.
Access to electricity: change from Phase 1 to Phase 2
Appendix G
Figure A4.
Cooking fuel: change from Phase 1 to Phase 2

Appendix H
Table A8.
Percentage of study villages that have schools, health care centers, improved roads, and phone access; comparison of control and intervention, Phases 1 and 2.
Table A8.
Percentage of study villages that have schools, health care centers, improved roads, and phone access; comparison of control and intervention, Phases 1 and 2.
| Development Category | Unit of Comparison | Phase 1 % | Phase 2 % | Change P1 to P2 |
|---|---|---|---|---|
| Elementary school | Total | 83.4 | 81.3 | −2.1 |
| Secondary school | Total | 30.5 | 34.7 | +4.2 |
| Health care center | Total | 43.0 | 52.0 | +9.0 |
| Improved road | Total | 64.9 | 71.3 | +6.4 |
| Phone access (of any kind) | Total | 80.9 | 86.7 | +5.8 |
| Cell phone | Total | 61.8 | 66.1 | +4.3 |
Appendix I
Table A9.
Rating of the quality of houses in the sample of all households. Rating done on the basis of house elements (floor, wall, roof) and aggregation of those house elements into a housing quality index. Control and intervention, Phases 1 and 2.
Table A9.
Rating of the quality of houses in the sample of all households. Rating done on the basis of house elements (floor, wall, roof) and aggregation of those house elements into a housing quality index. Control and intervention, Phases 1 and 2.
| Housing Element | Level of Quality | Phase 1 % | Phase 2 % | Change P1 to P2 |
|---|---|---|---|---|
| Floor | 3 (high) | 25.7 | 27.3 | +1.6 |
| 2 (medium) | 36.1 | 36.4 | +0.3 | |
| 1 (low) | 38.2 | 36.3 | −1.9 | |
| Wall | 3 (high) | 20.4 | 20.2 | −0.2 |
| 2 (medium) | 50.9 | 55.8 | +4.9 | |
| 1 (low) | 28.6 | 24.0 | −4.6 | |
| Roof | 3 (high) | 43.7 | 45.3 | +1.6 |
| 2 (medium) | 31.3 | 37.1 | +5.8 | |
| 1 (low) | 25.1 | 17.5 | −7.6 | |
| Floor, wall, and roof | 9 (highest) | 10.0 | 9.5 | −0.5 |
| 8 (very high) | 11.9 | 13.0 | +1.1 | |
| 7 (above average) | 17.3 | 20.0 | +2.7 | |
| 6 (average) | 22.1 | 23.0 | +0.9 | |
| 5 (below average) | 15.3 | 16.0 | +0.7 | |
| 4 (very low) | 12.0 | 12.1 | +0.1 | |
| 3 (lowest) | 11.3 | 6.4 | −4.9 |
References
- IPCC. Climate Change 2014: Impacts, Adaptation, and Vulnerability. IPCC WGII AR5 Technical Summary. Intergovernmental Panel on Climate Change. 2014. Available online: http://www.ipcc.ch/report/ar5/wg2/ (accessed on 31 January 2017).
- IPCC. Climate Change 2014: Mitigation of Climate Change. Chapter 11 on Agriculture, Forestry, and Other Land Use. Intergovernmental Panel on Climate Change. 2014. Available online: https://www.ipcc.ch/pdf/assessment-report/ar5/wg3/ipcc_wg3_ar5_chapter11.pdf (accessed on 31 January 2017).
- Angelsen, A. Realizing REDD+: National Strategy and Policy Options; Center for International Forestry Research: Bogor, Indonesia, 2009. [Google Scholar]
- Angelsen, A.; Brockhaus, M.; Sunderlin, W.D.; Verchot, L.V. Analyzing REDD+: Challenges and Choices; Center for International Forestry Research: Bogor, Indonesia, 2012. [Google Scholar]
- White, D.; Minang, P. Estimating the Opportunity costs of REDD+: A Training Manual; World Bank Institute: Washington, DC, USA, 2010. [Google Scholar]
- Sunderlin, W.D.; Larson, A.M.; Duchelle, A.E.; Sills, E.O.; Luttrell, C.; Jagger, P.; Pattanayak, S.K.; Cronkleton, P.; Ekaputri, A.D.; de Sassi, C.; et al. Technical Guidelines for Research on REDD+ Subnational Initiatives; Center for International Forestry Research: Bogor, Indonesia, 2016. [Google Scholar]
- Norman, M.; Nakhooda, S. The State of REDD+ Finance; CGD Working Paper 378; Center for Global Development: Washington, DC, USA, 2014. [Google Scholar]
- Simonet, G.; Karsenty, A.; Newton, P.; de Perthuis, C.; Schaap, B.; Seyller, C. REDD+ Projects in 2014: An Overview Based on a New Database and Typology; Information and Debate Series No. 32; Paris-Dauphine University, Climate Economics Chair: Paris, France, 2015. [Google Scholar]
- Blom, B.; Sunderland, T.; Murdiyarso, D. Getting REDD to work locally: Lessons learned from integrated conservation and development projects. Environ. Sci. Policy 2010, 13, 164–172. [Google Scholar] [CrossRef]
- Sunderlin, W.D.; Sills, E.O. REDD+ Projects as a Hybrid of Old and New Forest Conservation Approaches. In Analyzing REDD+: Challenges and Choices; Angelsen, A., Brockhaus, M., Sunderlin, W.D., Verchot, L.V., Eds.; Center for International Forestry Research: Bogor, Indonesia, 2012; pp. 177–192. [Google Scholar]
- Atela, J.O.; Quinn, C.H.; Minang, P.A.; Duguma, L.A. Implementing REDD+ in view of integrated conservation and development projects: Leveraging empirical lessons. Land Use Policy 2015, 48, 329–340. [Google Scholar] [CrossRef]
- Lawlor, K.; Olander, L.P.; Weinthal, E. Sustaining Livelihoods while Reducing Emissions from Deforestation: Options for Policymakers; Working Paper; Nicholas Institute for Environmental Policy Solutions, Duke University: Durham, NC, USA, 2009. [Google Scholar]
- Campbell, B.M. Beyond Copenhagen: REDD+, agriculture, adaptation strategies and poverty. Glob. Environ. Chang. 2009, 19, 397–399. [Google Scholar] [CrossRef]
- Wunder, S. Payments for environmental services and the poor: Concepts and preliminary evidence. Environ. Dev. Econ. 2008, 13, 279–297. [Google Scholar] [CrossRef]
- Merger, E.; Dutschke, M.; Verchot, L. Options for REDD+ voluntary certification to ensure net GHG benefits, poverty alleviation, sustainable management of forests and biodiversity conservation. Forests 2011, 2, 550–577. [Google Scholar] [CrossRef]
- SSNC. REDD Plus or REDD “Light”?—Biodiversity, Communities and Forest Carbon Certification; Swedish Society for Nature Conservation: Stockholm, Sweden, 2013. [Google Scholar]
- Bonfante, T.M.; Voivodic, M.; Filho, L.M. Developing Social and Environmental Safeguards for REDD+: A Guide for Bottom-up Approach; Imaflora: Piracicaba, São Paolo, Brazil, 2010. [Google Scholar]
- Boyle, J.; Murphy, D. Designing Effective REDD+ Safeguard Information Systems: Building on Existing Systems and Country Experiences; International Institute for Sustainable Development: Winnipeg, MB, Canada, 2012. [Google Scholar]
- UNFCCC. The Cancun Agreements: Outcome of the Work of the Ad Hoc Working Group on Long-Term Cooperation under the Convention; Decision 1/CP.16. Report of the Conference of the Parties on its Sixteenth Session, Cancun, 29 November–10 December 2010. FCC/CP/2010/7 Add.1; United Nations Framework Convention on Climate Change: Bonn, Germany, 2011. [Google Scholar]
- Chhatre, A.; Lakhanpal, S.; Larson, A.M.; Nelson, F.; Ojha, H.; Rao, J. Social safeguards and co-benefits in REDD+: A review of the adjacent possible. Curr. Opin. Environ. Sustain. 2012, 4, 654–660. [Google Scholar] [CrossRef]
- De Sassi, C.; Sunderlin, W.D.; Sills, E.O.; Duchelle, A.E.; Ravikumar, A.; Resosudarmo, I.A.P.; Luttrell, C.; Joseph, S.; Herold, M.; Kweka, D.L.; et al. REDD+ on the Ground: Global Insights from Local Contexts. In REDD+ on the Ground: A Case Book of Subnational Initiatives across the Globe; Sills, E.O., Atmadja, S.S., de Sassi, C., Duchelle, A.E., Kweka, D.L., Resosudarmo, I.A.P., Sunderlin, W.D., Eds.; Center for International Forestry Research: Bogor, Indonesia, 2014; pp. 420–439. [Google Scholar]
- Resosudarmo, I.A.P; Duchelle, A.E.; Ekaputri, A.D.; Sunderlin, W.D. Local Hopes and Worries about REDD+ Projects. In Analyzing REDD+: Challenges and Choices; Angelsen, A., Brockhaus, M., Sunderlin, W.D., Verchot, L.V., Eds.; Center for International Forestry Research: Bogor, Indonesia, 2012; pp. 193–208. [Google Scholar]
- Intarini, D.Y; Resosudarmo, I.A.P.; Komalasari, M.; Ekaputri, A.D.; Agustavia, M. Ketapang Community Carbon Pools, West Kalimantan, Indonesia. In REDD+ on the Ground: A Case Book of Subnational Initiatives across the Globe; Sills, E.O, Atmadja, S.S., de Sassi, C., Duchelle, A.E., Kweka, D.L., Resosudarmo, I.A.P., Sunderlin, W.D., Eds.; Center for International Forestry Research: Bogor, Indonesia, 2014; pp. 329–347. [Google Scholar]
- Anandi, C.A.M.; Resosudarmo, I.A.P.; Komalasari, M.; Ekaputri, A.D.; Intarini, D.Y. TNC’s Initiative within the Berau Forest Carbon Program, East Kalimantan, Indonesia. In REDD+ on the Ground: A Case Book of Subnational Initiatives across the Globe; Sills, E.O., Atmadja, S.S., de Sassi, C., Duchelle, A.E., Kweka, D.L., Resosudarmo, I.A.P., Sunderlin, W.D., Eds.; Center for International Forestry Research: Bogor, Indonesia, 2014; pp. 362–379. [Google Scholar]
- Mahanty, S.; Suich, H.; Tacconi, L. Access and benefits in payments for environmental services and implications for REDD+: Lessons from seven PES schemes. Land Use Policy 2013, 31, 38–47. [Google Scholar] [CrossRef]
- Edwards, D.P.; Koh, L.P.; Laurance, W.F. Indonesia’s REDD+ pact: Saving imperiled forests or business as usual? Biol. Conserv. 2011, 15, 41–44. [Google Scholar] [CrossRef]
- Sunderlin, W.D.; Larson, A.M.; Duchelle, A.E.; Resosudarmo, I.A.P.; Huynh, T.B.; Awono, A.; Dokken, T. How are REDD+ proponents addressing tenure problems? Evidence from Brazil, Cameroon, Tanzania, Indonesia, and Vietnam. World Dev. 2014, 55, 37–52. [Google Scholar] [CrossRef]
- Larson, A.M.; Brockhaus, M.; Sunderlin, W.D.; Duchelle, A.E.; Babon, A.; Dokken, T.; Pham, T.T.; Resosudarmo, I.A.P.; Selaya, G.; Awono, A.; et al. Land tenure and REDD+: The good, the bad and the ugly. Glob. Environ. Chang. 2013, 23, 678–689. [Google Scholar] [CrossRef]
- Assembe-Mvondo, S. National-Level Corruption Risks and Mitigation Strategies in the Implementation of REDD+ in the Democratic Republic of the Congo: An Overview of the Current Situation; U4 Anti-Corruption Resource Centre, Chr. Michelsen Institute (CMI): Bergen, Norway, 2015. [Google Scholar]
- Barr, C. Governance Risks for REDD+: How Weak Forest Carbon Accounting Can Create Opportunities for Corruption and Fraud. In Global Corruption Report: Climate Change; Sweeney, G., Dobson, R., Despota, K., Zinnbauer, D., Eds.; Transparency International: Berlin, Germany, 2011; pp. 329–344. [Google Scholar]
- Williams, L.G. Putting the Pieces Together for Good Governance of REDD+: An Analysis of 32 REDD+ Country Readiness Proposals; Working Paper; World Resources Institute: Washington, DC, USA, 2013. [Google Scholar]
- OECD. Guidelines on Measuring Subjective Well-being. OECD Publishing, 2013. Available online: http://www.oecd-ilibrary.org/economics/oecd-guidelines-on-measuring-subjective-well-being_9789264191655-en (accessed on 31 January 2017).
- Kahneman, D.; Krueger, A.B. Developments in the measurement of subjective well-being. J. Econ. Perspect. 2006, 20, 3–24. [Google Scholar] [CrossRef]
- Krueger, A.B.; Schkade, D.A. The reliability of subjective well-being measures. J. Public Econ. 2008, 92, 1833–1845. [Google Scholar] [CrossRef] [PubMed]
- Dolan, P.; Layard, R.; Metcalfe, R. Measuring Subjective Wellbeing for Public Policy: Recommendations on Measures; Centre for Economic Performance, London School of Economics and Political Science: London, UK, 2011. [Google Scholar]
- Tinkler, L.; Hick, S. Measuring Subjective Well-Being; Office for National Statistics: London, UK, 2011. [Google Scholar]
- Diener, E.; Diener, M.; Diener, C. Factors predicting the subjective well-being of nations. J. Pers. Soc. Psychol. 1995, 69, 851–864. [Google Scholar] [CrossRef] [PubMed]
- Diener, E.; Lucas, R.E.; Oishi, S. Subjective Well-Being: The Science of Happiness and Life Satisfaction. In The Oxford Handbook of Positive Psychology, 2nd ed.; Lopez, S.J., Snyder, C.R., Eds.; Oxford University Press: New York, NY, USA, 2009; pp. 63–73. [Google Scholar]
- Layard, R. Happiness: Lessons from a New Science; Penguin: London, UK, 2005. [Google Scholar]
- Stiglitz, J.E.; Sen, A.; Fitoussi, J.P. Report by the Commission on the Measurement of Economic Performance and Social Progress; Commission on the Measurement of Economic Performance and Social Progress: Paris, France, 2009. [Google Scholar]
- Resosudarmo, I.A.P.; Komalasari, M.; Atmadja, S.; Awono, A.; Pratama, C.D.; Sills, E.O.; Sunderlin, W.D. Have REDD+ Initiatives Changed Local Land Use Behavior? Household Perspectives from Africa, Asia, and Latin America, unpublished work. 2017.
- Jagger, P.; Sills, E.O.; Lawlor, K.; Sunderlin, W.D. A Guide to Learning about Livelihood Impacts of REDD+; Occasional Paper No. 56; Center for International Forestry Research: Bogor, Indonesia, 2010. [Google Scholar]
- Sills, E.O.; de Sassi, C.; Jagger, P.; Lawlor, K.; Miteva, D.; Pattanayak, S.; Sunderlin, W.D. Building the evidence base for REDD+: Study design and methods for evaluating the impacts of conservation interventions on local well-being. Glob. Environ. Chang. 2017, 43, 148–160. [Google Scholar] [CrossRef]
- Rudel, T.K.; Defries, R.; Asner, G.P.; Laurance, W.F. Changing Drivers of Deforestation and New Opportunities for Conservation. Conserv. Biol. 2009, 23, 1396–1405. [Google Scholar] [CrossRef] [PubMed]
- Merriam-Webster. Merriam-Webster Online Dictionary. Entry for “Well-Being”. Available online: http://www.merriam-webster.com/dictionary/well-being (accessed on 1 February 2017).
- R Core Team. R: A language and environment for statistical computing. R Foundation for Statistical Computing: Vienna, Austria, 2015. Available online: https://www.R-project.org/ (accessed on 31 January 2017).
- Bates, D.; Maechler, M.; Bolker, B.; Walker, S. lme4: Linear Mixed-Effects Models Using Eigen and S4; R package Version 1.7; R Foundation for Statistical Computing: Auckland, New Zealand, 2014. [Google Scholar]
- Duchelle, A.E.; de Sassi, C.; Jagger, P.; Cromberg, M.; Larson, A.M.; Sunderlin, W.D.; Atmadja, S.S.; Resosudarmo, I.A.P.; Pratama, C.D. Carrots and sticks in REDD+ implementation: Implications for social safeguards. Ecol. Soc. 2017, in press. [Google Scholar]
- De Sassi, C.; Duchelle, A.E.; Ickowitz, A.; Dwi Putri, A.A.; Kweka, D.L.; Sills, E.O.; Jagger, P.; Wunder, S.; Sunderlin, W.D. Income and Equality Impacts of REDD+ on Smallholders across the Tropics, In Preparation. 2017.
- United Nations. The Millennium Development Goals Report 2015; United Nations: New York, NY, USA, 2015. [Google Scholar]
- World Bank & IMF. Global Monitoring Report 2015/2016: Development Goals in an Era of Demographic Change; World Bank, International Monetary Fund: Washington, DC, USA, 2016. [Google Scholar]
- Sunderlin, W.D.; Ekaputri, A.D.; Sills, E.O.; Duchelle, A.E.; Kweka, D.L.; Diprose, R.; Doggart, N.; Ball, S.; Lima, R.; Enright, A.; et al. The Challenge of Establishing REDD+ on the Ground: Insights from 23 Subnational Initiatives in Six Countries; Occasional Paper 104; Center for International Forestry Research: Bogor, Indonesia, 2014. [Google Scholar]
- IFF. Stimulating Interim Demand for REDD+ Emission Reductions: The Need for a Strategic Intervention from 2015 to 2020. International Forest Finance Project: Oxford, UK, 2014. Available online: http://www.unepfi.org/fileadmin/documents/IFF_Report_-_Stimulating_Interim_Demand_for_REDD_Emissions_Reductions.pdf (accessed on 31 January 2017).
- Kweka, D.L. Building REDD Readiness in the Masito Ugalla Ecosystem Pilot Area in Support of Tanzania’s National REDD Strategy. In REDD+ on the Ground: A Case Book of Subnational Initiatives across the Globe; Sills, E.O., Atmadja, S.S., de Sassi, C., Duchelle, A.E., Kweka, D.L., Resosudarmo, I.A.P., Sunderlin, W.D., Eds.; Center for International Forestry Research: Bogor, Indonesia, 2014; pp. 222–233. [Google Scholar]
- Dwi Putri, A.A.; Kweka, D.L. Pilot project on Community-Based REDD Mechanisms for Sustainable Forest Management in Semiarid Areas: The Case of Ngitilis in the Shinyanga Region, Tanzania. In REDD+ on the Ground: A Case Book of Subnational Initiatives across the Globe; Sills, E.O., Atmadja, S.S., de Sassi, C., Duchelle, A.E., Kweka, D.L., Resosudarmo, I.A.P., Sunderlin, W.D., Eds.; Center for International Forestry Research: Bogor, Indonesia, 2014; pp. 272–289. [Google Scholar]
- Romijn, E.; Herold, M.; Kooistra, L.; Murdiyarso, D.; Verchot, L.V. Assessing capacities of non Annex I countries for national forest monitoring in the context of REDD+. Environ. Sci. Policy 2012, 19, 33–48. [Google Scholar] [CrossRef]
- Joseph, S.; Herold, M.; Sunderlin, W.D.; Verchot, L.V. REDD+ readiness: Early insights on monitoring, reporting and verification systems of project developers. Environ. Res. Lett. 2013, 8. [Google Scholar] [CrossRef]
- Savedoff, W. How the Green Climate Fund Could Promote REDD+ through a Cash on Delivery Instrument: Issues and Options; CGD Policy Paper 072; Center for Global Development: Washington, DC, USA, 2016. [Google Scholar]
- World Bank. Outcomes from COP21: Forests as a Key Climate and Development Solution; World Bank: Washington, DC, USA, 2015. [Google Scholar]
- Keenan, R. The Paris Climate Agreement and Forests: Will the COP21 Agreement Encourage Growth in Investment in Sustainably-Managed Forests? Asia and the Pacific Policy Society, 2016. Available online: http://www.policyforum.net/the-paris-climate-agreement-and-forests/ (accessed on 31 January 2017).
Figure 1.
Location of 22 REDD+ subnational initiatives in the sample.
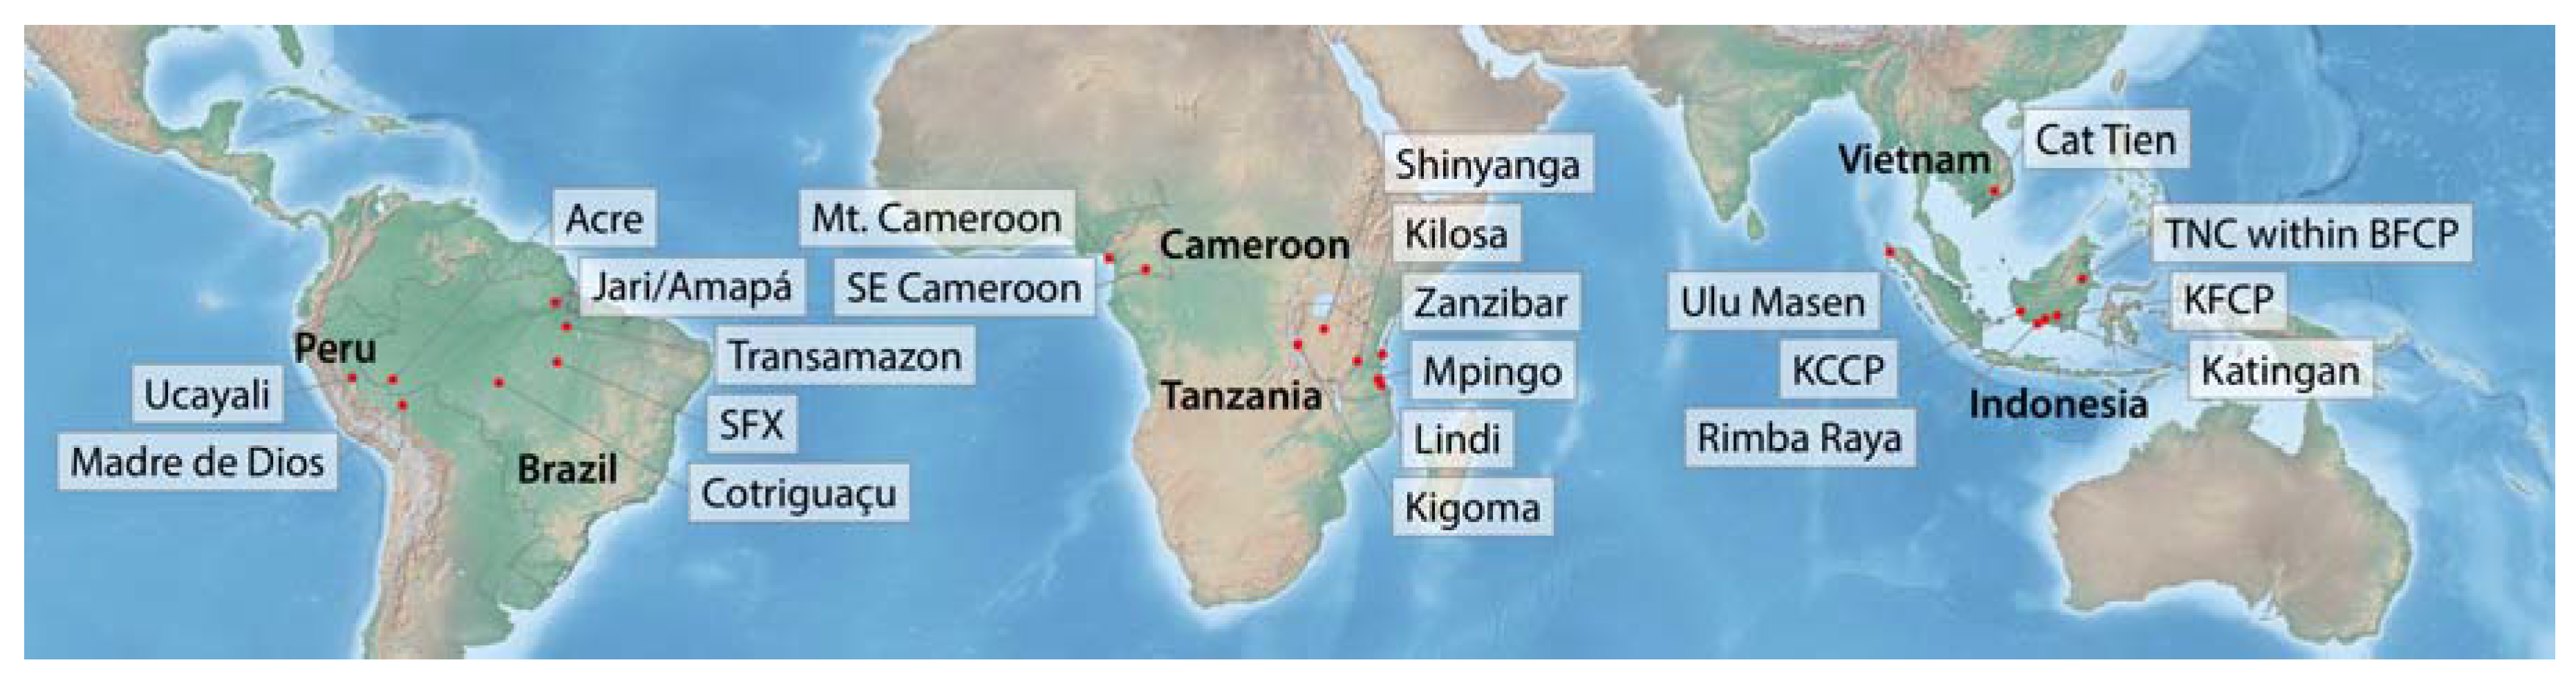
Figure 2.
Percent change in perceived well-being and income sufficiency from phase 1 (2010–2012) to phase 2 (2013–2014) at control and intervention households at the aggregate level (pooled) and by country, specified by change in positive responses (“better off”, “yes” (income sufficiency)).
Figure 2.
Percent change in perceived well-being and income sufficiency from phase 1 (2010–2012) to phase 2 (2013–2014) at control and intervention households at the aggregate level (pooled) and by country, specified by change in positive responses (“better off”, “yes” (income sufficiency)).
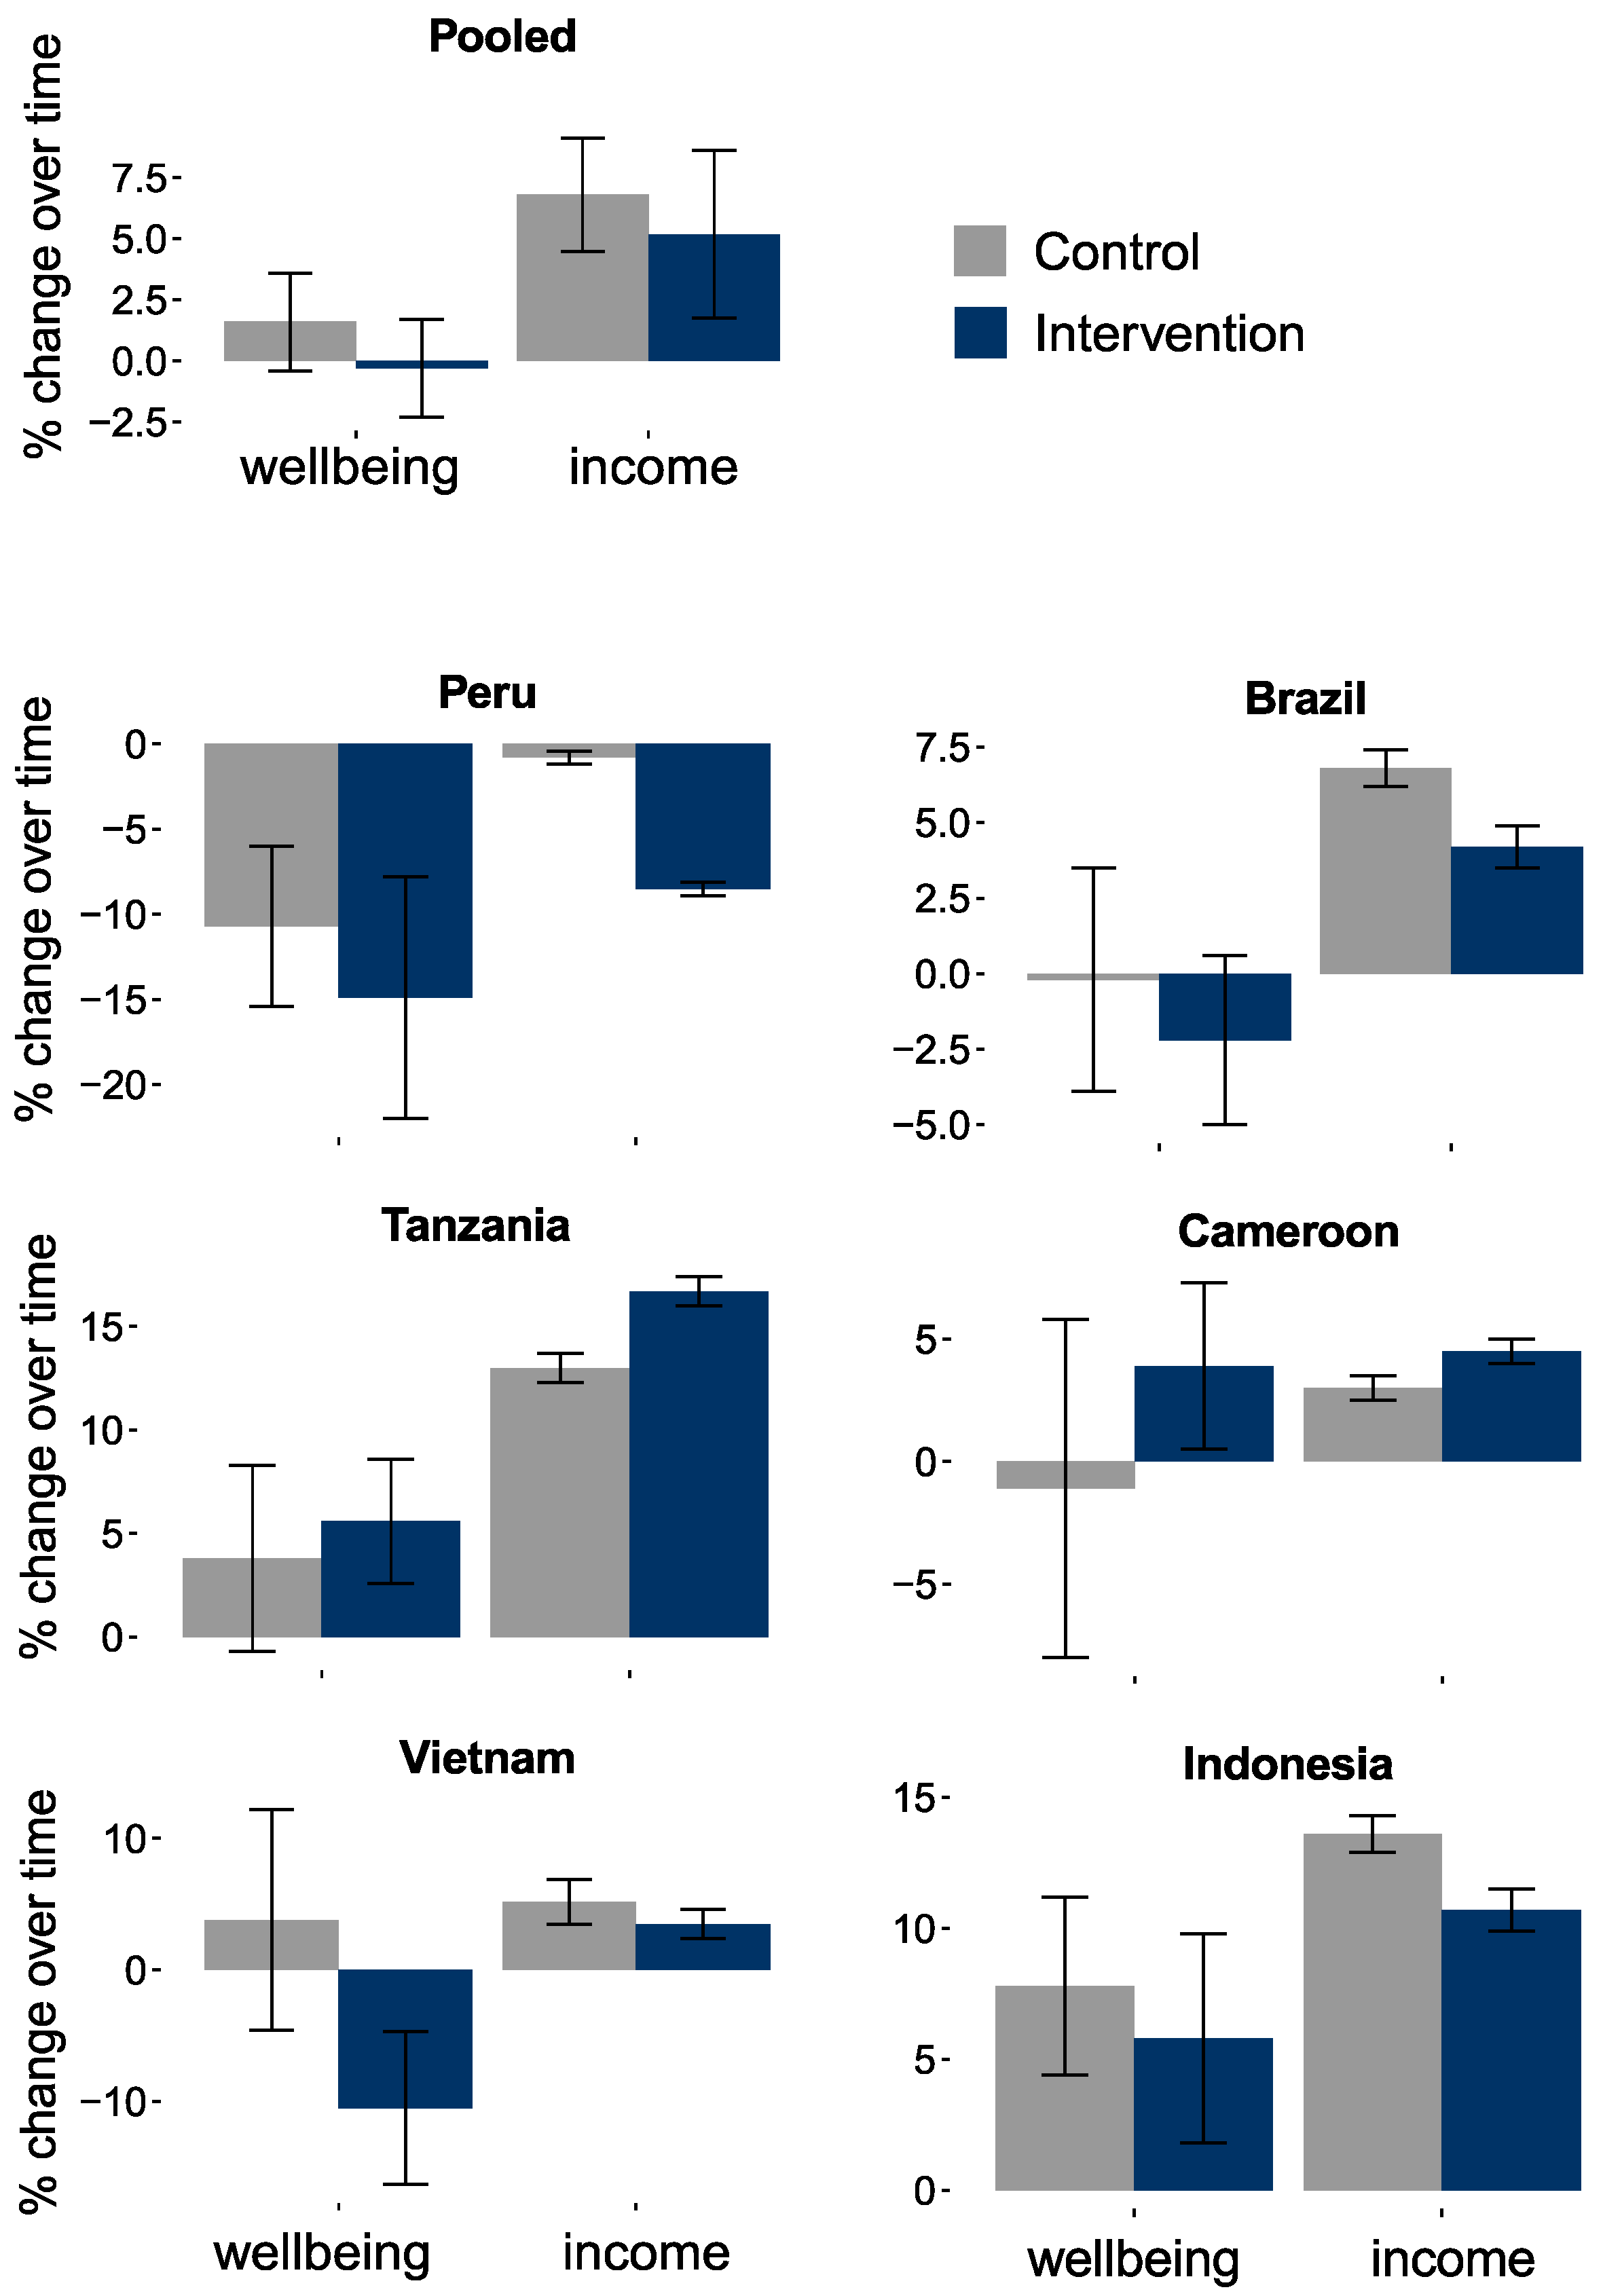
Figure 3.
Top ten reasons for perceived improved well-being in phase 2, control and intervention households.
Figure 3.
Top ten reasons for perceived improved well-being in phase 2, control and intervention households.
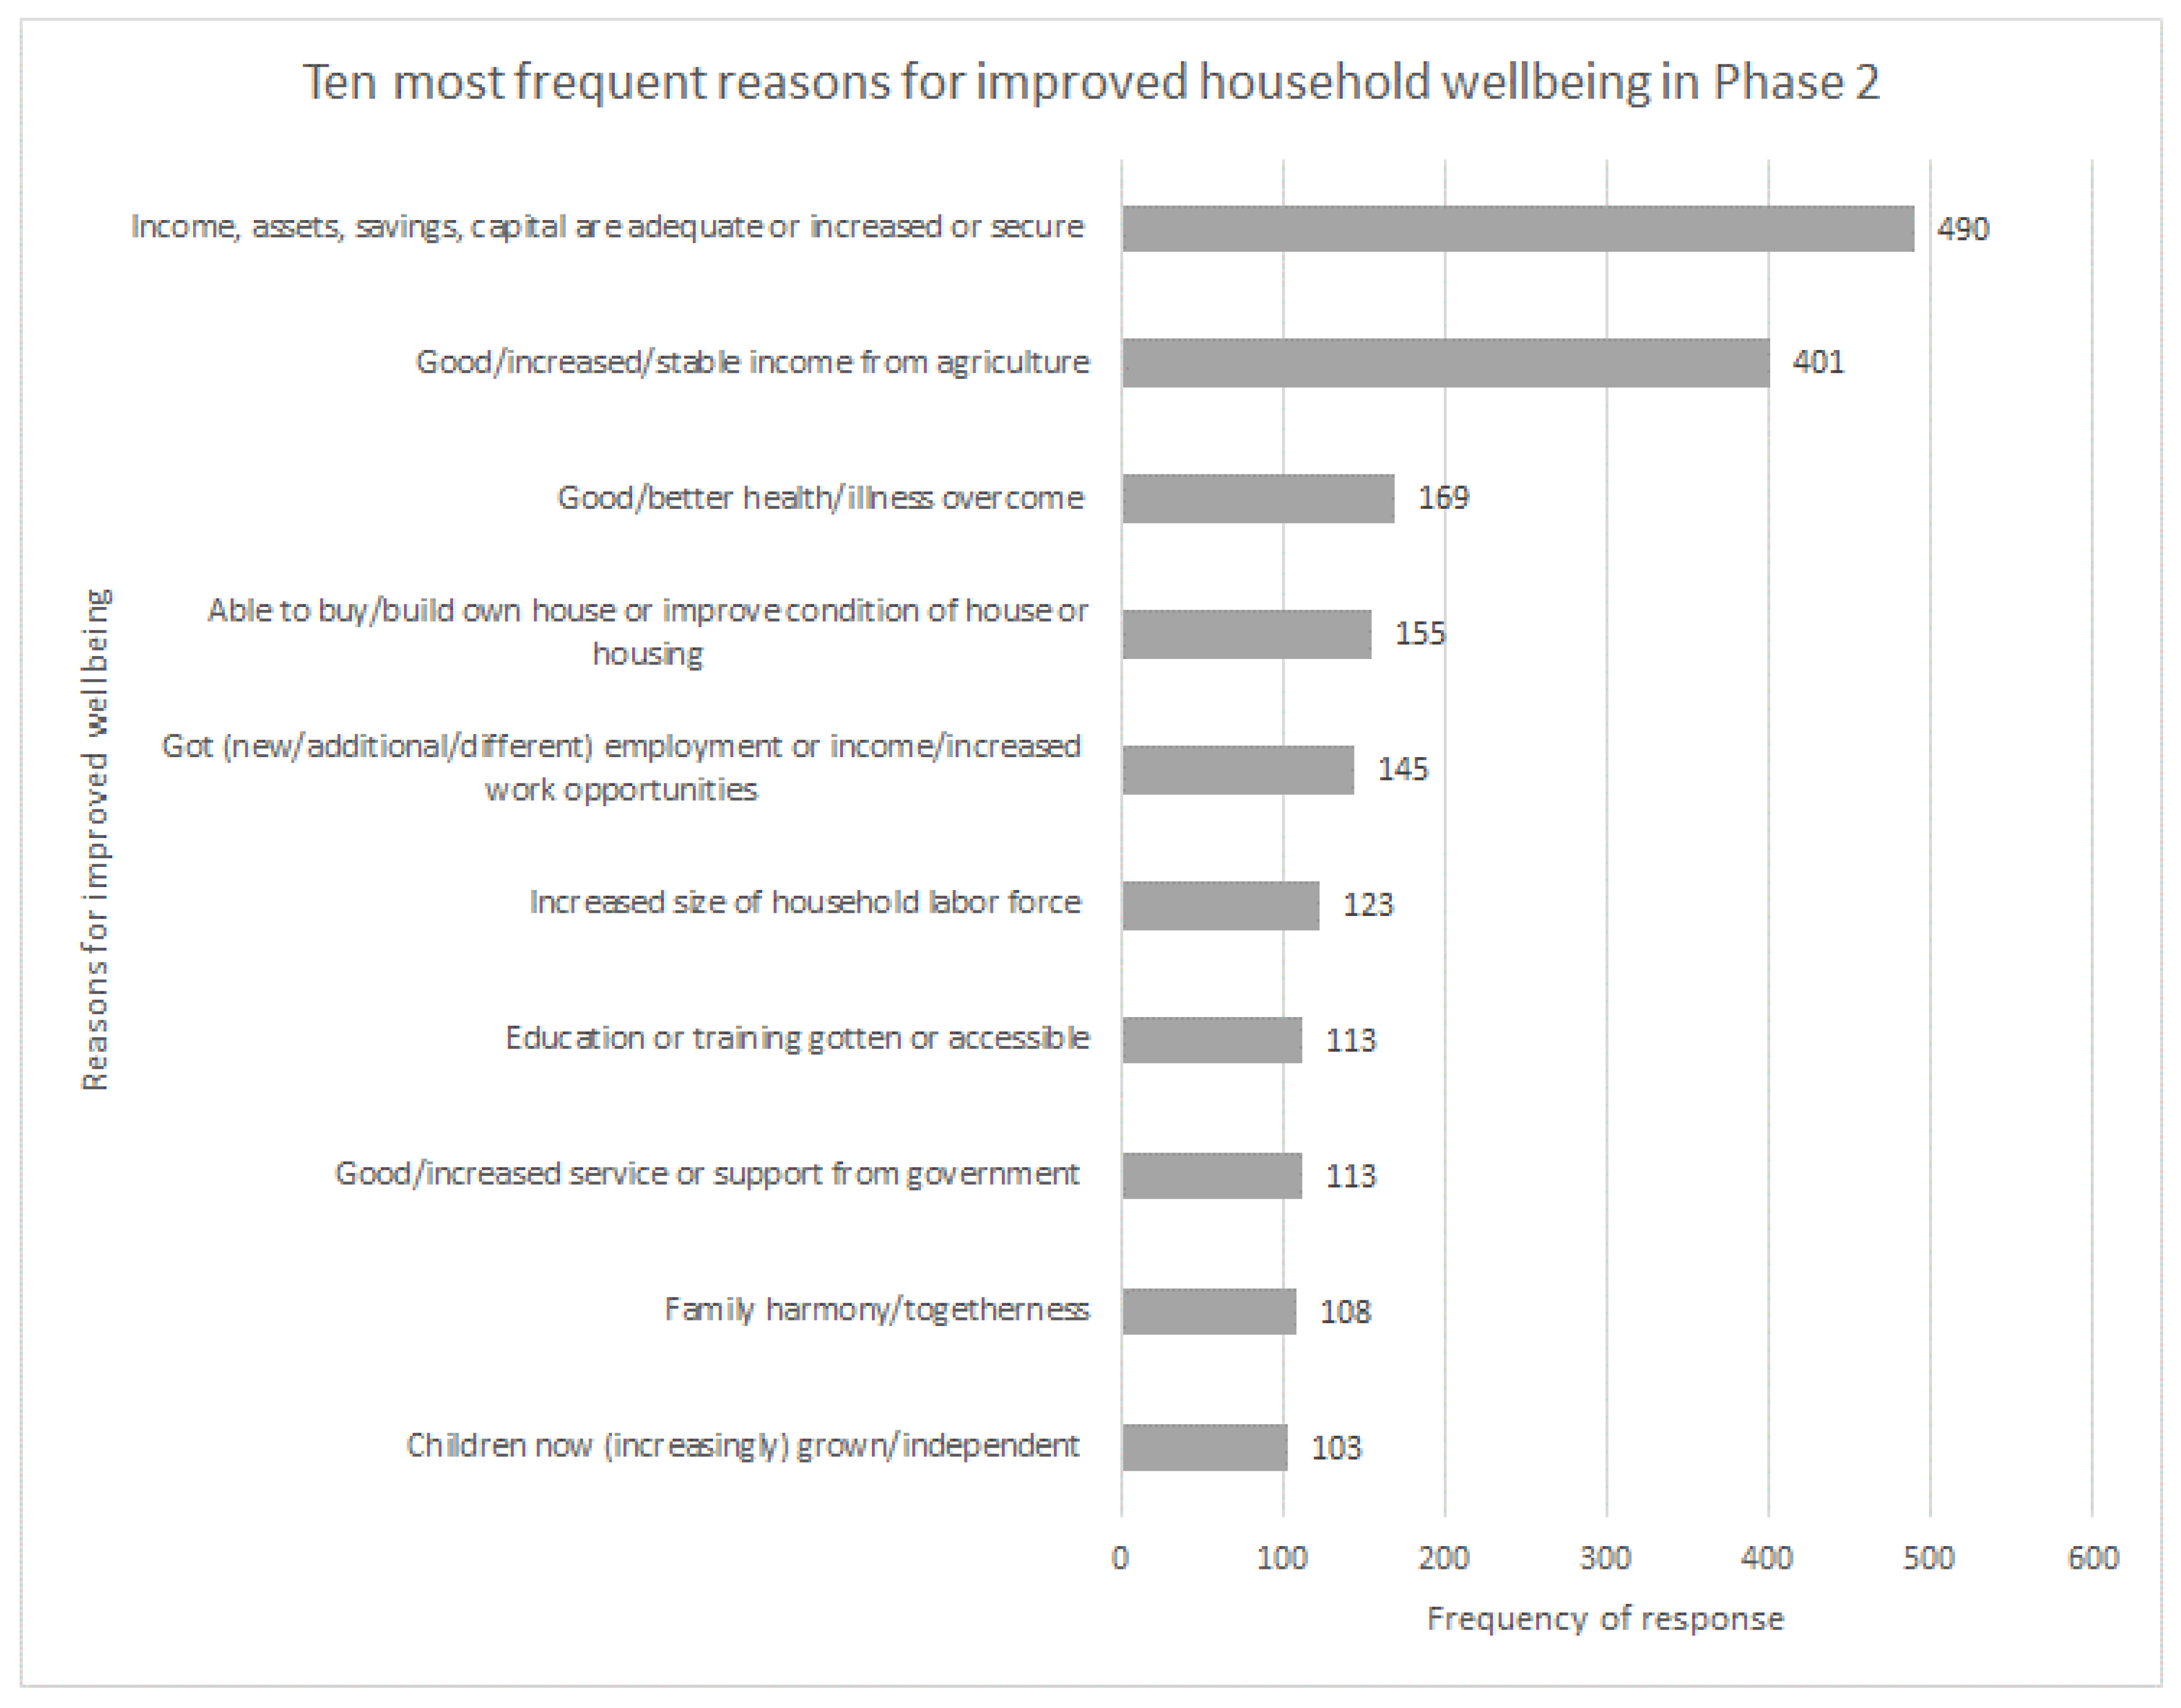
Figure 4.
Top ten reasons for perceived worsened well-being in phase 2, control and intervention households.
Figure 4.
Top ten reasons for perceived worsened well-being in phase 2, control and intervention households.

Table 1.
Change in perceived well-being and income sufficiency from phase 1 (2010–2012) to phase 2 (2013–2014) at control (C) and intervention (I) households at the aggregate level (pooled) and by country, specified by three closed-option responses.
Table 1.
Change in perceived well-being and income sufficiency from phase 1 (2010–2012) to phase 2 (2013–2014) at control (C) and intervention (I) households at the aggregate level (pooled) and by country, specified by three closed-option responses.
| Country | Treatment | Well-Being Change | Income Sufficiency | ||||
|---|---|---|---|---|---|---|---|
| Worse off | Same | Better off | Insufficient | Reasonable | Sufficient | ||
| Pooled | Before–After | - | + | ||||
| baseline C/I | - | + | + | ||||
| BACI | |||||||
| Brazil | Before–After | + | |||||
| baseline C/I | |||||||
| BACI | |||||||
| Peru | Before–After | + | - | - | + | ||
| baseline C/I | - | ||||||
| BACI | |||||||
| Cameroon | Before–After | - | + | - | + | + | |
| baseline C/I | - | + | |||||
| BACI | - | ||||||
| Tanzania | Before–After | - | + | ||||
| baseline C/I | - | ||||||
| BACI | - | + | - | ||||
| Indonesia | Before–After | - | + | - | - | + | |
| baseline C/I | |||||||
| BACI | |||||||
| Vietnam | Before–After | + | - | ||||
| baseline C/I | - | + | - | ||||
| BACI | |||||||
Table 2.
Effect of specific REDD+ interventions on perceived household well-being.
| Evaluation | Intervention Type | Total | |||||||
|---|---|---|---|---|---|---|---|---|---|
| Restriction on Forest Access and Conversion | Non-Conditional Livelihood Enhancement | Conditional Livelihood Enhancement | Tenure Clarification | Forest Enhancement | Environmental Education | Other | |||
| very negative | Count | 64 | 14 | 6 | 5 | 1 | 6 | 9 | 105 |
| % | 7.50% | 1.00% | 1.20% | 1.80% | 0.20% | 1.00% | 1.80% | 2.30% | |
| negative | Count | 132 | 94 | 11 | 19 | 20 | 17 | 33 | 326 |
| % | 15.40% | 6.90% | 2.20% | 7.00% | 3.70% | 2.80% | 6.70% | 7.00% | |
| neutral | Count | 284 | 450 | 146 | 82 | 137 | 224 | 250 | 1573 |
| % | 33.20% | 33.10% | 28.90% | 30.00% | 25.30% | 37.30% | 50.50% | 34.00% | |
| positive | Count | 321 | 640 | 289 | 147 | 359 | 287 | 172 | 2215 |
| % | 37.50% | 47.10% | 57.20% | 53.80% | 66.20% | 47.80% | 34.70% | 47.80% | |
| very positive | Count | 55 | 161 | 53 | 20 | 25 | 66 | 31 | 411 |
| % | 6.40% | 11.80% | 10.50% | 7.30% | 4.60% | 11.00% | 6.30% | 8.90% | |
| Total | Count | 856 | 1359 | 505 | 273 | 542 | 600 | 495 | 4630 |
| % | 100.00% | 100.00% | 100.00% | 100.00% | 100.00% | 100.00% | 100.00% | 100.00% | |
© 2017 by the authors. Licensee MDPI, Basel, Switzerland. This article is an open access article distributed under the terms and conditions of the Creative Commons Attribution (CC BY) license (http://creativecommons.org/licenses/by/4.0/).
Share and Cite
MDPI and ACS Style
Sunderlin, W.D.; De Sassi, C.; Ekaputri, A.D.; Light, M.; Pratama, C.D. REDD+ Contribution to Well-Being and Income Is Marginal: The Perspective of Local Stakeholders. Forests 2017, 8, 125. https://doi.org/10.3390/f8040125
AMA Style
Sunderlin WD, De Sassi C, Ekaputri AD, Light M, Pratama CD. REDD+ Contribution to Well-Being and Income Is Marginal: The Perspective of Local Stakeholders. Forests. 2017; 8(4):125. https://doi.org/10.3390/f8040125
Chicago/Turabian StyleSunderlin, William D., Claudio De Sassi, Andini Desita Ekaputri, Mara Light, and Christy Desta Pratama. 2017. "REDD+ Contribution to Well-Being and Income Is Marginal: The Perspective of Local Stakeholders" Forests 8, no. 4: 125. https://doi.org/10.3390/f8040125
Note that from the first issue of 2016, this journal uses article numbers instead of page numbers. See further details here.