Tree Growth Rings in Tropical Peat Swamp Forests of Kalimantan, Indonesia


1
Division Tropical Plant Production and Agricultural Systems Modelling, University of Göttingen, Grisebachstraße 6, D 37130 Göttingen, Germany
2
Center for International Forestry Research (CIFOR), P.O. Box 0113 BOCBD, Bogor 16000, Indonesia
*
Author to whom correspondence should be addressed.
Forests 2017, 8(9), 336; https://doi.org/10.3390/f8090336
Submission received: 30 June 2017
/
Revised: 4 September 2017
/
Accepted: 6 September 2017
/
Published: 9 September 2017
Abstract
:Tree growth rings are signs of the seasonality of tree growth and indicate how tree productivity relates to environmental factors. We studied the periodicity of tree growth ring formation in seasonally inundated peatlands of Central Kalimantan (southern Borneo), Indonesia. We collected samples from 47 individuals encompassing 27 tree species. About 40% of these species form distinct growth zones, 30% form indistinct ones, and the others were classified as in between. Radiocarbon age datings of single distinct growth zones (or “rings”) of two species showing very distinct rings, Horsfieldia crassifolia and Diospyros evena, confirm annual growth periodicity for the former; the latter forms rings in intervals of more than one year. The differences can be explained with species-specific sensitivity to the variable intensity of dry periods. The anatomical feature behind annual rings in Horsfieldia is the formation of marginal parenchyma bands. Tree ring curves of other investigated species with the same anatomical feature from the site show a good congruence with the curves from H. crassifolia. They can therefore be used as indicator species for growth rate estimations in environments with weak seasonality. The investigated peatland species show low annual growth increments compared to other tropical forests.
1. Introduction
Tree rings are a valuable tool of retrospective bio-indication, providing information on growth rates of trees, past climate conditions, dynamics and carbon sequestration rates of natural forest stands and much more [1]. Tree ring science in the tropics still often struggles with the old, oft-repeated and wrong assumption that tropical climates are uniform, which led to the likewise wrong assumption that tropical trees would not form annual tree rings [2,3]. In fact, there is overwhelming evidence showing distinct climate seasonality in respect to rainfall patterns in most part of the tropics [4]. These seasonal changes induce a cambial dormancy and consequently annual tree rings in the wood [5].
Globally, the first ever intensive studies on the periodicity of tropical tree growth and the existence of annual tree rings in the tropics were carried out on Java Island, Indonesia, already at the beginning of the 20th century [6,7,8,9]. To date, a large number of studies on tropical tree ring formation have been carried out in many regions of the world and on a huge number of tree species [10]. Recent tree ring studies on Java concentrated on the potential of teak chronologies for climate reconstruction [11,12,13,14]. These studies were based on the fact that tree rings are a consequence of seasonally varying precipitation patterns with annually occurring dry seasons. Another triggering factor for annual growth rhythmicity in trees is the annual flood pulse of large river systems such as the Amazon and its tributaries [15,16].
Peat swamp forests in SE-Asia are gaining public interest due to their fast deforestation, degradation and conversion into oil palm plantations and other agricultural systems, and the accompanying, often devastating, fires and massive greenhouse gas emissions (e.g., [17,18]). In contrast to their importance for global carbon storage [19,20], knowledge on the ecology, vegetation and growing conditions of swamp forests is rather poor. In particular, nothing is known about growth rates of tree species or carbon sequestration rates of intact forest stands in peat swamps. Tree ring research can be used for fast increment estimations to close this gap. However, as a precondition, basic research is needed to establish whether growth rings exist in trees of this unique forest type and if yes, whether they are annual or represent other environmental seasonalities. Finally, a possible climatic trigger for the annual growth ring formation needs to be indentified.
In hydrological terms, the peat swamp ecosystem seems to occupy an intermediate position between floodplains (e.g., in the Amazon [21]) and non-flooded forests. The apparent surplus of water in the ecosystem throughout the year makes seasonal drought stress (that could induce rings) at the first view unlikely. The level of inundation in the rainy season is much lower than in floodplains, and seasonal flood stress as a growth ring triggering factor seems to be unlikely as well. In order to understand growth ring formation in Borneo’s peatlands, one has to understand the more general dynamics of growth ring formation in non-flooded tropical rainforests of the region.
The current paper represents the first ever study on tree rings in a tropical peat swamp forest. We demonstrate annual ring formation in the specific hydrological situation of a peat swamp forest in Borneo. We collected additional samples in an “indigenous” rubber tree plantation in a non-flooded site on mineral soil, for comparison.
2. Sites, Material and Methods
2.1. Study Sites, Climate and Sample Collection
The main study site was a typical peat swamp forest near the village of Terantang Hilir, Kotawaringin Timur, Central Kalimantan, Indonesia (Site A in Figure 1; (2°24′17.68″ S, 113°8′20.98″ E)). The forest is located approximately at 22 m above sea level and has a mean tree stem density of 1314 stems/ha.
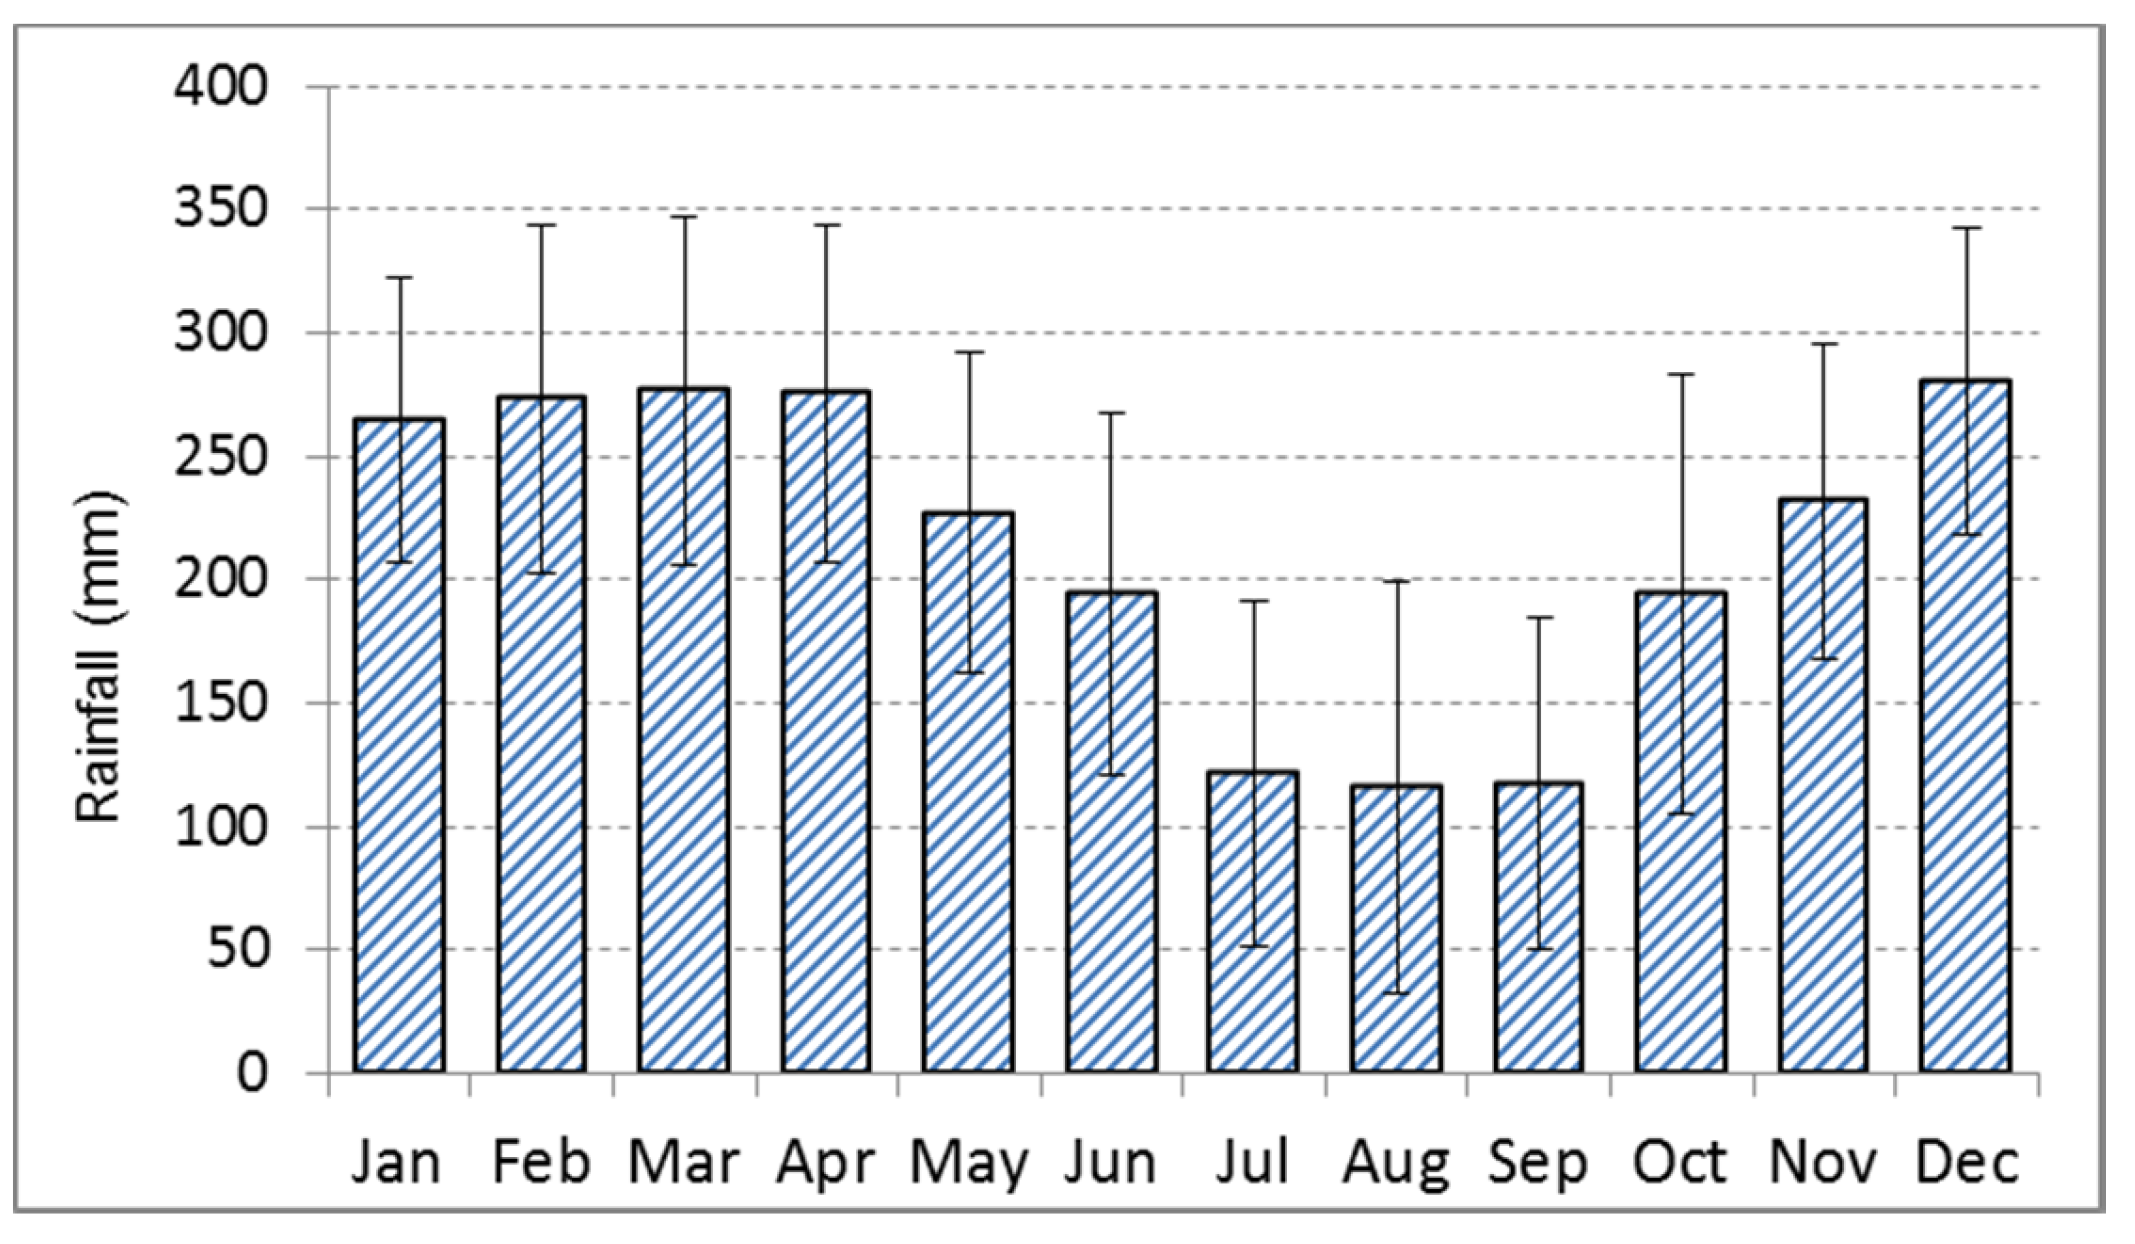
The climate in Central Kalimantan is characterized by a mean annual temperature of 27 °C with little variation throughout the year and a mean annual precipitation of 2572 mm (in the years 1901–2014) with extremes between 1660 and 3390 mm [22]. The precipitation follows a monsoon pattern with a relatively dry period from July until September with 110 mm precipitation per month in the long-term mean, and a rainy season in the rest of the year with 200 mm rainfall or more per month (Figure 2). The amount of precipitation in both seasons varies considerably from year to year. In typical El Nino years, the precipitation in the dry period drops to 40 mm in three months (e.g., in 1965), while in a La Nina year such as in 1972 the rainfall in the same period was 900 mm. Defining the dry period not according to fixed calendar months but as a period with arid climate conditions (here rainfall below 80 mm per month) is required, as there are years with dry periods varying from one to five months and others without a proper dry period but generally lower precipitation than in the rainy period. Between 1960 and 2016, about twenty years without any arid dry period were observed (Figure 3).
The trees grow on a peat layer several meters deep. The forest floor is inundated during the rainy season, while the groundwater level is a few centi- or decimeters or even meters below the forest floor during the dry season [23] depending on the site conditions and the climate in the particular year. Tree species frequently form pneumatophores (e.g., Shorea segundiflora, Alstonia pneumatophora) and knee roots as known from mangroves and Taxodium ssp. [24]. The forests in the entire region are exposed to heavy logging pressure by local communities. Small-scale saw mills were in operation in several locations.
In August 2014, we collected samples from 45 trees, comprising 26 species in 15 families in this site. Stem discs were taken either from trees already cut by the local loggers or from trees cut in the context of another scientific project [25]. The sampled species and tree dimensions are listed in Table 1.
The trees from the non-flooded terra firme area were collected in March 2015 in an indigenous rubber plantation on mineral soil (Mensiau Village, West Kalimantan, Indonesia, Site B in Figure 1; (2°24′17.68″ S, 113°8′20.98″ E). Stem discs from two rubber trees (Hevea brasiliensis) one from a 6- and one from an 8-years old plantation, respectively, were used for comparison with our peatland samples.
2.2. Disc Treatment and Analysis
The stem discs were carried to CIFOR in Bogor, Indonesia, air dried and polished with a sanding machine using belts of increasingly finer gradation (until 600) to improve the visibility of the growth zones (term used as a synonym of growth rings). The anatomical wood structure was analyzed using a Leica M50 binocular microscope (Leica, Wetzlar, Germany) in combination with a camera at 6.3, 10 and 16 and 25 magnifying levels.
The growth zone distinctiveness was subjectively examined and classified into indistinct, more-or-less-distinct, and distinct growth zones (examples are shown in Figure 4). Distinct growth zones are those with a clear density differentiation into early wood and late wood, a clear anatomical structure at the ring boundaries such as marginal parenchyma bands, ring-like unequally distributed vessels, or a re-occurring pattern of parenchyma and fiber bands [8,15,26] (e.g., Horsfieldia crassifolia). When classified as distinct, the structures should be visible over the entire stem disc, at least outside the center where the structure of the juvenile wood often slightly deviates from mature wood [9]. As indistinct, we classify those growth zones where ring structures are visible in the overview but a clear border between two growth zones is missing at higher magnification (e.g., Madhuca motleyana). More-or-less-distinct growth zones were all cases in between (e.g., Syzygium syzygioides).
We explored the periodicity of ring formation by two approaches. The simplest approach is to compare the number of rings of plantation trees with the age of the plantation—this was applied to the samples from the rubber plantation (the age was known from local informants). For natural forest trees, individual growth zones were age-dated by radiocarbon estimations on the base of the nuclear weapon effect [27]—the increase of the 14C-concentration in the atmosphere was due to the numerous atomic bomb tests in the 1950s and 1960s. This increase and the following decrease after the test ban treaty in 1963 is reflected worldwide in the wood of trees. The comparison of the number of rings with the number of years between the bark and the radiocarbon dated sample shows if the rings are formed annually or not. The analysis was performed on samples from Horsfieldia crassifolia and Diospyros evena, both showing very distinct rings. The growth zone delimitation in D. evena is characterized by density variations while in H. crassifolia a combination of density variations and parenchyma bands occurs (see below).
Next, the year of formation was determined for each individual growth zone. In the case of Horsfieldia, we followed two contrasting hypotheses concerning the ring structure: either (hypothesis 1) every parenchyma band represents a ring boundary, or (hypothesis 2) the rings are delimited by density variations, with several parenchyma bands between two late wood boundaries. To test these hypotheses for both species, a series of radiocarbon samples was prepared. The samples were collected with a precision drill borer. Wood dust was collected from up to five bore cores in order to gain sufficient material (>100 mg) for the radiocarbon analyses. These were performed in the laboratory of Beta Analytic Inc. (Miami, FL, USA), using Accelerator Mass Spectometry (AMS). The Beta Analytic sample codes are 408643 until 40865, 410587 and 410588.
The width of tree rings was measured with a LINTAB measuring device to the nearest 0.1 mm. In each sample disc, one radius was measured showing the highest number of visible rings. In two Horsfieldia samples, it was possible to measure two radii. For the statistical analysis of the ring width curves, we used the software TSAP (Rinntech, Heidelberg, Germany). Data quality is improved when samples allow comparison of tree ring time series among different individuals (cross dating). One measure is the so-called parallel run of the ups and downs of two compared curves [28]. We combined curves to a mean curve (chronology [1]) when the cross dating showed a statistically significant match to the 95% level or better (samples H. 3, H. 15, H. 40). In the same way, we compared a mean chronology of Horsfieldia sample curves with time series of annual precipitation, and rainfall in the rainy season (October–June of the next year) and in the dry period (July–September).
The growth rates were derived (a) from measured tree ring curves and (b) for Diospyros from the distance between radiocarbon dated individual growth zones and the bark.
The tree (disc) samples are stored at CIFOR campus in Bogor, Indonesia, and at University of Göttingen, Germany.
3. Results
3.1. Wood Anatomy
Worbes [5] identified four principal growth zone structures in tropical tree species. We could find all four types in the swamp forest (Figure 4A–E). Four swamp species show marginal parenchyma bands as delimiters of different growth zones. The other species form a pattern of alternating fiber and parenchyma tissue, varying vessel distribution or clear density variations between early and late wood. In some species, several of these features are combined (Table 1). Hevea brasiliensis growing on mineral soil forms very distinct rings based on growth zone types (a) and (b) (Figure 4F).
The majority of investigated species in the swamp forest produce distinct or more or less distinct growth zones. This is similar to observations from other forest types in the Neotropics [10,29]. Thirty-one percent of the species were classified as those with indistinct rings, even when ring structures are visible with the naked eye (Table 2). In these cases, a clear and sharp boundary between early and latewood is lacking, and/or the structures disappear in certain sectors of the stem disc (e.g., Dehaasia caesia). On the other hand, species with little apparent ring structures were classified as distinct, when under magnification a clear delimitation, e.g., by parenchyma bands, becomes visible (e.g., Magnolia bintuluensis).
3.2. Periodicity of Ring Formation
The number of rings in the two Hevea brasiliensis samples from the mineral soil (non-flooded terra firme) corresponds with 6 years and 8 years to the respective age of the plantations. This finding suggests that the growth zones are annual in nature.
For Horsfieldia, four out of seven growth zone samples could not be dated by radiocarbon analyses. Their radiocarbon value is, in all cases, around 100 pcM (percent modern = 0 Δ14C in the graph). This means that the rings were formed before the bomb peak was evident and therefore could not be linked with an exact age [31]. In any case, these rings were older than assumed if the ring counting was based on density variations. Three samples could be radiocarbon dated (Figure 5): These datings coincide with ring countings when considering the marginal parenchyma bands as limits between the growth zones. This suggests that the parenchyma bands define the tree rings and that these are annual in nature.
In Diospyros, tree ring boundaries are produced by density variations alone. Similar to the case described above, three samples were not datable (older than 1950) by radiocarbon analyses. Two samples provided radiocarbon ages (1959 and 1978). In both cases, the ring count suggested a younger age. The time lag between ring counting and radiocarbon age is 11 and 12 years respectively. The conclusion is that the clearly visible density variations in the wood of Diospyros do not represent annual rings but periods of growth of more than one year.
3.3. Ring Curves and Growth Rates
Having confirmed the annual nature of the parenchyma bands in Horsfieldia, we measured the ring widths of all samples of this species and those of Calophyllum hosei, Magnolia bintuluensis and Knema intermedia, all having a similar growth zone anatomy and structure. All tree ring curves showed year-by-year variations which can generally be traced back to climatic variability [28]. The similarity of these variations between different samples is expressed in % parallel run (PR) and serves in a first step as a validation of the quality of the measurements. As an example, two Horsfieldia curves from different individuals show a significant congruence of 65% PR (Figure 6). The same is true for the Horsfieldia (H15), the Calophyllum and the Magnolia curves. In a second step, we built an average chronology for Horsfieldia and cross dated this with different precipitation time series. A significant similarity is given for the annual precipitation and the precipitation in the dry season (Table 3).
In the long run, the Magnolia increment curve is relatively constant at a low increment level, while three out of the four Horsfieldia curves show a strong release at the same time around the year 2000 (Figure 6). Also, Calophyllum grows faster after the year 2000 than before (Table 4).
In total, the Magnolia sample is characterized by a very low diameter increment of 0.14 cm per year (Table 4). The same is true for the Horsfieldia samples in the time period before the year 2000. The growth rates of the Hevea samples are three- to six-fold higher than those from the other species.
4. Discussion
The idea of a year-round uniform climate, an absence of seasons and consequently, absence of annual tree rings in the tropics belongs to the most persistent but wrong paradigms in ecology and forest science since the beginning of the 20th century. In reality, seasonal rainfall patterns with at least one distinct dry period are found over most parts of the tropics [5]. In these regions, the existence of annual rings in trees has been confirmed for many species and ecosystems around the globe [10,33]. In some parts of the world, e.g., in East Africa, a pronounced bimodal climate type prevails with two rainy and two dry seasons. Consequently, trees form two growth zones per year [34,35].
Another triggering factor for an annual growth rhythm is seasonally occurring inundation in the floodplains of large river systems such as the Amazon, the Orinoco and their tributaries [5,36]. In the floodplains, the inundation causes a lack of oxygen in the root system, followed by reduced root metabolism and water transport, leaf shedding and cambial dormancy, which are the basic processes for the formation of visible growth zones in the wood [37].
Despite the numerous reports on tree rings in the tropics, the situation seems to be more complicated in Southeast Asia and Indian forests. While the pioneer of tropical dendrochronology, Coster [8,9], clearly demonstrated the existence of annual tree rings for many species and different climate zones on Java, recent tree ring studies in Southeast Asia seem to be restricted mainly to teak [38]. In studies of Malaysian forests, a lack of rings or the prevailing of indistinct rings are mentioned [39,40,41], and the same is reported for India (e.g., [42]), based on the interpretation of wood anatomical slides alone. In a recent study of Congo timber using wood anatomical properties, 40% of the evergreen species from moist forests were classified into the group of trees with distinct rings [26]. For the Indonesian islands, besides Java, tree ring studies are completely lacking.
The monomodal rainfall pattern that characterizes Kalimantan typically generally induces seasonal tree growth and, consequently, annual tree rings. Hence, it would have been surprising if annual tree ring formation were confined to peat swamp forest alone. Considering that tree rings had never before been demonstrated for Kalimantan, we carried out a simple test by including a tree from a non-flooded rainforest in the study. With this, indeed, we could demonstrate the existence of annual rings in Hevea brasiliensis trees from a plantation on mineral soil in West Kalimantan, as was shown earlier by Ogata et al. [43] for young rubber trees in peninsular Malaysia. This aligns with findings from other tropical regions with similar or even wetter climate conditions, e.g., in a Cameroonian [44] and in a Costa Rican lowland rainforest. At that latter site, the rainfall is higher and the dry period is shorter as in Kalimantan; nevertheless, some tree species shed their leaves in a period of a few weeks with little or no rainfall [45] and form annual rings [46].
In the peat swamp forests, however, the hydrological situation is comparatively complicated. The existence of pneumatophores and knee roots at our research site (and elsewhere) indicates high groundwater table and moderate flooding in certain periods of the year. Pneumatophores do not occur in ecosystems with high rising inundations as in the Amazon floodplains. The peat soils in the swamp forests of Borneo have a high water holding capacity which may dampen the effects of the dry periods on growth periodicity. However, during the dry period, the ground water table is lowering down considerably [20,47]. This could be the explanation for a peak of leaf shedding in Shorea uliginosa during the driest months in a peat forest on the west coast of Malaysia [48].
The tree ring structures of different species from our research in the swamp forest suggest several conclusions:
- (1)
- A periodically occurring stress factor induces cambial dormancy and consequently tree rings in the wood.
- (2)
- (3)
- In Diospyros, we found distinct growth zones (Figure 4b) based on density variations which obviously are not annual, but point to a stress factor with a non-annual periodicity.
- (4)
- For Horsfieldia, we demonstrated the existence of annual rings based on two independent methods. Successful radiocarbon based dating is supported by the similarity of time series from tree rings and precipitation (e.g., [49]). The anatomical feature of growth ring boundaries is the parenchyma bands as limits of growth zones overlaying less frequent patterns of density variations.
- (5)
- In a next step, we measured ring width curves from all species with marginal parenchyma bands as a growth zone delimiter. The successful cross dating of the tree ring sequences from Magnolia and Calophyllum with those from Horsfieldia indicates the annual nature of the growth rings in these species as well. The time series from Knema intermedia is too short for significant statistical comparisons but visually shows a good congruence with Horsfieldia and Calophyllum samples and the dry period rainfall curve. These findings indicate that all species with marginal parenchyma bands form annual rings.
The discrepancy between the findings from Diospyros and those of other species needs an explanation. The anatomical structure of tree rings is genetically fixed—this determines the pattern of the different cell types and the structure at the tree ring boundaries. The presence or absence of a triggering factor, however, may determine whether tree rings are formed or not.
While Worbes et al. [50] explained the indistinctiveness of growth zones in stem succulent tree species from Costa Rica with a very specific leaf-fall behavior and physiological adaptations, we hypothesize here that the reasons for the observed differences between the two tested species from the peat forest lie in the wood formation itself. The ring boundary in Knema, Horsfieldia and Magnolia is formed by a single row of parenchyma cells. This marginal parenchyma is a widespread feature in many tropical families [49]. The time for its formation at the end of a growing period might be relatively short [51] and the inducing factor probably weak. The formation of dense wood at the end of a growth zone (late wood), however, is a process over a longer period where several cell rows must be involved for the ring to become visible.
From conifer species in the tropics, we know intra-annual density variations in the wood reflecting either rainfall events in the dry season [5] or droughts in the rainy season [52]. This indicates the process of late wood formation as a sensitive process, which, however, is not distinct when the stress is low, e.g., in very wet dry seasons.
The detailed analysis of the rainfall patterns indicates a pronounced and extended dry season of up to four months for our Kalimantan site in some years while in other years there is—by our definition of drought as months with less than 80 mm precipitation—no drought stress at all. However, in all years, a more or less pronounced decrease in precipitation happens in the dry season. The mean dry season month has only 50% of the rainfall of an average rainy season month. The number of distinct dry seasons since 1960 obviously coincides with the number of visible density variations in Diospyros. The more sensitive reaction of parenchyma band formation, however, is triggered by a moderate decrease in precipitation during the dry season months.
The long-term pattern of the growth curves shows a constant and very low growth level in Magnolia. We assume that the sampled tree grew in the understorey under shadow during its entire life. For Horsfieldia, we observed in the same time period a sudden release in three out of four randomly sampled discs. This is the consequence of an external influence, very likely the reduction of competition [53]. Locals hinted that the studied forest was partially logged years before with a focus on the most valuable timber species (creaming).
Considering the results of our tree ring analysis and the radiocarbon dates, we measured very low growth rates of the tested species. Compared with tree ring based results from other tropical forests, Horsfieldia attains less than 30–50% of the growth rates of tree species with similar wood density [54]. The same is true for Magnolia compared with understorey tree species of a Cameroonian lowland forest [55]. This coincides with findings on general slow plant growth as a result of the low nutrient status of the peat soils and the complicated hydrological situation [56].
5. Conclusions
For the first time, we demonstrated, for Borneo peatlands, the existence of annual growth rings related to seasonal climate conditions. We could also demonstrate the formation of growth rings from planted rubber trees in a non-flooded Borneo site. The very specific hydrological situation of the studied peat swamp forest in Kalimantan results in severe differences in tree ring formation among species. While sensitive species—characterized by the presence of marginal parenchyma bands—form distinct annual growth zones, tree ring formation in other species follows the unpredictable occurrence of more pronounced dry periods (on average, occurring every two years). In order to use tree rings for the estimation of wood growth and carbon sequestration rates, the “parenchyma species” can act as an indicator species. The examples at hand indicate rather low increments in comparison with other tropical forest types.
Acknowledgments
The authors gratefully acknowledge the funding partners that have supported this research, which include the CGIAR Research Program on Forests, Trees and Agroforestry (CRP-FTA) with financial support from the donors contributing to the CGIAR Fund, the Norwegian Agency for Development Cooperation (Norad), and the International Climate Initiative (IKI) of the German Federal Ministry for the Environment, Nature Conservation, Building and Nuclear Safety (BMUB). We would like to thank M Taufik for extracting the 1901–2014 climate data for areas near Sampit, Central Kalimantan. The tree related data (e.g., scientific name, diameter, height, etc.) were provided by colleagues working on the same site under the Global Comparative Study on REDD+ research project. We would like to thank Uji Astrono, Solichin Manuri, Wiyono and Shijo Joseph for sharing the data with us. We thank Esther Fichtler for valuable recommendations and help in interpretation of tree ring structures. We acknowledge support by the Open Access Publication Funds of the Göttingen University.
Author Contributions
All three authors contributed in planning of the project and sampling during a field trip on Borneo. Hety Herawati measured tree ring curves, analysed the samples and wrote a first draft of the manuscript. Martin Worbes supervised the radiocarbon techniques, analysed data, performed graphs and tables and worked intensively on further versions of the manuscript. Christopher Martius restructured the paper and contributed substantially to the analysis and the different versions of the manuscript.
Conflicts of Interest
The authors declare that there is no conflict of interest.
References
- Schweingruber, F.H. Tree Rings and Environment: Dendroecology; Paul Haupt: Berne, Switzerland, 1996; p. 609. [Google Scholar]
- Schimper, A.F.W. Pflanzen Geographie auf Physiologischer; Grundlage: Jena, Germany, 1898. [Google Scholar]
- Whitmore, T.C. Tropical Rain Forests of the Far East; Clarendon Press: Oxford, UK, 1984; p. 352. [Google Scholar]
- Walter, H.; Lieth, H. Klimadiagramm-Weltatlas; Gustav Fischer Verlag: Jena, Germany, 1967. [Google Scholar]
- Worbes, M. How to measure growth dynamics in tropical trees a review. IAWA J. 1995, 16, 337–351. [Google Scholar] [CrossRef]
- Klebs, G. Über die periodischen Erscheinungen tropischer Pflanzen. Biol. Cent. 1912, 32, 257–285. [Google Scholar]
- Geiger, F. Anatomische Untersuchungen über die Jahresringbildung von Tectona grandis. Jahrb. Wiss. Bot. 1915, 55, 521–607. [Google Scholar]
- Coster, C. Zur Anatomie und Physiologie der Zuwachszonen und Jahresringbildung in den Tropen. Ann. Jard. Bot. Buitenzorg 1927, 37, 49–161. [Google Scholar]
- Coster, C. Zur Anatomie und Physiologie der Zuwachszonen und Jahresringbildung in den Tropen. Ann. Jard. Bot. Buitenzorg 1928, 38, 1–114. [Google Scholar]
- Worbes, M. One Hundred Years of Tree ring Research in the Tropics—A Brief History and an Outlook to Future Challenges. Dendrochronologia 2002, 20, 217–231. [Google Scholar] [CrossRef]
- D’Arrigo, R.D.; Jacoby, G.C.; Krusic, P.J. Progress in dendroclimatic studies in Indonesia. TAO 1994, 5, 349–363. [Google Scholar]
- D’Arrigo, R.; Wilson, R.; Palmer, J.; Krusic, P.; Curtis, A.; Sakulich, J.; Bijaksana, S.; Zulaikah, S.; Ngkoimani, L.O.; Tudhope, A. The reconstructed Indonesian warm pool sea surface temperatures from tree rings and corals: Linkages to Asian monsoon drought and El Nino-Southern Oscillation. Paleoceanography 2006, 21. [Google Scholar] [CrossRef]
- Hennig, K.; Helle, G.; Heinrich, I.; Neuwirth, B.; Karyanto, O.; Winiger, M. Toward multi-parameter records (ring width, δ13C, δ18O) from tropical tree-rings—A case study on Tectona grandis from Java, Indonesia. In TRACE—Tree Rings in Archaeology, Climatology and Ecology; GFZ Potsdam, Scientific Technical Report STR 11/07; Maaten-Theunissen, M., Spiecker, H., Eds.; GFZ: Potsdam, Germany, 2011; Volume 9, pp. 158–165. [Google Scholar]
- Schollaen, K.; Karamperidou, C.; Krusic, P.; Cook, E.; Helle, G. Multiple tree-ring chronologies (ring width, δ13C and δ18O) reveal dry and rainy season signals of rainfall in Indonesia. Quat. Sci. Rev. 2013, 73, 170–181. [Google Scholar] [CrossRef]
- Worbes, M. Growth rings, increment and age of trees in inundation forests, savannas and a mountain forest in the Neotropics. IAWA Bull. 1989, 10, 109–122. [Google Scholar] [CrossRef]
- Schöngart, J.; Piedade, M.F.T.; Ludwigshausen, S.; Horna, V.; Worbes, M. Phenology and stem-growth periodicity of tree species in Amazonian floodplain forests. J. Trop. Ecol. 2002, 18, 581–597. [Google Scholar] [CrossRef]
- Huijnen, V.; Wooster, M.J.; Kaiser, J.W.; Gaveau, D.L.A.; Flemming, J.; Parrington, M.; Inness, A.; Murdiyarso, D.; Main, B.; van Weele, M. Fire carbon emissions over maritime southeast Asia in 2015 largest since 1997. Sci. Rep. 2016, 6, 26886. [Google Scholar] [CrossRef] [PubMed]
- Parker, R.J.; Boesch, H.; Wooster, M.J.; Moore, D.P.; Webb, A.J.; Gaveau, D.; Murdiyarso, D. Atmospheric CH4 and CO2 enhancements and biomass burning emission ratios derived from satellite observations of the 2015 Indonesian fire plumes. Atmos. Chem. Phys. 2016, 16, 10111–10131. [Google Scholar] [CrossRef]
- Hirano, T.; Jauhiainen, J.; Inoue, T.; Takahashi, H. Controls on the Carbon Balance of Tropical Peatlands. Ecosystems 2009, 12, 873–887. [Google Scholar] [CrossRef]
- Dommain, R.; Couwenberg, J.; Joosten, H. Hydrological self-regulation of domed peatlands in south-east Asia and consequences for conservation and restoration. Mires Peat 2010, 6, 1–17. [Google Scholar]
- Junk, W.J.; Bayley, P.B.; Sparks, R.E. The flood pulse concept in river-floodplain-systems. In Canadian Special Publication of Fisheries and Aquatic Sciences 106, Proceedings of the International Large River Symposium, Honey Harbour, ON, Canada, 14–21 September 1989; Dodge, D.P., Ed.; Fisheries and Oceans: Ottawa, ON, Canada, 1989; pp. 110–127. [Google Scholar]
- Harris, I.; Jones, P.D.; Osborn, T.J.; Lister, D.H. Updated high-resolution grids of monthly climatic observations—The CRU TS3.10 Dataset. Int. J. Climatol. 2014, 34, 623–642. [Google Scholar] [CrossRef] [Green Version]
- Page, S.E.; Rieley, J.O.; Wust, R.A.J. Lowland tropical peatlands of Southeast Asia. In Peatlands: Basin Evolution and Depository of Records on Global Environmental and Climatic Changes; Developments in Earth Surface Processes Series; Martini, P., Martinez-Cortizas, A., Eds.; Elsevier: Amsterdam, The Netherlands, 2006; pp. 145–172. [Google Scholar]
- Breckle, S.W. Walter’s Vegetation of the Earth; Springer: New York, NY, USA, 2002; p. 527. [Google Scholar]
- Gonzalez de Tanago, J.; Lau, A.; Bartholomeus, H.; Herold, M.; Avitabile, V.; Raumonen, P.; Martius, C.; Goodman, R.C.; Disney, M.; Manuri, S.; et al. Estimation of above-ground biomass of large tropical trees with Terrestrial LiDAR. Methods Ecol. Evol. 2017. accepted. [Google Scholar]
- Tarelkin, Y.; Delvaux, C.; De Ridder, M.; El Berkani, T.; De Cannière, C.; Beeckman, H. Growth-ring distinctness and boundary anatomy variability in tropical trees. IAWA J. 2016, 37, 275–294. [Google Scholar] [CrossRef]
- Worbes, M.; Junk, W.J. Dating tropical trees by means of 14C from bomb tests. Ecology 1989, 70, 503–507. [Google Scholar] [CrossRef]
- Schweingruber, F.H. Tree Rings—Basics and Applications; Kluwer Academic Publishers: Dordrecht, The Netherlands, 1988; p. 276. [Google Scholar]
- Roig, F.A.; Jimenez Osornia, J.J.; Villanueva Diaz, J.; Luckman, B.; Tiessen, H.; Medina, A.; Noellemeyer, E.J. Anatomy of growth rings at the Yucatán Peninsula. Dendrochronologia 2005, 22, 187–193. [Google Scholar] [CrossRef]
- Worbes, M.; Raschke, N. Carbon allocation in a Costa Rican dry forest derived from tree ring analysis. Dendrochronologia 2012, 30, 231–238. [Google Scholar] [CrossRef]
- Nydal, R.; Lövseth, K. Tracing Bomb 14C in the Atmosphere 1962–1980. J. Geophys. Res. 1983, 88, 3621–3642. [Google Scholar] [CrossRef]
- Hua, Q.; Barbetti, M.; Worbes, M.; Head, J.; Levchenko, V.A. Review of Radiocarbon Data from Atmospheric and Tree Ring Samples for the Period 1950–1977 AD. IAWA J. 1999, 20, 261–284. [Google Scholar] [CrossRef]
- Brienen, R.J.W.; Schöngart, J.; Zuidema, P.A. Tree rings in the tropics: Insights into the ecology and climate sensitivity of tropical trees. Trop. Tree Physiol. 2016, 6, 439–461. [Google Scholar]
- Jacoby, G.C. Overview of tree-ring analysis in tropical regions. IAWA Bull. 1989, 10, 99–108. [Google Scholar] [CrossRef]
- Gourlay, I.D. The definition of seasonal growth zones in some African Acacia species—A review. IAWA J. 1995, 16, 353–359. [Google Scholar] [CrossRef]
- Dezzeo, N.; Worbes, M.; Ishil, I.; Herrera, R. Growth rings analysis of four tropical tree species in seasonally flooded forest of the Mapire River, a tributary of the lower Orinoco River, Venezuela. Plant Ecol. 2003, 168, 165–175. [Google Scholar] [CrossRef]
- Worbes, M. The Forest Ecosystems of the Floodplains. In The Amazonian Floodplains; Junk, W.J., Ed.; Ecology of a Pulsing System; Ecological Studies 126; Springer: New York, NY, USA, 1997; pp. 223–265. [Google Scholar]
- Pumijumnong, N. Dendrochronology in Southeast Asia. Trees 2013, 27, 343–358. [Google Scholar] [CrossRef]
- Sass, U.; Killmann, W.; Eckstein, D. Wood Formation in Two Species of Dipterocarpaceae in Peninsular Malaysia. IAWA J. 1995, 16, 371–384. [Google Scholar] [CrossRef]
- Robertson, I.; Froyd, C.A.; Walsh, R.P.D.; Newbery, D.M.; Woodborne, S.; Ong, R.C. The dating of dipterocarp tree rings: Establishing a record of carbon cycling and climatic change in the tropics. J. Quat. Sci. 2004, 19, 657–664. [Google Scholar] [CrossRef]
- Azim, A.A.A.; Okada, N. Occurence and anatomical feature of growth rings in tropical rainforest trees in Peninsular Malaysia: A preliminary study. Tropics 2014, 23, 15–31. [Google Scholar] [CrossRef]
- Nath, C.D.; Munoz, F.; Pélissier, R.; Burslem, D.F.R.P.; Muthusankar, G. Growth rings in tropical trees: Role of functional traits, environment, and phylogeny. Trees 2016, 30, 2153–2175. [Google Scholar] [CrossRef]
- Ogata, Y.; Nobuchi, T.; Fujita, M.; Sahri, M.H. Growth rings and tree growth in young para rubber trees from Peninsular Malaysia. IAWA J. 2001, 22, 43–56. [Google Scholar] [CrossRef]
- Newbery, D.M.; van der Burgt, X.M.; Worbes, M.; Chuyong, G.B. Transient dominance in a central African rain forest. Ecol. Monogr. 2013, 83, 339–382. [Google Scholar] [CrossRef]
- Hazlett, D. Seasonal cambial activity for Pentaclethra, Goelthalsia, and Carapa trees in a Costa Rica lowland forest. Biotropica 1987, 19, 357–360. [Google Scholar] [CrossRef]
- Fichtler, E.; Clark, D.A.; Worbes, M. Age and Long-Term Growth of Trees in an Old-Growth Tropical Rain Forest, Based on Analyses of Tree Rings and 14C1. Biotropica 2003, 35, 306–317. [Google Scholar] [CrossRef]
- Sundari, S.; Hirano, T.; Yamada, H.; Kusin, K.; Limin, S. Effect of groundwater level on soil respiration in tropical peat swamp forests. J. Agric. Meteorol. 2012, 68, 121–134. [Google Scholar] [CrossRef]
- Ong, C.S.P.; Juan, J.C.; Yule, C.M. Litterfall production and chemistry of Koompassia malaccensis and Shorea uliginosa in a tropical peat swamp forest: Plant nutrient regulation and climate relationship. Trees 2015, 29, 527–537. [Google Scholar] [CrossRef]
- Schöngart, J.; Gribel, R.; Ferreira da Fonseca-Junior, S.; Haugaasen, T. Age and growth patterns of Brazil Nut trees (Bertholletia excelsa Bonpl.) in Amazonia, Brazil. Biotropica 2015, 47, 550–558. [Google Scholar]
- Worbes, M.; Blanchart, S.; Fichtler, E. Relations between water balance, wood traits and phenological behavior of tree species from a tropical dry forest in Costa Rica—A multifactorial study. Tree Physiol. 2013, 33, 527–536. [Google Scholar] [CrossRef] [PubMed]
- Trouet, V.; Mukelabai, M.; Verheyden, A.; Beeckman, H. Cambial growth season of brevi-deciduous Brachystegia spiciformis trees from South Central Africa restricted to four months. PLoS ONE 2012, 7, e47364. [Google Scholar] [CrossRef] [PubMed]
- Szejner, P. Tropical Dendrochronology: Exploring Tree Rings of Pinus oocarpa in Eastern Guatemala. Master’s Thesis, University of Goettingen, Goettingen, Germany, 2011. [Google Scholar]
- Baker, P.J.; Bunyavejchewin, S.; Oliver, C.D.; Ashton, P.S. Disturbance history and historical stand dynamics of a seasonal tropical forest in western Thailand. Ecol. Monogr. 2005, 75, 317–343. [Google Scholar] [CrossRef]
- Groenendijk, P.; Sass-Klaassen, U.; Bongers, F.; Zuidema, P.A. Potential of tree-ring analysis in a wet tropical forest: A case study on 22 commercial tree species in Central Africa. For. Ecol. Manag. 2014, 323, 65–78. [Google Scholar] [CrossRef]
- Worbes, M.; Staschel, R.; Roloff, A.; Junk, W.J. Tree Ring Analysis Reveals Age Structure, Dynamics and Wood Production of a Natural Forest Stand in Cameroon. For. Ecol. Manag. 2003, 173, 105–123. [Google Scholar] [CrossRef]
- Daryono, H. Potensi, permasalahan dan kebijakan yang diperlukan dalam pengelolaan hutan dan lahan rawa gambut secara lestari. J. Anal. Kebijak. Kehutan. 2009, 6, 71–101. [Google Scholar]
Figure 1.
Research sites at the Island of Borneo in the Indonesian part (Kalimantan): (A) peat swamp forest near the village Terantang Hilir in the province Kotawaringin Timur-Central Kalimantan; (B) Rubber plantation near the village Mensiau in Kapuas Hulu-West Kalimantan.
Figure 1.
Research sites at the Island of Borneo in the Indonesian part (Kalimantan): (A) peat swamp forest near the village Terantang Hilir in the province Kotawaringin Timur-Central Kalimantan; (B) Rubber plantation near the village Mensiau in Kapuas Hulu-West Kalimantan.
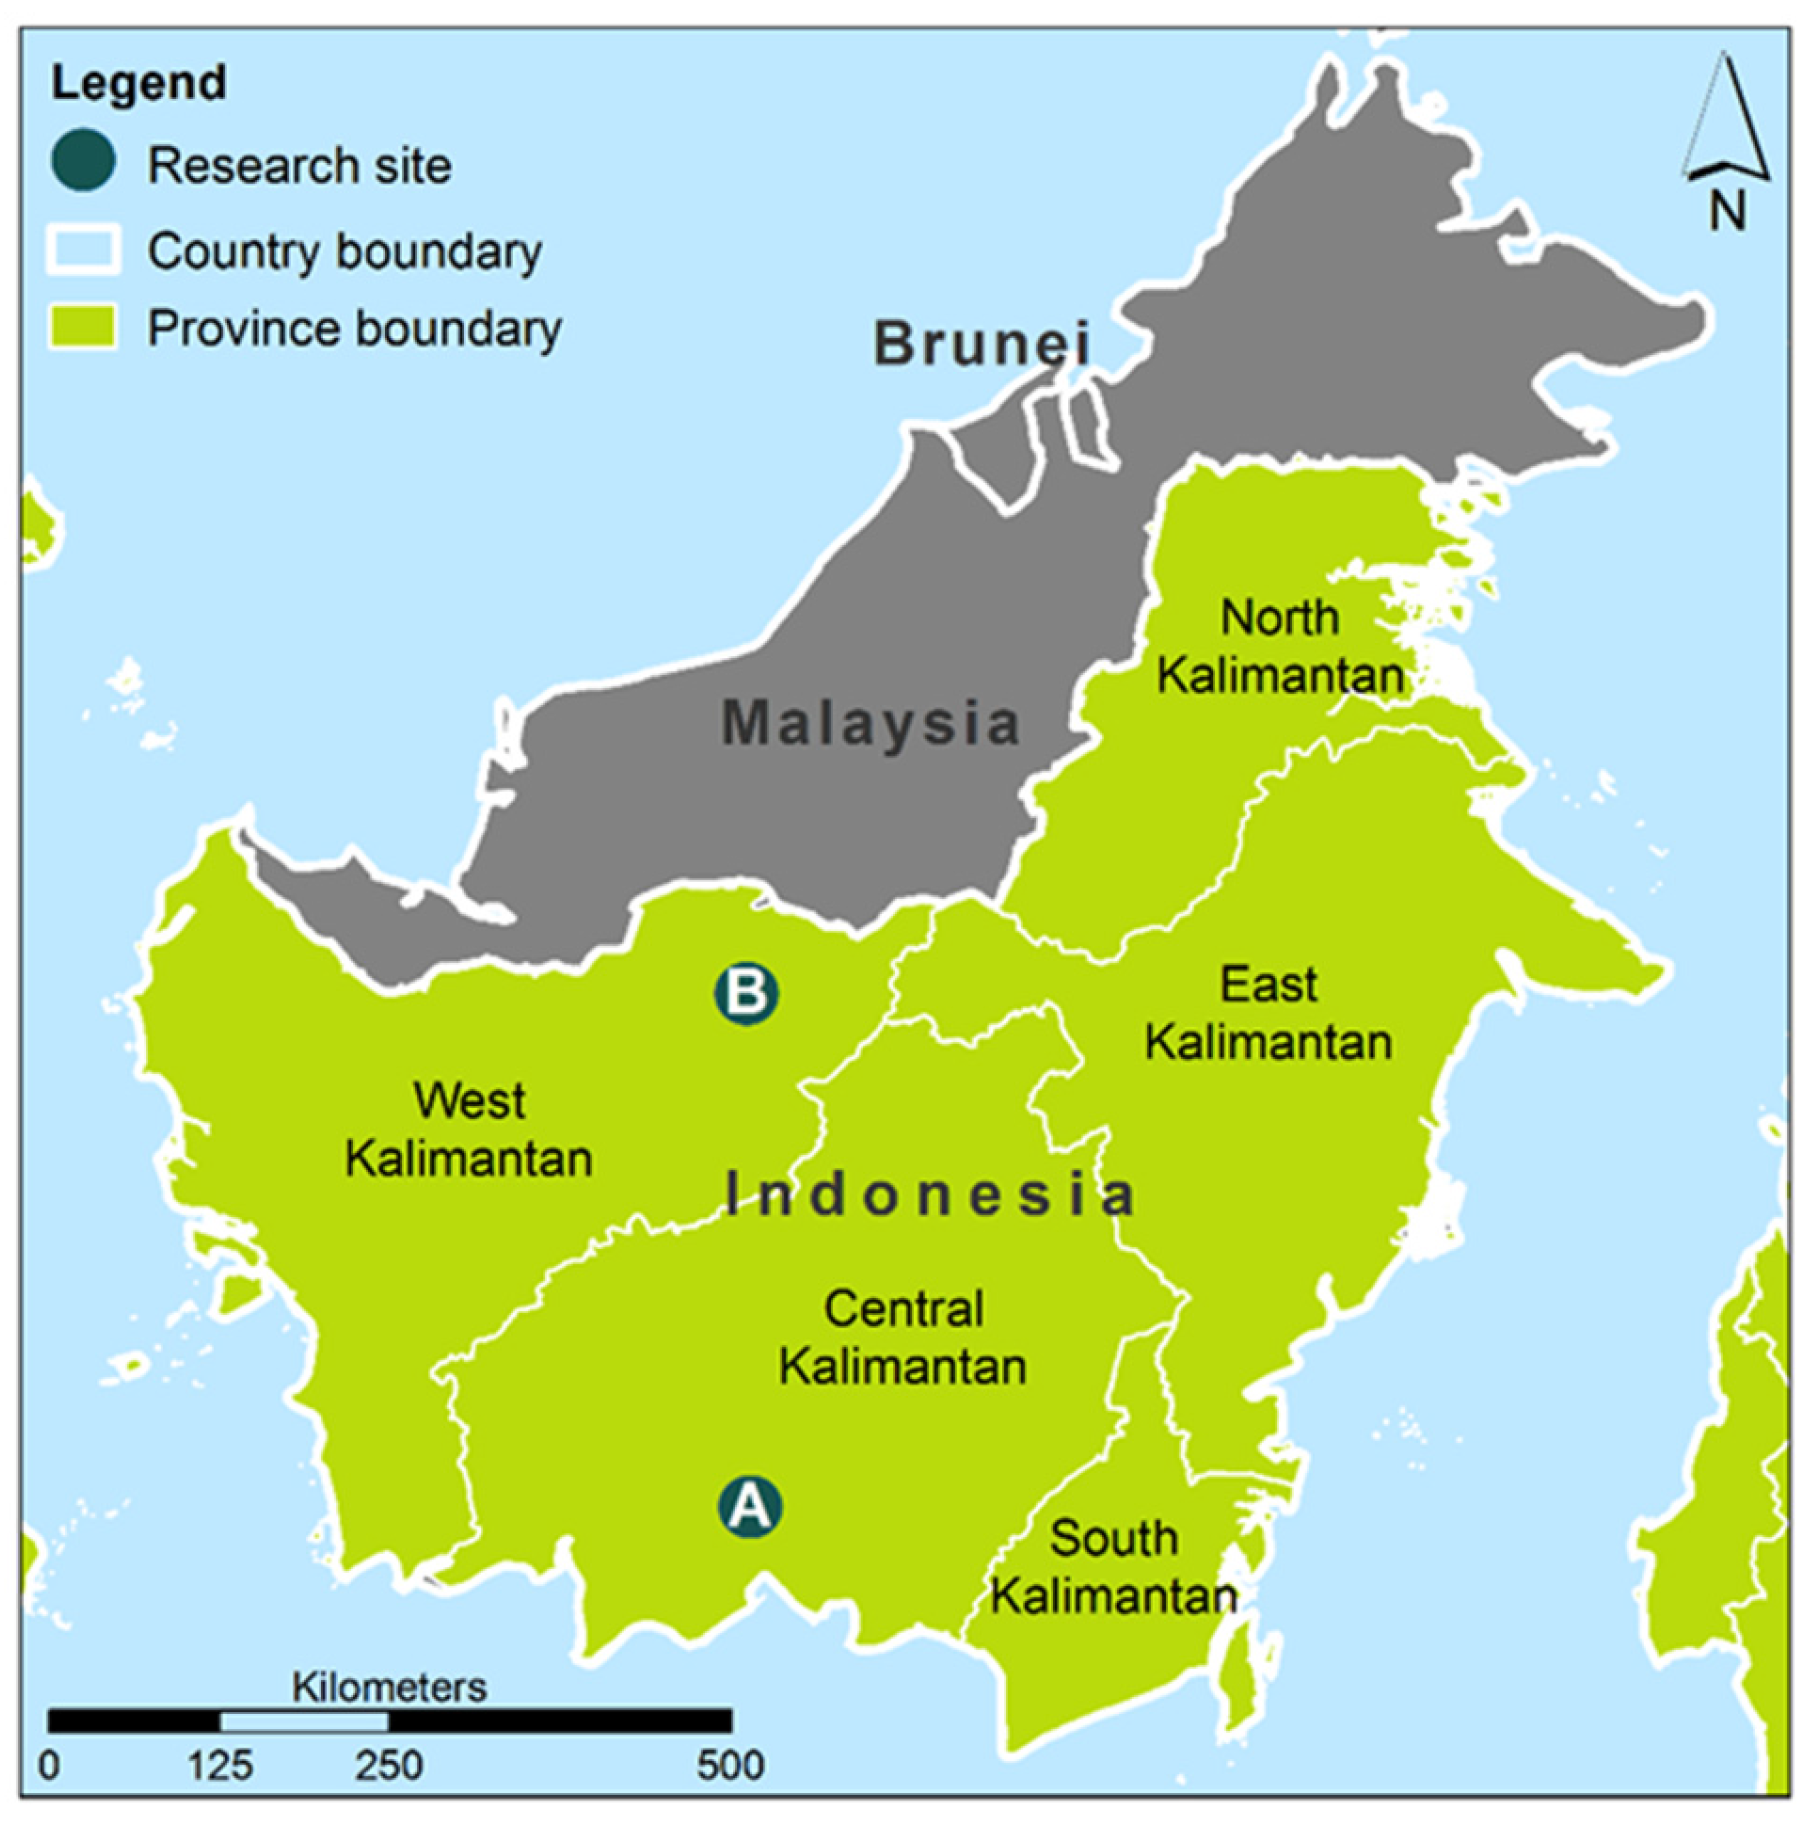
Figure 2.
Mean monthly rainfall and standard deviation (mm) at Sampit, Central Kalimantan, Indonesia for 1901–2014 [22]. The climate data is a 0.5 degree resolution data grid for the years 1901 to 2009 produced by the Climate Research Unit of University of East Anglia, UK, and available online http://www.cru.uea.ac.uk/cru/data/hrg/cru_ts_3.23/cruts.1506241137.v3.23/).

Figure 3.
Occurrence, length and position of dry periods (red beams) between 1960 and 2014 in Central Kalimantan. Dry period months are defined as those with less than 80 mm precipitation. Severe El Nino years are indicated (ENSO) and concur in most cases with severe dry periods of several months at the study site. Data source see Figure 2.
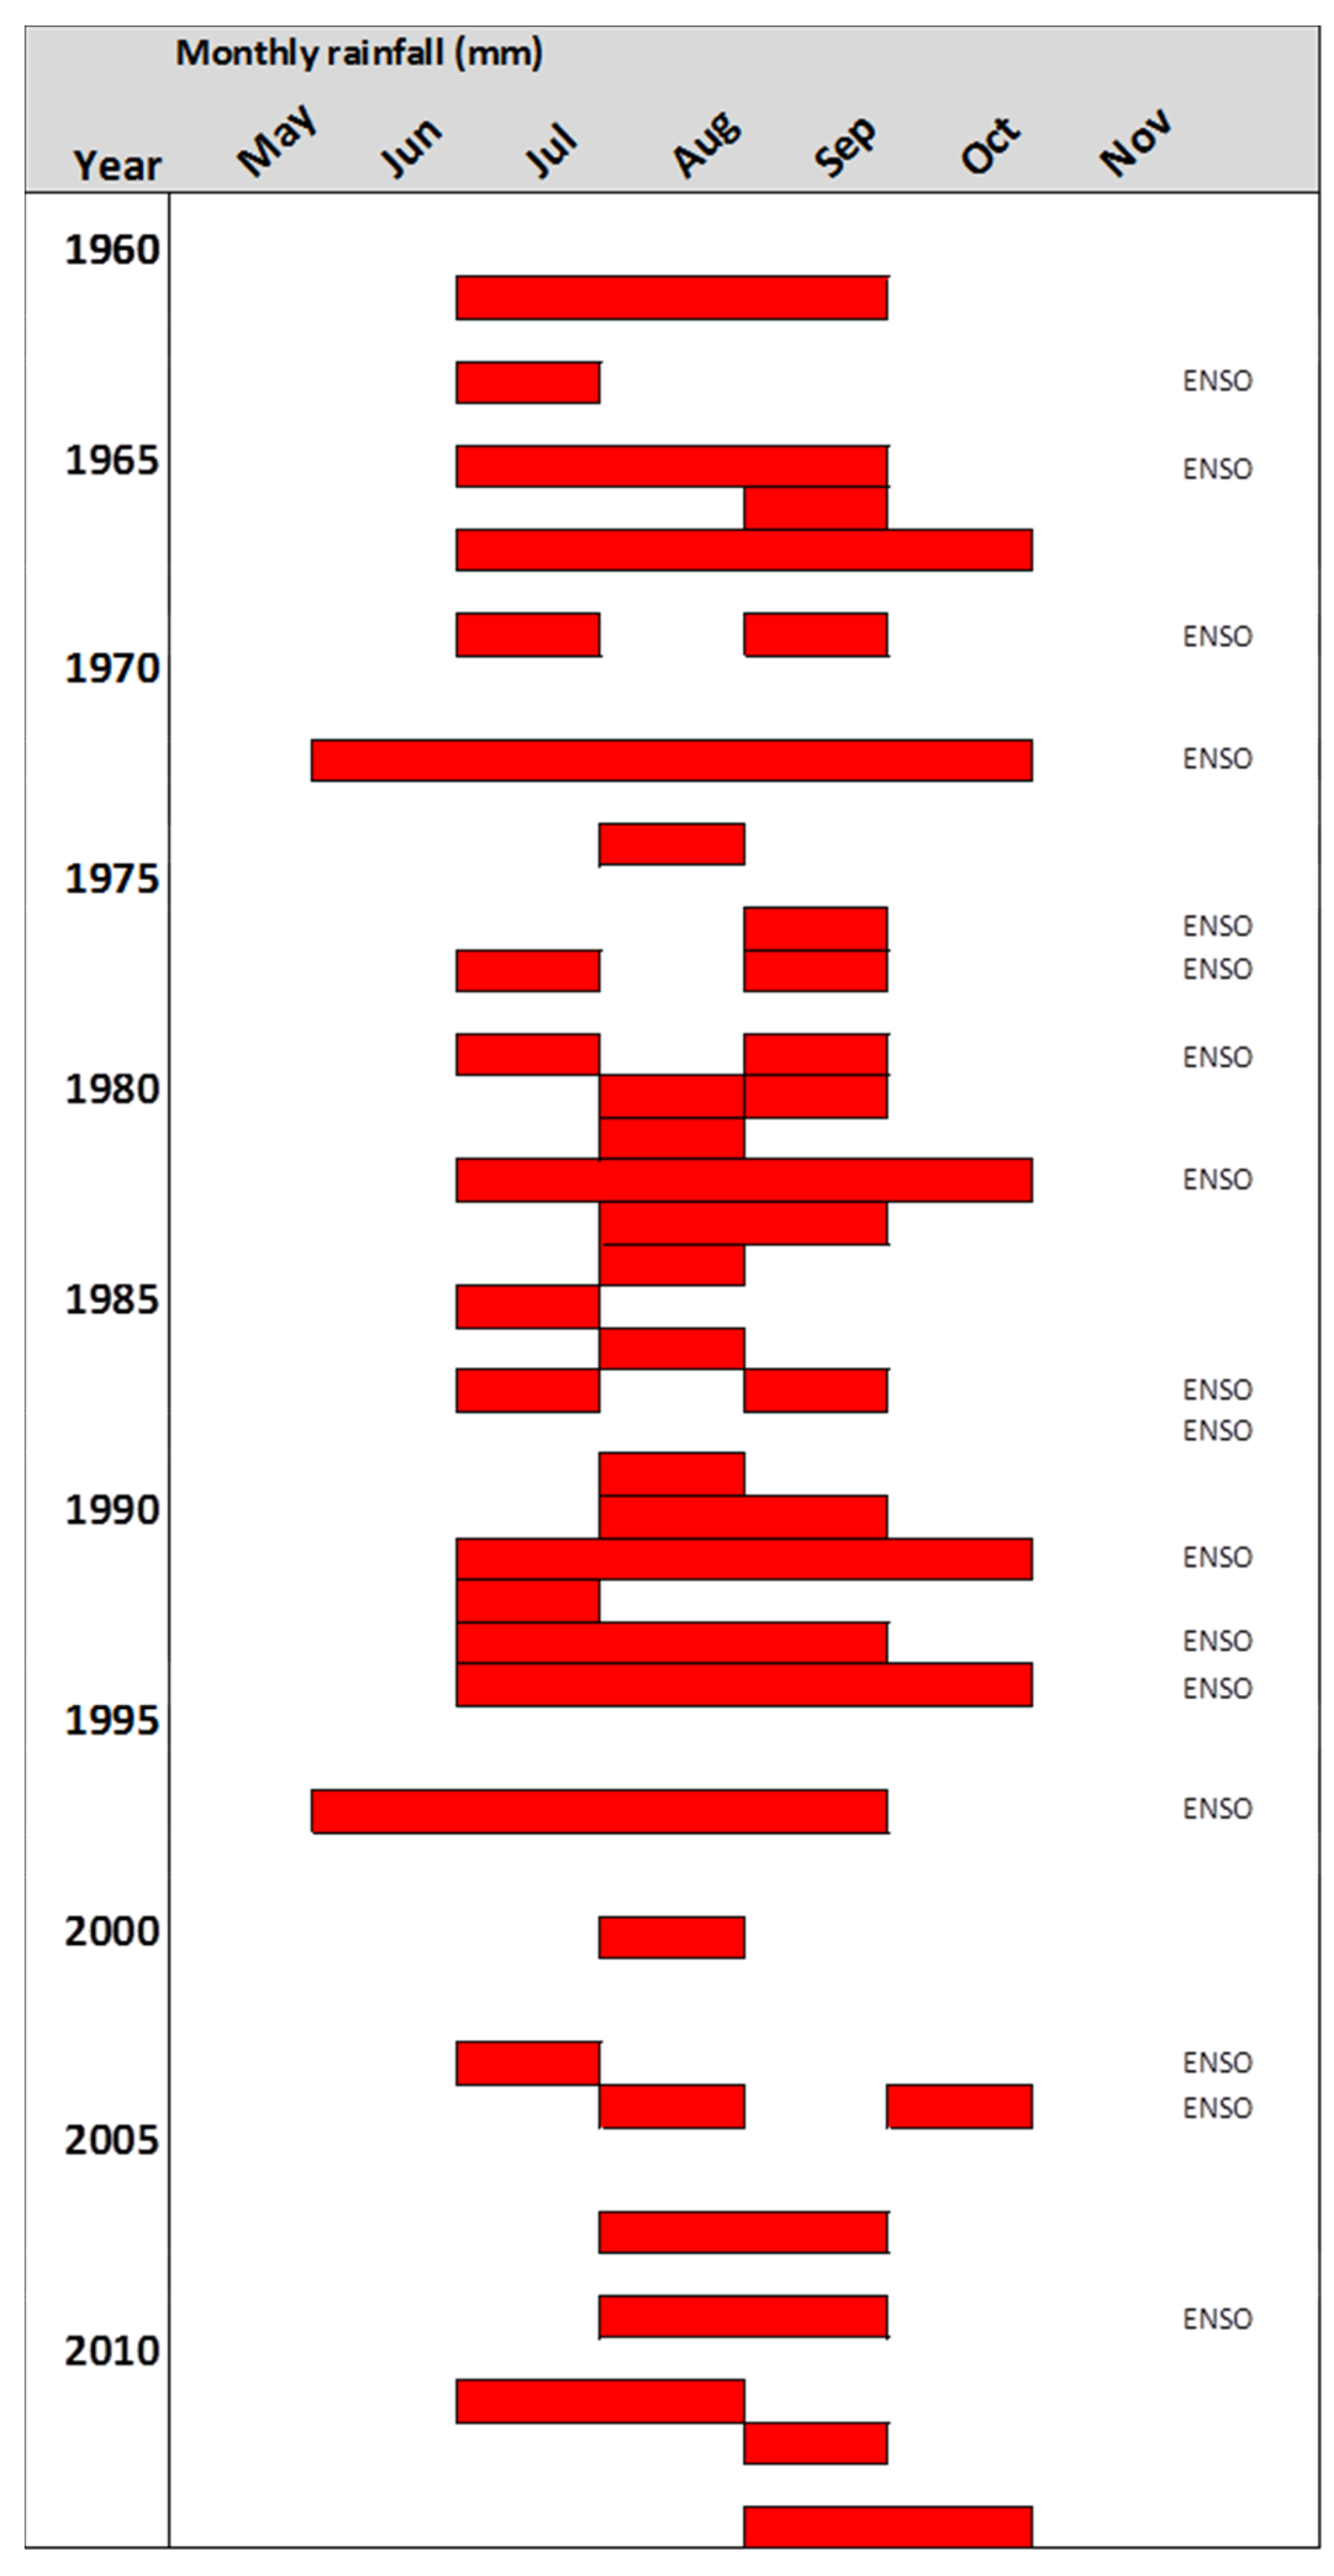
Figure 4.
Growth zone types and distinctiveness of growth zones of different tree species from swamp forest (A–E) and a non-flooded site (F) in Borneo. The samples were polished and the photos taken with a microscope digital camera. The tree ring boundaries are indicated by arrows. (A) Horsfieldia crassifolia (marginal parenchyma bands, distinct); (B) Diospyros evena (density variations, distinct); (C) Palaquium ridleyi (pattern of changing fiber and parenchyma tissue, distinct); (D) Tetramerista glabra (varying vessel distributions and parenchyma pattern, distinct); (E) Tristaniopsis grandifolia (indistinct); (F) Hevea brasiliensis (parenchyma pattern, distinct).
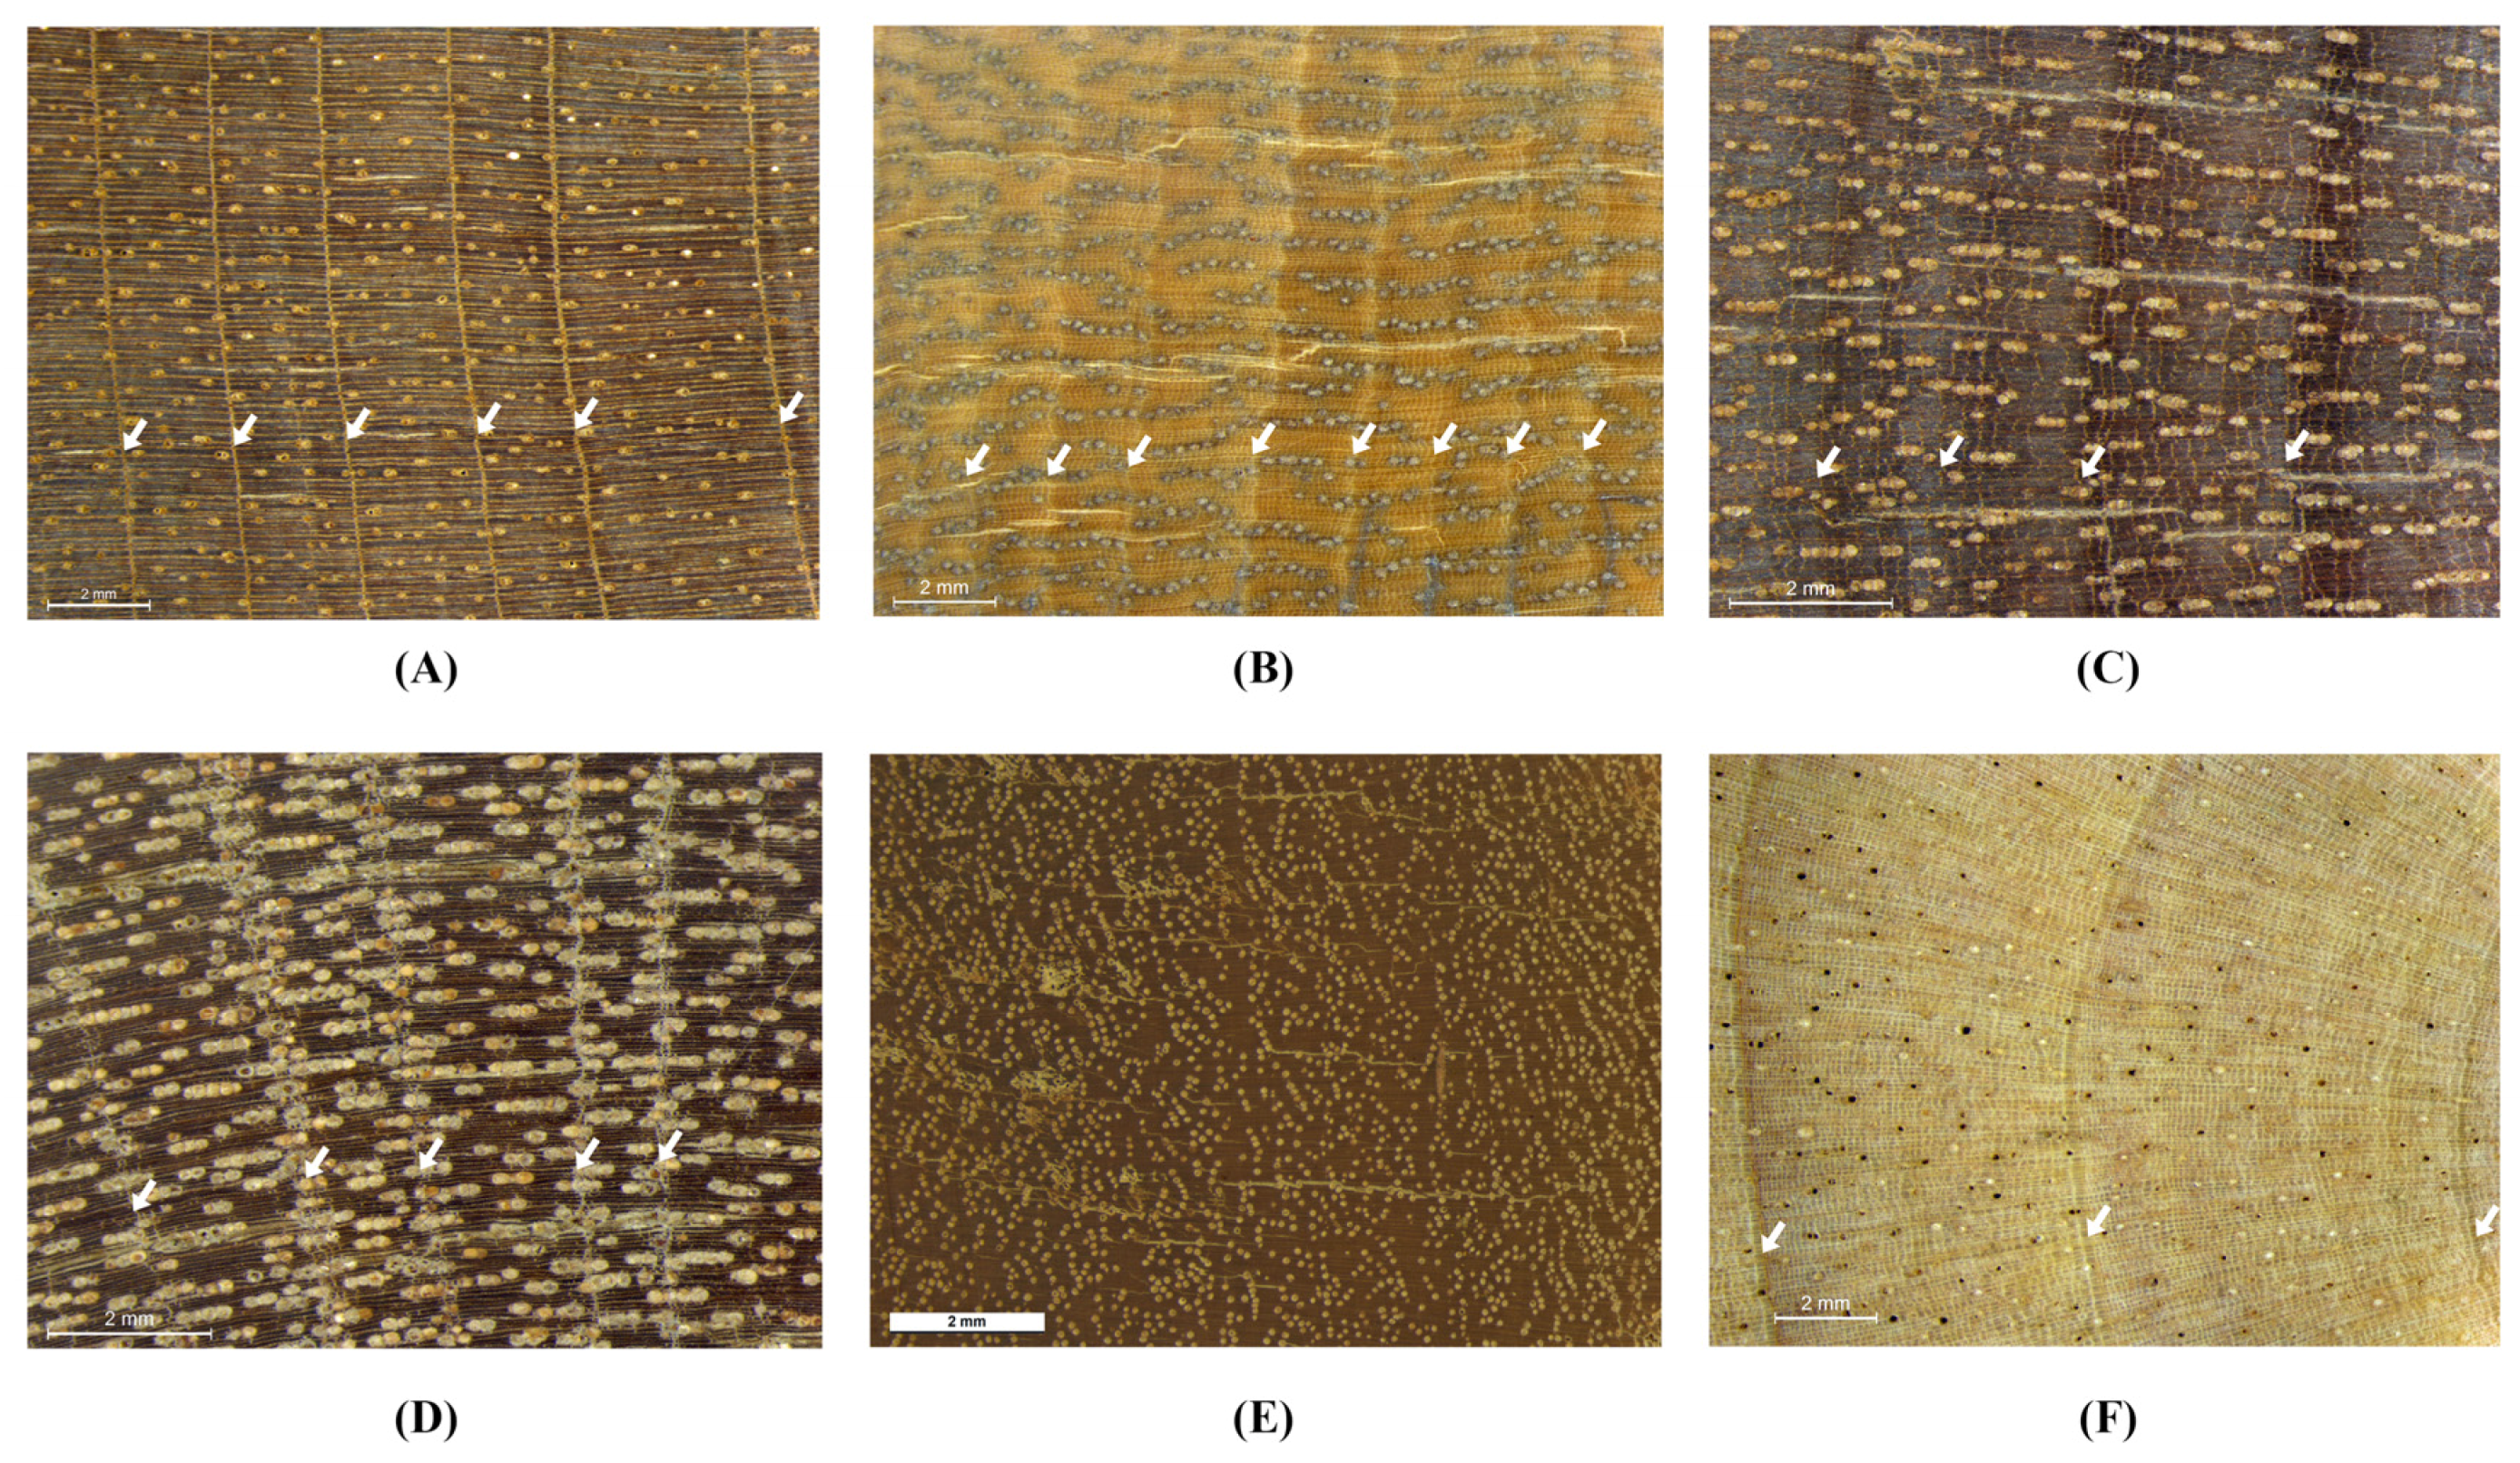
Figure 5.
Test of the growth periodicity of tree rings on the base of the bomb peak [27]. The age of visually pre-dated growth zones will be verified by radiocarbon dating. Results of several growth zones of Diospyros evena (years in ellipses) and Horsfieldia crassifolia (squares). Curve of atmospheric radiocarbon concentration (lines) from Hua et al. [32]. Misidentified years from the Diospyros sample are shown in italics and surrounded by dotted lines. Radiocarbon corrected ages are shown with solid lines. In rings of Horsfieldia limited by parenchyma bands, the predating by ring counting and the radiocarbon age is identical. If the precision of a 14C value (measurement error, e.g., Horsfieldia year 1975 = ±0.3Δ14C%O) is compared with the changes of atmospheric radiocarbon among years (1975/1976, Δ14C%O = 3.0 [32]), the latter exceeds the measurement error considerably at the descending branch of the curve (between 1965 and1994 in Figure 5). At the ascending branch (between about 1955 and the bomb peak), the difference in air radiocarbon from year to year is even higher (e.g., 1963/63: 14.1Δ14C%O). Before 1955 (back until 1640), the situation is contrasting and age determination with radiocarbon estimation impossible.
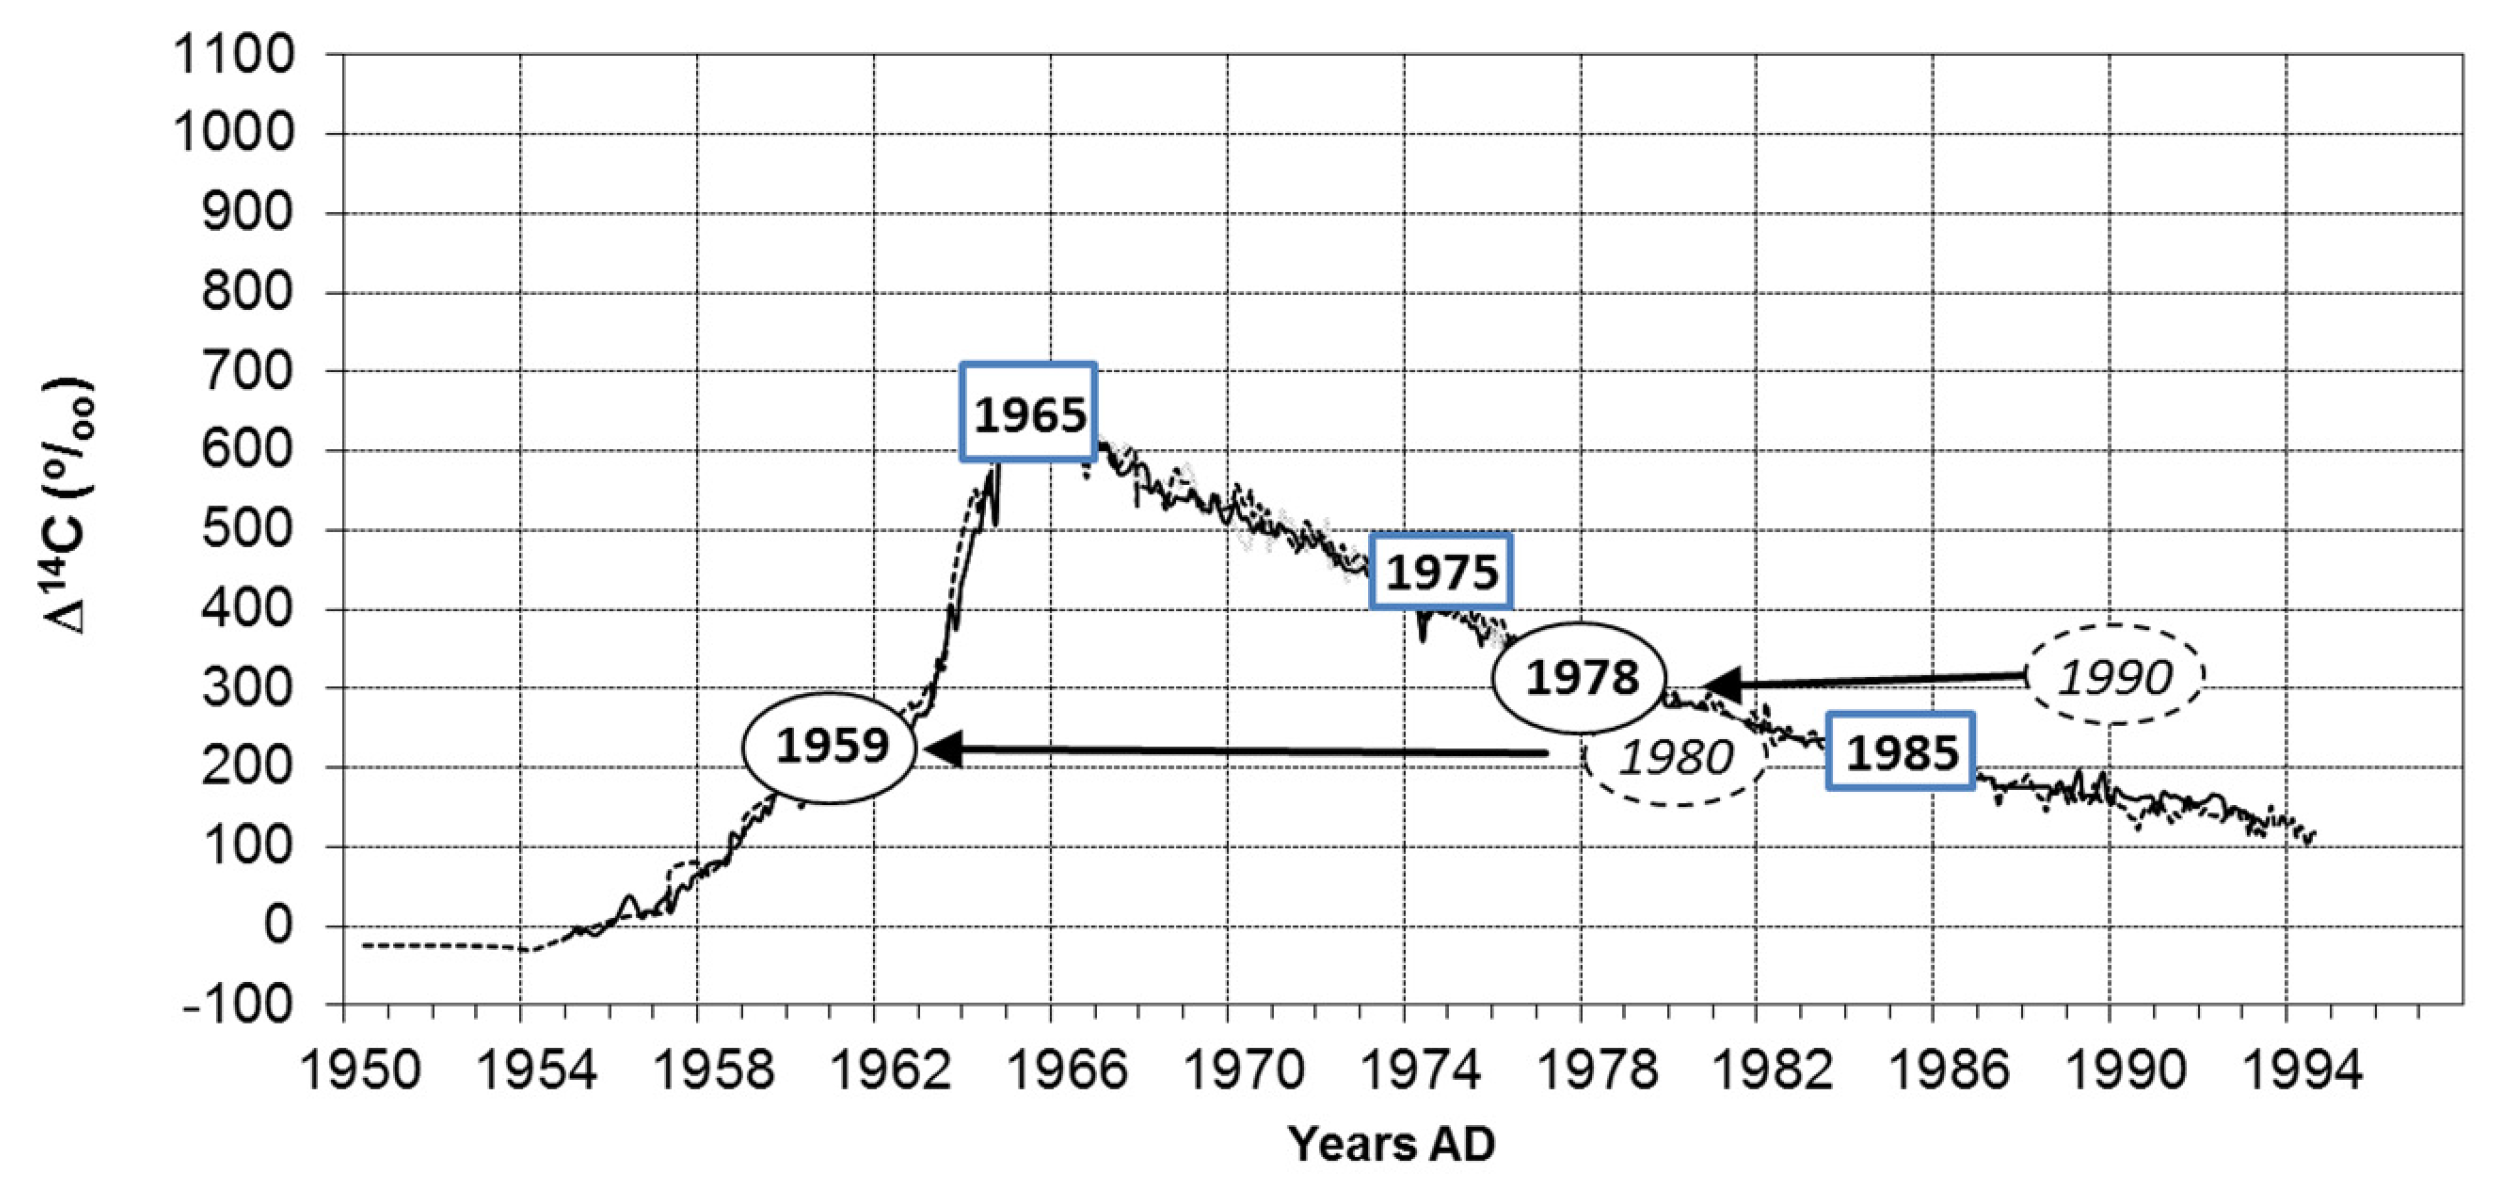
Figure 6.
Ring width curves of two samples from Horsfieldia crassifolia from a peat swamp forest near Terantang Hilir, Kalimantan, Indonesia. Note the sudden release after the year 2000 in both curves, likely as a result of nearby logging activities.
Figure 6.
Ring width curves of two samples from Horsfieldia crassifolia from a peat swamp forest near Terantang Hilir, Kalimantan, Indonesia. Note the sudden release after the year 2000 in both curves, likely as a result of nearby logging activities.


Table 1.
Overview of the samples and some anatomical features of the wood including family, species name, author, diameter at breast height (DBH), wood density, growth zone types and distinctiveness of growth zone boundaries. Distinctiveness is a subjectively recorded parameter based on visual inspection (examples in Figure 4, see also text, and [30]). The classification into four growth zone types follows [5]. Wood density is derived from the ICRAF wood density data base http://db.worldagroforestry.org//wd.
| No. | Family | Species | Author | DBH (cm) | Wood Density g/cm3 | Growth Zone Types | Distinctiveness | |||
|---|---|---|---|---|---|---|---|---|---|---|
| Density Variation | Marginal Parenchyma | Pattern of Fiber/Parenchyma | Vessel Distribution | |||||||
| 1 | Anacardiaceae | Campnosperma coriaceum | (Jack) Hallier f. | 31.6 | 0.43 ± 0.06 | X | X | +/− | ||
| 2 | Annonaceae | Xylopia fusca | Maingayi ex Hook. f. and Thomson | 28.0 | 0.34 ± 0.00 | X | − | |||
| 3 | Annonaceae | Mezzettia umbellata | Becc. | 15.8 | 0.65 ± 0.1 * | X | +/− | |||
| 4 | Annonaceae | Mezzettia parviflora | Becc. | 17.5 | 0.65 ± 0.1 * | X | +/− | |||
| 5 | Apocynaceae | Alstonia pneumatophora | Baker ex Den Berger | 27.3 | 0.33 ± 0.05 | X | − | |||
| 6 | Chrysobalanaceae | Parastemon urophyllus | (Wall. ex A.DC.)A. DC. | 38.8 | 0.96 ± 0.1 | X | X | +/− | ||
| 7 | Clusiaceae | Calophyllum hosei | Ridl. | 21.9 | 0.61 ± 0.10 * | X | + | |||
| 8 | Dipterocarpaceae | Shorea parvifolia | Dyer | 24.4 | 0.63 ± 0.14 * | X | X | + | ||
| 9 | Dipterocarpaceae | Shorea sp | 98.2 | 0.63 ± 0.14 * | X | X | + | |||
| 10 | Dipterocarpaceae | Shorea teysmanniana | Dyer ex. Brandis | 52.7 | 0.63 ± 0.14 * | X | X | + | ||
| 11 | Dipterocarpaceae | Dipterocarpus sp | 19.3 | 0.72 ± 0.1 * | X | X | − | |||
| 12 | Ebenaceae | Diospyros evena | Bakh. | 63.2 | 0.65 ± 0.70 | X | + | |||
| 13 | Euphorbiaceae | Hevea brasiliensis | (Willd. ex A.Juss.) Müll.Arg. | 19.0 | 0.48 ± 0.09 | X | + | |||
| 14 | Hypericaceae | Cratoxylum glaucum | Korth. | 33.9 | 0.54 ± 0.06 | X | X | + | ||
| 15 | Lauraceae | Dehaasia caesia | Blume | 21.6 | 0.77 ± 0.08 | X | − | |||
| 16 | Magnoliaceae | Magnolia bintuluensis | (A. Agostini) Noot. | 21.4 | 0.56 ± 0.02 | X | +/− | |||
| 17 | Meliaceae | Aglaia rubiginosa | (Hiern.) Pannell | 63.3 | 0.76 ± 0.11 * | X | + | |||
| 18 | Myristicaceae | Horsfieldia crassifolia | (Hook.f. and Thomson) Warb. | 32.1 | 0.48 ± 0.00 | X | + | |||
| 19 | Myristicaceae | Knema intermedia | Warb | 24.0 | 0.58 ± 0.06 * | X | + | |||
| 20 | Myrtaceae | Syzygium chloranthum | (Duthie) Merr. and L.M. Perry | 21.1 | 0.71 ± 0.10 * | X | X | − | ||
| 21 | Myrtaceae | Syzygium glaucum | (King) Chantaran. and J.Parn | 21.0 | 0.71 ± 0.10 | X | X | − | ||
| 22 | Myrtaceae | Syzygium syzygioides | (Miq.) Merr. and L.M.Perry | 27.3 | 0.85 ± 0.08 | X | X | +/− | ||
| 23 | Myrtaceae | Tristaniopsis merguensis | (Griff.) Peter G.Wilson and J.T. Waterh. | 12.6 | 1.05 ± 0.12 | ? | ? | ? | ? | − |
| 24 | Primulaceae | Rapanea borneensis | (Scheff.) Mez. | 20.7 | 0.72 ± 0.09 * | X | +/− | |||
| 25 | Sapotaceae | Palaquium ridleyi | King and Gamble | 17.1 | 0.39 ± 0.1 | X | X | +/− | ||
| 26 | Sapotaceae | Madhuca motleyana | (de Vriese) J.F.Macbr. | 29.8 | 0.53 ± 0.06 | X | X | − | ||
| 27 | Tetrameristaceae | Tetramerista glabra | Miq. | 57.6 | 0.73 ± 0.13 * | X | X | + | ||
Notes: − = indistinct; +/− = more or less distinct; + = distinct; * = mean of genus if species is not listed in the database or not determined; ? = structure is unclear.
Table 2.
Percentage of species from different sites and forest types, showing distinct (+), more-or-less-distinct (+/−) or indistinct (−) growth zones. Data from Amazonian floodplain forests [10], dry forest in Mexico [29], and swamp forest (this study).
| Growth Zone Type | Floodplain (Amazonia, 76 spp) | Dry Forest (Mexico, 52 spp) | Swamp Forest (Borneo, 26 spp) |
|---|---|---|---|
| Distinct (+) | 38 | 35 | 42 |
| More-or-less-distinct (+/−) | 51 | 52 | 27 |
| Indistinct (−) | 11 | 12 | 31 |
Table 3.
Results of cross dating (comparison) between different time series expressed as % parallel run between two curves respectively.
Table 3.
Results of cross dating (comparison) between different time series expressed as % parallel run between two curves respectively.
| Magnolia | Calophyllum | Chrono Horsfieldia | |
|---|---|---|---|
| Horsfieldia 3 | n.s. | 63 ** | 77 *** |
| Horsfieldia 4 | n.s. | n.s. | n.s. |
| Horsfieldia 15 | 67 ** | 60 * | 70 *** |
| Horsfieldia 40 | 53 (n.s.) | n.s. | 96 *** |
| Annual | n.s. | n.s. | 62 ** |
| Dry season | n.s. | n.s. | 61 ** |
| Rainy Season | n.s. | 59 * | n.s. |
* = significant to 95.0% level; ** = significant to 99.0% level; *** = significant to 99.9% level; (n.s.) = parallel run >50% but not significant; n.s.: parallel run <50% not significant; Climate time series = sum of precipitation in the calendar year (annual), from July–September (dry season) and October until June the following year (rainy season).
Table 4.
Diameter increment (cm year−1) together with the standard deviations of different species and different samples and the mean chronology from Horsfieldia. Displayed are the mean over the entire measuring period, the means from youth until the year 1999 and the means from the year 2000 until 2014. The samples from Knema and Hevea are too young for a comparison of the mentioned time periods.
| Period | Mean | Year <2000 | Year >2000 |
|---|---|---|---|
| Horsfieldia 3 | 0.21 ± 0.23 | 0.23 ± 0.16 | 0.64 ± 0.23 |
| Horsfieldia 4 | 0.34 ± 0.27 | 0.35 ± 0.29 | 0.34 ± 0.13 |
| Horsfieldia 15 | 0.29 ± 0.29 | 0.19 ± 0.14 | 0.75 ± 0.37 |
| Horsfieldia 40 | 0.30 ± 0.24 | 0.26 ± 0.19 | 0.58 ± 0.32 |
| Magnolia | 0.14 ± 0.09 | 0.15 ± 0.09 | 0.12 ± 0.05 |
| Calophyllum | 0.24 ± 0.09 | 0.23 ± 0.07 | 0.31 ± 0.13 |
| Chrono Horsfieldia | 0.27 ± 0.18 | 0.23 ± 0.15 | 0.45 ± 0.20 |
| Knema | 0.46 ± 0.20 | ||
| Diospyros | 0.26 ± 0.01 | ||
| Hevea (from terra firme rainforest) | 1.10 ± 0.10 |
© 2017 by the authors. Licensee MDPI, Basel, Switzerland. This article is an open access article distributed under the terms and conditions of the Creative Commons Attribution (CC BY) license (http://creativecommons.org/licenses/by/4.0/).
Share and Cite
MDPI and ACS Style
Worbes, M.; Herawati, H.; Martius, C. Tree Growth Rings in Tropical Peat Swamp Forests of Kalimantan, Indonesia. Forests 2017, 8, 336. https://doi.org/10.3390/f8090336
AMA Style
Worbes M, Herawati H, Martius C. Tree Growth Rings in Tropical Peat Swamp Forests of Kalimantan, Indonesia. Forests. 2017; 8(9):336. https://doi.org/10.3390/f8090336
Chicago/Turabian StyleWorbes, Martin, Hety Herawati, and Christopher Martius. 2017. "Tree Growth Rings in Tropical Peat Swamp Forests of Kalimantan, Indonesia" Forests 8, no. 9: 336. https://doi.org/10.3390/f8090336
Note that from the first issue of 2016, this journal uses article numbers instead of page numbers. See further details here.