Article

Ecological Structure of a Tropical Urban Forest in the Bang Kachao Peninsula, Bangkok

by
Montathip Sommeechai
1,2,
Chongrak Wachrinrat
1,2,*,
Bernard Dell
3,
Nipon Thangtam
4 and
Jamroon Srichaichana
5
1
Faculty of Forestry, Kasetsart University, Chatuchak, Bangkok 10900, Thailand
2
Center for Advanced Studies in Tropical Natural Resources, National Research University-Kasetsart University, Bangkok 10900, Thailand
3
School of Veterinary and Life Sciences, Murdoch University, Perth, Western Australia 6150, Australia
4
Faculty of Forestry, Kasetsart University, Chatuchak, Bangkok 10900, Thailand
5
Faculty of Humanities and Social Sciences, Thaksin University, Songkhla 90000, Thailand
*
Author to whom correspondence should be addressed.
Forests 2018, 9(1), 36; https://doi.org/10.3390/f9010036
Submission received: 20 November 2017 / Revised: 27 December 2017 / Accepted: 12 January 2018 / Published: 16 January 2018

Abstract

:
Rapid urbanization has changed the structure and function of natural ecosystems, especially floodplain ecosystems in SE Asia. The ecological structure of vegetation stands and the usefulness of satellite images was investigated to characterize a disturbed tropical urban forest located in the Chao Phraya River lower floodplain, Thailand. Nine sample plots were established on the Bang Kachao Peninsula (BKP) within 4 tropical forest types in an urban area: rehabilitation forest, home-garden agroforestry, mangrove and park. The tree habitats were beach forest, swamp forest, moist evergreen forest, dry evergreen forest, mangrove forest and abandoned orchard or home-garden. Normalized difference vegetation index (NDVI) values obtained from Landsat 7 satellite images were correlated with plant structure from field surveys. NDVI had the highest relationship with stand factors for number of families, number of species, Shannon-Weiner index and total basal area. Linear regression predicted well the correlation between NDVI and stand factors for families and basal area. NDVI trends reflected urban tropical forest typing and biodiversity, being high in rehabilitation and mangrove forests, moderate in home-gardens and low in parks. We suggest that the application of NDVI for assessments can be useful for future planning, monitoring and management of the BKP and hence may contribute for increasing biodiversity and complexity of these urban forests.

Graphical Abstract

1. Introduction

Urban forest refers to common vegetated land surfaces in an urban area that are managed, often transitionally, and that play a role in the functioning of ecosystem services [1]. Examples of urban forest include patches of remnant forests, street trees, parks and riparian trees. Urban forests provide multiple ecological, social and economic benefits through the provision of ecosystem services. Ecosystem services are defined as benefits that humans obtain from ecosystem functions, or as direct and indirect contributions from ecosystems to the well-being of humans [2,3]. The Millennium Ecosystem Assessment grouped ecosystem services into four categories: provisioning, regulating, cultural and supporting. Rapid urbanization has a significant negative impact on urban forests and the ecosystem services they provide [4]. The structure of urban forests is an important variable that influences urban ecosystem functions. Different habitats provide different types of ecosystem services; for example, agroecosystems are critical for food production, wetlands for nutrient capture and forests for carbon sequestration. Urban green spaces have positive impacts on health and security via air purification, noise reduction, urban cooling and runoff mitigation [5]. Likewise, high biodiversity in urban forests can improve the quality of life, and because of their aesthetic appeal and microclimatic effects, the presence of trees on a property can increase its real estate value [1]. Characterizing the structure of the urban forest requires knowledge of tree density, tree size, tree location, canopy density, canopy health, species composition and spatial arrangement. Management of the composition and structure of urban forests is the key to successfully improving urban forest abundance and resulting human well-being. Information from tree inventories regarding species performance and native habitat can suggest general guidelines for appropriate species selection and management practices [6]. However, unlike in more temperate parts of the world, urban forests still lack intensive research in tropical, less urbanized and less economically developed regions such as in parts of SE Asia [4,7].
It is laborious and costly to quantify urban forest structures using conventional methods through direct measurement in the field. Remote sensing-based estimation of forest structure with sensitive spectral indicators has gained attention in recent decades, as it offers a rapid and cost-effective way to obtain forest structure data at the landscape level [8]. Remote sensing is an observational and analytic tool for helping to assess and manage urban forests for human well-being. Remote sensing uses reflected radiation, which allows us to estimate useful measurements for ecological and environmental application, including the extent of canopy cover, species composition, forest health, biophysical properties and the ability to evaluate change across space and time [1]. Measurements of some ecosystem services may be extracted directly from the reflected signal (e.g., vegetation growth and carbon storage), and others may be collected indirectly (e.g., land surface temperature) [1]. However, many economically important services, such as the production of raw materials and food provisioning, cannot be assessed adequately using remote sensing alone, and they may require other datasets [9].
The Bang Kachao Peninsula is a large (ca. 1891 ha) urban green space, located in the lowland of the Chao Phraya watershed between Bangkok and Samut Prakan provinces, in central Thailand. The Chao Phraya river basin is the largest watershed area in Thailand and is an important tropical floodplain area for conservation of freshwater swamps and tropical moist broadleaf forests in the Indo-Malay Ecoregion. An important period in the history of Bang Kachao was between 1982 and 1987 when H.M. King Bhumibol Adulyadej viewed the oasis from an airplane and recommended that the green area should be saved as Bangkok’s green lung, protecting the citizens of Bangkok from industrial pollution generated to the south in Samut Prakan province. Pressures of urbanization and industrialization in Bangkok and Samut Prakan provinces have affected and changed some of the land use in the Bang Kachao Peninsula from green space as home-gardens and swamps to urban use such as residential, official and industrial areas [10]. For several reasons, it would be a tragedy for Bangkok and the entire metropolitan region if this “green lung” were to be sacrificed for more concrete and asphalt. The area not only offers a welcome, nearby retreat for nature-minded weekenders, but also plays an important role in the city’s ecological and climatic control systems, and could be instrumental to the city government’s climate change mitigation and adaptation strategies. To enhance the functional urban forest, the Royal Forest Department (RFD) has been undertaking restoration using enrichment planting on ca. 10% of the Peninsula.
Whilst there has been some research on plant species [11] and biodiversity [12] on the Bang Kachao Peninsula, the available database and in-depth information on the structure and function of urban forest is still limited. This constrains the future intensive management of urban green space on the Peninsula. Using sample vegetation plots, the main objective of this pilot research project was to determine the usefulness of satellite images to characterize tropical urban forest on the Bang Kachao Peninsula. The results will inform future research and use of remote sensing approaches for urban forest restoration and management in Thailand.

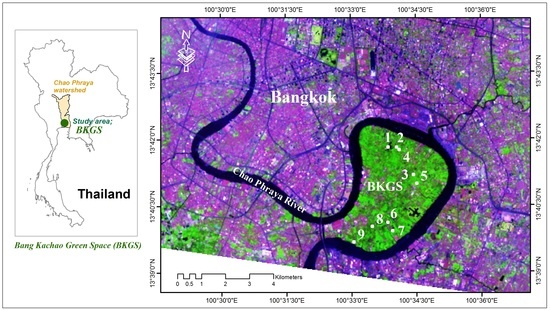
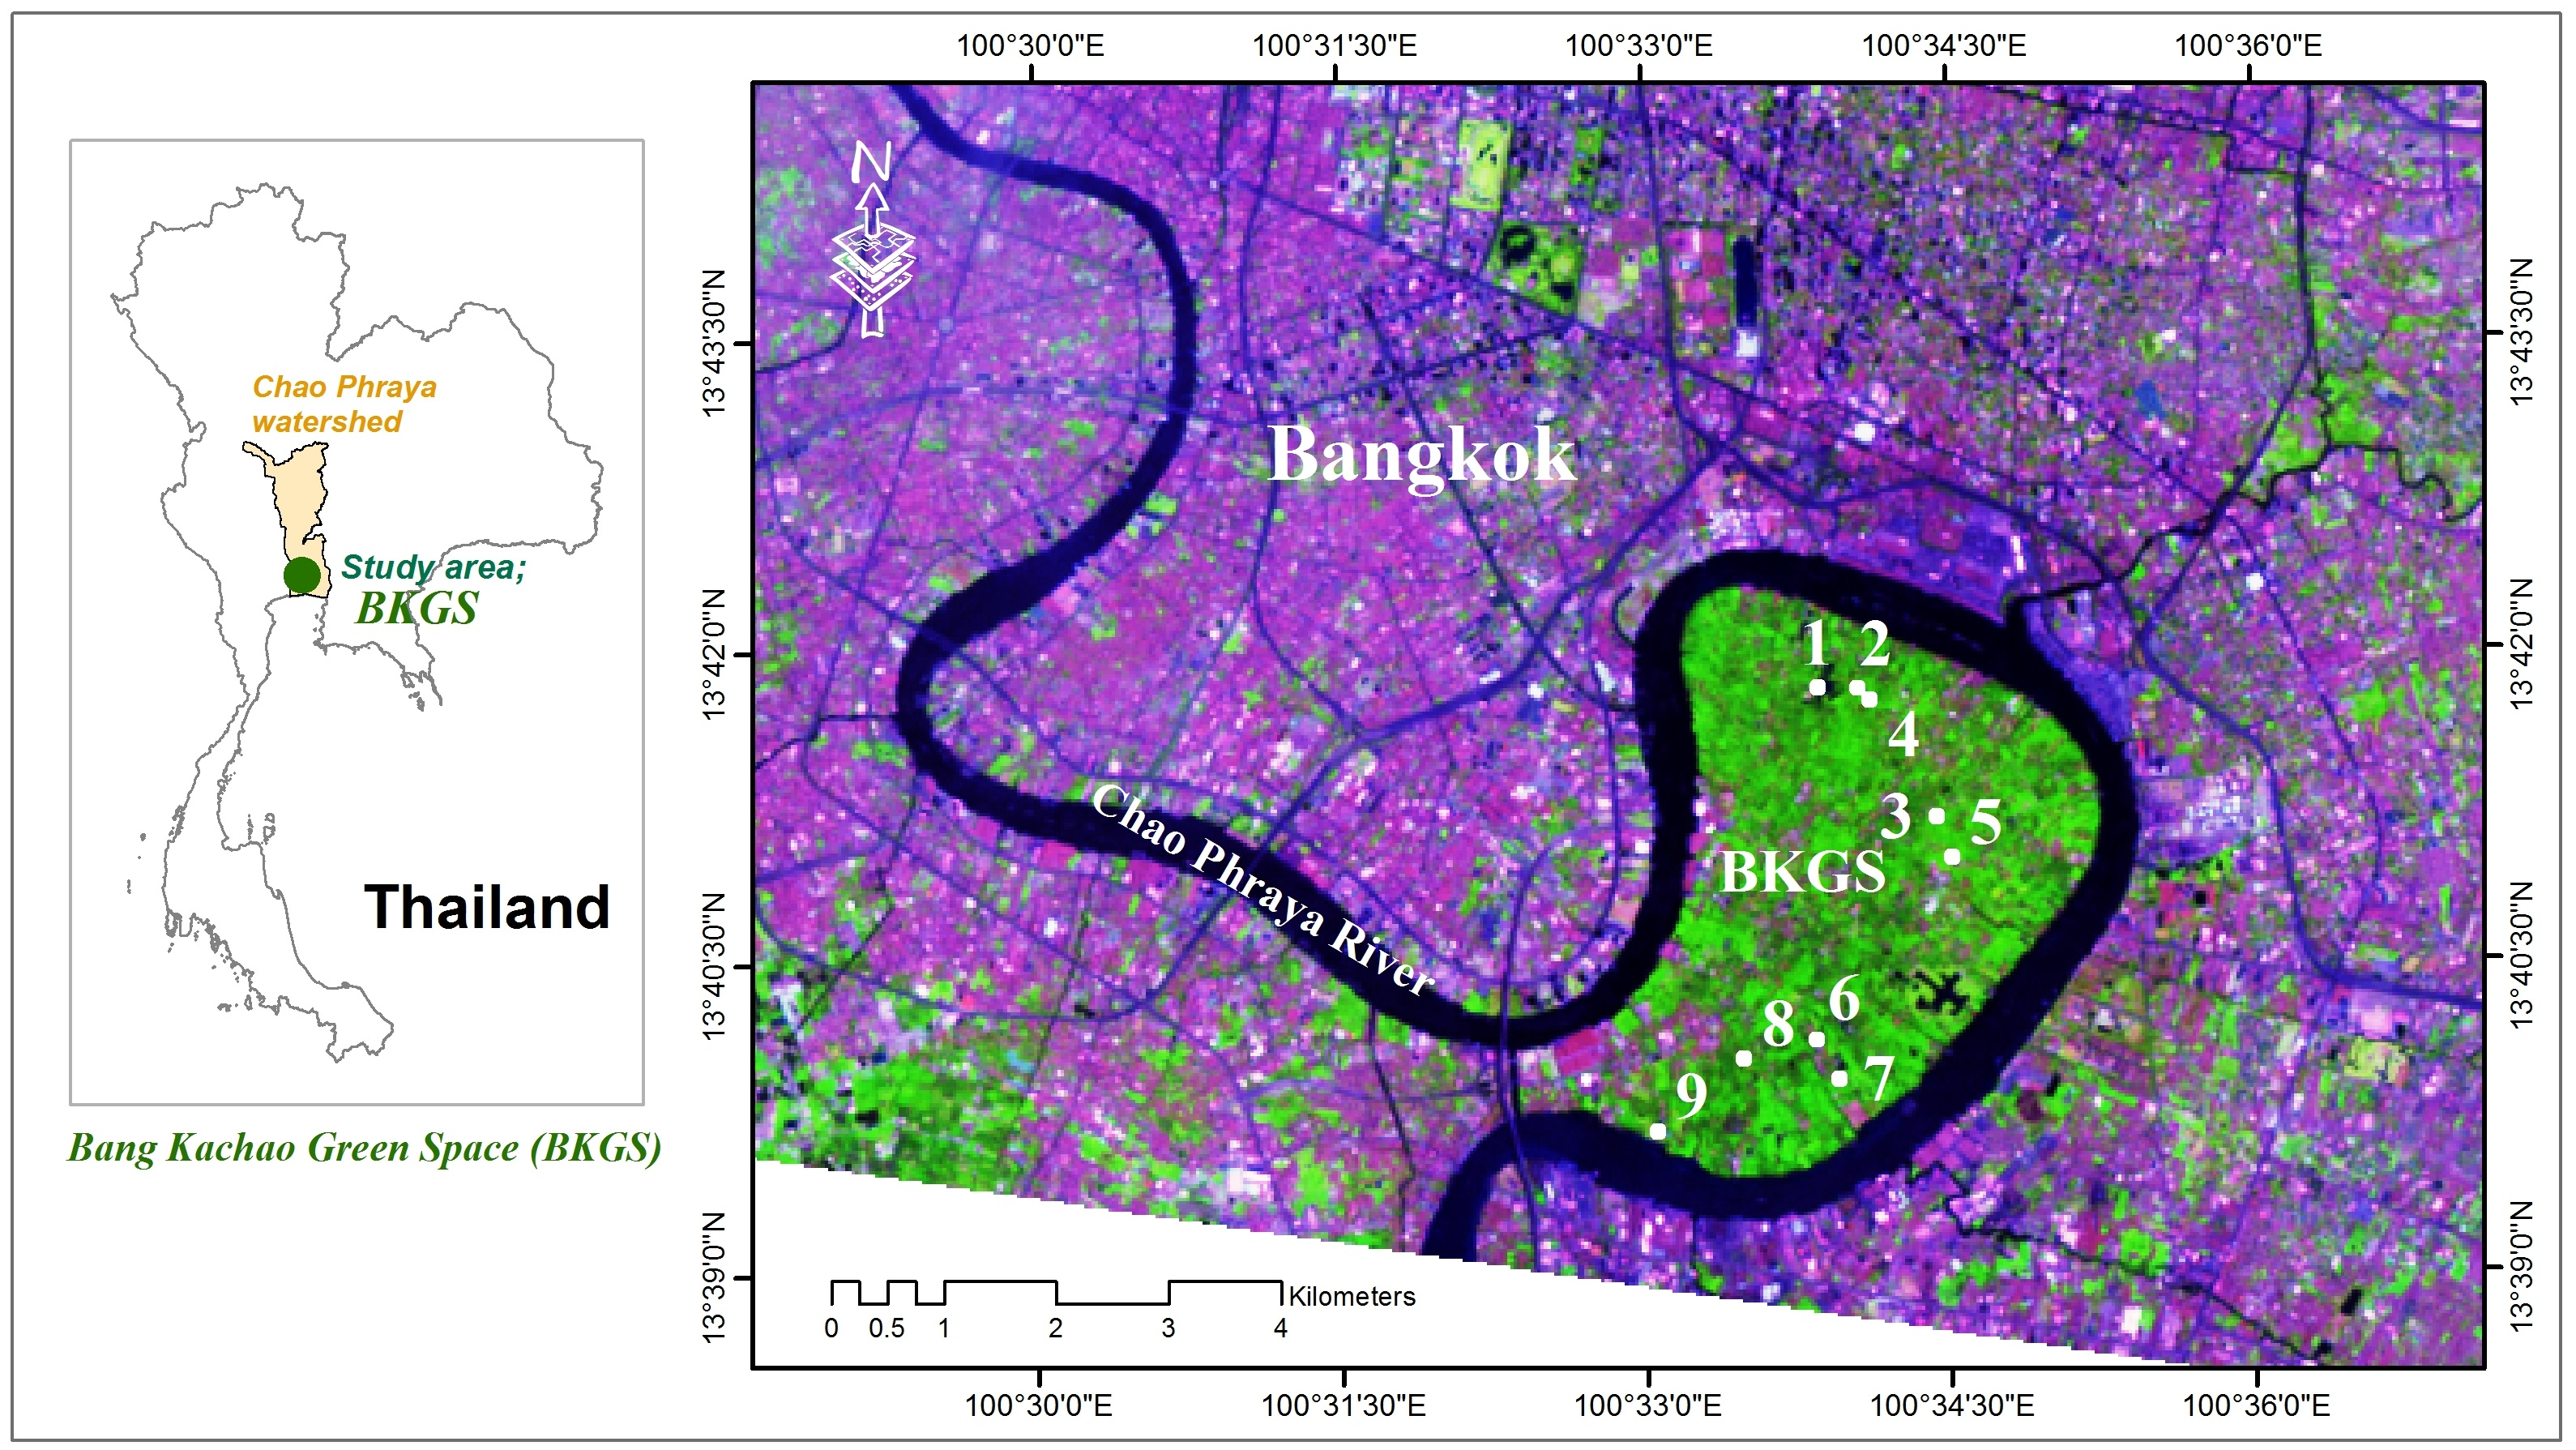
2. Materials and Methods

The study was undertaken on the Bang Kachao Peninsula, Phra Pradaeng district, Samut Prakan province, Thailand located between 13°39′16″ and 13°42′5″ N and between 100°32′36″ and 100°35′28″ E. The Peninsula is composed of 6 sub-districts: Song Khanong, Bang Krasop, Bang Ko Bua, Bang Kachao, Bang Nam Phueng and Bang Yo. The total area is about 1891 ha of which around 10% is being rehabilitated and managed for conservation by the RFD. The topography is a sediment flood plain, approximately 1 m above mean sea level, surrounded by 15 km of the Chao Phraya River that flows south into the Gulf of Thailand (Figure 1). The Peninsula contains 14 canals which are connected to each other and lead out to the Chao Phraya River. The connection with the ocean creates a unique brackish water wetland in which 675 flora and fauna species occur in swamp forest, mangrove forest and agricultural land classified as home-garden [10,12]. The inter-annual variation in climate is influenced by the tropical monsoon system where the average daily high temperature remains relatively constant over the year, fluctuating within the range 31–35 °C. Like many tropical cities in the latitudinal belt where the temperature range is 15–25 °C, the Bang Kachao Peninsula has a 6-month monsoonal wet season from May through October that ameliorates the heat. November–April is the dry season with the cooler months being November–January. Based on climatic data from the nearby Bangna weather station of the Thai Meteorological Department, the average annual rainfall is 1365 mm over 120 wet days, with the heaviest rainfall generally in September as a result of low pressure systems and typhoons in the South China Sea. The annual mean, maximum and minimum air temperatures are 28.8, 32.7 and 24.1 °C, respectively [10].
Landsat 7 ETM+ three-band RGB imagery at 30 m2 pixel resolution acquired for 25 April 2012 along with aerial photography for 2002 at a scale of 1:4000, were used to identify urban forest types as rehabilitation forest, mangrove forest, home garden and parks. The total green area on the Bang Kachao Peninsula was 919 ha or 59.7%, including water bodies and open space. The urban forest comprised home-garden agroforestry (459 ha or 29.8%) and mangrove forests (39 ha or 2.5%) bordering the canals and the Chao Phraya River. The two parks, “Sri Nakhon Khuean Khan Park and Botanical Garden” in Bang Kachao sub-district and “Chalerm Phra Kiat the King Bhumibhol 80 Phansa Park” in Song Khanong sub-district comprised 1.9% of the total area (29.5 ha). Rehabilitation forest (316.3 ha or 20.5%) was distributed in the conservation area managed by the RFD and also included unmanaged private land.
Satellite metadata were used to analyze the normalized difference vegetation index (NDVI). The NDVI is one of the most commonly used vegetation indices obtained from remote sensing images and is used for calculating biomass because the chlorophyll of vegetation tends to have high absorption in the red band (RED) and relatively high reflectance in the near infrared band (NIR). We used the Landsat 7 ETM+ satellite image data provided by the U.S. Geological Survey (USGS) [13] to analyze the NDVI. The NDVI was initially proposed by [14] and calculated using Equation (1). The symbol ρ denotes the reflectivity measured and its subscript denotes the electromagnetic spectral band used. The NDVI for each plot was calculated as shown in Equation (1) and determined by summing the number of pixels.
N D V I = ρ N I R ρ R E D ρ N I R + ρ R E D
Nine 50 × 50 m plots were randomly established in Bang Kachao urban forest types in February 2012 as follows: 4 plots in rehabilitation forests (plots 1, 2, 3 and 6), 1 plot in mangrove forest (plot 5), 2 plots in home-gardens (plots 4 and 8) and 2 plots in parks (plots 7 and 9) (Figure 2). The positions of each plot were obtained using a global positioning system device (GPS Garmin Oregon 550, Olathe, KS, USA).
A census of all living trees with diameter at breast height (DBH) >4.5 cm was conducted. Tree height was measured using a Vertex Laser VL400, DBH was measured using a diameter tape, canopy diameter was measured using a tape in 2 directions (N-S and E-W axes) for each tree and the number of canopy layers was recorded using profile diagrams [15]. Trees in sample plots were identified to the species level by collecting leaf specimens for comparison with standard specimens in the herbarium at the Department of National Parks, Wildlife and Plant Conservation. The nomenclature followed the Flora of Thailand [16]. Collected data were used to calculate stand structural characteristics of the urban forest on the Bang Kachao Peninsula. The structure was analyzed for each plot as shown below:
  • Stem density (SD): the number of trees (N) per unit area (N/ha) was counted;
  • Basal area (BA): (m2/ha), defined as the ratio of the cross-section area of all trees in the sampling plot to the plot ground area;
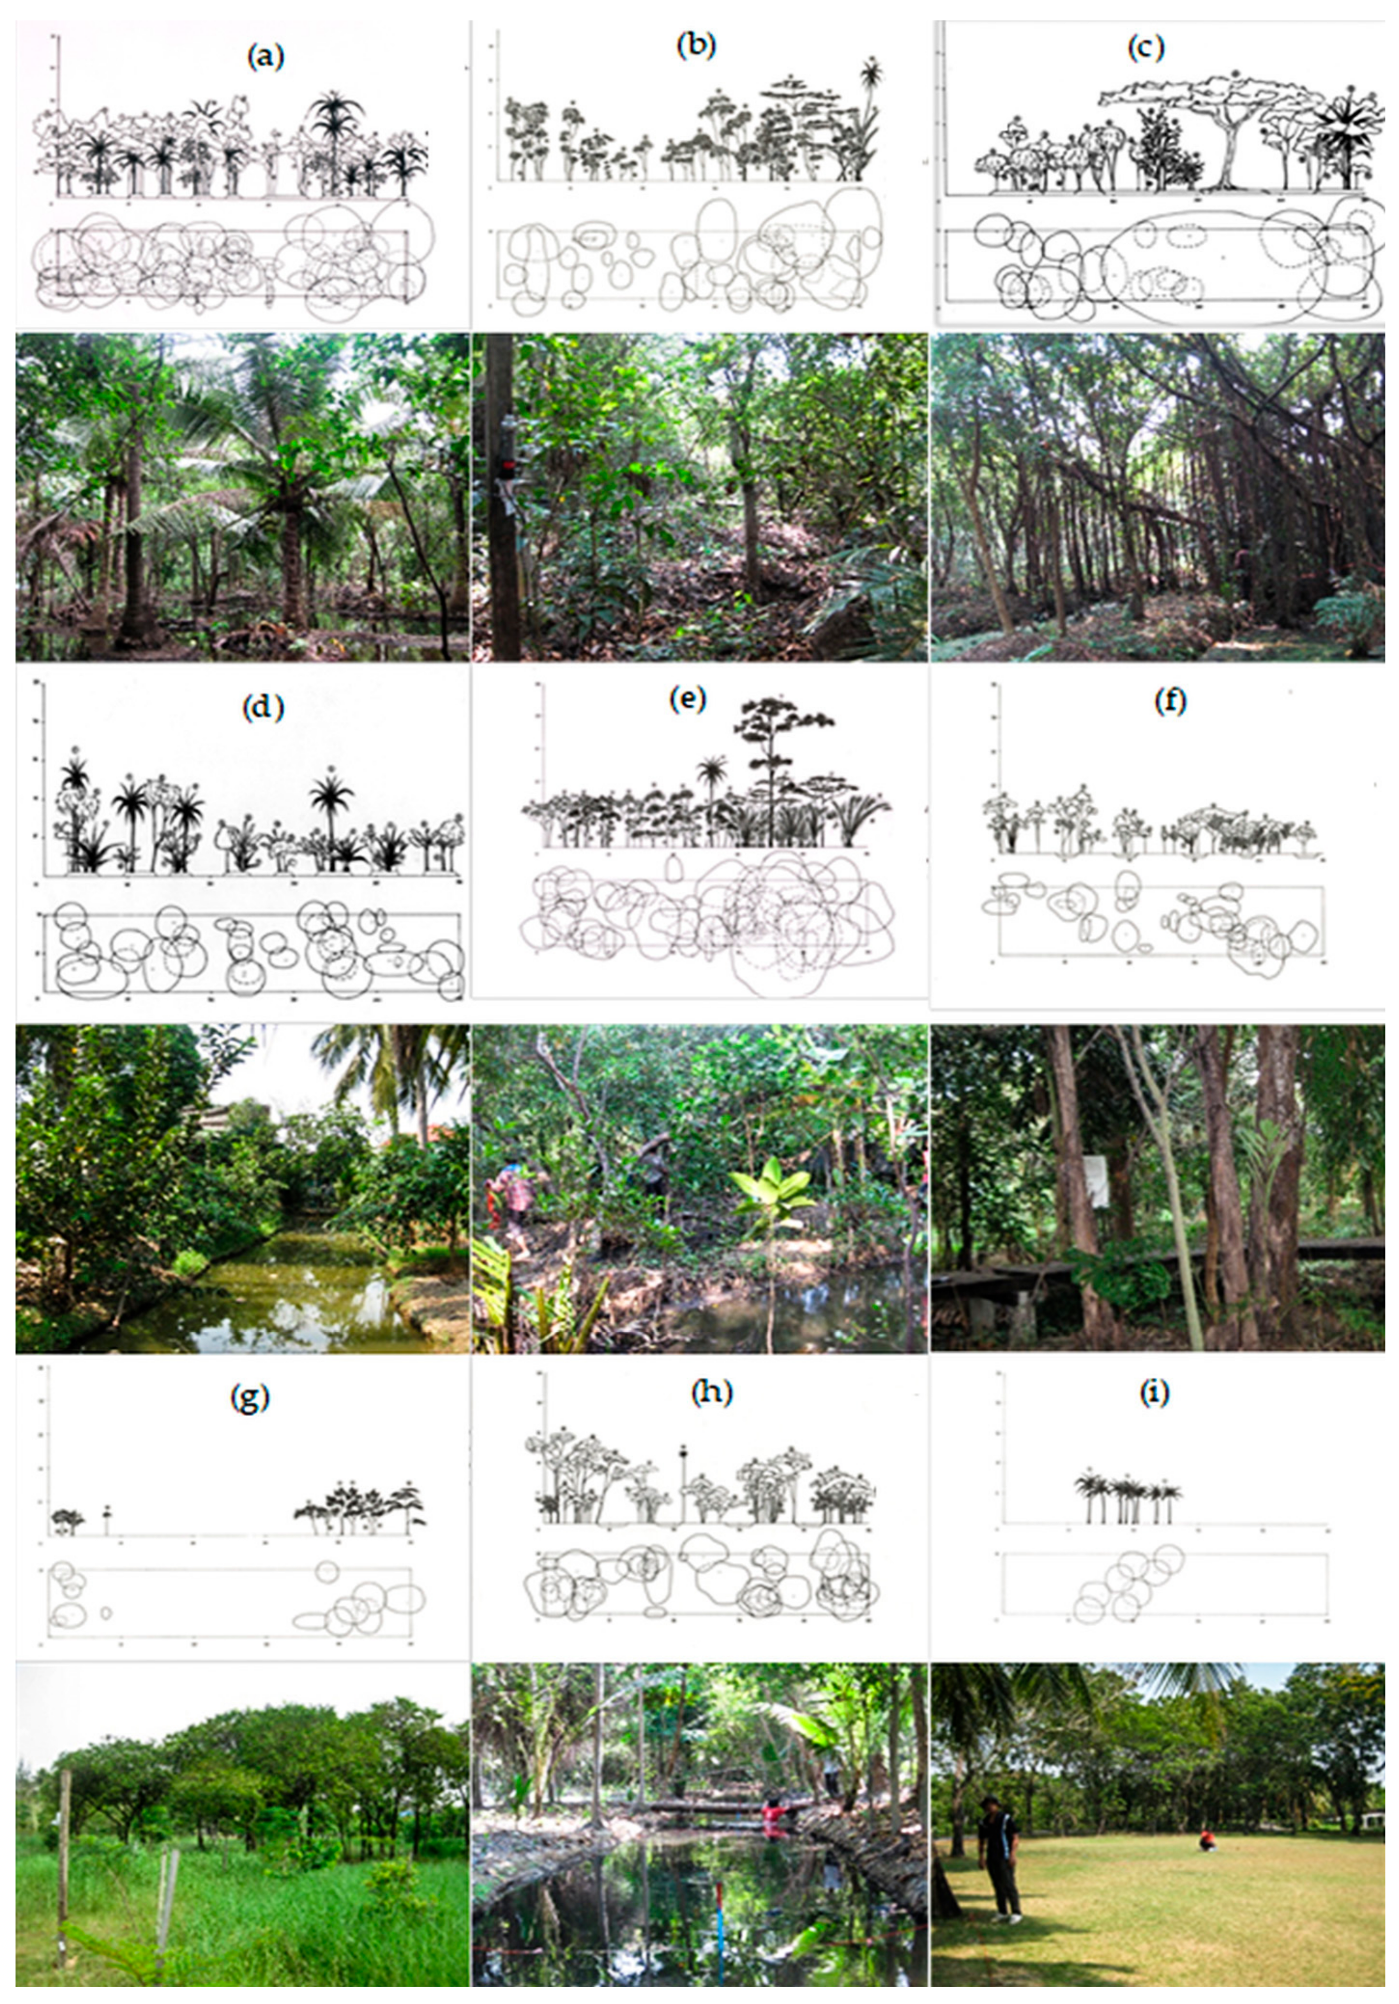
  • Canopy density (CD): the proportion of an area in the plot covered by the crown of trees and expressed as a percentage of the total area. This research calculated CD from a profile diagram of each 50 × 50 m plot using the QGIS software to reference the canopy based on its Cartesian coordinates;
  • Importance value index (IVI): for each plant species in the plot, IVI was calculated by summing the relative percentages of basal area, density and frequency [17];
  • Shannon-Wiener index (H’) or Shannon entropy: calculated as a measure of tree species diversity, accounting for both abundance and evenness of the species present in each forest community [18]. It is defined by Equation (2):
    H = i = 1 s p i ln ( p i )
    where, H′ is the Shannon entropy; pi represents the relative frequency of the species i; and s represents the total number of species in the community [19];
  • Exponential Shannon entropy (1D): described as true diversity by [20] as a means of clarification and calculated using Equation (3) for better comparison reasons. According to [20], a comparable description of non-spatial diversity can be based on the number equivalents, also denoted as “true diversity indices”. The numbers equivalents, also denoted as “true diversity or 1D” of order q = 1, can be derived by calculating the exponential of the Shannon entropy.
    1 D = e x p   H = exp ( i = 1 s p i ln ( p i ) )
  • Shannon’s equitability (EH): calculated by dividing H’ by Hmax (here Hmax = lnS) as shown in Equation (4). Equitability assumes a value between 0 and 1, with 1 being complete evenness.
    E H = H H m a x = H In S
Correlation analysis was used to analyze the relationship between plant factors from satellite data (NDVI) and plant factors obtained from ground survey for the nine plots using the R statistical software package [21]. Where the correlation was significant, linear regression analysis of the relation between the dependent variable Y (stand structural factors) and the explanatory variables X (NDVI) was used.

3. Results

3.1. Urban Forest Structure and Biodiversity in the Bang Kachao Peninsula

The ecological structure and biodiversity of the tropical urban forests in Bang Kachao peninsula differed across the nine sample plots (Figure 3). This research identified 52 tree species in 17 families. The rehabilitation forest contained trees (including palms and Musa spp.) in 10–17 families and 15–25 species. The rehabilitation forest had five habitats: moist evergreen forest (Caryota bacsonensis), dry evergreen forest (Cassia siamea), beach forest (Cerbera odollam, Hibiscus tiliaceus, Terminalia catappa), freshwater swamp forest (Streblus asper) and abandoned orchard (Cocos nucifera, Pithecellobium dulce). The home-garden agroforestry plots had 8–15 families and 11–17 species. The traditional farmers planted mixed species on mounds separated by water-filled channels. The planting of commercial fruit species (Areca catechu, Artocarpus heterophyllus, Cocos nucifera, Mangifera indica and Musa spp.) and native tree species (Cerbera odollam, Streblus asper and Terminalia catappa) resulted in multiple canopy layers. Mangrove plot 5 comprised 11 families and 15 species. The park plots had the lowest biodiversity with 2–8 families and 2–13 species. Most tree species in the park plots were natives (Antidesma ghaesembilla, Cerbera odollam, Peltophorum dasyrachis and Terminalia catappa). Shannon-Wiener index was used to compare the relative abundance and evenness of the biodiversity across the plots (Table 1). The index was very low (0.43) for plot 9, reflecting the dominance of one species, the coconut palm. Indices for all the other plots were in the range 1.39–2.58. Plot 6 had the highest H’ index.
Stand density, DBH, total stem basal area and canopy density varied among urban forest types and plots. Stand density ranged from 104 to 1268 trees/ha with an average for the nine plots of 774 trees/ha. Plot density was high in the rehabilitation forest (716–1268 trees/ha), medium in the home-garden and mangrove forest (820–980 trees/ha) and low in the park (104–360 trees/ha) (Table 1). The DBH ranged from a mean/plot of 8.2 to 24.7 cm. However, more than 50% of trees had diameters <10 cm (data not shown). Trees greater than 40 cm in diameter were mostly Antidesma ghaesembilla, Cocos nucifera, Erythrina fusca, Peltophorum dasyrachis and Sonneratia caseolaris. The total stem basal area ranged from 22.8 m2/ha in plot 1 to 2.3 m2/ha in plot 7. The stem basal area ranged from 10.1 to 22.8 m2/ha in the rehabilitation forest, was 13.2 m2/ha in the mangrove forest plot, 12.5 and 9.6 m2/ ha in the two home-garden agroforestry plots, and only 2.3 and 5.2 m2/ha in the park plots. The canopy density of crown cover varied across plots and urban forest types. The value of canopy density for the rehabilitation and mangrove forest plots ranged from 38.2 to 91.8%, with the highest canopy densities in plots 1 and 5. The home-garden agroforestry plots had intermediate canopy density and the lowest density was in the park plots (Table 1). Furthermore, the canopy layers varied with urban forest types and plots, ranging from 1 to 4 canopy layers. There were multiple canopy layers in the rehabilitation and mangrove forests and the least number of layers in the park plots (Figure 3).
Over 80% of trees were less than 10 m in height. Trees > 15 m in height were mostly Cassia siamea, Cocos nucifera, Ficus spp., Sonnerratia caseolaris, Streblus asper and Terminalia catappa. The tallest trees were Sonneratia caseolaris (25.0 m) and Ficus sp. (22.5 m).
The exponential Shannon index (1D) is an indicator of tree diversity. The 1D value was highest in rehabilitation forest (plots 2, 3 and 6), followed by mangrove forest (plot 5), park plot 7, home-gardens (plots 4 and 8) and park plot 9. The exponential Shannon 1D-value was very low (1.54) for plot 9, reflecting the dominance of one species, the coconut palm. Values of 1D for all the other plots ranged from 4.02 to 13.32.
Species evenness was assessed using Shannon’s equitability (EH). Overall, the EH value of the urban forest types on the Bang Kachao Peninsula was medium. However, the EH values were lower in home-garden areas (plots 4 and 8) than in rehabilitation, mangrove and park areas.
The IVI of the top-five species in each plot suggested the dominant species as shown in Table 2. The dominant species in rehabilitation forest plot 1 were Cocos nucifera, Streblus asper and Cassia siamea; in plot 2 were Cocos nucifera, Cerbera odollam and Hibiscus tiliaceus; in plot 3 were Cerbera odollam, Streblus asper and Erythrina fusca; and in plot 6 were Cocos nucifera, Cerbera odollam and Pterocarpus indicus. In the mangrove forest (plot 5), the dominant species were Cerbera odollam, Sonneratia caseolaris and Hibiscus tiliaceus. The dominant species in home-garden agroforestry plot 4 were Musa spp., Cocos nucifera and Mangifera indica; and in plot 8 Streblus asper, Terminalia catappa and Cocos nucifera. In parks, the dominant species in plot 7 were Antidesma ghaesembilla, Cerbera odollam and Senna siamea; and in plot 9 Cocos nucifera and Peltophorum dasyrachis.

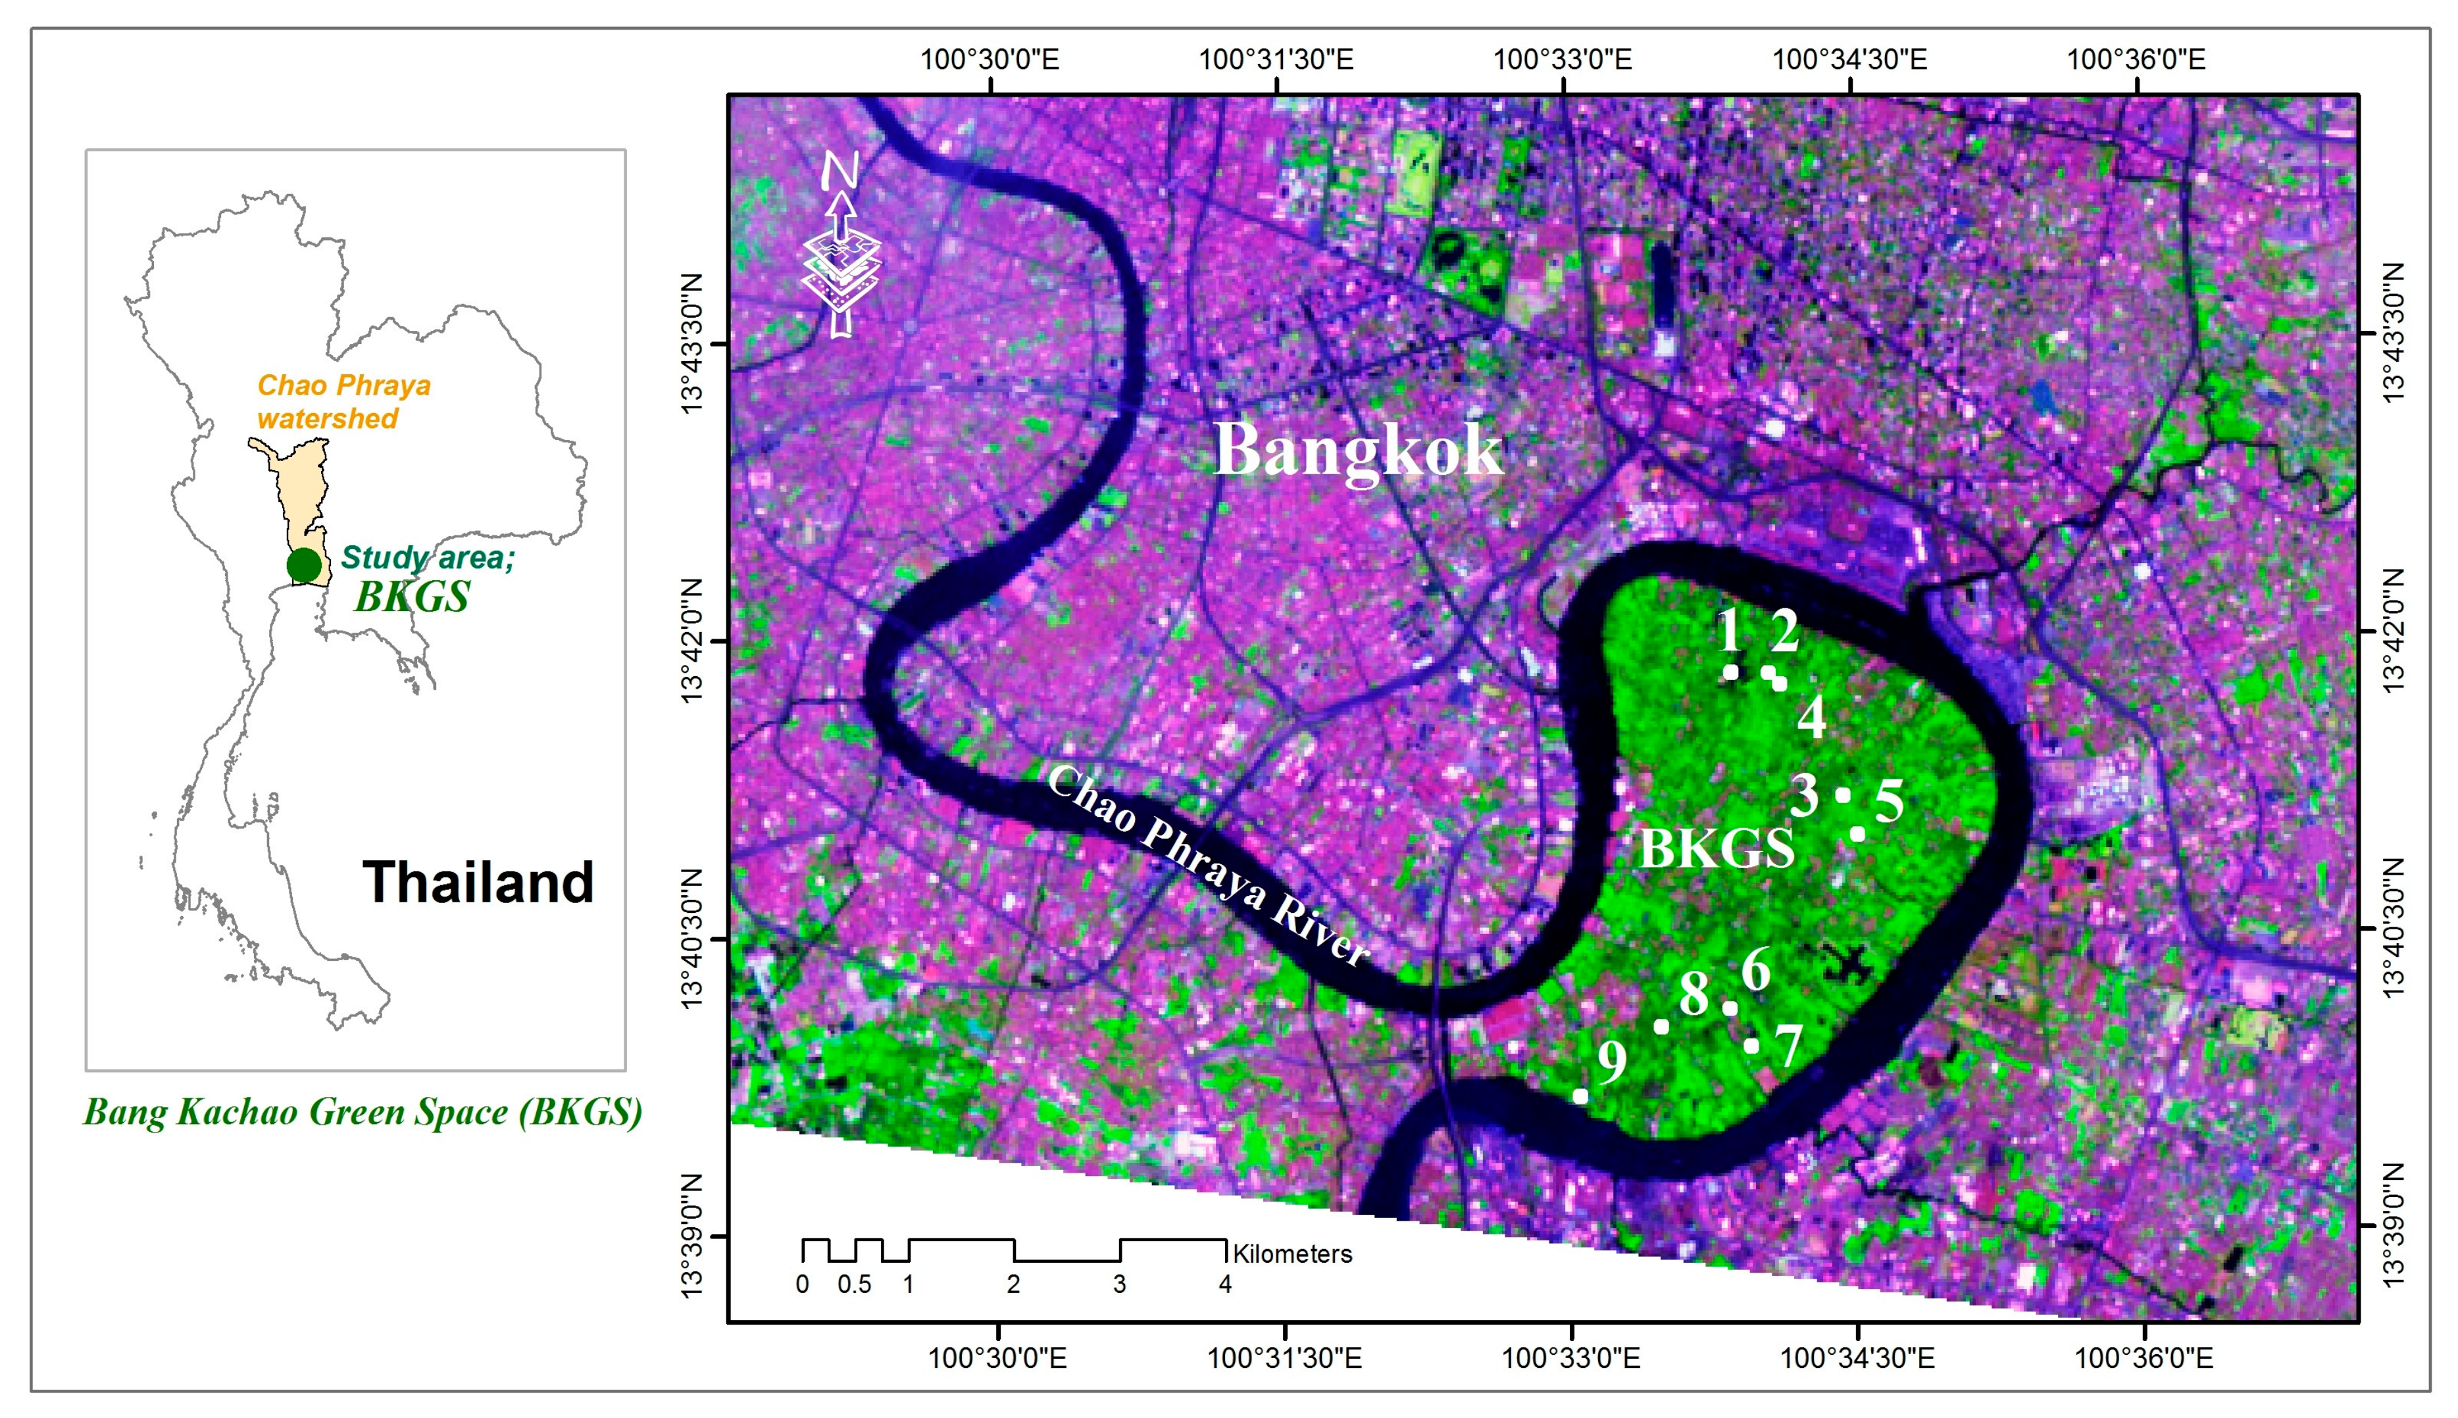
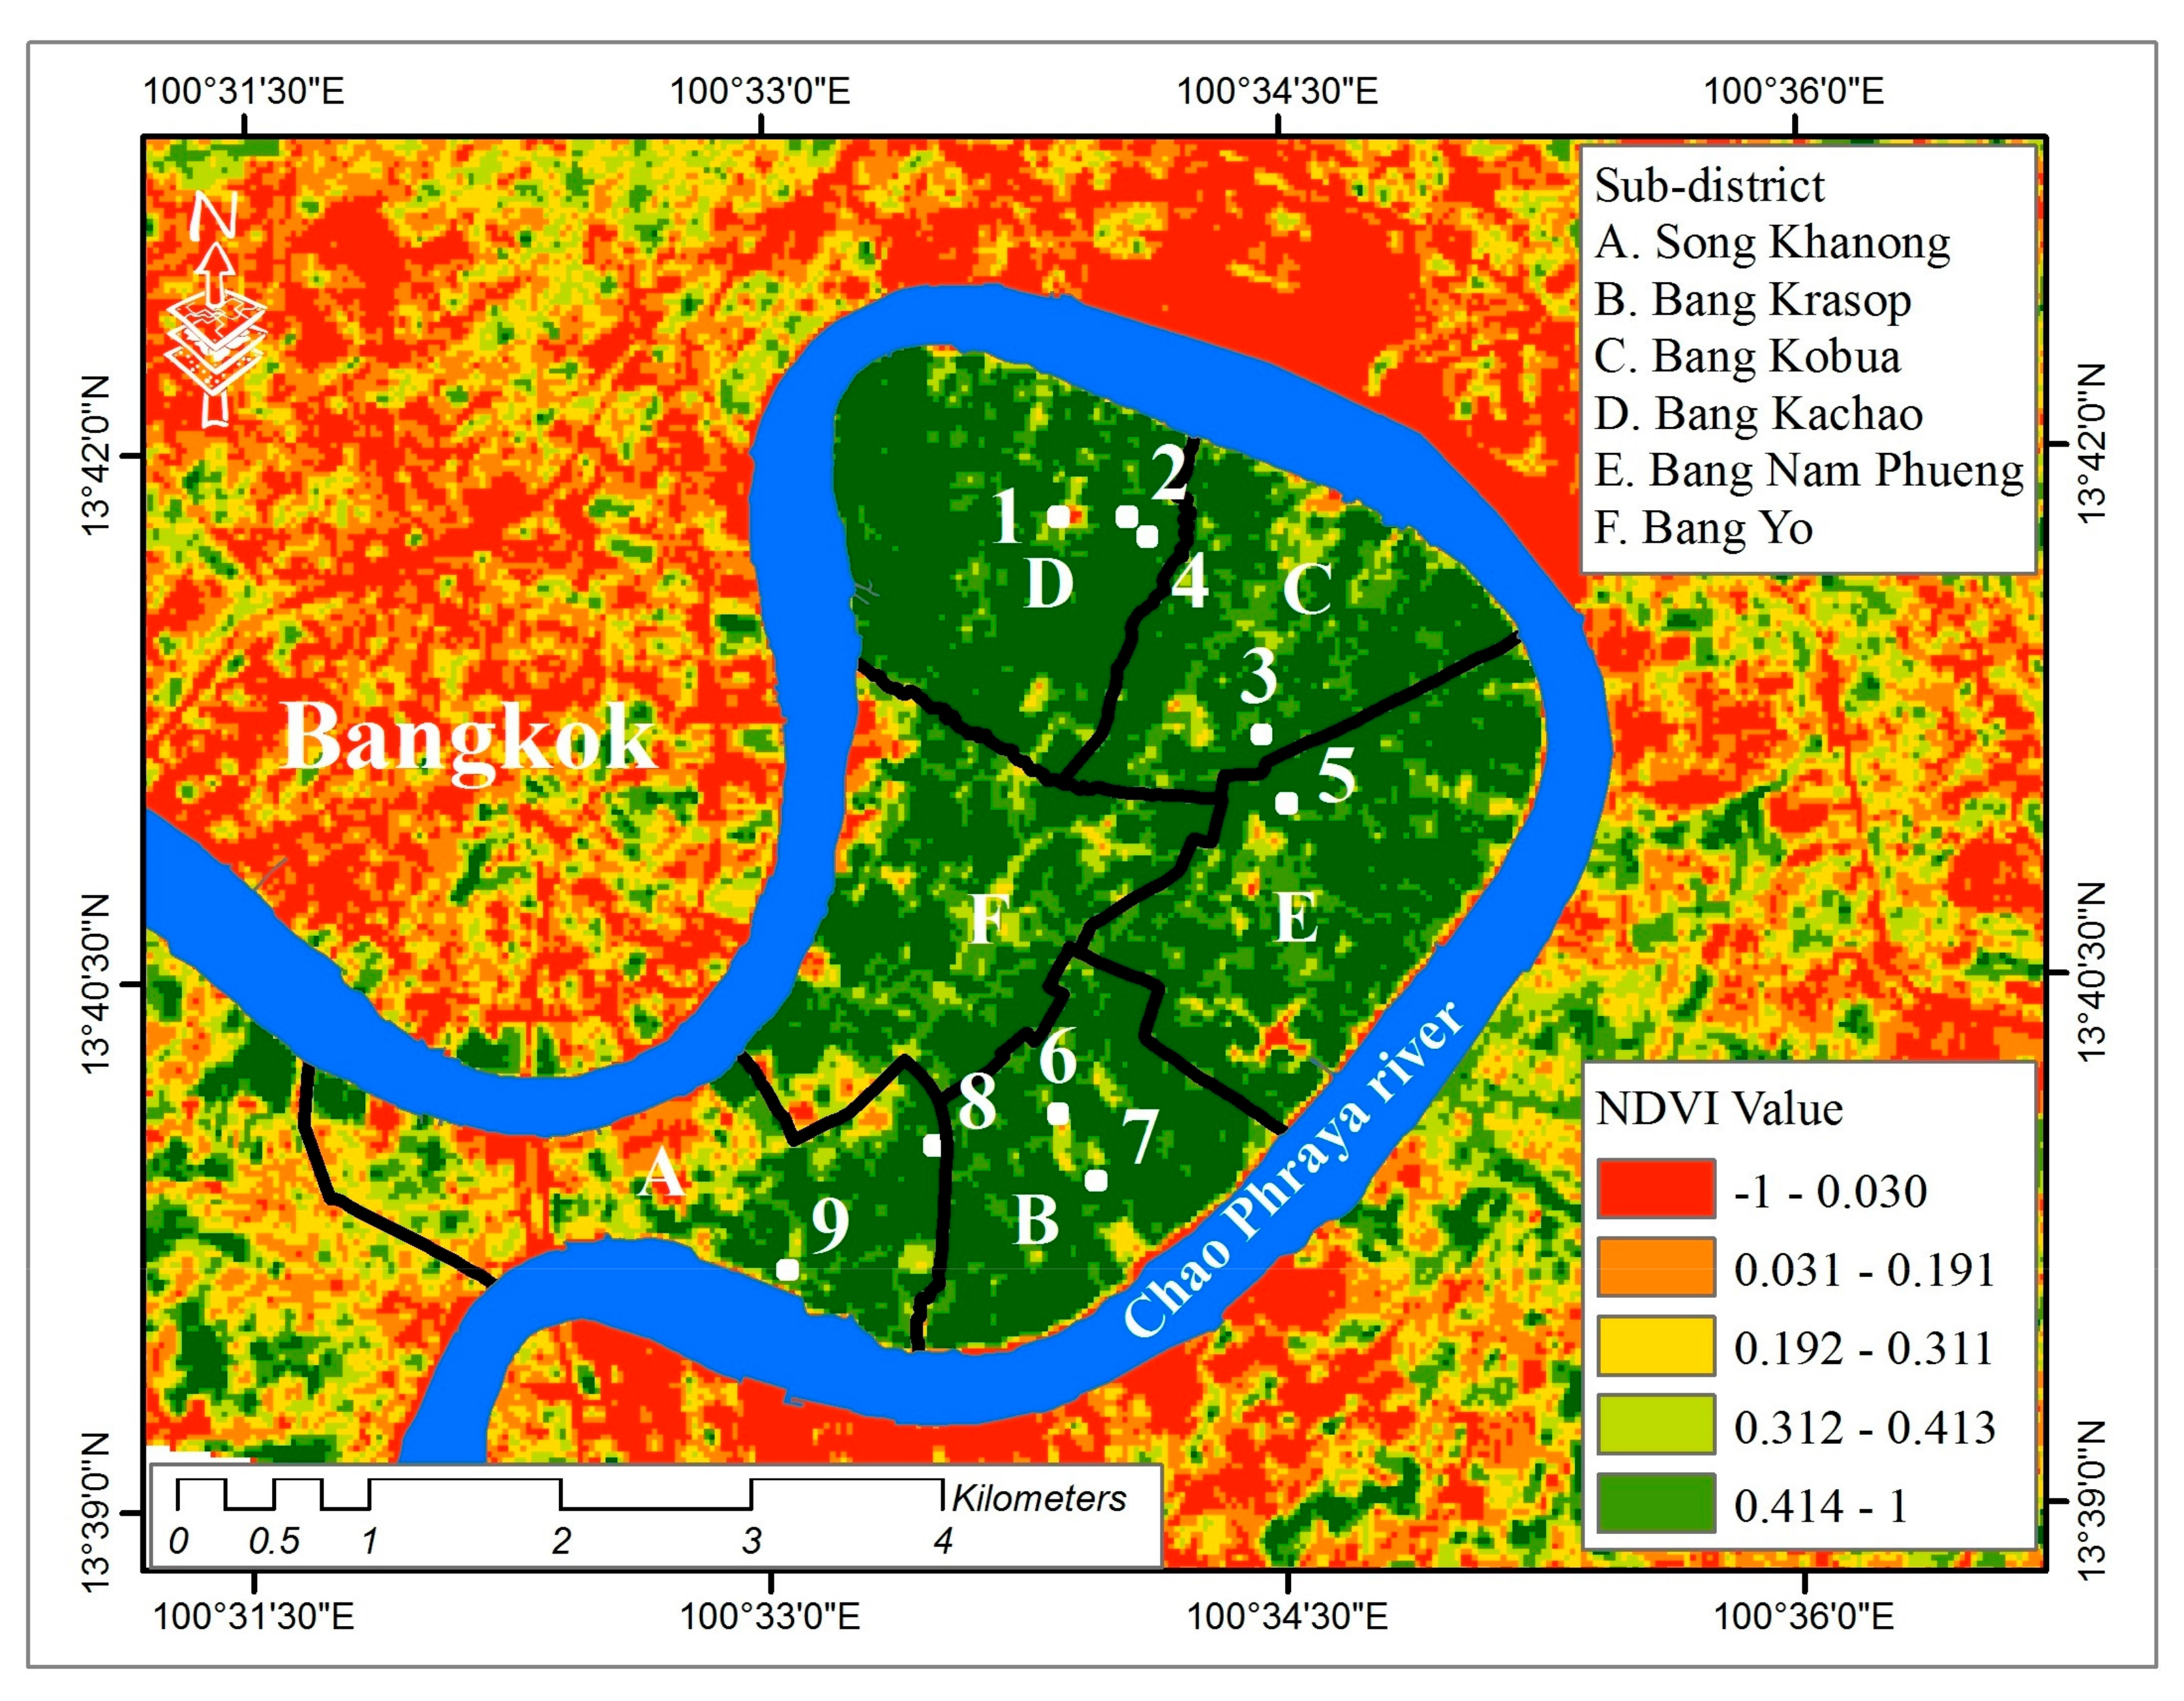
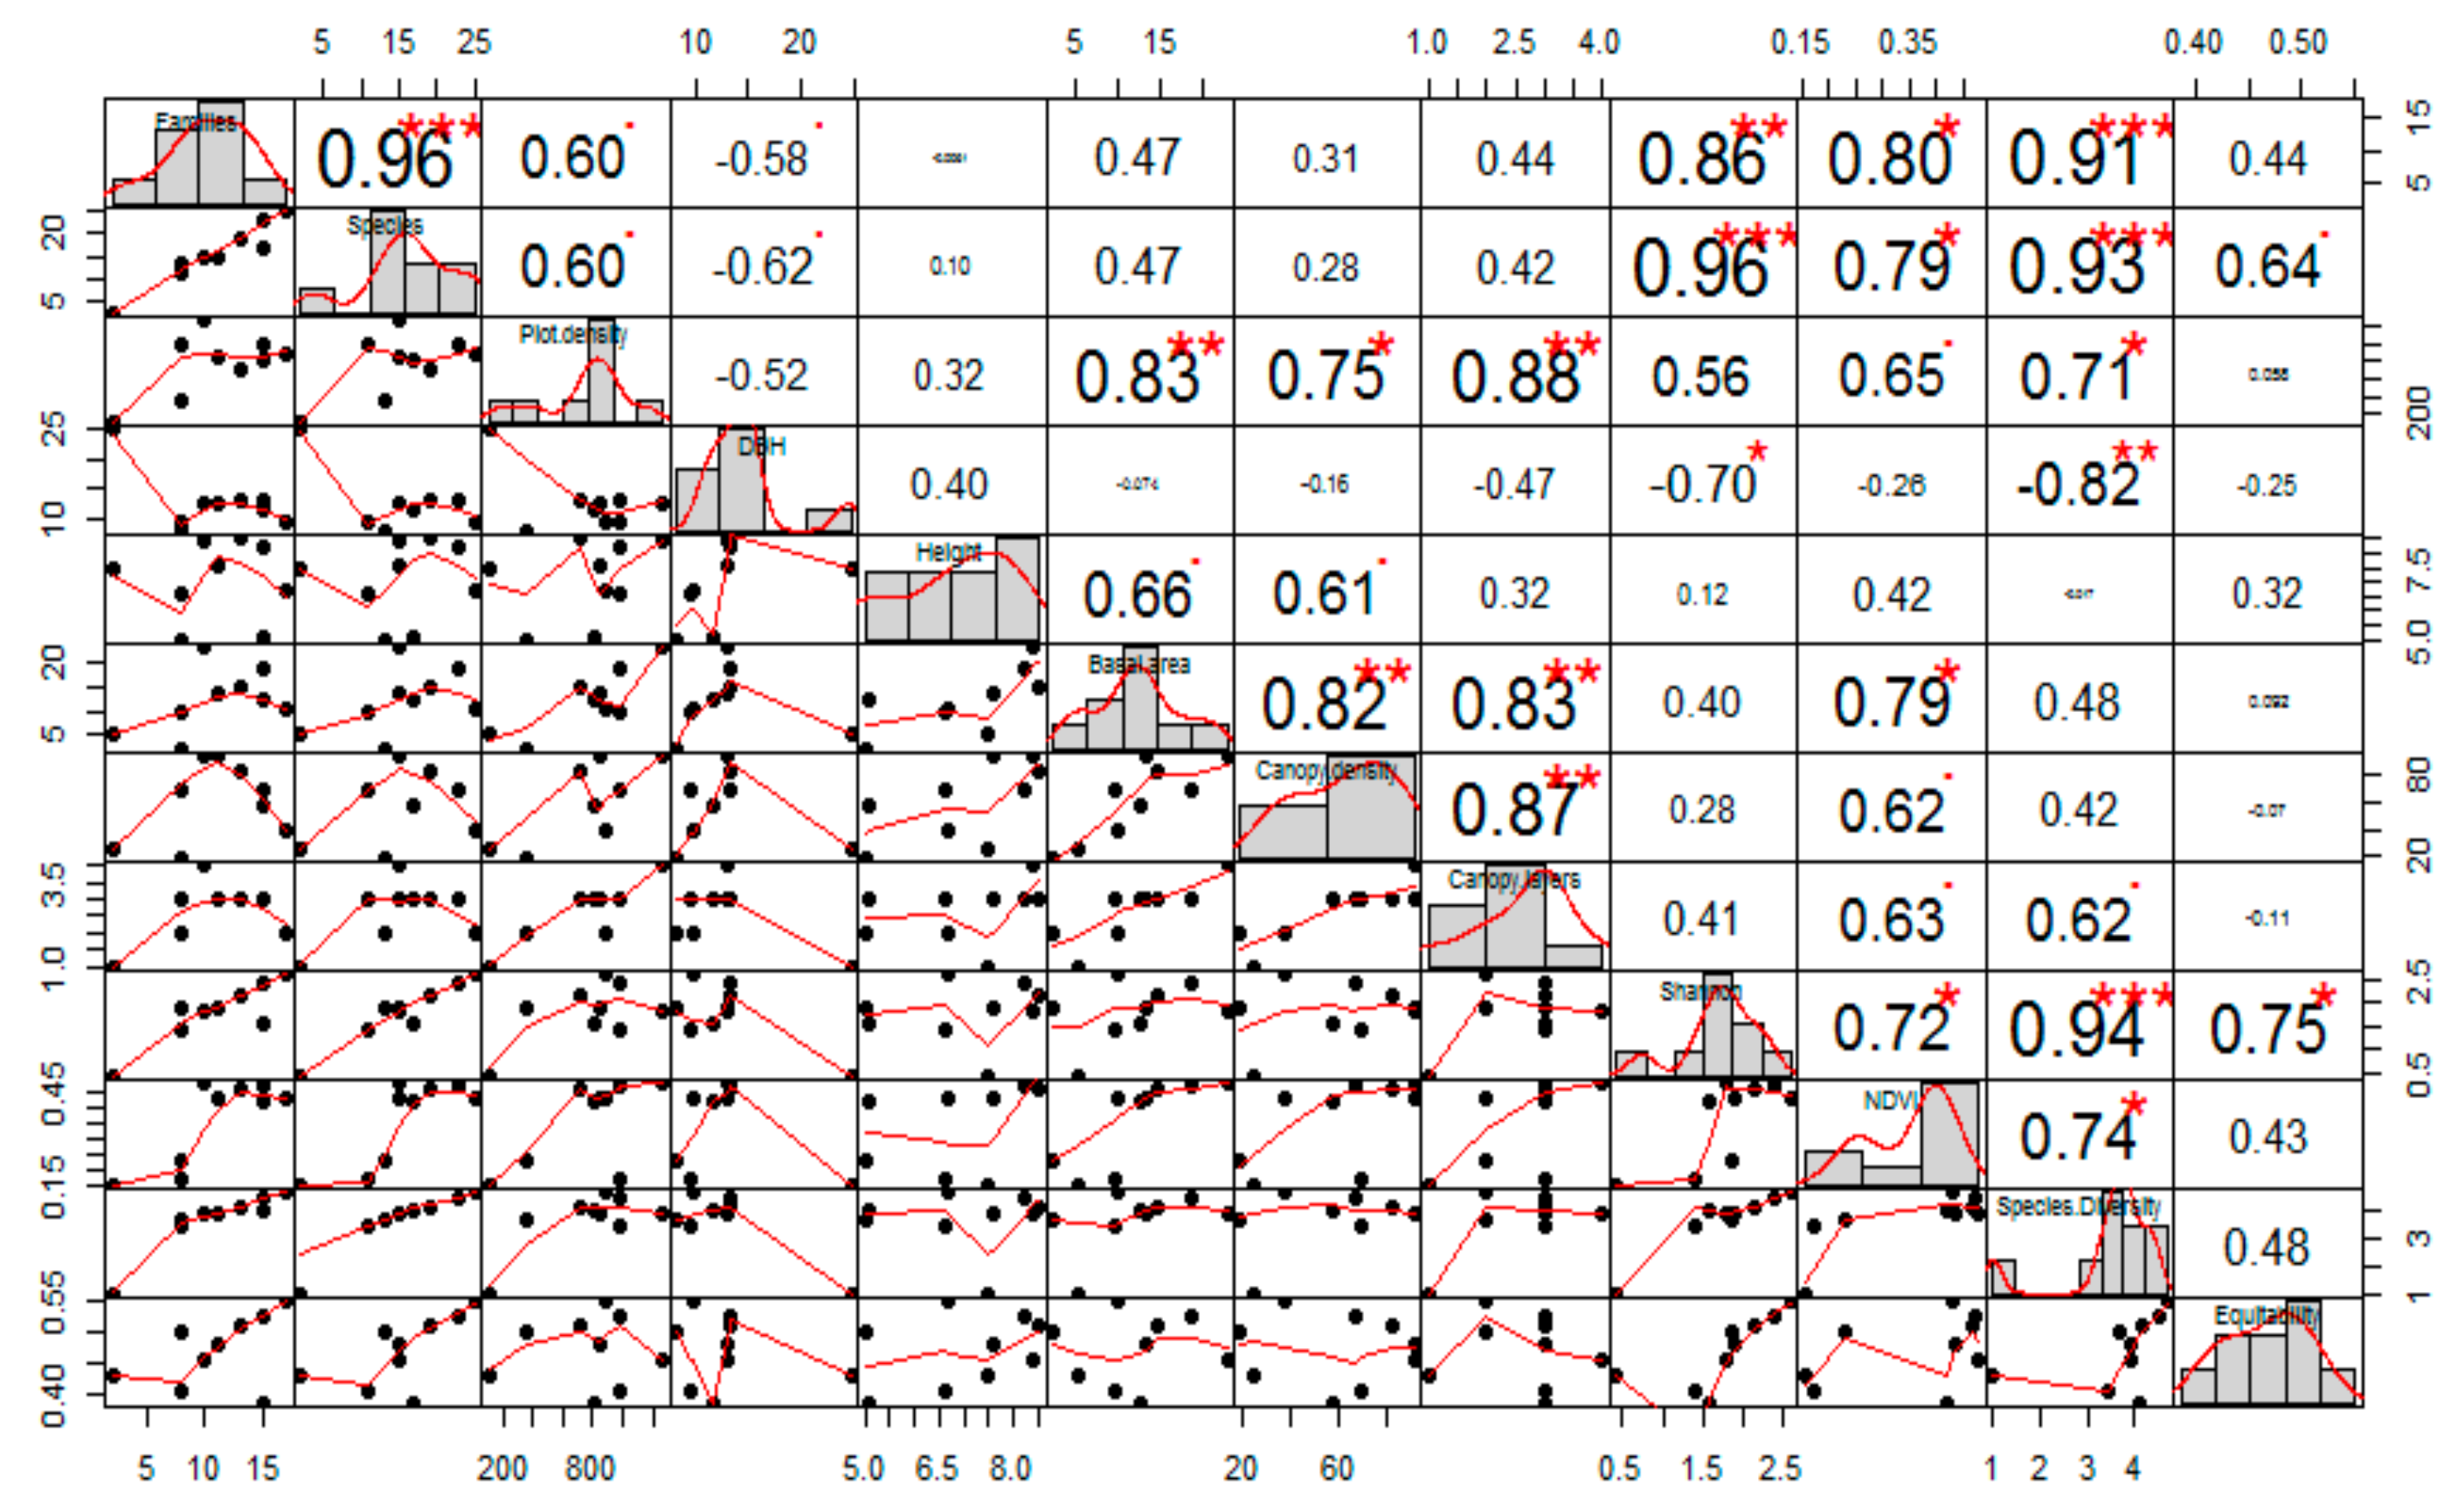
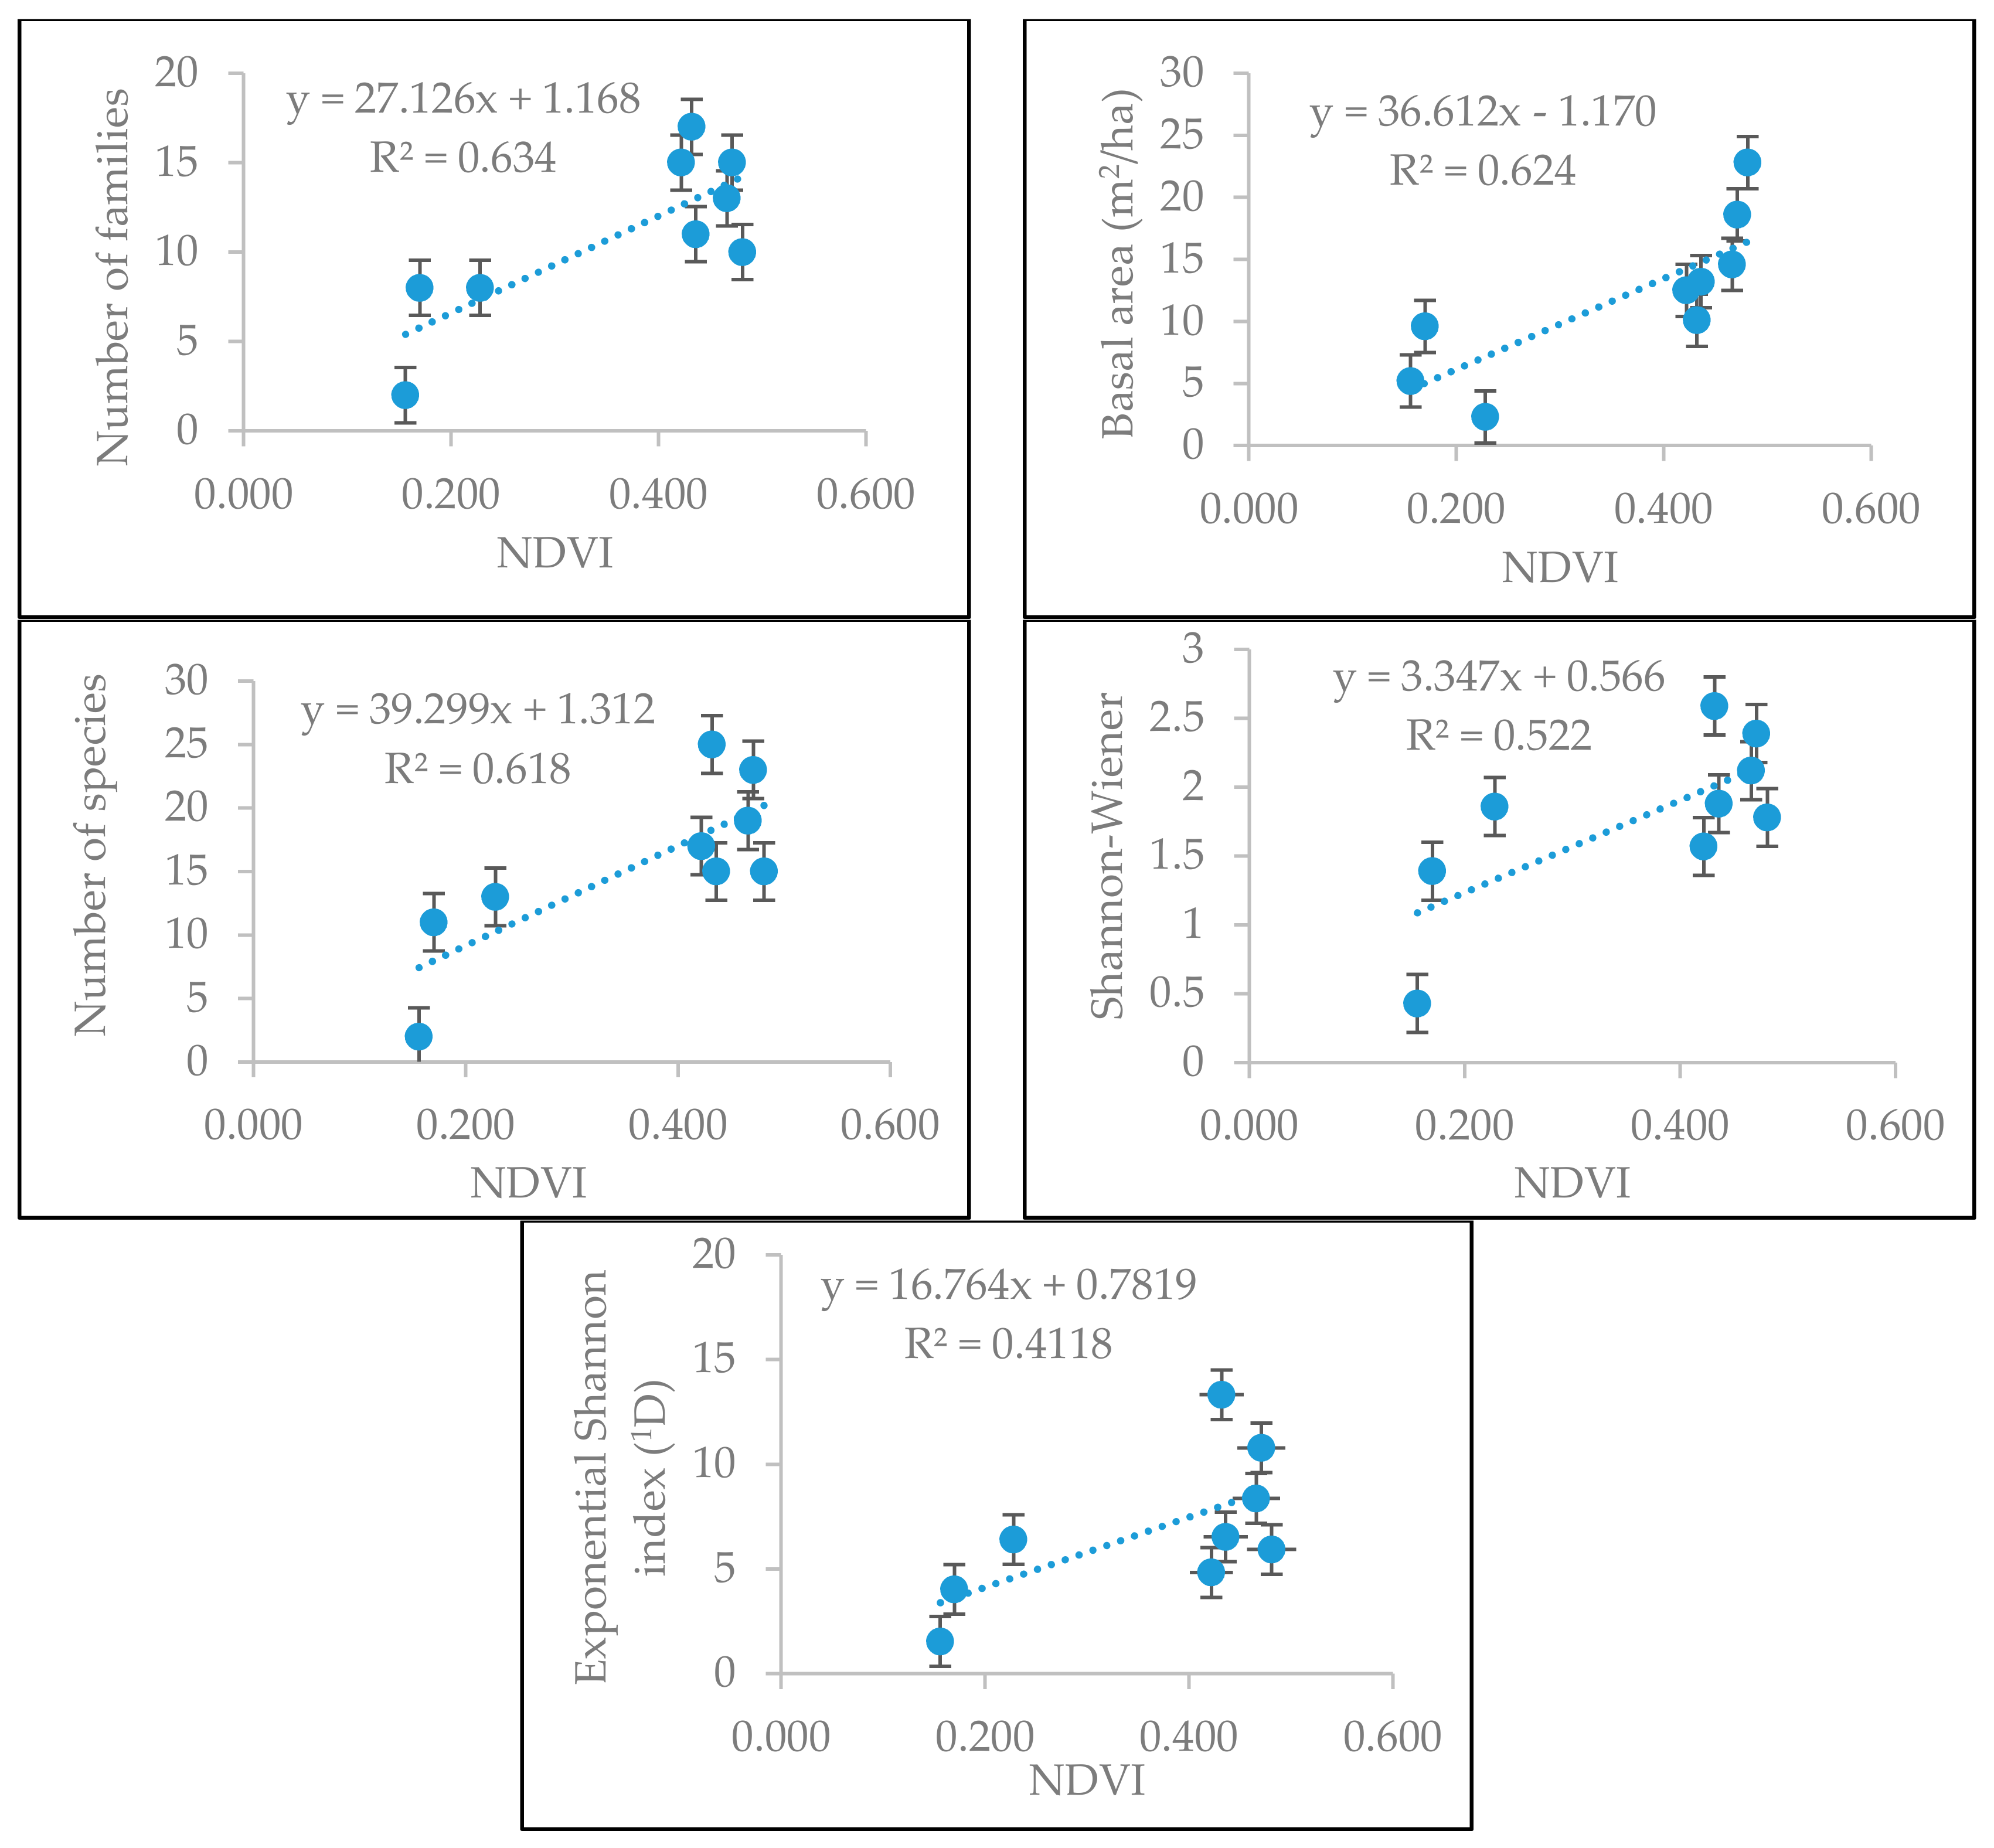
3.2. NDVI and Urban Forest Structure

The NDVI in the rehabilitation forest (plots 1, 2, 3 and 6) ranged from 0.432 to 0.481 and in the mangrove plot was 0.436. However, the NDVI values of the home-garden plots were different from each other, being 0.170 in plot 8 and 0.422 in plot 4. The lowest NDVI occurred in the park plots (Table 3).
The number of species and number of families of trees in the high NDVI stands (plots 1 to 3, and 4 to 6) were higher than in the lower NDVI stands (plots 7 to 9). The high NDVI plots contained the most species and families of trees. Plots 1, 2, 3 and 6 were in rehabilitation forest that had multiple canopy layers. The profile diagrams showed that plots 1, 2 and 3 had large vertical and horizontal variations in canopy structure (Figure 3a–c), whereas plot 6 (Figure 3f) had only two layers of canopy structure. Plots 4 and 8 (Figure 3d,h) were home-garden agroforestry areas with canopy layers reflecting this type of land use. Profile differences reflected previous management practices as plot 4 (Figure 3d), managed by local people, had three canopy layers of planted orchard trees. However, plot 8 (Figure 3h), managed by the Metropolitan Electricity Authority and Kasetsart University under the urban forest restoration project, comprised home-garden agroforestry mixed with tree species and thus had multiple canopy layers.

3.3. Relationship between NDVI and Stand Structure

The correlation matrix for the NDVI and stand structure of urban forest on the Bang Kachao Peninsula is illustrated in Figure 4. The NDVI was highly and positively correlated with the number of families, number of species, total basal area and Shannon-Weiner diversity index (p < 0.05). However, NDVI was not correlated with plot density, DBH, height, canopy density, number of canopy layers and Shannon equitability. Linear regression was used to analyze all significant relationships between NDVI and stand factors. The measured stand structural factors were used as the dependent variable and the NDVI factor from the remote sensing was used as the independent variable. The best linear equation between NDVI and plant factors was the number of families (R2 = 0.634) and total basal area (R2 = 0.624) (Figure 5).

4. Discussion

The Bang Kachao Peninsula contains a range of tropical forest types in an urban oasis strongly affected by land use from local residents as well as by reforestation efforts in recent decades. The current research looked mainly at tree biodiversity but included the coconut palm, mangrove palm (Nypa fruticans) and some Musa species because of their prominence and stature in the area. Overall, 52 tree species in 17 families were assessed across the nine plots and the number of species ranged from 2 to 26 per plot. From nine sample plots, the urban forests in the Bang Kachao Peninsula were classified into four types: rehabilitation forest, mangrove forest, home-garden agroforestry and park. Trees were present in six habitats, namely beach forest, swamp forest, moist evergreen forest, dry evergreen forest and abandoned orchard or home-garden agroforestry. The forest types along the Chao Phraya River have previously been classified as floodplain, swamp and mangrove forests [22]. Bang Kachao Green Space is located in the central flood plain of the lower Chao Phraya River. Because this environment is at risk of annual flooding, knowledge of plant habitat, ecological structure and geography must be integrated for tree selection for reforestation using tolerant species from the mangrove, beach and swamp forests [23].
Tree biodiversity varied with NDVI, with the greatest biodiversity in the rehabilitation and mangrove forest plots with high NDVI. Biodiversity was moderate in the home-garden agroforestry plots and low in the park plots. Sample plots in the rehabilitation and mangrove forests had medium NDVI values (0.432–0.481). Regarding the home-garden agroforest areas, plot 4 had a higher NDVI (0.422) than plot 8 (0.170). These two plots had distinct histories: plot 4 was in an area managed by local people and contained mixed tree species more than 5 years of age, whereas plot 8 was within an area managed by the government and university sector as part of a restoration project. This project had cleared weeds and opened gaps for enrichment planting in 2011, one year before the satellite images were taken. The parks (plots 7 and 9) had the lowest NDVI values (0.156 and 0.228). Values close to zero indicate sparse vegetation on bare soil [24]. The NDVI is the remote sensing product most widely used worldwide to analyse and map differences in vegetation types and plant phenology [25] including to estimate the diversity of trees over large areas when the vegetation is at the maximum growing season [26,27,28,29]. The NDVI can be utilized for future urban planning, urban restoration and monitoring of urban tree health in Bangkok. For example, the urban planner could focus on areas with low NDVI values for restoration and follow up the plan by monitoring the capacity of the restoration to recover and provide ecosystem services.
Comparison of the diversity of trees between Bang Kachao Green Space in this research with Bangkok, using findings by [30], found that Bang Kachao (52 species) had more tree species than Bangkok (48 species). However, the number of tree species measured in the nine stands in this research was lower than the 179 tree species reported previously [11] in Bang Kachao Green Space. Therefore, over half the diversity of trees was not represented in the nine sites that were studied in this pilot project, indicating the need for further investigation on urban forest composition. In another study, [23] inventoried tree species in Bangkok at Kasetsart University, in suburban community areas in Phatum Thani province and in agricultural areas in Nakhon Phathom province located in the lower central plain of the Chao Phraya River. They recorded 395 species of trees in 60 families. In another study, 150 woody species within 42 families were documented in riparian forests along the Chao Phraya River [22]. Furthermore, [31] found 58 species of trees in home-garden agroforestry in Nonthaburi province (suburban Bangkok). These results demonstrate the variety of ecosystems and biodiversity of trees in the disturbed tropical forests in the Chao Phraya watershed.
The most studied garden city in SE Asia is Singapore, a highly urbanized city with a population of 5 million people. Singapore has a rich natural heritage with more than 10 ecosystems and 2145 different vascular plants. The management of urban green space in Singapore is based on a network of parks and park connectors which permeate the island, allowing easy access to varied habitats rich in plant and animal life [8,32]. There is also high plant biodiversity in many cities in P.R. China. For example, [33] reported 2640 species in 745 genera and 155 families within 257 Chinese cities, with Xi’an city having 627 woody plant species. A better understanding of patterns of species diversity within urban forests in the region could help to improve planning and management of urban forests in Thailand.
The average stand density of Bang Kachao Green Space was 774 trees/ha, which was higher than in Bangkok with 27 trees/ha [30]. In the Sakaerat Biosphere Reserve, Nakhon Rachasima province, the dry evergreen forest (DEF) and dry dipterocarp forest (DDF) had 992 and 602 trees/ha, respectively [30]. The density of tropical rainforest in the south of Thailand was between 818 and 1540 trees/ha [34]. Thus, the stand density in Bang Kachao Green Space was quite similar to the density in natural forests of Thailand, especially DDF and DEF. In contrast, the stand density in Bang Kachao Green Space was lower than in home-garden agroforestry in Nonthaburi province (6877 trees/ha) [31]. It seems that species selection and intensive management are important in order to increase the density of forests in urban areas in the future. Knowledge of ecological structure, particularly the vertical composition and light requirements of tree species, can be applied to increase canopy layers and densities of parks and home-gardens on the Bang Kachao Peninsula.
The tree population of Bang Kachao Green Space was dominated by small diameter trees. The average tree DBH was 12.9 cm, with 70.6% of the population having a DBH less than 15 cm. This was similar to Bangkok with 69.6% of the urban forest cover consisting of small diameter trees less than 23 cm DBH [30]. In the home-garden agroforestry study in Nonthaburi province, the tree DBH ranged from 10.5 to 15.5 cm [31]. The observed size class distributions are typical of natural forests regenerating from seed, with high stem counts in the smaller size classes [35]. In the Bang Kachao Green Space, the small and medium DBH native trees must be managed and protected so that they can become the seed sources or mother trees for regeneration in the future. In particular, protection from damage needs to be considered as smaller and younger trees suffer higher mortality than larger and more mature trees from flooding [23].
NDVI was used in this study as a recognized indicator of the extent of vegetation greenness, implying some aspects of plot structure such as plot density, canopy cover and relative green biomass. This study showed that not all the plot factors selected in this study can be predicted by the NDVI from Landsat 7 ETM+ imagery. However, there were significant relationships between NDVI and some stand factors assessed in Bang Kachao Green Space. The number of families, total basal area, number of species and Shannon-Weiner Index tended to increase with NDVI. Urban forests are heterogeneous, fragmented, often scattered and surrounded by many impervious surfaces, which are very different from natural forests. The potential use of Landsat 5 Thematic Mapper (TM) imagery was studied in estimating urban forest structural attributes including stem density, diameter at breast height, tree height, leaf area index, canopy density and basal area [8], with results showing that NDVI was useful for predicting some urban forest structural attributes. Furthermore, they reported canopy density, basal area and leaf area index were strongly related to NDVI. However, their results showed that stem density, diameter at breast height and tree height were not related to NDVI.
Linear regression can be applied to estimate vegetation abundance within a pixel by assuming a linear relationship between a pixel’s vegetation fraction (response variable) and the spectral bands of Landsat ETM+ (explanatory variables). Regression analysis has been applied for NDVI and known vegetation fractions to estimate fractional vegetation cover [36]. Although this approach can be reliable and efficient, vegetation estimates derived from spectral mixture modelling can be less sensitive due to background soil reflectance [37]. Furthermore, using the spectral or textural images extracted from the SPOT-5 satellite, multiple linear regression can be used to estimate forest structure as basal area, stand volume, DBH, and the Shannon and Simpson indices [38].
The remote sensing data utilized in this pilot study was limited to readily available satellite imagery. In recent years, there has been considerable progress in developing high resolution multi- and hyper-spectral cameras that can be attached to drones as well as to fixed-wing aircraft and helicopters. For example, classification of forest species and composition was obtained from airborne multi-spectral images [39] and LiDAR was used to estimate forest canopy parameters [40]. The very high resolution of satellite remote sensing images has contributed to the clearer identification of forest structure and biodiversity, with examples being Worldview-2, Rapideye and IKONOS-2, among others [41,42,43]. These now can provide precise information on the canopy condition as well as tree height classes. Bang Kachao Green Space would be an ideal place to evaluate this new technology because much ground-based data has already been collected. It would be interesting to undertake annual monitoring of canopy condition, urban forest health and forest structure to obtain a better understanding of rates of change (both positive and negative), for future management purposes.

5. Conclusions

We quantified the ecological structure and biodiversity of urban tropical forests in the Bang Kachao Peninsula, adjacent to Bangkok city. We recorded 52 tree species in 17 families in diverse habitats: beach forest, swamp forest, moist evergreen forest, dry evergreen forest, abandoned orchard, home-garden agroforestry and park. Forest undergoing rehabilitation had the highest biodiversity (Exponential Shannon index = 13.32) followed by mangrove forest, home-garden agroforestry and parks. The dominant tree species differed with habitat, reflecting forest types along the Chao Phraya River as well as previous land-use.
We used normalized difference vegetation index (NDVI) values obtained from Landsat 7 satellite images to explore relationships with plant structure obtained from field surveys. The NDVI was well correlated with the number of families, number of species, total basal area, Shannon-Weiner diversity index and exponential Shannon index. The highest NDVI was in rehabilitation forest that contained the most species and families of trees with multiple canopy layers. We intend to apply further remote sensing of the Bang Kachao Peninsula to identify sites for reforestation and to monitor reforestation success.

Acknowledgments

The authors thank three anonymous reviewers for useful comments to a previous draft of this paper. This work was supported by a PhD scholarship from the Center for Advanced Studies in Tropical Natural Resources, National Research University-Kasetsart University, Bangkok, Thailand (CASTNaR, NRU-KU). We thank students from the Faculty of Forestry for assisting with field work. M. Sommeechai analyzed the field data, J. Srichaichana analyzed the satellite images, while C. Wachrinrat and N. Thangtam advised this work. The authors thank A. Warner for providing editing assistance.

Author Contributions

M. Sommeechai, C. Wachrinrat, N. Thangtam and B. Dell conceived and designed the experiments; M. Sommeechai undertook the field work, analyzed the field data and wrote the paper; J. Srichaichana analyzed the satellite images and B. Dell also provided editing assistance.

Conflicts of Interest

The authors declare no conflict of interest.

References

  1. Singh, K.K.; Gagné, S.A.; Meentemeyer, R.K. Urban Forests and Human Well-Being; Elsevier: Amsterdam, The Netherlands, 2018; pp. 287–305. [Google Scholar]
  2. Assessment, M.E. Ecosystems and Human Well-Being: Synthesis; Island Press: Washington, DC, USA, 2005. [Google Scholar]
  3. Sukhdev, P.; Wittmer, H.; Schröter-Schlaack, C.; Nesshöver, C.; Bishop, J.; ten Brink, P.; Gundimeda, H.; Kumar, P.; Simmons, B. Mainstreaming the Economics of Nature: A Synthesis of the Approach, Conclusions and Recommendations of TEEB; Progress Press: B’Kara, Malta, 2010. [Google Scholar]
  4. Richards, D.R.; Passy, P.; Oh, R.R.Y. Impacts of population density and wealth on the quantity and structure of urban green space in tropical Southeast Asia. Landsc. Urban Plan. 2017, 157, 553–560. [Google Scholar] [CrossRef]
  5. Bolund, P.; Hunhammar, S. Ecosystem services in urban areas. Ecol. Econ. 1999, 29, 293–301. [Google Scholar] [CrossRef]
  6. Thaiutsa, B.; Puangchit, L.; Kjelgren, R.; Arunpraparut, W. Urban green space, street tree and heritage large tree assessment in Bangkok, Thailand. Urban For. Urban Green. 2008, 7, 219–229. [Google Scholar] [CrossRef]
  7. Dobbs, C.; Nitschke, C.R.; Kendal, D. Global drivers and tradeoffs of three urban vegetation ecosystem services. PLoS ONE 2014, 9. [Google Scholar] [CrossRef] [PubMed]
  8. Ren, Z.; Zheng, H.; He, X.; Zhang, D.; Yu, X.; Shen, G. Spatial estimation of urban forest structures with Landsat TM data and field measurements. Urban For. Urban Green. 2015, 14, 336–344. [Google Scholar] [CrossRef]
  9. de Araujo Barbosa, C.C.; Atkinson, P.M.; Dearing, J.A. Remote sensing of ecosystem services: A systematic review. Ecol. Indic. 2015, 52, 430–443. [Google Scholar] [CrossRef]
  10. Sommeechai, M. Effects of Stand Structural Characteristics on the Microclimate of Bang Kachao Green Space in Phra Pradaeng District, Samut Prakan Province, Thailand; Kasetsart University: Bangkok, Thailand, 2017. [Google Scholar]
  11. Sommeechai, M.; Duangklad, W.; Pornnara, N. The Master Plan of Bang Kachao Green Space to Sustainable Conservation and Development; Kasetsart University: Bangkok, Thailand, 2017. [Google Scholar]
  12. Fredrickson, T. “Bioblitz” to Save Bang Kachao; Bangkokpost: Bangkok, Thailand, 2014; Available online: https://www.bangkokpost.com/learning/learning-news/441114/bioblitz-to-save-bang-kachao.
  13. United States Geological Survey Government Agency (USGS). EarthExplorer. Available online: https://www.usgs.gov/ (accessed on 25 April 2012).
  14. Rouse, J.W.; Haas, R.H.; Scheel, J.A.; Deering, D.W. Monitoring vegetation systems in the great plains with erts. In Proceedings of the 3rd Earth Resource Technology Satellite (ERTS) Symposium, Washington, DC, USA, 10–14 December 1974. [Google Scholar]
  15. Sommeechai, M.; Wachrinrat, C. Effects of stand structural characteristics on the microclimate of an urban green space in Phra Pradaeng district, Samut Prakan province, Thailand. In Proceedings of the 2nd International Conference on Tropical Biology “Ecological Restoration in Southeast Asia: Challenges, Gains, and Future Directions”, SEAMEO BIOTROP, Bogor, Indonesia, 12–13 October 2015. [Google Scholar]
  16. The Forest Herbarium. Thai Plants Names Tem Smitinand (Revised Edition); Royal Forest Department: Bangkok, Thailand, 2014.
  17. Curtis, J.T.; McIntosh, R.P. An upland forest continuum in the prairie-forest border region of Wisconsin. Ecology 1951, 32, 476–496. [Google Scholar] [CrossRef]
  18. Hill, M.O. Diversity and evenness: A unifying notation and its consequences. Ecology 1973, 54, 427–432. [Google Scholar] [CrossRef]
  19. Magurran, A.E. Ecological Diversity and Its Measurement; Princeton University Press: Princeton, NJ, USA, 1998. [Google Scholar]
  20. Jost, L. Entropy and diversity. Oikos 2006, 113, 363–375. [Google Scholar] [CrossRef]
  21. R Core Development Team. R: A Language and Environment for Statistical Computing; R Foundation for Statistical Computing: Vienna, Austria, 2013. [Google Scholar]
  22. Asanok, L.; Kamyo, T.; Norsaengsri, M.; Salinla-um, P.; Rodrungruang, K.; Karnasuta, N.; Navakam, S.; Pattanakiat, S.; Marod, D.; Duengkae, P.; et al. Vegetation community and factors that affect the woody species composition of riparian forests growing in an urbanizing landscape along the Chao Phraya River, central Thailand. Urban For. Urban Green. 2017, 28, 138–149. [Google Scholar] [CrossRef]
  23. Leksungnoen, N.; Eiadthong, W.; Kjelgren, R. Thailand’s catastrophic flood: Bangkok tree mortality as a function of taxa, habitat, and tree size. Urban For. Urban Green. 2017, 22, 111–119. [Google Scholar] [CrossRef]
  24. Ayala-Izurieta, J.; Márquez, C.; García, V.; Recalde-Moreno, C.; Rodríguez-Llerena, M.; Damián-Carrión, D. Land cover classification in an Ecuadorian mountain geosystem using a random forest classifier, spectral vegetation indices, and ancillary geographic data. Geosciences 2017, 7, 34. [Google Scholar] [CrossRef]
  25. Marchetti, Z.Y.; Minotti, P.G.; Ramonell, C.G.; Schivo, F.; Kandus, P. NDVI patterns as indicator of morphodynamic activity in the middle Paraná River floodplain. Geomorphology 2016, 253, 146–158. [Google Scholar] [CrossRef]
  26. Arekhi, M.; Yılmaz, O.Y.; Yılmaz, H.; Akyüz, Y.F. Can tree species diversity be assessed with Landsat data in a temperate forest? Environ. Monit. Assess. 2017, 189. [Google Scholar] [CrossRef] [PubMed]
  27. Chakraborty, A.; Seshasai, M.V.R.; Reddy, C.S.; Dadhwal, V.K. Persistent negative changes in seasonal greenness over different forest types of India using MODIS time series NDVI data (2001–2014). Ecol. Indic. 2018, 85, 887–903. [Google Scholar] [CrossRef]
  28. Mapfumo, R.B.; Murwira, A.; Masocha, M.; Andriani, R. The relationship between satellite-derived indices and species diversity across African savanna ecosystems. Int. J. Appl. Earth Obs. Geoinform. 2016, 52, 306–317. [Google Scholar] [CrossRef]
  29. Madonsela, S.; Cho, M.A.; Ramoelo, A.; Mutanga, O. Remote sensing of species diversity using Landsat 8 spectral variables. ISPRS J. Photogramm. Remote Sens. 2017, 133, 116–127. [Google Scholar] [CrossRef]
  30. Intasen, M.; Hauer, R.J.; Werner, L.P.; Larsen, E. Urban forest assessment in Bangkok, Thailand. J. Sustain. For. 2017, 36, 148–163. [Google Scholar] [CrossRef]
  31. Sampanpanish, P.; Jamroenprucksa, M. Ecological characteristics of homegarden agroforestry system in Amphoe Muang, Changwat Nonthaburi. Thai J. For. 1994, 13, 114–124. [Google Scholar]
  32. Campbell, K.; Chan, L.; Custot, J.; Elmqvist, T.; Galt, R.; Katti, M.; Mader, A.; Persic, A.; Puppim de Oliveira, J.; Rudd, A. Cities and Biodiversity Outlook: Action and Policy A Global Assessment of the Links between Urbanization, Biodiversity, and Ecosystem Services; Secretariate of the Convention on Biological Diversity: Montreal, QC, Canada, 2012. [Google Scholar]
  33. Yan, P.; Yang, J. Species diversity of urban forests in China. Urban For. Urban Green. 2017, 28, 160–166. [Google Scholar] [CrossRef]
  34. Kiratiprayoon, S. Comparative Study on the Structure of the Rattan Bearing Tropical Rain Forest; Kasetsart University: Bangkok, Thailand, 1986. [Google Scholar]
  35. Bunyavejchewin, S.; Lafranki, J.V.; Pattapong, P.; Kanzaki, M.; Itoh, A.; Yamakura, T.; Ashton, P.S. Topographic analysis of a large-scale research plot in seasonal dry evergreen forest at Huai Kha Khaeng Wildlife Sanctuary, Thailand. Tropics 1998, 8, 45–60. [Google Scholar] [CrossRef]
  36. Xiao, J.; Moody, A. A comparison of methods for estimating fractional green vegetation cover within a desert-to-upland transition zone in central New Mexico, USA. Remote Sens. Environ. 2005, 98, 237–250. [Google Scholar] [CrossRef]
  37. Elmore, A.J.; Mustard, J.F.; Manning, S.J.; Lobell, D.B. Quantifying vegetation change in semiarid environments: Precision and accuracy of spectral mixture analysis and the normalized difference vegetation index. Remote Sens. Environ. 2000, 73, 87–102. [Google Scholar] [CrossRef]
  38. Meng, J.; Li, S.; Wang, W.; Liu, Q.; Xie, S.; Ma, W. Estimation of forest structural diversity using the spectral and textural information derived from SPOT-5 satellite images. Remote Sens. 2016, 8, 125. [Google Scholar] [CrossRef]
  39. Franklin, S.E.; Hall, R.J.; Moskal, L.M.; Maudie, A.J.; Lavigne, M.B. Incorporating texture into classification of forest species composition from airborne multispectral images. Int. J. Remote Sens. 2000, 21, 61–79. [Google Scholar] [CrossRef]
  40. Andersen, H.-E.; McGaughey, R.J.; Reutebuch, S.E. Estimating forest canopy fuel parameters using LIDAR data. Remote Sens. Environ. 2005, 94, 441–449. [Google Scholar] [CrossRef]
  41. Ozdemir, I.; Karnieli, A. Predicting forest structural parameters using the image texture derived from WorldView-2 multispectral imagery in a dryland forest, Israel. Int. J. Appl. Earth Obs. Geoinform. 2011, 13, 701–710. [Google Scholar] [CrossRef]
  42. Wallner, A.; Elatawneh, A.; Schneider, T.; Knoke, T. Estimation of forest structural information using RapidEye satellite data. Forestry 2015, 88, 96–107. [Google Scholar] [CrossRef]
  43. Kayitakire, F.; Hamel, C.; Defourny, P. Retrieving forest structure variables based on image texture analysis and IKONOS-2 imagery. Remote Sens. Environ. 2006, 102, 390–401. [Google Scholar] [CrossRef]
Figure 1. Satellite LANDSAT 7 false color image of Bangkok and the Chao Phraya River showing location of the Bang Kachao Green Space (BKGS), 25 April 2012. Locations of the nine sample plots were in rehabilitation forest (plots 1, 2, 3 and 6), home-garden agroforestry (plots 4 and 8), mangrove forest (plot 5) and park (plots 7 and 9).
Forests 09 00036 g001
Figure 2. NDVI classification image of Bangkok and the Chao Phraya River showing location of the Bang Kachao Green Space (BKGS). Boundaries of the 6 sub-districts are shown. Numbers are the locations of the nine research plots.
Forests 09 00036 g002
Figure 3. Appearance of vegetation from ground and plan views of study plots in Bang Kachao Green Space, Bangkok, Thailand. Plot descriptors are given in Table 1. Plots 1 (a); 2 (b); 3 (c) and 6 (f) were rehabilitation forest, plots 4 (d) and 8 (h) were home-garden agroforestry, plot 5 (e) was mangrove forest, plot 7 (g) was in Chalerm Phra Kiat the King Bhumibhol 80 Phansa Park, and plot 9 (i) was in Sri Nakhon Khuean Khan Park and Botanical Garden.
Forests 09 00036 g003
Figure 4. Correlation analysis of the pairwise interaction between NDVI and stand structural factors (number of families, number of species, plot density, DBH, height, basal area, canopy density, canopy layer, Shannon-Weiner , exponential Shannon index (1D), and Shannon equitability) of the study area, where * indicates p < 0.05, ** indicates p < 0.01 and *** indicates p < 0.001.
Forests 09 00036 g004
Figure 5. Linear regression between NDVI and number of families, number of species, total basal area, Shannon-Wiener’s index and exponential Shannon index, of the study area.
Forests 09 00036 g005
Table 1. Stand characteristics for Bang Kachao Green Space study plots.
Urban Forest TypesRehabilitation ForestHome-GardenMangrovePark
Plot 1Plot 2Plot 3Plot 6Plot 4Plot 8Plot 5Plot 7Plot 9
Number of families101513171581182
Number of species15231925171115132
Plot density (trees/ha)1268988716892820980840360104
Average DBH (cm)12.913.313.29.711.89.612.98.224.7
Average height (m)8.48.28.56.75.16.67.657.5
Total basal area (m2/ha)22.818.614.610.112.59.613.22.35.2
Canopy density (%)91.867.282.438.257.56991.819.625
Number of canopy layers433233321
Shannon-Wiener index1.782.392.122.591.571.391.881.860.43
Exponential Shannon index (1D)5.9310.788.3713.324.834.026.536.401.54
Shannon’s equitability (EH)0.460.530.510.550.380.400.480.500.43
Table 2. Frequency and importance value index (IVI) of tree species in each plot within Bang Kachao Green Space.
No.Scientific NameRehabilitation ForestHome-GardenMangrovePark
Plot 1Plot 2Plot 3Plot 6Plot 4Plot 8Plot 5Plot 7Plot 9
1Acacia auriculaeformis 5.2
2Adenanthera pavonina 3.94.1
3Antidesma ghaesembilla4.74.69.618.5 7.91.9112.6
4Areca catechu1.3 8.9 23.53.9
5Artocarpus heterophyllus 11.3
6Averrhoa carambola 1.7
7Azadirachta indica8.5 19.0 6.82.85.83.6
8Bambusa spp. 1.7
9Barringtonia acutangula 1.74.0 3.7
10Barringtonia racemosa1.3
11Bauhinia purpurea 1.3
12Bruguiera sexangula 1.4
13Calophyllum inophyllum 1.3
14Caryota bacsonensis21.817.54.123.6 17.2
15Cassia fistula 1.8
16Cassia siamea57.94.1 5.1
17Cerbera odollam 59.673.248.813.1 80.842.5
18Cocos nucifera103.973.024.759.7101.324.918.3 220.9
19Delonix regia 3.8
20Dolichandrone spathacea 1.4 1.7 2.2
21Elaeocarpus hygrophilus1.31.3 1.3 3.6
22Erythrina fusca16.04.443.413.8
23Ficus altissima 3.9
24Ficus religiosa 10.9
25Ficus spp.1.38.810.52.6
26Hibiscus tiliaceus 30.81.8 37.9
27Hopea odorata 1.4 11.3
28Lagerstroemia loudonii 1.3
29Lepisanthes rubiginosa5.23.8 1.81.8
30Leucaena leucocephala5.321.112.620.7 22.7
31Mangifera indica 35.6
32Morinda citrifolia 1.4
33Musa spp. 108.2 10.0
34Nypa fruticans 1.2 35.3
35Peltophorum dasyrachis 8.579.1
36Peltophorum pterocarpum 2.1 6.9 1.9
37Phyllanthus acidus 3.6
38Pithecellobium dulce2.81.724.14.01.89.7
39Psidium guajava 1.7
40Pterocarpus indicus 27.12.6 39.6
41Samanea saman 4.38.2
42Senna siamea 40.4
43Sonneratia caseolaris 4.4 65.63.7
44Sonneratia ovata 3.7
45Streblus asper64.721.043.87.9 144.82.24.7
46Swietenia macrophylla 5.8 11.0
47Syzygium cumini 1.41.7
48Syzygium malaccense 3.6
49Tabebuia rosea 3.7 1.9
50Tamarindus indica 3.513.32.8
51Terminalia catappa4.028.61.87.8 39.528.515.0
52Ziziphus mauritiana 1.8
Table 3. NDVI values for Bang Kachao Green Space study plots.
Urban Forest TypesRehabilitation ForestHome-GardenMangrovePark
Plot 1Plot 2Plot 3Plot 6Plot 4Plot 8Plot 5Plot 7Plot 9
NDVI0.4810.4710.4660.4320.4220.1700.4360.2280.156

