Macronutrient Stocks in Scots Pine Stands of Different Densities


1
Faculty of Forestry, Poznań University of Life Sciences, Wojska Polskiego 28, 60-637 Poznań, Poland
2
Department of Forestry and Forest Ecology, University of Warmia and Mazury in Olsztyn, Oczapowskiego 2, 10-719 Olsztyn, Poland
*
Author to whom correspondence should be addressed.
Forests 2018, 9(10), 593; https://doi.org/10.3390/f9100593
Submission received: 28 August 2018
/
Revised: 12 September 2018
/
Accepted: 20 September 2018
/
Published: 22 September 2018
(This article belongs to the Section Forest Ecology and Management)
Abstract
:A positive nutrient balance is crucial to sustaining forest productivity. Differences in stand densities usually mean different aboveground biomass stocks and different proportions of tree compartments. These differences can be reflected in the different macronutrient stocks between stands of different densities, because various tree compartments have different element concentrations. In this study, 82-year-old stands of Scots pine were compared, and specifically, the concentrations of the elements in tree compartments and the amounts of macronutrients in aboveground biomass were compared. The nutrients considered in this study were nitrogen, phosphorus, potassium, calcium, magnesium, and sulfur. A positive correlation between stand density and the level of stored macronutrients was found for nitrogen, phosphorus, and potassium. This result means that forest managers can influence nutrient balances by regulating stand densities or by harvesting methods (SOH: stem-only harvesting or WTH: whole-tree harvesting).
1. Introduction
Macronutrients, such as nitrogen (N), phosphorus (P), potassium (K), calcium (Ca), magnesium (Mg), and sulfur (S) play an essential role in tree growth [1,2,3,4,5]. Limits in available nutrients can significantly reduce forest productivity [6,7,8,9,10].
Nutrient stocks in forest ecosystems are changing due to natural processes and human operations—where some forests are experiencing some increase in nutrient content or availability, other forests are experiencing a depletion of their nutrient stocks in the soil. Many nutrient balance studies have been conducted to estimate these changes [8,11,12,13,14]. A nutrient budget is defined as the difference between nutrient inputs and outputs of an ecosystem over a specified time period [15]. The budget studies are based on a mixture of empirical and assumed input and output levels of nutrients [16]. In managed forests and forest plantations, harvesting is the main operation that causes nutrient losses. Nutrients removed from forest ecosystems via woody biomass can be compensated for by inputs from atmospheric deposition and, in mineral soils, by weathering [13,17]. Maintaining a positive nutrient balance is essential to achieving sustainable forestry [8].
As forests are harvested more intensively, nutrient export from the ecosystem also increases [8,18]. However, the magnitude of nutrient removal depends on the harvesting method, because nutrient concentrations differ between tree compartments [19]. Branches, needles, and tree crowns generally have higher concentrations of nutrients than the stem [13,17,20]. In conventional stem-only harvesting (SOH), these parts of trees, together with small unmarketable or damaged trees, constitute logging residues and are left on the site. In contrast, whole-tree harvesting (WTH), especially for bioenergy purposes, includes the removal of these residues from the site. Nutrient balance calculations indicate that in many cases, nutrient removals by WTH exceed the replenishment rate of plant-available nutrient pools in soil by mineral weathering and atmospheric deposition [21,22,23,24].
Utilization of forest biomass for energy has substantially grown in recent years, and this trend is expected to continue to rise [8,13,25]. This utilization of forests for biomass causes an increased demand for forest residues as an available energy source. However, complete removal of aboveground biomass could deplete soil nutrient pools and decrease site productivity over the long term [24,26]. Therefore, it is important to know how forest management practices could affect nutrient stocks in the aboveground biomass of a stand so that harvesting intensity can be properly adjusted to preserve or improve a positive nutrient balance.
A main goal of forest management is to increase stand growth and improve its quality on a sustainable basis. Stand density is one of few things that can be controlled efficiently. Controlling stand density by initial spacing and thinning is a major tool for achieving this goal [27]. Thinning reduces the number of trees on a site and increases the growth of the remaining trees [28,29,30].
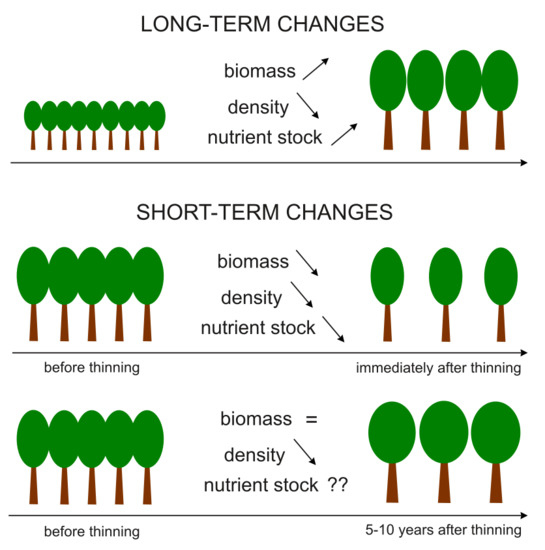
The relationship between stand density and the accumulation of nutrients in biomass varies depending on the considered period (Figure 1). Over the long term, the number of trees decreases, but overall biomass increases with the nutrient stock [13,31]. In the short term, the situation could be the opposite. Directly after thinning, the number of trees drops considerably and overall biomass and nutrient stocks are smaller than before thinning [32,33]. However, a few years after thinning, after a period of stimulated growth, stand biomass could be the same as it was before. It is not yet clear if macronutrient stocks follow the same pattern.
The Scots pine has the largest geographic distribution of all pine species and is probably the most widely distributed coniferous species in the world [29]. The large geographic distribution is a consequence of a wide ecological amplitude, regarding both climatic conditions as well as soil requirements (from soils rich in humus to very poor). It is also an economically important species [30,34,35]. To estimate how macronutrient stocks change, five sample stands of Scots pine (Pinus sylvestris L.) were compared. The stands were the same age and maturity, had different densities (476–836 trees per ha), and were 5–10 years past thinning. The aim of the study was to determine the influence of stand density on the macronutrient stocks (N, P, K, Ca, and Mg) in the aboveground biomass of mature Scots pine stands.
For Scots pine stands of a similar age, we predict that there will be a correlation between stand density and the amount of accumulated nutrients. Stands with lower densities should have less nutrients stored, which could be due to removing many trees that had nutrients contained within them [36,37]. Another explanation for this potential result could be that a lower number of trees means less leaf fall [38].
2. Materials and Methods
This study was carried out in 5 sample stands of Scots pine (Pinus sylvestris L.), located in the Drawno Forest District, northwestern Poland (15°50′–16°0′ E, 53°10′–53°13′ N). This area is characterized by nutrient-poor habitats on podzolic soils, where the dominant tree species is Scots pine (Figure 2). Scots pine mostly forms uniform stands with a small admixture of other tree species, usually birch. The average annual rainfall in this area is 589 mm, the average temperature is 7 °C, and the growing season lasts 200–220 days. It was assumed that the stands have been established in a similar way (the same initial spacing) and similarly managed (the same owner and manager). Since the Second World War, the stands have been managed by the State Forests National Forest Holding. The sample plots, 0.5 ha each (Table 1), were selected so that tree density would be the distinguishing variable. Plots were established in evenly-aged, 82-year-old, single-species, single-layer stands growing on the same soil type, classified as Carbic Podzol, within the same forest complex and on flat terrain. The stands had not been thinned over the previous 5 years.
On the sample plots, diameter at breast height (DBH) was measured for each tree on each plot, and the height of 20% of the trees was measured—i.e., every fifth tree. Based on this data for each plot separately, Näslund’s height curves were developed to establish the height of each tree [39].
The dry mass of all the trees on the five experimental plots was calculated using allometric equations [40]. On each 0.5-ha plot, 10 model trees were selected, with DBH representing the range of the measured diameters, resulting in 50 model trees in total. Model trees were felled in 2013 and divided into defined compartments: stem, dead branches, thick branches (diameter of more than 5 mm), thin branches, and needles. From the stem, samples were taken as 10-cm cross sections that were cut every meter along the stem. The fresh mass of each compartment was measured. After weighing the fresh compartments, the samples were dried at 65 °C to a constant mass to determine the dry mass. Using the sample proportion of dry and fresh mass, the dry mass of each compartment of each model tree was calculated.
Allometric equations were developed based on the data obtained for the 50 model trees across all plots. These allometric equations made it possible to calculate the dry mass of the aboveground component of every individual tree, using DBH and height as predictive variables. Mass was calculated for the following compartments: (1) stem, (2) dead branches, (3) thick branches, (4) thin branches, and (5) needles. The results were used to calculate the mass of each individual tree and the collective mass for the experimental plots.
Chemical analyses were conducted on a select number of trees that were used for biomass estimation. For each sample area, 3 out of the 10 model trees were selected. From the list, ordered by increasing DBH, the second, fifth, and ninth trees were chosen. Across the whole study area, a total of 15 trees were selected. Materials for the chemical analysis were taken beforehand from the samples used to determine dry mass.
Stem wood was divided into a marketable component and the top component (diameter below 7 cm). The two selected sample cross sections, the cross sections closest to the middle of each component, were taken for chemical analysis. The remaining cross sections were used to determine the proportion of wood and bark dry mass, which were previously not separated. Samples from other tree components, dead branches, thick branches, thin branches, and needles, were also taken for chemical analysis. The material was ground, marked, and sent to the laboratory. Laboratory samples were mineralized in HNO3 and by using an inductively coupled plasma optical emission spectrometer (Optima 7300 DV ICP-OES) by Perkin Elmer Inc. (Waltham, MA, USA), and the contents of the following elements were determined: P, K, Ca, and Mg. Without mineralization, the content of N and S was determined by using a LECO TruMac CNS Macro Analyzer (Leco Corporation (Saint Joseph, MI, USA)).
To create a model for each tree in the test areas, one of 3 sample trees with the closest DBH was assigned. Based on the dry mass and percentage content of the nutrients in the assigned sample tree, the nutrient masses in each tree compartment within the test area were calculated.
The next step was determining the nutrient content of each tree component for all experimental plots. For each tree, the nutrient content was estimated based on the dry mass of each given component and the content of 7 macronutrients in the sample from the specific compartment. To calculate the element content for the remaining trees (other than model trees), specific coefficients were used based on proportions found in model trees that had the closest DBH to a certain tree. In this way, the basis for calculations in smaller trees was the smallest model tree, and for the bigger trees, was the biggest model tree. The mass of any element contained in a tree compartment was calculated by multiplying the dry mass of this compartment by a specific coefficient (ratio) found in a model tree with the closest DBH.
Statistical analyses were performed using the “Multivariate Platform” tool in JMP 10.0 statistical software (SAS Institute Inc., Cary, NC, USA). Obtained as results were Pearson correlation coefficients (r) and the corresponding levels of significance. On this basis, an assessment of the correlations between the stand density and (1) aboveground biomass, (2) stand volume, (3) basal area, (4) mean DBH, (5) mean height, and (6) nutrient stock was performed. Additionally, the correlations between DBH of 15 model trees and concentrations of macronutrients in different tree compartments (stem wood, stem bark, branches, and needles) were calculated.
3. Results
The biomass of various tree compartments (stem wood, stem bark, thick branches, thin branches, dead branches, and needles) from five sample stands of Scots pine of different densities is shown in Table 2. The concentrations of six macronutrients in the dry mass of various tree compartments (estimated basing on 15 model trees) is shown in Table 3. Four macronutrients (N, P, K, and S) had the highest concentrations in the needles, while two macronutrients (Mg and Ca) had the largest concentrations in the stem bark. Among the compartments with the lowest concentrations of elements were those found in stem wood, except for Mg and K, which had the lowest concentration in dead branches (Table 3). Four macronutrients (N, P, K, and S) had a negative correlation between DBH and concentration for branches and bark, and one (Ca) for stem wood and bark (Figure 3).
The amounts of the six analyzed macronutrients in the aboveground biomass of Scots pine stands of different densities is shown in Table 4. The most abundant macronutrient was N, with 238.08–291.77 kg·ha−1 in all plots; the highest amount of N was in the stem wood, and the lowest amount was in the stem bark. The second most abundant macronutrient in terms of amount per hectare was Ca (185.69–237.16 kg·ha−1), with the largest amount in the stem bark and stem wood and the lowest amount in the needles. The third most abundant macronutrient was K (77.33–108.50 kg·ha−1), most of which was in the stem wood, with the smallest amount in the stem bark. Next, Mg (38.64–71.39 kg·ha−1) was highest in the stem wood and lowest in the needles. The last two nutrient levels were P (22.33–33.04 kg·ha−1) and S (15.80–22.21 kg·ha−1). Nitrogen was the most abundant element in the stem wood (68.17–126.37 kg·ha−1), branches (54.03–75.38 kg·ha−1), and needles (54.78–60.84 kg·ha−1). In the stem bark, the most abundant element was Ca (65.21–80.38 kg·ha−1).
The analysis of correlation showed a statistically significant relationship between stand density and macronutrient content for five cases (Table 5). The nutrient content in the total aboveground biomass was positively correlated with stand density for N (r = 0.970, p < 0.01), P (r = 0.909, p < 0.05), and K (r = 0.887, p < 0.05). Additionally, a positive correlation between stand density and P content was found in stem bark (r = 0.913, p < 0.05) and branches (r = 0.901, p < 0.05). Statistically significant, negative correlations were found between stand density and mean DBH (r = −0.850, p < 0.001) and mean tree height (r = −0.497, p < 0.05). No correlation was found between stand density and total aboveground biomass, biomass of tree compartments (stem wood, stem bark, branches, and needles), stand volume, or basal area.
4. Discussion
The obtained results confirm the widely known fact that nutrient concentrations vary greatly between tree compartments and are usually lowest in stem wood and highest in stem bark and tree crowns—mostly needles [36,41,42]. The practical application of this information could be important: by employing various utilization methods, forest managers can significantly increase or decrease the amount of nutrients removed from forest ecosystems.
In mature stands (for Scots pine—over 30 years old), nutrient concentrations are rather constant and do not change with age [31]. For the stands of the same age, nutrient concentrations are correlated with tree size [43]. In spite of this, there is no evidence for a correlation between nutrient stock and thinning intensity [32].
By analyzing the relationship between stand density and the amount of stored nutrients, two situations should be distinguished: (1) when differences in densities are a consequence of different ages and (2) when stands of different densities are of similar ages. In the first case, changes in density result from stand age, when the number of trees decreases but the overall biomass increases, along with the amount of stored nutrients (Figure 1). In this case, the relationships are rather obvious—the amounts of stored nutrients should be positively correlated with biomass growth and stand age and negatively correlated with density. In our study, mature stands of a similar age but of different densities were compared. In this case, the obtained results might be distorted by recent thinning. Directly after thinning, the density is affected by thinning intensity (the amount of removed biomass). Stands with lower densities have lower biomass and a lower amount of stored nutrients. Consequently, the correlation between nutrient stocks and density should be positive, which is the opposite of the case of stands of different ages (Figure 1). To avoid such a distortion of results, the sample stands selected for our study had not been thinned in the last 5–10 years.
In our study, a positive correlation between stand density and the amount of stored nutrients was found for three out of the six elements (Table 5). Stand density was correlated with N, P, and K content in the aboveground biomass and additionally with P content in the stem bark and branches. There could be three explanations of correlation between stand density and nutrient stock: (1) different biomass of stands with different densities, (2) different proportions of tree compartments with different nutrient concentrations, and (3) difference in tree size in stands of different densities, or a combination of the above.
In our study, the main cause of such correlation was the variability in tree size that had different nutrient concentrations. The lower the number of trees, the bigger their DBH, and at the same time, larger trees have lower concentrations of some macronutrients. Concentrations of N, P, and K in branches and needles were negatively correlated with DBH (Figure 3), so the stock of these nutrients was lower in stands of lower densities, where trees were bigger. It could be expected that the same is true for Ca and S, the concentrations of which were also negatively correlated with DBH in some compartments. Their correlation was not statistically significant, which could be caused by the low number of model trees used for estimating concentrations (only three for each stand).
A strong negative correlation between the mean DBH of the trees and the stand density is commonly known and has been reported by multiple authors [34,44,45,46,47,48,49].
Differences in stand biomass could not be the reason for correlation between stand density and nutrient stock, because the biomass of any compartment was not correlated with stand density. The differences in proportions of tree compartments’ biomass in different stands also could not explain this correlation. When using stand-average concentrations of nutrients for calculations (without the division into trees of various size), resulting stocks were not correlated with stand density.
Research on the relationship between stand density and the accumulation of nutrients is very limited [36,50]. In Korea, mature stands of Japanese red pine Pinus densiflora with a high density (842 trees·ha−1) and a low density (450 trees·ha−1) were compared, and N storage was nearly the same for both stands [37]. In Canada, an estimation of macronutrient (N, P, K, Ca, and Mg) removal from the biomass of five commercially utilized tree species in stands with three different densities was carried out; density was not found to influence nutrient export at various harvesting intensities [51]. The results of this research differed from our research, because the N, P, and K content showed a correlation with stand density. On the other hand, a pattern similar to the one in our study was found in plantations of loblolly pine Pinus taeda and slash pine Pinus elliottii in Georgia (USA). The amount of accumulated N, P, and K was significantly higher in denser stands, although the stands were young (4 years old) and the variations in density were due to different initial spacing [36].
The amount of nutrients in the aboveground biomass of the Scots pine stands are in the following order: N > Ca > K > Mg > P > S. Similar results were also obtained by other researchers [13,16,24,52].
The ambiguity in the obtained results indicates the need for further, deeper investigations on other stands that account for various geographical locations and tree species.
5. Conclusions
The concentration of macronutrients in tree biomass vary greatly between tree compartments and also between trees of different DBH. Tree size is connected with stand density, which could be regulated by initial spacing and by thinning intensity.
Accumulations of N, P, and K in mature, same-age stands of Scots pine were higher in stands with higher densities. This discovery could be useful in practical forest management. More intense thinning causes a higher utilization of biomass, likely a better income from the final felling of a less dense stand [53], and a lower export of nutrients, due to the lower concentration in biomass in less dense stands.
Author Contributions
Conceptualization, A.W. and K.P.; Investigation, A.W.; Methodology, A.W.; Formal Analysis, E.B.; Writing—Original Draft Preparation, A.W. and K.P.; Writing—Review & Editing, A.W., E.B., and K.P.; Visualization, A.W.
Funding
This research was funded by the European Regional Development Fund and the Polish Ministry of Science and Higher Education (INT-09-0039).
Acknowledgments
The authors would like to thank the participants of the International Scientific Camps for Forestry Students ForseenPOMERANIA for their valuable contribution to the laborious field studies on research plots in the Drawno Forest District (Pomerania Region, Poland).
Conflicts of Interest
The authors declare no conflict of interest. The funders had no role in the design of the study; in the collection, analyses, or interpretation of data; in the writing of the manuscript; or in the decision to publish the results.
References
- Tamm, C.O. Denitrification in forest ecosystems—Preface. For. Ecol. Manag. 1991, 44, 1–3. [Google Scholar] [CrossRef]
- Wang, J.R.; Zhong, A.L.; Simard, S.W.; Kimmins, J.P. Aboveground biomass and nutrient accumulation in an age sequence of paper birch (Betula papyrifera) in the Interior Cedar Hemlock zone, British Columbia. For. Ecol. Manag. 1996, 83, 27–38. [Google Scholar] [CrossRef]
- Nohrstedt, H.Ö. Response of coniferous forest ecosystems on mineral soils to nutrient additions: A review of swedish experiences. Scand. J. For. Res. 2001, 16, 555–573. [Google Scholar] [CrossRef]
- Prietzel, J.; Stetter, U. Long-term trends of phosphorus nutrition and topsoil phosphorus stocks in unfertilized and fertilized Scots pine (Pinus sylvestris) stands at two sites in Southern Germany. For. Ecol. Manag. 2010, 259, 1141–1150. [Google Scholar] [CrossRef]
- Modrzewska, B.; Kosiorek, M.; Wyszkowski, M. Content of some nutrients in scots pine, silver birch and Norway maple in an urbanized environment. J. Elem. 2016, 21, 149–157. [Google Scholar]
- Vitousek, P.M.; Porder, S.; Houlton, B.Z.; Chadwick, O.A. Terrestrial phosphorus limitation: Mechanisms, implications, and nitrogen-phosphorus interactions. Ecol. Appl. 2010, 20, 5–15. [Google Scholar] [CrossRef] [PubMed]
- Wright, S.J.; Yavitt, J.B.; Wurzburger, N.; Turner, B.L.; Tanner, E.V.J.; Sayer, E.J.; Santiago, L.S.; Kaspari, M.; Hedin, L.O.; Harms, K.E.; et al. Potassium, phosphorus, or nitrogen limit root allocation, tree growth, or litter production in a lowland tropical forest. Ecology 2011, 92, 1616–1625. [Google Scholar] [CrossRef] [PubMed] [Green Version]
- Paré, D.; Thiffault, E. Nutrient budgets in forests under increased biomass harvesting scenarios. Curr. For. Rep. 2016, 2, 81–91. [Google Scholar] [CrossRef]
- Jonard, M.; Fürst, A.; Verstraeten, A.; Thimonier, A.; Timmermann, V.; Potočić, N.; Waldner, P.; Benham, S.; Hansen, K.; Merilä, P.; et al. Tree mineral nutrition is deteriorating in Europe. Glob. Ch. Biol. 2015, 21, 418–430. [Google Scholar] [CrossRef] [PubMed]
- Mandre, M.; Lukjanova, A.; Pärn, H.; Kõresaar, K. State of Scots pine (Pinus sylvestris L.) under nutrient and water deficit on coastal dunes of the Baltic Sea. Trees Struct. Funct. 2010, 24, 1073–1085. [Google Scholar] [CrossRef]
- Joki-Heiskala, P.; Johansson, M.; Holmberg, M.; Mattsson, T.; Forsius, M.; Kortelainen, P.; Hallin, L. Long-term base cation balances of forest mineral soils in Finland. Water Air Soil Pollut. 2003, 150, 255–273. [Google Scholar] [CrossRef]
- Akselsson, C.; Westling, O.; Sverdrup, H.; Holmqvist, J.; Thelin, G.; Uggla, E.; Malm, G. Impact of harvest intensity on long-term base cation budgets in Swedish forest soils. Water Air Soil Pollut. Focus 2007, 7, 201–210. [Google Scholar] [CrossRef]
- Palviainen, M.; Finér, L. Estimation of nutrient removals in stem-only and whole-tree harvesting of Scots pine, Norway spruce, and birch stands with generalized nutrient equations. Eur. J. For. Res. 2012, 131, 945–964. [Google Scholar] [CrossRef]
- Tamminen, P.; Saarsalmi, A.; Smolander, A.; Kukkola, M.; Helmisaari, H.S. Effects of logging residue harvest in thinnings on amounts of soil carbon and nutrients in Scots pine and Norway spruce stands. For. Ecol. Manag. 2012, 263, 31–38. [Google Scholar] [CrossRef]
- Ranger, J.; Turpault, M.P. Input-output nutrient budgets as a diagnostic tool for sustainable forest management. For. Ecol. Manag. 1999, 122, 139–154. [Google Scholar] [CrossRef]
- Egnell, G.; Valinger, E. Survival, growth, and growth allocation of planted Scots pine trees after different levels of biomass removal in clear-felling. For. Ecol. Manag. 2003, 177, 65–74. [Google Scholar] [CrossRef]
- Merino, A.; Balboa, M.A.; Rodríguez Soalleiro, R.; González, J.G.A. Nutrient exports under different harvesting regimes in fast-growing forest plantations in Southern Europe. For. Ecol. Manag. 2005, 207, 325–339. [Google Scholar] [CrossRef]
- Blanco, J.A.; Zavala, M.A.; Imbert, J.B.; Castillo, F.J. Sustainability of forest management practices: Evaluation through a simulation model of nutrient cycling. For. Ecol. Manag. 2005, 213, 209–228. [Google Scholar] [CrossRef]
- Węgiel, A.; Małek, S.; Bielinis, E.; Grebner, D.L.; Polowy, K.; Skonieczna, J. Determination of elements removal in different harvesting scenarios of Scots pine (Pinus sylvestris L.) stands. Scand. J. For. Res. 2018, 33, 261–270. [Google Scholar] [CrossRef]
- Helmisaari, H.S.; Hanssen, K.H.; Jacobson, S.; Kukkola, M.; Luiro, J.; Saarsalmi, A.; Tamminen, P.; Tveite, B. Logging residue removal after thinning in Nordic boreal forests: Long-term impact on tree growth. For. Ecol. Manag. 2011, 261, 1919–1927. [Google Scholar] [CrossRef]
- Wall, A. Effect of removal of logging residue on nutrient leaching and nutrient pools in the soil after clearcutting in a Norway spruce stand. For. Ecol. Manag. 2008, 256, 1372–1383. [Google Scholar] [CrossRef]
- Olsson, B.A.; Lundkvist, H.; Staaf, H. Nutrient status in needles of Norway spruce and Scots pine following harvesting of logging residues. Plant Soil 2000, 223, 161–173. [Google Scholar] [CrossRef]
- Achat, D.L.; Deleuze, C.; Landmann, G.; Pousse, N.; Ranger, J.; Augusto, L. Quantifying consequences of removing harvesting residues on forest soils and tree growth—A meta-analysis. For. Ecol. Manag. 2015, 348, 124–141. [Google Scholar] [CrossRef]
- Vangansbeke, P.; De Schrijver, A.; De Frenne, P.; Verstraeten, A.; Gorissen, L.; Verheyen, K. Strong negative impacts of whole tree harvesting in pine stands on poor, sandy soils: A long-term nutrient budget modelling approach. For. Ecol. Manag. 2015, 356, 101–111. [Google Scholar] [CrossRef]
- Peltola, S.; Kilpeläinen, H.; Asikainen, A. Recovery rates of logging residue harvesting in Norway spruce (Picea abies (L.) Karsten) dominated stands. Biomass Bioenergy 2011, 35, 1545–1551. [Google Scholar] [CrossRef]
- Wall, A. Risk analysis of effects of whole-tree harvesting on site productivity. For. Ecol. Manag. 2012, 282, 175–184. [Google Scholar] [CrossRef]
- Zeide, B. Optimal stand density: A solution. Can. J. For. Res. 2004, 34, 846–854. [Google Scholar] [CrossRef]
- Kojola, S.; Ahtikoski, A.; Hökkä, H.; Penttilä, T. Profitability of alternative management regimes in Scots pine stands on drained peatlands. Eur. J. For. Res. 2012, 131, 413–426. [Google Scholar] [CrossRef]
- Tahvonen, O.; Pihlainen, S.; Niinimäki, S. On the economics of optimal timber production in boreal Scots pine stands. Can. J. For. Res. 2013, 43, 719–730. [Google Scholar] [CrossRef]
- Giuggiola, A.; Bugmann, H.; Zingg, A.; Dobbertin, M.; Rigling, A. Reduction of stand density increases drought resistance in xeric Scots pine forests. For. Ecol. Manag. 2013, 310, 827–835. [Google Scholar] [CrossRef]
- Augusto, L.; Ranger, J.; Ponette, Q.; Rapp, M. Relationships between forest tree species, stand production and stand nutrient amount. Ann. For. Sci. 2000, 57, 313–324. [Google Scholar] [CrossRef] [Green Version]
- Blanco, J.A.; Imbert, J.B.; Castillo, F.J. Effects of thinning on nutrient content pools in two Pinus sylvestris forests in the Western Pyrenees. Scand. J. For. Res. 2006, 21, 143–150. [Google Scholar] [CrossRef]
- Jacobson, S.; Kukkola, M.; Mälkönen, E.; Tveite, B. Impact of whole-tree harvesting and compensatory fertilization on growth of coniferous thinning stands. For. Ecol. Manag. 2000, 129, 41–51. [Google Scholar] [CrossRef]
- Mäkinen, H.; Isomäki, A. Thinning intensity and long-term changes in increment and stem form of Scots pine trees. For. Ecol. Manag. 2004, 203, 21–34. [Google Scholar] [CrossRef]
- Valinger, E.; Elfving, B.; Mörling, T. Twelve-year growth response of Scots pine to thinning and nitrogen fertilisation. For. Ecol. Manag. 2000, 134, 45–53. [Google Scholar] [CrossRef]
- Barron-Gafford, G.A.; Will, R.E.; Burkes, E.C.; Shiver, B.; Teskey, R.O. Nutrient concentrations and contents, and their relation to stem growth, of intensively managed Pinus taeda and Pinus elliottii stands of different planting densities. For. Sci. 2003, 49, 291–300. [Google Scholar]
- Noh, N.J.; Kim, C.; Bae, S.W.; Lee, W.K.; Yoon, T.K.; Muraoka, H.; Son, Y. Carbon and nitrogen dynamics in a Pinus densiflora forest with low and high stand densities. J. Plant Ecol. 2013, 6, 368–379. [Google Scholar] [CrossRef]
- Blanco, J.A.; Imbert, J.B.; Castillo, F.J. Nutrient return via litterfall in two contrasting Pinus sylvestris forests in the Pyrenees under different thinning intensities. For. Ecol. Manag. 2008, 256, 1840–1852. [Google Scholar] [CrossRef]
- Siipilehto, J. A comparison of two parameter prediction methods for stand structure in Finland. Silv. Fenn. 2000, 34, 331–349. [Google Scholar] [CrossRef]
- Picard, N.; Saint-André, L.; Henry, M. Manual for Building Tree Volume and Biomass Allometric Equations: From Field Measurement to Prediction; Food and Agriculture Organization of the United Nations (FAO): Rome, Italy, 2012; p. 215. [Google Scholar]
- Augusto, L.; Meredieu, C.; Bert, D.; Trichet, P.; Porté, A.; Bosc, A.; Lagane, F.; Loustau, D.; Pellerin, S.; Danjon, F.; et al. Improving models of forest nutrient export with equations that predict the nutrient concentration of tree compartments. Ann. For. Sci. 2008, 65, 808. [Google Scholar] [CrossRef]
- Finér, L. Nutrient concentrations in Pinus sylvestris growing on an ombrotrophic pine bog, and the effects of PK and NPK fertilization. Scand. J. For. Res. 1992, 7, 205–218. [Google Scholar] [CrossRef]
- Skonieczna, J.; Małek, S.; Polowy, K.; Węgiel, A. Element content of Scots pine (Pinus sylvestris L.) stands of different densities. Drewno 2014, 57, 77–87. [Google Scholar]
- Del Río, M.; Montero, G.; Bravo, F. Analysis of diameter-density relationships and self-thinning in non-thinned even-aged Scots pine stands. For. Ecol. Manag. 2001, 142, 79–87. [Google Scholar] [CrossRef]
- Kuliešis, A.; Saladis, J.; Kuliešis, A.A. Development and productivity of young Scots pine stands by regulating density. Balt. For. 2010, 16, 235–246. [Google Scholar]
- Nilsson, U.; Agestam, E.; Ekö, P.-M.; Elfving, B.; Fahlvik, N.; Johansson, U.; Karlsson, K.; Lundmark, T.; Wallentin, C. Thinning of Scots pine and Norway spruce monocultures in Sweden. Stud. For. Suec. 2010, 219, 1–46. [Google Scholar]
- Alegria, C. Simulation of silvicultural scenarios and economic efficiency for maritime pine (Pinus pinaster Aiton) wood-oriented management in centre inland of Portugal. For. Syst. 2011, 20, 361–378. [Google Scholar]
- Dean, T.J.; Roberts, S.D.; Seymour, R.S. Toward developing a direct relation between gross volume increment and stand density. Can. J. For. Res. 2013, 43, 852–860. [Google Scholar] [CrossRef]
- Tang, X.L.; Pérez-Cruzado, C.; Vor, T.; Fehrmann, L.; Álvarez-González, J.G.; Kleinn, C. Development of stand density management diagrams for Chinese fir plantations. Forestry 2016, 89, 36–45. [Google Scholar] [CrossRef]
- Fang, X.M.; Christenson, L.M.; Wang, F.C.; Zeng, J.P.; Chen, F.S. Pine caterpillar outbreak and stand density impacts on nitrogen and phosphorus dynamics and their stoichiometry in Masson pine (Pinus massoniana) plantations in subtropical China. Can. J. For. Res. 2016, 46, 601–609. [Google Scholar] [CrossRef]
- Paré, D.; Rochon, P.; Brais, S. Assessing the geochemical balance of managed boreal forests. Ecol. Indic. 2002, 1, 293–311. [Google Scholar] [CrossRef]
- Armolaitis, K.; Varnagirytė-Kabašinskienė, I.; Stupak, I.; Kukkola, M.; Mikšys, V.; Wojcik, J. Carbon and nutrients of Scots pine stands on sandy soils in Lithuania in relation to bioenergy sustainability. Biomass Bioenergy 2013, 54, 250–259. [Google Scholar] [CrossRef]
- Bembenek, M.; Karaszewski, Z.; Kondracki, K.; Łacka, A.; Mederski, P.S.; Skorupski, M.; Strzeliński, P.; Sułkowski, S.; Węgiel, A. Value of merchantable timber in Scots pine stands of different densities. Drewno 2014, 57, 133–142. [Google Scholar]
Figure 1.
Long-term and short-term changes in aboveground biomass, stand density, and aboveground nutrient stocks in forests.
Figure 1.
Long-term and short-term changes in aboveground biomass, stand density, and aboveground nutrient stocks in forests.

Figure 2.
Distribution of sample plots (SP) in the southeastern part of the Drawno Forest District.

Figure 3.
Average concentrations of macronutrients in tree compartments (SW—stem wood, SB—stem bark, BR—branches, FL—foliage) in model trees (N = 15) divided into small, medium, and big trees (according to DBH). Oblique lines show in which compartments the concentration of macronutrients was significantly correlated (p < 0.05) with tree size. All correlations were negative.


Table 1.
Main characteristics of five 82-year-old Scots pine sample stands.
| Sample Plot | Density, tree∙ha−1 | Mean DBH (±SD), cm | Mean Height (±SD), m | Basal Area, m2∙ha−1 | Volume, m3∙ha−1 |
|---|---|---|---|---|---|
| SP1 | 476 | 28.2 ± 4.5 | 22.9 ± 1.7 | 30.5 | 319 |
| SP2 | 590 | 25.7 ± 4.7 | 20.8 ± 1.4 | 31.5 | 302 |
| SP3 | 672 | 23.6 ± 4.3 | 19.6 ± 1.5 | 30.3 | 275 |
| SP4 | 756 | 23.9 ± 5.3 | 20.1 ± 2.0 | 35.6 | 337 |
| SP5 | 824 | 21.8 ± 4.0 | 19.3 ± 1.7 | 31.7 | 286 |
DBH—diameter at breast height, SD—standard deviation
Table 2.
Aboveground biomass (Mg∙ha−1) of different compartments of five sampled Scots pine stands.
| Sample Plot | Density, tree∙ha−1 | Stem Wood | Stem Bark | Thick Branches | Thin Branches | Dead Branches | Needles | Total |
|---|---|---|---|---|---|---|---|---|
| SP1 | 476 | 115.6 | 10.1 | 14.7 | 3.0 | 5.5 | 4.8 | 153.7 |
| SP2 | 590 | 107.4 | 9.4 | 14.9 | 2.9 | 5.5 | 4.7 | 144.8 |
| SP3 | 672 | 99.2 | 8.7 | 13.5 | 2.7 | 5.0 | 4.4 | 133.5 |
| SP4 | 756 | 120.4 | 10.6 | 16.3 | 3.2 | 6.1 | 5.3 | 161.9 |
| SP5 | 824 | 107.2 | 9.5 | 12.9 | 2.8 | 4.7 | 4.7 | 141.8 |
Table 3.
Mean (±SD) concentration (mg∙g−1) of elements for all (N = 15) sampled Scots pine model trees.
Table 3.
Mean (±SD) concentration (mg∙g−1) of elements for all (N = 15) sampled Scots pine model trees.
| Element | Stem Wood | Stem Bark | Thick Branches | Thin Branches | Dead Branches | Needles |
|---|---|---|---|---|---|---|
| N | 0.83 ± 0.21 | 4.91 ± 1.06 | 2.53 ± 0.96 | 7.08 ± 1.01 | 1.89 ± 0.54 | 12.3 ± 1.19 |
| P | 0.07 ± 0.04 | 0.62 ± 0.18 | 0.33 ± 0.08 | 0.78 ± 0.10 | 0.09 ± 0.02 | 1.15 ± 0.14 |
| K | 0.27 ± 0.15 | 1.53 ± 0.52 | 1.15 ± 0.24 | 2.65 ± 0.44 | 0.18 ± 0.16 | 4.45 ± 0.61 |
| Ca | 0.65 ± 0.13 | 7.89 ± 1.85 | 2.05 ± 0.27 | 2.26 ± 0.28 | 1.49 ± 0.42 | 3.16 ± 0.38 |
| Mg | 0.27 ± 0.10 | 0.99 ± 0.31 | 0.42 ± 0.07 | 0.63 ± 0.09 | 0.17 ± 0.05 | 0.65 ± 0.11 |
| S | 0.03 ± 0.02 | 0.43 ± 0.10 | 0.25 ± 0.16 | 0.73 ± 0.12 | 0.21 ± 0.07 | 1.28 ± 0.10 |
Table 4.
Macronutrient stocks (kg∙ha−1) in stem wood, stem bark, branches, needles, and total (all aboveground biomass) for Scots pine stands of different densities.
Table 4.
Macronutrient stocks (kg∙ha−1) in stem wood, stem bark, branches, needles, and total (all aboveground biomass) for Scots pine stands of different densities.
| Tree Parts | Sample Plots—Scots Pine Stands of Different Densities | ||||
|---|---|---|---|---|---|
| SP1, 476 trees·ha−1 | SP2, 590 trees·ha−1 | SP3, 672 trees·ha−1 | SP4, 756 trees·ha−1 | SP5, 824 trees·ha−1 | |
| N (nitrogen) | |||||
| Stem wood | 85.31 | 68.17 | 89.51 | 86.54 | 126.37 |
| Stem bark | 37.90 | 51.81 | 47.11 | 54.39 | 49.14 |
| Branches | 54.03 | 65.63 | 66.52 | 75.38 | 61.48 |
| Needles | 60.84 | 57.52 | 59.75 | 56.89 | 54.78 |
| Total | 238.08 | 243.13 | 262.89 | 273.20 | 291.77 |
| P (phosphorus) | |||||
| Stem wood | 6.24 | 5.61 | 6.68 | 12.43 | 11.13 |
| Stem bark | 4.28 | 6.09 | 6.28 | 6.80 | 6.78 |
| Branches | 6.28 | 6.85 | 7.80 | 8.08 | 7.75 |
| Needles | 5.53 | 5.02 | 5.58 | 5.73 | 5.16 |
| Total | 22.33 | 23.57 | 26.34 | 33.04 | 30.82 |
| K (potassium) | |||||
| Stem wood | 28.72 | 15.54 | 29.53 | 39.11 | 44.26 |
| Stem bark | 9.74 | 15.73 | 16.68 | 18.38 | 15.18 |
| Branches | 20.39 | 24.73 | 27.21 | 25.93 | 25.27 |
| Needles | 20.28 | 21.33 | 20.90 | 25.08 | 17.83 |
| Total | 79.13 | 77.33 | 94.32 | 108.50 | 102.54 |
| Ca (calcium) | |||||
| Stem wood | 58.68 | 55.17 | 67.53 | 96.16 | 76.76 |
| Stem bark | 70.43 | 70.07 | 80.38 | 74.15 | 65.21 |
| Branches | 43.36 | 46.40 | 42.02 | 49.90 | 36.10 |
| Needles | 15.12 | 14.05 | 14.42 | 16.95 | 15.15 |
| Total | 187.59 | 185.69 | 204.35 | 237.16 | 193.22 |
| Mg (magnesium) | |||||
| Stem wood | 20.86 | 18.6 | 32.09 | 48.48 | 29.07 |
| Stem bark | 6.53 | 9.74 | 11.08 | 9.89 | 10.3 |
| Branches | 8.29 | 7.88 | 9.29 | 9.8 | 8.51 |
| Needles | 3.55 | 2.42 | 3.16 | 3.22 | 2.86 |
| Total | 39.23 | 38.64 | 55.62 | 71.39 | 50.74 |
| S (sulfur) | |||||
| Stem wood | 0.66 | 3.96 | 5.15 | 4.03 | 3.57 |
| Stem bark | 3.11 | 4.91 | 4.24 | 4.13 | 4.52 |
| Branches | 5.59 | 7.43 | 6.30 | 6.55 | 5.78 |
| Needles | 6.44 | 5.91 | 5.95 | 6.14 | 5.79 |
| Total | 15.80 | 22.21 | 21.64 | 20.85 | 19.66 |
Table 5.
Pearson’s correlation coefficients (r) between stand density and nutrient stock and between stand density and nutrient concentration in different tree parts of the sampled Scots pine stands.
Table 5.
Pearson’s correlation coefficients (r) between stand density and nutrient stock and between stand density and nutrient concentration in different tree parts of the sampled Scots pine stands.
| Variable | Tree Part | N | P | K | Ca | Mg | S |
|---|---|---|---|---|---|---|---|
| Nutrient stock | Stem wood | 0.683 | 0.822 | 0.733 | 0.744 | 0.637 | 0.623 |
| Stem bark | 0.689 | 0.913 * | 0.723 | −0.124 | 0.751 | 0.537 | |
| Branches | 0.567 | 0.901 * | 0.730 | -0.282 | 0.500 | −0.024 | |
| Needles | −0.841 | −0.018 | −0.015 | 0.404 | −0.263 | −0.696 | |
| Total | 0.970 ** | 0.909 * | 0.887 * | 0.497 | 0.676 | 0.475 | |
| Nutrient concentration | Stem wood | 0.670 | 0.812 | 0.659 | 0.804 | 0.655 | 0.553 |
| Stem bark | 0.463 | 0.683 | 0.439 | −0.191 | 0.620 | 0.374 | |
| Branches | 0.409 | 0.849 | 0.789 | 0.301 | 0.781 | −0.020 | |
| Needles | 0.043 | 0.591 | 0.235 | 0.769 | −0.246 | 0.186 |
* Significant at p < 0.05, ** Significant at p < 0.01.
© 2018 by the authors. Licensee MDPI, Basel, Switzerland. This article is an open access article distributed under the terms and conditions of the Creative Commons Attribution (CC BY) license (http://creativecommons.org/licenses/by/4.0/).
Share and Cite
MDPI and ACS Style
Węgiel, A.; Bielinis, E.; Polowy, K. Macronutrient Stocks in Scots Pine Stands of Different Densities. Forests 2018, 9, 593. https://doi.org/10.3390/f9100593
AMA Style
Węgiel A, Bielinis E, Polowy K. Macronutrient Stocks in Scots Pine Stands of Different Densities. Forests. 2018; 9(10):593. https://doi.org/10.3390/f9100593
Chicago/Turabian StyleWęgiel, Andrzej, Ernest Bielinis, and Krzysztof Polowy. 2018. "Macronutrient Stocks in Scots Pine Stands of Different Densities" Forests 9, no. 10: 593. https://doi.org/10.3390/f9100593
Note that from the first issue of 2016, this journal uses article numbers instead of page numbers. See further details here.