Simulated Impacts of Soy and Infrastructure Expansion in the Brazilian Amazon: A Maximum Entropy Approach
by
 , , ,
, , ,
Gabriel P. Frey
1,* ,
,
Thales A. P. West
1,
Thomas Hickler
2,3,
Lisa Rausch
4,
Holly K. Gibbs
4,5 and
Jan Börner
1,6 1
Center for Development Research (ZEF), University of Bonn, 53113 Bonn, Germany
2
Senckenberg Biodiversity and Climate Research Centre (BiK-F), 60325 Frankfurt am Main, Germany
3
Department of Physical Geography, Goethe University, 60438 Frankfurt am Main, Germany
4
Center for Sustainability and the Global Environment (SAGE), Nelson Institute for Environmental Studies, University of Wisconsin-Madison, Madison, WI 53726, USA
5
Department of Geography, University of Wisconsin, Madison, WI 53706, USA
6
Institute for Food and Resource Economics (ILR), University of Bonn, 53115 Bonn, Germany
*
Author to whom correspondence should be addressed.
Forests 2018, 9(10), 600; https://doi.org/10.3390/f9100600
Submission received: 18 September 2018
/
Revised: 24 September 2018
/
Accepted: 25 September 2018
/
Published: 27 September 2018
(This article belongs to the Special Issue Policies Affecting Development and Forest Conservation)
Abstract
:Historically, the expansion of soy plantations has been a major driver of land-use/cover change (LUCC) in Brazil. While a series of recent public actions and supply-chain commitments reportedly curbed the replacement of forests by soy, the expansion of the agricultural commodity still poses a considerable threat to the Amazonian and Cerrado biomes. Identification of areas under high risk of soy expansion is thus paramount to assist conservation efforts in the region. We mapped the areas suitable for undergoing transition to soy plantations in the Legal Amazon with a machine-learning approach adopted from the ecological modeling literature. Simulated soy expansion for the year 2014 exhibited favorable validation scores compared to other LUCC models. We then used our model to simulate how potential future infrastructure improvements would affect the 2014 probabilities of soy occurrence in the region. In addition to the 2.3 Mha of planted soy in the Legal Amazon in 2014, our model identified another 14.7 Mha with high probability of soy conversion in the region given the infrastructure conditions at that time. Out of those, pastures and forests represented 9.8 and 0.4 Mha, respectively. Under the new infrastructure scenarios simulated, the Legal Amazonian area under high risk of soy conversion increased by up to 2.1 Mha (14.6%). These changes led to up to 11.4 and 51.4% increases in the high-risk of conversion areas of pastures and forests, respectively. If conversion occurs in the identified high-risk areas, at least 4.8 Pg of CO2 could be released into the atmosphere, a value that represents 10 times the total CO2 emissions of Brazil in 2014. Our results highlight the importance of targeting conservation policies and enforcement actions, including the Soy Moratorium, to mitigate future forest cover loss associated with infrastructure improvements in the region.
1. Introduction
Rapid expansion of soy production in Brazil started in the 1970s [1]. With the development of new varieties and infrastructure during the 1980s, soy became one of the major drivers of deforestation in the Cerrado biome (i.e., Brazilian savanna) and later in the Amazon rainforest [2,3]. The expansion of soy plantations between the end of the 1990s and the beginning of the 2000s, along with cattle ranching activities, placed Brazil as the world’s top deforester over the past decades [4,5]. Moreover, soy expansion into previously established pastureland in agricultural frontiers is also linked to indirect deforestation by the displacement of grazing activities further into the forest, where land is less expensive [6,7]. Current soy expansion in Brazil is largely driven by the interests of the agribusinesses sector [8,9,10] and mediated by supply chain dynamics, institutional factors, and infrastructure improvements in the Brazilian Amazon [11,12]. Due to Brazil’s comparative advantage in providing feedstock for growing bioeconomies worldwide, soy expansion is likely to continue with detrimental impacts on biodiversity and ecosystem services (ES), especially in Amazonian agricultural frontiers [13].
Conservation strategies like the creation and maintenance of protected areas and indigenous territories, changes in environmental legislation and intensification of monitoring activities, as well as the promotion of sustainable supply-chain commitments, have been linked to the decline in forest loss rates in the Brazilian Amazon between 2004 and 2012 [4,14,15]. Because these reductions occurred under a global scenario of increasing soy and beef prices [16], recent conservation efforts may have temporally decoupled economic growth from environmental degradation in the Amazon biome [17,18]. Nevertheless, rates of deforestation in the region have increased significantly in 2015 (24%) and 2016 (27%) when compared to previous years [19]. These recent increases are reportedly coinciding with the weakening of environmental regulations (i.e., the Brazilian Forest Code) for private lands, where much of the remaining natural vegetation is located [20,21].
National and international attention to forest cover loss in the Amazon region led to a concentration of conservation efforts in the rainforest biome [4], while natural vegetation loss in the highly biodiverse Cerrado biome remained unabated [22]. For instance, a 65% reduction in forest loss was reported for the Amazonian biome between 2008 and 2012, whereas deforestation rates in the Cerrado doubled [21]. Among potential reasons for this discrepancy are the relatively small network of protected areas in the Cerrado (i.e., 8.6% compared 46% in the Amazon [21,23]) and the exclusion of the Cerrado from the Soy Moratorium [14]. The fragile conservation status of the Brazilian Legal Amazon motivated a series of land-use/cover change (LUCC) studies focused on the region, many of which were based on the use of simulation models to forecast deforestation [6,11].
The LUCC literature focused on the Brazilian Amazon and Cerrado includes a range of different methods to simulate future scenarios, e.g., based on econometric analyses, Markov-chain matrices, dynamic systems, cellular automata, and agent-based approaches [24,25,26,27]. A relatively new approach to model LUCC relies on the Maximum Entropy Principle [28,29,30], extensively adopted for the identification of species niches in ecological studies and presence-only models [31,32]. This approach can be used for the identification of forest areas likely to experience conversion to alternative land uses given a set of environmental and socio-economic restrictions (e.g., [33]). Among the advantages of LUCC models based on the Maximum Entropy Principle is their ability to incorporate multiple data types (e.g., continuous and categorical) and establish complex relationships among predictor variables, through the use of machine-learning algorithms [31].
In previous estimates, 10% of unprotected forests in the Amazon were identified as suitable for soy production, and 15.3 Mha of previously cleared areas in the biome could serve that purpose [14]. In contrast, 42.5 Mha (42%) of the land previously deforested in the Cerrado by 2013 were identified as suitable for soybeans, with an additional 11 Mha currently covered by natural vegetation that could be legally cleared [14,34]. These values show a potential for soy expansion that needs further scrutiny. Understanding where soy expansion is more likely to occur, and how the likelihood of occurrence responds to changes in the regional infrastructure, is paramount for policymakers and law enforcers to prevent undesired and irreversible loss of biodiversity and ES, as well as to design more effective conservation policies. In this study, we propose a novel approach for the identification of areas likely to experience soy expansion in the modern agricultural frontiers of the Legal Amazon (i.e., where deforestation is mainly driven by the agribusiness sector) based on the principle of Maximum Entropy. We then simulate how these areas are likely to change in response to infrastructural improvements and their implications for land use/cover and biodiversity.
2. Study Area and Methods
2.1. Study Area
We focused our study on the Legal Amazon region of Brazil. The area lies west of meridian 44° W and includes nine Brazilian states (61% of the national territory). It comprises a mosaic of ecosystems distributed in the Amazon (400 Mha) and the Cerrado (100 Mha) biomes. The Amazon is one of the largest biodiversity hotspots in the world and stores approximately 120 Pg of carbon in its trees alone [35], equivalent to about 10 times the estimated global carbon emissions in 2016 [36]. The Cerrado is also a highly biodiverse biome and a significant storehouse of biomass carbon [37,38]. Both biomes experienced high levels of deforestation in the recent past [13,18].
2.2. The Modern Agricultural Frontier: A Conceptual Framework
We define modern agricultural frontiers as those where LUCC decisions are mainly driven by the agribusiness sector; i.e., regions where resources to invest and modify the agricultural landscape and the regional infrastructure are readily available and linked to global markets. Our conceptual framework is composed of four factors that determine the decision of producers in modern agricultural frontiers to invest in soy plantations (Figure 1): (1) presence of suitable land where soy can be grown and harvested; (2) accessibility to agricultural inputs and markets; (3) availability of land that can be purchased under current land-use regulations; and (4) availability of low-priced land with potential for future appreciation. These conditional factors and their relationship with the expansion of soybeans in modern frontiers are discussed below. Although we acknowledge the role of other actors (e.g., research and extension agencies, academia, and government sectors) in the development of these frontiers, we focus on agribusiness actors as major immediate drivers of modern agricultural frontiers.
2.2.1. Agricultural Suitability
Agricultural crops require a suitable range of biophysical conditions to grow. These conditions include a combination of annual precipitation, temperatures, and soil conditions. Moreover, crops like soybeans are highly mechanized and require relatively flat terrains for cultivation [1]. This set of climatic, edaphic, and geomorphological variables determine the suitability for the crop. Suitability can be expanded through the transfer of technology [39] such as genetically modified seeds that can withstand extreme climatic events (e.g., droughts) and agricultural inputs that can correct and maintain suitable soil properties and control pests and pathogens at accessible rates. New technologies are largely provided by the agribusiness sector, consequently increasing farmers’ willingness to change current land uses.
2.2.2. Accessibility
Infrastructure is another important factor related to farmers’ LUCC decisions, as it affects production costs directly [10,40]. We define infrastructure as roads, railroads, and waterways that can reduce travel costs to national and international markets represented by municipalities and ports, respectively, and soy storage and processing facilities. Expansion of infrastructure increases the reach of markets and greatly reduces transportation costs, thereby promoting the expansion of agricultural frontiers in previously remote, low-priced, and often forested areas [2,12]. Changes in accessibility are often linked to political lobbying. The successful lobbying by Brazil’s agribusiness sector to promote infrastructure development is well-recognized in the literature [41]. The rural caucus in the Congress (i.e., bancada ruralista) is known for influencing political decisions for the benefit of multinational agricultural companies [21,42]. Examples of infrastructural improvements promoted by the bancada ruralista include the construction and maintenance of railways, roads, and dams to create waterways through which barges can then transport export commodities like soybeans [43,44,45,46].
2.2.3. Land Use and Land-Use Regulations
Existing land uses and land-use regulations influence investments in soy production. For instance, purchase of pastureland can be an attractive investment for soy producers, because no forest conversion costs accrue and depending on the year of conversion, the land qualifies under value chain governance initiatives, such as the Soy Moratorium [14,47]. Protected areas and indigenous territories, on the other hand, reportedly curb deforestation rates and limit the expansion of agricultural frontiers [4,48,49]. Settlements may also restrict the expansion of soy, due to high capital and machinery requirements, usually not affordable by small farmers [50]. The effect of property right regimes on frontier expansion, however, generally depends on whether law is effectively enforced on the ground [2,51]. Poor law enforcement and lack of clear property rights are often associated with illegal land occupation and limited access to credit for investments in agriculture [13]. Finally, land-use regulations themselves can be influenced by agribusiness sector interests. The bancada ruralista supported the amnesty to farmers who promoted deforestation in the Amazon before 2008, which was granted with the approval of the 2012 Brazilian Forest Code [20,21]. The same group also proposes changes in the status and sizes of protected areas as an attempt to expand agricultural areas in the country [52].
2.2.4. Land Price Speculation
Agricultural frontier expansion in the Amazon region is not driven by expected returns to agricultural uses alone. Often forests are cleared by actors who speculate on future land price appreciation [47,53,54,55]. Land price dynamics may thus sometimes serve as an indicator for future land use change at agricultural frontiers.
2.3. Identification of Areas Suitable for Soy Expansion
We combined environmental and socio-economic variables linked to the conceptual framework laid out above to identify areas that are prone to experience soy expansion in the Legal Amazon. Our approach is analogous to the Species Distribution Modeling (SDM) framework, widely used to identify ecological niches based on presence-only data and a set of environmental variables [56]. In our case, the SDM is used to identify spatial units with high probability to be replaced by soy. We modeled the area of potential soy expansion with MaxEnt (version 3.3.3, Princeton, NJ, USA), a software that relies on the principle of Maximum Entropy [31,56].
Given the problem of estimating the potential distribution of soy crops in a geographic region where no environmental and socio-economic restrictions are known, the unbiased way of defining the probability of occurrence is to assign a uniform distribution; i.e., all regions have an equal probability of displaying an occurrence (maximum entropy). Under no constraints, soy would have the same probability of occurring on any location in the Legal Amazon. However, information on soy correlated landscape features can be used to constrain the probability of occurrence, while still approximating to a uniform distribution (maximizing entropy or uncertainty) where occurrence is unknown. MaxEnt is able to include interaction terms between predictor variables based on iterative scaling algorithms used to fit multinomial logistic regression classifiers while dealing with spatial autocorrelation [32].
MaxEnt compares a random sample of background pixels from the landscape (i.e., without soy) to pixels where a presence was observed (i.e., with soy), given at a set of environmental constraints [57,58]. The model calculates the relative occurrence rate (ROR), i.e., the probability of a sampled pixel to have soy ‘presence’. RORs are then used to infer the probability of presence of soy in any pixel of the study region. The ROR is predicted for each pixel or location as a function of the environmental variables, as:
where represents locations, is a vector of environmental/socio-economic variables at location , and represents the vector of regression coefficients, computed as . The model is set to maximize entropy by approximating a uniform distribution of soy occurrence in the geographical space under environmental restrictions. The maximum entropy is obtained by modifying the ROR function as:
In a uniform probability distribution, all pixels have the same probability of containing a presence, or , where N is the total number of pixels in the landscape. MaxEnt predicts occurrence on background pixels from the presence pixels as:
where represents an environmental/socio-economic variable or predictor with value . On the left-hand side, is the average value over the prediction, and the right-hand side of the equation has the average value of the in all presence pixels. This equation can be solved with a range of different ROR or distributions. The model most similar to a uniform distribution in geographical space is selected by the maximum entropy principle. MaxEnt retrieves a solution through the gain function, a maximum-likelihood equation restricted by the input variables:
where β represents a regularization coefficient and is the variance of predictor at presence pixels. The first term of Equation (4) represents the sum of predicted values at presence pixels, the second term is the sum of predicted values at background locations, and the third applies an overfitting penalty to the gain function so that observed predictor values are only approximated [57]. Through an iteration process, one is changed at a time and selected whenever it increases gain. The iteration proceeds until maximum gain is obtained [56,59].
The performance of the model is assessed through a modified version of Receiver Operating Characteristic (ROC) analysis for presence-only data [31]. ROC is calculated from presence and background data. In the ROC curve, the false positive rate, which represents background pixels incorrectly classified as presences, is plotted against the true positive rate, or the rate of positive observations classified as positive by the model, for all possible classifying thresholds. The area under the ROC curve (AUC) measures the probability that a randomly drawn presence pixel will have a higher predicted value than a randomly drawn background pixel [32]. Models with AUC ≤0.5 do no better than a random distribution, while models with AUC >0.7 are assumed to have good predictive power [60,61]. Our data sources are reported in Table 1. Data processing was performed with the packages ‘raster’ [62] and ‘maptools’ [63] and the GDAL library [64] available for R (version 3.4.3, Vienna, Austria) [65].
2.3.1. Soy Occurrence
We used the 2014 land-use/cover maps produced by Gibbs et al. [14], based on MODIS imagery, and Rudorff et al. [34], based on Landsat and MODIS imagery, to assess the occurrence of soy in the Brazilian Amazon and Cerrado, respectively. First, we generated random points inside each mapped soy patch from both datasets. We then masked the points inside the Legal Amazon region, obtaining 8735 locations of soy occurrence. A complete set of presence data avoids a sample-bias in MaxEnt [57]. For example, in the ecological field, species observations are usually clustered around roads or access paths, often not capturing the whole spectrum of possible environmental variables combinations. Since we assume that virtually all soy occurrences were mapped in our datasets, we expect our data to be unbiased. The quality of our prediction is then determined by the selection and quality of environmental and socio-economic input variables.
2.3.2. Environmental and Socio-Economic Variables
We classified the model input variables into four categories (Table 1) following our conceptual framework (Figure 1). Bioclimatic variables were obtained as raster datasets from the Worldclim database ([66]; ≈900 m resolution). We converted all environmental and socio-economic variables to this resolution since all other maps could be obtained either in the same or higher resolutions, and masked all variables to the extent of the Legal Amazon (3599 × 2797 grids with 10,066,403 pixels each).
Climatic Variables. The climatic factors required for soy production in Brazil include up to 8 mm day−1 of water depending on the stage of the crop, with a range between 450 and 800 mm of rainfall per cycle. The optimal temperature for soy development lies between 20 and 30 °C, also depending on the stage of the plant [76]. Thus, throughout the cycle different ranges of temperatures and quantities of water are required or tolerated by the species to germinate, grow, and produce seeds. We included all the 19 variables from the Bioclim climatic dataset in our model to identify locations suitable for soy plantations [66]. These data include climatic seasonality, extremes and annual tendencies that are more relevant to the biology of species than just monthly or annual averages.
Edaphic and geomorphic variables. We obtained soil data from EMBRAPA (Brasília, Brazil) [67]. Soy plantations are highly mechanized, requiring relatively large flat areas, or with mild slope [77]. Elevation data from the Shuttle Radar Topography Mission (SRTM) were obtained at 90 m resolution for the Legal Amazon. The data were used to produce a slope map with ‘terrain’ function from the ‘raster’ package in R, based on eight neighboring cells. To ensure the slope of a given pixel represents the slopes on surrounding areas more accurately, and was not an isolated occurrence among the terrain that would be unfit for large-scale soy production, we corrected the slope layer by recalculating the mean slope of the eight surrounding pixels with the cumulative function, available in Insensa-GIS software (version 0.3.9, Eberswalde, Germany) [78].
2014 accessibility variables. We measured accessibility as travel time to cities with more than 50,000 inhabitants, ports and terminals, storage facilities, and soy-crushing facilities. Variables were created based on travel-cost maps to each of the destinations above and a friction surface method [79]. This approach represents a more realistic approach to estimate distances than Euclidean distance-based methods because it considers the available infrastructure and terrain effects [80]. The original nine land-use/cover categories from Landsat-based MapBiomas Collection 1 [72] were reclassified into ‘forest’ (comprised of the original Forest, Planted Forest, Coastal Zone Forest, and Unobserved classes), ‘non-forest’ (Non-Forest Vegetation, Pasture, Agriculture, and Other), and ‘water.’ Travel-cost maps were estimated by considering different land uses/covers and the available transportation infrastructure; e.g., like roads, railways, and waterways.
Future accessibility variables. To simulate the effects of future infrastructure improvements on soy suitability, we produced travel-cost maps based on three hypothetical future scenarios (Table 2). In Scenarios 1 and 2, the status of roads was progressively improved; i.e., unpaved roads become paved, and roads currently under construction or planned to be constructed were assumed to be finalized. Similarly, for the railroads, all currently non-operational categories were assumed to be operational in the future scenarios. A third future scenario (Scenario 3) was created assuming the establishment of new soy storage and crushing facilities to Scenario 2. The location of new storage and crushing facilities was based on the soy expansion probabilities for the Legal Amazon calculated in MaxEnt for Scenario 2. First, we identified the pixels with a probability of experiencing soy expansion within the highest decile of the probability distribution. We then excluded those cells that occurred inside protected areas, indigenous lands, and military areas. Although illegal soy expansion is sometimes observed inside protected areas, we assumed facilities would not be installed inside those areas. The remaining identified pixels were polygonized and one point, representing a soy occurrence, was randomly allocated inside each polygon. These points were used as ‘sources’ to create new travel-cost to soy farms maps for the Brazilian Amazon. We then obtained the probabilities of occurrence of the storage facilities and crushing facilities by running MaxEnt with the land-use data from 2014, and the travel cost maps for cities, ports, soy farms, and either presence of crushing facilities (for the former probability) or presence of storage facilities (for the latter). We then polygonized the pixels with the maximum probability of facility occurrence in each raster obtained. A random point inside each polygon of each layer was then considered a future facility. Based on the new predicted facilities, we created travel-cost maps to future storage and crushing facilities. Scenario 3 was then run on MaxEnt, considering the Scenario 2 infrastructure plus the new storage and soybean processing infrastructure. Other 2014 input variables remained unaltered in the future scenarios.
Land use/cover and land-use regulations variables. Land use/cover data were also obtained from the MapBiomas project [72]. Raster mosaics of land-use/cover tiles from the years 2008 to 2014 were created and aggregated to 900 m resolution (Table 1). All land-use/cover rasters were used individually as input variables in the model. Maps of protected areas and settlements were obtained from CSR-UFMG [81], then rasterized and processed similarly.
Land Price variables. Land price maps at the municipal level available for 2007 and 2012 for forest, cropland, and pasture areas were obtained from FNP Consultoria & Comércio (São Paulo, Brazil) [75]. To account for land price appreciation in the years prior to 2014, we subtracted the maximum price of land corrected for inflation (annual average of the IGP-DI index) in 2007 from that of 2012 in each municipality [82]. The maps with municipal land price appreciation values between 2007 and 2012 for forest, cropland, and pasture areas were then rasterized in a 900 m resolution.
2.3.3. MaxEnt Calibration and Output
MaxEnt was run with cross-validation (the data is split into training and test data) from 10 replicate runs. All runs were based on the default parameter settings (regularization multiplier = 1; maximum number of background points = 10,000; maximum iterations = 500; convergence threshold = 0.00001; default prevalence = 0.5; ‘add samples to background’). The infrastructure improvement scenarios were included in MaxEnt as projections of the 2014 scenario, with changes only in the travel-cost maps. MaxEnt generated a final raster with soy occurrence probabilities based on the averaged pixel-wise probabilities of the 10 runs for each scenario (2014 and Scenarios 1, 2 and 3) [83]. Soy areas in 2014 and urban areas from Instituto Brasileiro de Geografia e Estatística [84] were masked out from the four scenarios. Additionally, we used the Jackknife-based test from MaxEnt on regularized training gain to perform a sensitivity analysis. This involves testing the importance of input variables by removing one at a time and recalculating the model gain [85].
2.4. Impact of Predicted Soy Expansion
The impacts of soy expansion on land use and forests were assessed with the overlay of the simulated scenarios and the land use/cover, land-use regulations, conservation priority areas, and biomass maps. Conservation priority areas were obtained from the Brazilian Ministry of the Environment [86]. Defining conservation priority areas is a government-led strategy to inform the creation of protected areas. Conservation priority areas are not necessarily officially protected areas, and may thus be susceptible to conversion. The areas are classified from high to extremely high biological importance, or ‘insufficiently known, but of possible biological importance.’ These areas include forests but may also include other vegetation types, as well as anthropogenic areas. Another category includes ‘new areas identified by regional groups’ and represents areas with certain conservation priority yet not fully evaluated. The biomass map was retrieved from Soares-Filho et al. [87]. We calculated the area with (1) <100 Mg of biomass ha−1, (2) 100–200 Mg ha−1, and (3) >200 Mg ha−1 where soy expansion probability was considered high. We calculated the median of the expansion probabilities in the simulated map of 2014 where soy was observed to expand in 2017. The map of soy occurrence for 2017 was also provided by H. Gibbs (unpublished data, based on MODIS imagery). Pixels with probabilities above the median value were classified as high-risk areas of experiencing soy expansion in the simulated maps of 2014 and Scenarios 1, 2, and 3. We used the logistic output of MaxEnt, which gives an estimate of the probability of occurrence [83]. To avoid the bias related to the assumptions required to estimate these probabilities (see [88]), we considered their relative values and classified them a-posteriori. Finally, we compared how these high-risk areas changed across all simulated maps.
2.5. Soy Expansion Simulation
To ensure that soy expansion scenarios are consistent with current trends in global commodity demand, we first forecasted 2017 soy production and location for each state of the Brazilian Legal Amazon. The projected expansion of soy planted area was based on a linear extrapolation of the soy planted area in each state from 2006 to 2014. For the purpose of model validation, we allocated the equivalent number of pixels corresponding to the forecasted 2017 soy expansion area to the cells with the highest probability of soy occurrence in the 2014 Scenario for each state separately, independently of their absolute probability values. Finally, we repeated this procedure to forecast soy areas for 2020 (i.e., near future).
2.6. Model Validation
We validated our model based on the comparison between simulated and observed (satellite-based) maps of soy expansion in the Amazon biome during the 2014–2017 period. We adopted three distinct map-comparison metrics to perform the model validation: Figure of Merit; Kappa Simulation; and Fuzzy Kappa Simulation. The first method is based on the calculation of the proportion of the area of agreements between two maps due to the observed soy expansion predicted as expansion (‘hits’) over the sum of ‘hits’ and the area of disagreement; i.e., observed expansion predicted either as another land use (‘misses’) or another land use predicted as soy expansion (‘false alarms’), between satellite-based and simulated maps (see Pontius et al. [89] for details). The Kappa Simulation is based on the popular Kappa statistics from the remote sensing literature but adopts a stochastic model of random allocation of class transitions relative to the initial map (see van Vliet et al. [90] for details). This metric can be further decomposed into KTransition and KTransLoc, which express the quantity and the spatial allocation errors of the model simulation, respectively. Finally, the Fuzzy Kappa Simulation method is focused on fuzzy similarities related to pixels’ moving window-defined neighborhoods, calculated with a distance-decay function (see van Vliet et al. [91] for details). We tested four moving-window sizes for the fuzzy calculations: 2-, 4-, 8-, and 16-pixel radius. Overall, these map-comparison metrics vary from 0 to 1 (often expressed as percentages), where 1 represents a perfect agreement between the simulated and observed maps. The exceptions are the Fuzzy Kappa Simulation and the KTransLoc, that range from −1 to 1, where 0 indicates a level agreement expected by chance. Validation analysis was conducted in R and with the Map Comparison Kit software (version 3.2.3, Maastricht, The Netherlands) [92].
3. Results
3.1. Sensitivity Analysis and Model Validation
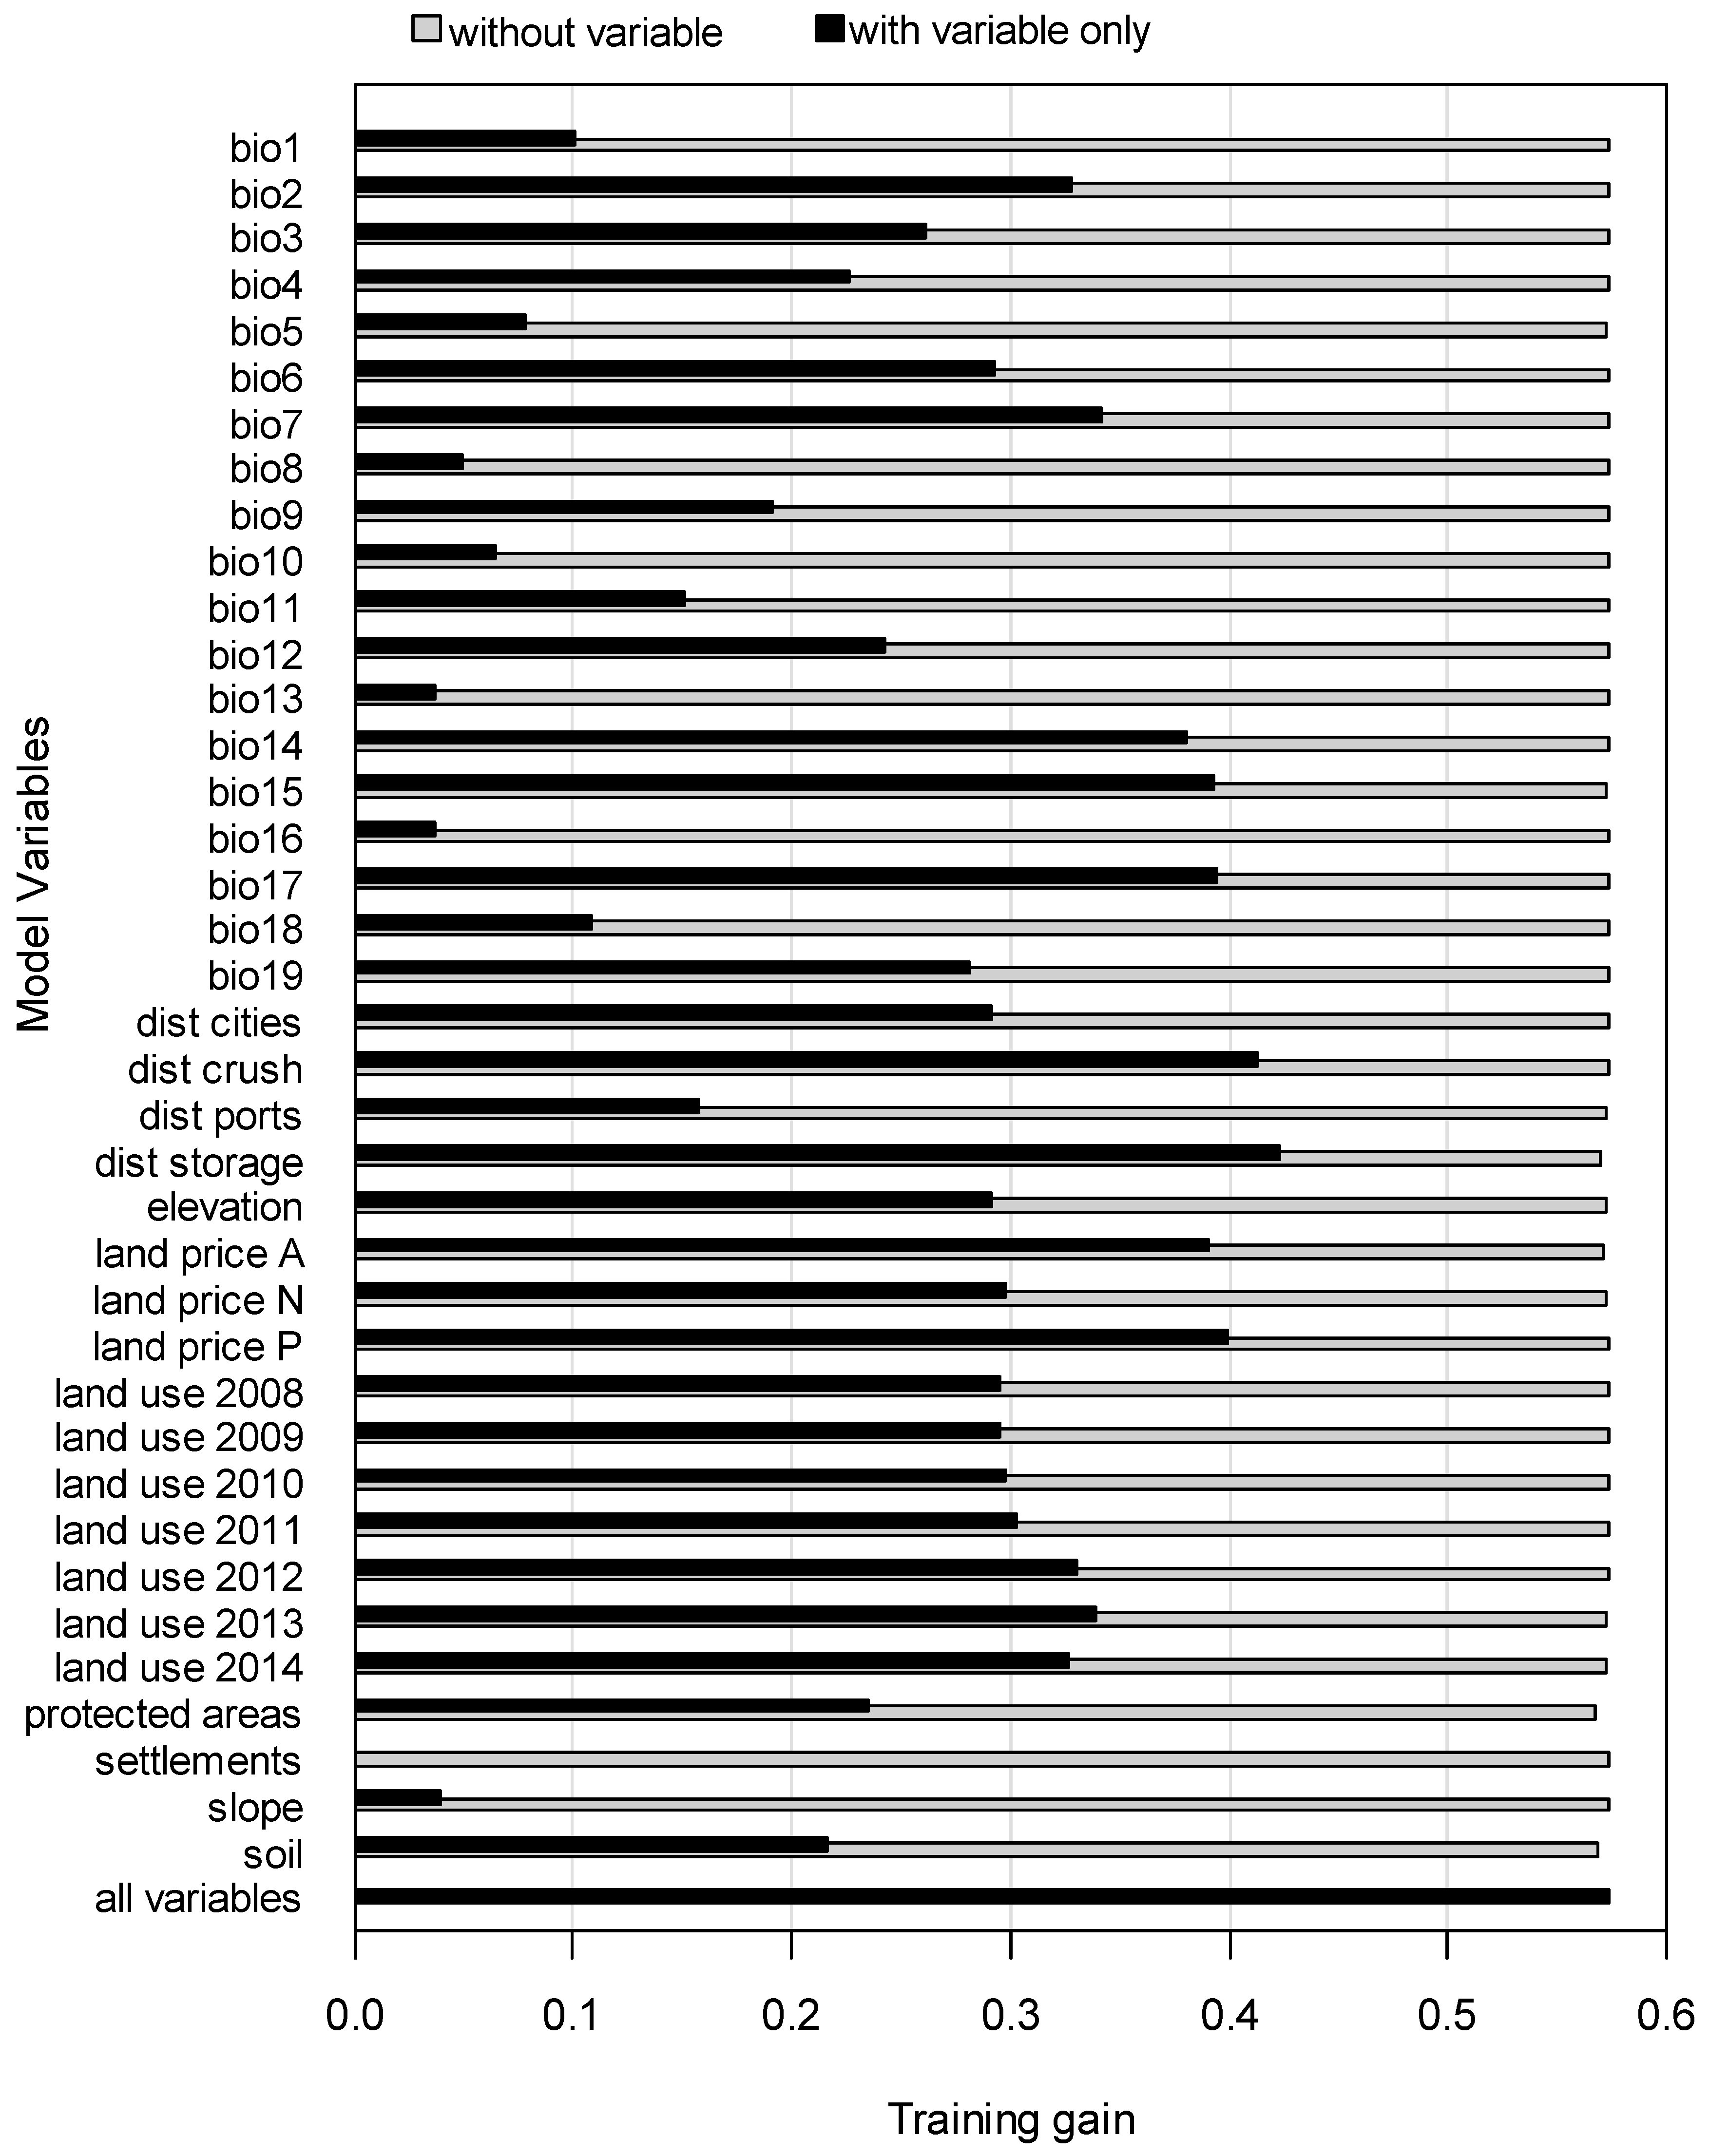
The multiple runs of the model produced a very small variation in the AUC, with a cross-validated test AUC of 0.757 (±0.005). This indicates that different subsets of the training data are very similar and that the model presents an overall good predictive power. The Jackknife test identified Distance to Storage Facilities as the most important predictor variable for the identification of areas suitable to experience future soy expansion (i.e., highest gain), followed closely by Land Price of Pastures and Distance to Crushing Facilities (Figure 2). Among the biophysical variables, the most important predictors were Precipitation in the Driest Quarter (bio17), Precipitation Seasonality (bio15), and Precipitation in the Driest Month (bio14). In contrast, the biophysical variables of less importance were Precipitation in the Wettest Month (bio13), Precipitation in the Wettest Quarter (bio16), and Slope. As expected, the most important land-use/cover variable was the 2013 Land Use map. Based on the results of our sensitivity analysis, none of the variables caused an expressive reduction of gain when removed from the model. Protected Areas and Soil were the variables that decreased model gain the most when not used, which suggests that these variables contain the most unique information for model calibration when compared to the others. Still, such decreases were relatively small. Finally, Settlements did not predict soy expansion any better than a random allocation (gain = 0, AUC = 0.501 when used alone). In 2014, only about 0.3% of the area inside settlements (112,580 ha) were planted with soy.
Our soy forecast for the year 2017 yielded a total of 4.4 Mha of new soy areas in the Legal Amazon, based on the infrastructure levels of the 2014 scenario (Figure 3). The largest area of forecasted soy expansion was in the states of Mato Grosso (2.3 Mha), followed by Tocantins (0.8 Mha), and Maranhão (0.7 Mha). Validation scores were favorable (see Section 4.). The Figure of Merit of our simulation was of 13.8%. The Kappa Simulation index was 23.9%, with associated KTransition of 82.7% and KTransLoc of 28.8%. Finally, the Fuzzy Kappa Simulation analysis based on moving windows of 2-, 4-, 8-, 16-pixel radius returned values of 34.1%–35%.
3.2. Simulated Changes in Soy Expansion Probabilities across Scenarios
The median of the soy expansion probabilities in the 2014 map where conversion was observed in 2017 was of 0.496. Probabilities above this value were used for the identification of high-risk areas. The highest soy expansion probability calculated by MaxEnt was 0.65 in the 2014 map and future Scenarios 1 and 2 and 0.66 in Scenario 3. The overall average increases in the soy expansion probabilities were 7.9%, 16% and 39.9% in future Scenarios 1, 2, and 3, respectively, when compared to the 2014 map. These changes happened mainly in the states of Pará and Mato Grosso (Figure 4). The average high probabilities in Scenarios 1, 2, and 3 were 0.2%, 1.3%, and 1.5% higher than in the 2014 scenario.
There were 2.3 Mha of planted soy in the Legal Amazon in 2014. The total area with high risk of soy expansion in 2014 was estimated at 14.7 Mha (Table 3) distributed in the South and Eastern parts of the region, in the states of Rondônia, Mato Grosso, Pará, Tocantins, and Maranhão; i.e., along the ‘arc of deforestation’ region (Figure 3). Future Scenarios 1, 2 and 3 presented an increase of 0.4 Mha (2.5%), 1.9 Mha (13%) and 2.1 Mha (14.6%) in high-risk areas with the simulated infrastructure improvements, respectively. These increases occurred mainly in Mato Grosso (0.2, 1.48 and 1.53 Mha under Scenarios 1, 2 and 3, respectively), followed by Tocantins (0.08, 0.3 and 0.32 Mha, respectively), and Pará states (0.03, 0.04 and 0.1 Mha, respectively).
Protected areas and settlements. All the areas with high risk of experiencing soy expansion were located outside publicly protected areas (Table 3). Future infrastructure improvement scenarios predicted no areas with high risk of soy expansion in any of the protected areas. About 1.15 Mha with a high probability of soy expansion were located inside settlements in 2014. This number increased 1.5%, 11.6% and 12.6% under Scenarios 1, 2, and 3, respectively.
Land use. Most areas under high risk of soy conversion were pasture in 2014. About 440,000 ha of forests were estimated to be under high risk of soybean expansion in 2014 (Table 3). Development of infrastructure increased the area of forests under high-risk by 9.6% (42,064 ha), 38.6% (169,840 ha) and 51.4% (226,336 ha) in Scenarios 1, 2, and 3, respectively. In contrast, about 9.18 Mha of pastures were estimated to be in areas with high-risk of soy expansion. In Scenarios 1, 2 and 3, these pasture areas increased by 1.8%, 11%, and 11.4%, respectively. Agricultural land under high risk of soy expansion was approximately 1.8 Mha in Legal Amazonia in 2014. This area increased by 1.1%, 4.1% and 4.6% the future Scenarios 1, 2, and 3, respectively.
Conservation priority. Extremely-high conservation priority regions in the Legal Amazon presented 3.29 Mha under high-risk of soy expansion (Table 3). Infrastructure development simulated in Scenarios 1, 2, and 3 could increase these high-risk areas by 3.9%, 23.8%, and 24.3%, respectively. Another 100,000 ha with high- to very-high conservation priority were also under high-risk of soy expansion in 2014 and increased by 5.6%–32.8% in the future scenarios.
Biomass stocks. Approximately 45% (6.6 Mha) of the area with a high probability of experiencing soy expansion have aboveground biomass stocks >200 Mg ha−1. This area increased with the improvement of infrastructure in 2.6% (173,556 ha; scenario 1), 13.5% (894,518 ha; Scenario 2), and 15.7% (1.03 Mha; scenario 3). These estimates suggest that at least 4.8 Pg of CO2 could be released into the atmosphere if the forest biomass in high-risk areas were lost [93].
4. Discussion
Validation assessments of our model revealed relatively good levels of agreement between the simulated and observed maps of soy expansion between 2014 and 2017 in the Amazon biome. The Figure of Merit of our simulation (13.8%) is similar to median values reported by other studies in the literature (e.g., 17% in Fuller et al. [94]; 7% in Kim [95]; 14% in Malek et al. [96]; 20% in Vieilledent et al. [97] and 21% in Pontius et al. [89]). The same similarity was observed for the Kappa Simulation index of our model (23.9%) and of others (e.g., 23% in Malek et al. [96]; 12%–42% in Ke et al. [98] and 15%–52% in Ke et al. [99]). Finally, results from the Fuzzy Kappa Simulation analysis (34.1%–35% for moving windows of 2-, 4-, 8-, 16-pixel radius) were also in conformance with the results reported by Altartouri et al. [100] (3%–30% for 3 × 3- to 9 × 9-pixel moving windows). Moreover, the KTransition (82.7%) and KTransLoc (28.8%) components of the Kappa Simulation indicate that our model better predicts the area of soy expansion than its allocation [90]. KTransition values are generally higher than those for KTransLoc [90,99], especially when only two LUCC are considered (e.g., forest and non-forest). However, a KTransLoc value significantly higher than zero indicates our model LUCC allocation to be substantially better than a random allocation [90]. As described in Liu et al. [101], the levels of ‘hits’ (0.1%), ‘misses’ (0.5%) and ‘false alarms’ (0.3%) that compose the Figure of Merit of our model, also allow to compare the changes forecasted by our model (i.e., the sum of ‘hits’ and ‘false alarms’ (0.4%)) to the observed changes in the landscape (i.e., the sum of ‘hits’ and ‘misses’ (0.6%)) and reinforce our interpretation of the KTransition and KTransLoc metrics. Overall, validation results suggest that our MaxEnt model represents a suitable tool for the identification of areas more likely to experience soy conversion in the Legal Amazon.
MaxEnt requires presence-only data and information from one point in time to estimate LUCC probabilities. As pointed out by Aguilar-Amuchastegui et al. [33], MaxEnt is straightforward to use, free, well tested in a variety of applications, and versatile. Still, while the maximum entropy approach can be used for the identification of areas suitable to experience LUCC, as an SDM, MaxEnt lacks the additional computation step commonly found in standard LUCC models to forecast quantities of change through time (e.g., deforestation rates). We computed the area of soy expansion in the R software based on a linear extrapolation of historical trends and allocated the MaxEnt output accordingly. While this procedure performed relatively well in validation tests it could be refined by using more sophisticated forecasting methods [24,25,26,27].
Our simulations suggested 14.7 Mha of land to be under high-risk of soy expansion in the Legal Amazon in the 2014 scenario. This number is ten times more conservative than the 140 Mha of land with high-yield potential for soy production in the Legal Amazon estimated by Vera-Diaz et al. [102]. This is likely because we used recent data on soy occurrence and a wider and more comprehensive set of biophysical and socio-economic variables in higher resolution. As expected, our model indicated most of the areas under high-risk of expansion to be within the ‘arc of deforestation’ region, an agricultural frontier that extends from the Southeastern to the Eastern parts of the Legal Amazon [51]. These areas are suitable for soy production because of higher precipitation seasonality and lower quantities of rainfall in the driest quarter of the year and represent the transition between the Amazonian and Cerrado biomes [103]. In contrast to other climatic and biophysical information used as input variables in our model, Slope did not contribute much to the prediction of soy expansion. This result can be an artifact of the resolution of our prediction maps, given that other studies have identified slope as a major constraint to mechanization in agriculture in the Brazilian Amazon [77,104].
Still, the large quantity of land deemed suitable for soy expansion by our study raises concerns about conservation in the Legal Amazon. Even though recent zero-deforestation supply-chain commitments, such as the Soy Moratorium [14], and public actions such as the creation of protected areas, have reportedly been effective at curbing forest loss [18], these interventions may not be sufficient to protect forests in such vast territory with chronically deficient property right regimes [14,105,106]. Unprotected vegetation outside private properties is threatened by land grabbers and its conservation hinges on command-and-control interventions assisted by satellite-based monitoring [107,108]. Furthermore, conservation of natural vegetation in Legal Reserves and Permanently Protected Areas, defined by the Brazilian Forest Code as ‘protected areas’, remains limited particularly on smallholdings [109].
In line with previous work [11,110,111], we find that distance to soy-storing and processing facilities plays a key role in the spatial location of soy expansion. The willingness of soy producers to trade biophysical suitability for better access to infrastructure should be explored in future work. Moreover, the relatively high importance of Past Pastureland Prices in our simulations is consistent with previously reported trends of pasture to soy conversion. While the expansion of soy into pasture land is not directly associated with deforestation [112], it can provoke the establishment of new pastures in more remote forest areas; i.e., indirect LUCC [7]. Other common crops in the Brazilian Amazon include beans, cassava, coffee, maize, and rice, some of which may eventually be replaced by soy. The state of Mato Grosso, for example, experienced a reduction of 7% in planted rice area between 2015 and 2016, partly due to soy [113]. Replacement of staple crops by soy and other commodity crops has given rise to concerns about smallholder food security [8,114,115]. Although soybean plantations require high capital investments, smaller farmers are sometimes able to acquire enough capital and assistance to produce soy inside settlements [50]. In fact, the Brazilian Biodiesel Program aims to provide technology and rural credit for the promotion of oil crops in small farm households [115]. As a result, soybean crops could become popular in settlement areas in the near future, even though this variable exhibited little predictive power in this study.
As expected, high-risk areas increased within the different land-use/cover categories as a result of infrastructure improvements. The perception that infrastructure improvement can lead to increased deforestation pressures in agricultural frontiers is well-acknowledged in the conservation literature [11,44,51]. Paving of roads and highways improves accessibility and attracts land-grabbers and other actors associated with forest degradation and deforestation [40,51]. Our simulations suggest that infrastructure development in Legal Amazonia could increase the area under high-risk of soy conversion by 2.4%–14.6%. Although pastures boast the largest absolute area with high-risk of conversion to soy without any infrastructure changes, forests are simulated to experience the largest proportional change in high-risk area if any of the future infrastructure scenarios materialize. Finally, our simulations suggest that soy expansion threatens extremely biodiverse locations and valuable ES, such as lands with high biomass stocks (>200 Mg ha−1), even without further infrastructure developments. If conversion occurs in these areas, at least 4.8 Pg of CO2 could be released into the atmosphere, a value that represents 10 times the total CO2 emissions of Brazil in 2014 [116].
Morton et al. [117] reported the cropland expansion observed in Mato Grosso from 2001 to 2012 to be generally located in areas with low-to-moderate agricultural suitability. At the same time, highly suitable areas for agriculture experienced no expansion of crops. In contrast, half of the 237,800 ha of soy expansion observed between 2014 and 2017 took place in the high-suitability areas identified by our model. The previous authors reported topography and soil conditions to be more important than infrastructure and climatic variables for the determination of crop suitability in Mato Grosso. However, our simulations suggested the opposite for the whole Legal Amazon, perhaps because infrastructure variables are explicitly considered here. While the soy expansion dynamics in the state of Mato Grosso may differ from those of the broader Amazonian region, these differences highlight that variable associations identified by machine-learning algorithms, must be interpreted with caution and reference to potential measurement issues.
5. Conclusions
We presented a novel application of the MaxEnt approach by mapping the risk of soy expansion in the Brazilian Legal Amazon. We assessed how new infrastructure developments could affect these risks in the near future and their possible impacts on land use/cover and biodiversity conservation. Our modeling framework is transferable to other settings and allows for a comprehensive understanding of agricultural expansion in modern deforestation frontiers by accounting for accessibility, economic, and land-use regulations.
We find that MaxEnt is a suitable tool for the identification of areas with propensity to be converted to soy plantations in our study region. Infrastructure development could increase the 14.6 Mha of land under high-risk of soy expansion in 2014 by another 0.3–2.1 Mha. This expansion could threaten 100,000 ha of areas with high- to very-high conservation priority, and 3.29 Mha of areas with extremely high conservation priority. Furthermore, at least ten times the total CO2 emissions of Brazil in 2014 could be released if these areas are converted to soy. Environmental and agricultural policy planners, as well as value chain governance initiatives, may benefit from improved tools to predict future land use change. Future work should thus explore how machine learning in combination with data in high spatial and temporal resolution can contribute to make the production of internationally traded commodities more sustainable.
Author Contributions
J.B., G.P.F., and T.H. conceptualized the manuscript; G.P.F. and T.A.P.W. did the formal analysis and wrote the paper; all authors contributed to review the manuscript; L.R. and H.K.G. contributed to language proof.
Funding
This work was supported by the CIFOR/ZEF project Forests in the Global Bioeconomy: Developing Multi-Scale Policy Scenarios, by the German Federal Ministry for Economic Cooperation and Development (Grant: 81180343); the Robert Bosch Foundation (Grant: 32.5.8043.0012.0); and The German Federal Ministry for Education and Research (Grant: 031B0019).
Acknowledgments
We thank G. Sparovek and L. Biber-Freudenberger for the comments and insights during the initial steps of our work. We are grateful for data and comments from B. Soares-Filho, R. Flach, J. Schielein and J.M. Arana.
Conflicts of Interest
The authors declare no conflicts of interest.
References
- Bickel, U.; Dros, J.M. The Impacts of Soybean Cultivation on Brazilian Ecosystems. Available online: http://assets.panda.org/downloads/impactsofsoybean.pdf (accessed on 9 February 2017).
- Nepstad, D.C.; Stickler, C.M.; Almeida, O.T. Globalization of the Amazon soy and beef industries: Opportunities for conservation. Conserv. Biol. 2006, 20, 1595–1603. [Google Scholar] [CrossRef] [PubMed]
- Weinhold, D.; Killick, E.; Reis, E.J. Soybeans, poverty and inequality in the Brazilian Amazon. World Dev. 2013, 52, 132–143. [Google Scholar] [CrossRef] [Green Version]
- Boucher, D.; Roquemore, S.; Fitzhugh, E. Brazil’s success in reducing deforestation. Trop. Conserv. Sci. 2013, 6, 426–445. [Google Scholar] [CrossRef]
- Nepstad, D.; Soares-Filho, B.S.; Merry, F.; Lima, A.; Moutinho, P.; Carter, J.; Bowman, M.; Cattaneo, A.; Rodrigues, H.; Schwartzman, S.; et al. The end of deforestation in the Brazilian Amazon. Science 2009, 326, 1350–1351. [Google Scholar] [CrossRef] [PubMed]
- Morton, D.C.; DeFries, R.S.; Shimabukuro, Y.E.; Anderson, L.O.; Arai, E.; del Bon Espirito-Santo, F.; Freitas, R.; Morisette, J. Cropland expansion changes deforestation dynamics in the southern Brazilian Amazon. Proc. Natl. Acad. Sci. USA 2006, 103, 14637–14641. [Google Scholar] [CrossRef] [PubMed]
- Arima, E.Y.; Richards, P.; Walker, R.; Caldas, M.M. Statistical confirmation of indirect land use change in the Brazilian Amazon. Environ. Res. Lett. 2011, 6, 024010. [Google Scholar] [CrossRef] [Green Version]
- Naylor, R.L.; Liska, A.J.; Burke, M.B.; Falcon, W.P.; Gaskell, J.C.; Rozelle, S.D.; Cassman, K.G. The ripple effect: Biofuels, food security, and the Environment. Environ. Sci. Policy Sustain. Dev. 2007, 49, 30–43. [Google Scholar] [CrossRef]
- Gasparri, N.I.; le Polain de Waroux, Y. The coupling of South American soybean and cattle production frontiers: New challenges for conservation policy and land change science. Conserv. Lett. 2015, 8, 290–298. [Google Scholar] [CrossRef] [Green Version]
- de Waroux, Y.P.; Garrett, R.D.; Heilmayr, R.; Lambin, E.F. Land-use policies and corporate investments in agriculture in the Gran Chaco and Chiquitano. Proc. Natl. Acad. Sci. USA 2016, 113, 4021–4026. [Google Scholar] [CrossRef] [PubMed]
- Vera-Diaz, M.C.; Kaufmann, R.K.; Nepstad, D.C. The Environmental Impacts of Soybean Expansion and Infrastructure Development in Brazil’s Amazon Basin; Working Paper; Global Development and Environment Institute, Tufts University: Medford, MA, USA, 2009. [Google Scholar]
- Garrett, R.D.; Lambin, E.F.; Naylor, R.L. Land institutions and supply chain configurations as determinants of soybean planted area and yields in Brazil. Land Use Policy 2013, 31, 385–396. [Google Scholar] [CrossRef]
- Lima, M.; Skutsch, M.; de Medeiros Costa, G. Deforestation and the social impacts of soy for biodiesel: Perspectives of farmers in the South Brazilian Amazon. Ecol. Soc. 2011, 16, art4. [Google Scholar] [CrossRef]
- Gibbs, H.K.; Rausch, L.; Munger, J.; Schelly, I.; Morton, D.C.; Noojipady, P.; Soares-Filho, B.; Barreto, P.; Micol, L.; Walker, N.F. Brazil’s Soy Moratorium. Science 2015, 347, 377–378. [Google Scholar] [CrossRef] [PubMed]
- Gibbs, H.K.; Munger, J.; L’Roe, J.; Barreto, P.; Pereira, R.; Christie, M.; Amaral, T.; Walker, N.F. Did ranchers and slaughterhouses respond to zero-deforestation agreements in the Brazilian Amazon? Conserv. Lett. 2016, 9, 32–42. [Google Scholar] [CrossRef]
- Barretto, A.G.O.P.; Berndes, G.; Sparovek, G.; Wirsenius, S. Agricultural intensification in Brazil and its effects on land-use patterns: An analysis of the 1975–2006 period. Glob. Chang. Biol. 2013, 19, 1804–1815. [Google Scholar] [CrossRef] [PubMed]
- Ferreira, J.; Aragao, L.E.O.C.; Barlow, J.; Barreto, P.; Berenguer, E.; Bustamante, M.; Gardner, T.A.; Lees, A.C.; Lima, A.; Louzada, J.; et al. Brazil’s environmental leadership at risk. Science 2014, 346, 706–707. [Google Scholar] [CrossRef] [PubMed]
- Nepstad, D.; McGrath, D.; Stickler, C.; Alencar, A.; Azevedo, A.; Swette, B.; Bezerra, T.; DiGiano, M.; Shimada, J.; da Motta, R.S.; et al. Slowing Amazon deforestation through public policy and interventions in beef and soy supply chains. Science 2014, 344, 1118–1123. [Google Scholar] [CrossRef] [PubMed]
- Instituto Nacional de Pesquisas Espaciais (INPE) Projeto PRODES. Montitoramento Da Floresta Amazônica Por Satélite. Available online: http://www.obt.inpe.br/prodes/index.php (accessed on 26 June 2018).
- Sparovek, G.; Barretto, A.G.O.P.; Matsumoto, M.; Berndes, G. Effects of governance on availability of land for agriculture and conservation in Brazil. Environ. Sci. Technol. 2015, 49, 10285–10293. [Google Scholar] [CrossRef] [PubMed]
- Soares-Filho, B.; Rajao, R.; Macedo, M.; Carneiro, A.; Costa, W.; Coe, M.; Rodrigues, H.; Alencar, A. Cracking Brazil’s forest code. Science 2014, 344, 363–364. [Google Scholar] [CrossRef] [PubMed]
- Hecht, S.B. Soybeans, development and conservation on the Amazon frontier. Dev. Chang. 2005, 36, 375–404. [Google Scholar] [CrossRef]
- Françoso, R.D.; Brandão, R.; Nogueira, C.C.; Salmona, Y.B.; Machado, R.B.; Colli, G.R. Habitat loss and the effectiveness of protected areas in the Cerrado Biodiversity Hotspot. Nat. Conserv. 2015, 13, 35–40. [Google Scholar] [CrossRef]
- Soares-Filho, B.S.; Coutinho Cerqueira, G.; Lopes Pennachin, C. Dinamica—A stochastic cellular automata model designed to simulate the landscape dynamics in an Amazonian colonization frontier. Ecol. Model. 2002, 154, 217–235. [Google Scholar] [CrossRef]
- Vitel, C.S.M.N.; Carrero, G.C.; Cenamo, M.C.; Leroy, M.; Graça, P.M.L.A.; Fearnside, P.M. Land-use change modeling in a Brazilian indigenous reserve: Construction of a reference scenario for the Suruí REDD Project. Hum. Ecol. 2013, 41, 807–826. [Google Scholar] [CrossRef]
- West, T.A.P.; Grogan, K.A.; Swisher, M.E.; Caviglia-Harris, J.L.; Sills, E.; Harris, D.; Roberts, D.; Putz, F.E. A hybrid optimization-agent-based model of REDD+ payments to households on an old deforestation frontier in the Brazilian Amazon. Environ. Model. Softw. 2018, 100, 159–174. [Google Scholar] [CrossRef]
- Kaimowitz, D.; Angelsen, A. Economic Models of Tropical Deforestation: A Review; Center for International Forestry Research (CIFOR): Bogor, Indonesia, 1998; Volume 14, ISBN 979876417X. [Google Scholar]
- de Souza, R.A.; De Marco, P., Jr. The use of species distribution models to predict the spatial distribution of deforestation in the western Brazilian Amazon. Ecol. Model. 2014, 291, 250–259. [Google Scholar] [CrossRef]
- Amici, V.; Marcantonio, M.; La Porta, N.; Rocchini, D. A multi-temporal approach in MaxEnt modelling: A new frontier for land use/land cover change detection. Ecol. Inform. 2017, 40, 40–49. [Google Scholar] [CrossRef]
- Bonilla-Bedoya, S.; Estrella-Bastidas, A.; Molina, J.R.; Herrera, M.Á. Socioecological system and potential deforestation in Western Amazon forest landscapes. Sci. Total Environ. 2018, 644, 1044–1055. [Google Scholar] [CrossRef]
- Phillips, S.J.; Anderson, R.P.; Schapire, R.E. Maximum entropy modeling of species geographic distributions. Ecol. Model. 2006, 190, 231–259. [Google Scholar] [CrossRef]
- Elith, J.; Graham, C.H.; Anderson, R.P.; Dudík, M.; Ferrier, S.; Guisan, A.; Hijmans, R.J.; Huettmann, F.; Leathwick, J.R.; Lehmann, A.; et al. Novel methods improve prediction of species’ distributions from occurrence data. Ecography 2006, 29, 129–151. [Google Scholar] [CrossRef] [Green Version]
- Aguilar-Amuchastegui, N.; Riveros, J.C.; Forrest, J.L. Identifying areas of deforestation risk for REDD+ using a species modeling tool. Carbon Balance Manag. 2014, 9, 10. [Google Scholar] [CrossRef] [PubMed]
- Rudorff, B.; Risso, J.; Aguiar, D.; Gonçalves, F.; Salgado, M.; Perrut, J.; Oliveira, L.; Virtusos, M.; Montibeller, B.; Baldi, C.; et al. Análise Geoespacial da Dinâmica das Culturas Anuais no Bioma Cerrado: 2000 a 2014; Agrosatélite Geotecnologia Aplicada Ltda.: Florianópolis, Brasil, 2015; pp. 8–10. [Google Scholar]
- Soares-filho, B.S.; Nepstad, D.C.; Curran, L.M.; Cerqueira, G.C.; Garcia, R.A.; Ramos, C.A.; Voll, E.; McDonald, A.; Lefebvre, P.; Schlesinger, P. Modelling conservation in the Amazon basin. Nature 2006, 440, 520–523. [Google Scholar] [CrossRef] [PubMed]
- Le Quéré, C.; Andrew, R.M.; Friedlingstein, P.; Sitch, S.; Pongratz, J.; Manning, A.C.; Korsbakken, J.I.; Peters, G.P.; Canadell, J.G.; Jackson, R.B.; et al. Global Carbon Budget 2017. Earth Syst. Sci. Data 2018, 10, 405–448. [Google Scholar] [CrossRef] [Green Version]
- Ratter, J.A.; Ribeiro, J.F.; Bridgewater, S. The Brazilian Cerrado vegetation and threats to its biodiversity. Ann. Bot. 1997, 80, 223–230. [Google Scholar] [CrossRef]
- Boucher, D.; Elias, P.; Lininger, K.; May-Tobin, C.; Roquemore, S.; Saxon, E. The Root of the Problem: What’s Driving Tropical Deforestation Today? Boucher, D., Elias, P., Lininger, K., May-Tobin, C., Roquemore, S., Saxon, E., Eds.; Union of Concerned Scientists: Cambridge, MA, USA, 2011. [Google Scholar]
- Zak, M.R.; Cabido, M.; Cáceres, D.; Díaz, S. What drives accelerated land cover change in central Argentina? Synergistic consequences of climatic, socioeconomic, and technological factors. Environ. Manag. 2008, 42, 181–189. [Google Scholar] [CrossRef] [PubMed]
- Soares-Filho, B.; Alencar, A.; Nepstad, D.; Cerqueira, G.; del Carmen Vera Diazc, M.; Rivero, S.; Solorzano, L.; Voll, E. Simulating the response of land-cover changes to road paving and governance along a major Amazon highway: The Santarem-Cuiaba corridor. Glob. Chang. Biol. 2004, 10, 745–764. [Google Scholar] [CrossRef]
- Toledo, M. Os processos de modernização agrícola na região amazônica: Transformações recentes na dinâmica produtiva do município de Santarém (Pará). Geosul 2011, 26, 77–97. [Google Scholar] [CrossRef]
- Brandão, F.; Schoneveld, G. The State of Oil Palm Development in the Brazilian Amazon: Trends, Value Chain Dynamics, and Business Models; Center for International Forestry Research (CIFOR): Bogor, Indonesia, 2015. [Google Scholar]
- Jepson, W.E. Producing a modern agricultural frontier: Firms and cooperatives in eastern Mato Grosso, Brazil. Econ. Geogr. 2006, 82, 289–316. [Google Scholar] [CrossRef]
- Fearnside, P.M. Avança Brasil: Environmental and social consequences of Brazil’s planned infrastructure in Amazonia. Environ. Manag. 2002, 30, 735–747. [Google Scholar] [CrossRef] [PubMed]
- Fearnside, P.M. Amazon dams and waterways: Brazil’s Tapajós Basin plans. AMBIO 2015, 44, 426–439. [Google Scholar] [CrossRef] [PubMed] [Green Version]
- Millikan, B. The Amazon: Dirty dams, dirty politics and the myth of clean energy. Tipití J. Soc. Anthropol. Lowl. South Am. 2014, 12, 134–138. [Google Scholar]
- Le Tourneau, F.-M. Is Brazil now in control of deforestation in the Amazon? Cybergeo 2016, 769. [Google Scholar] [CrossRef]
- Pfaff, A.; Robalino, J.; Herrera, D.; Sandoval, C. Protected areas’ impacts on Brazilian Amazon deforestation: Examining conservation—Development interactions to inform planning. PLoS ONE 2015, 10, e0129460. [Google Scholar] [CrossRef] [PubMed]
- Ferraro, P.J.; Hanauer, M.M.; Miteva, D.A.; Nelson, J.L.; Pattanayak, S.K.; Nolte, C.; Sims, K.R.E. Estimating the impacts of conservation on ecosystem services and poverty by integrating modeling and evaluation. Proc. Natl. Acad. Sci. USA 2015, 112, 7420–7425. [Google Scholar] [CrossRef] [PubMed] [Green Version]
- Wilkinson, J.; Herrera, S. Biofuels in Brazil: Debates and impacts. J. Peasant Stud. 2010, 37, 749–768. [Google Scholar] [CrossRef]
- Fearnside, P.M. Brazil’s Cuiabá-Santarém (BR-163) Highway: The environmental cost of paving a soybean corridor through the Amazon. Environ. Manag. 2007, 39, 601–614. [Google Scholar] [CrossRef] [PubMed]
- Martins, H.; Araújo, E.; Vedoveto, M.; Monteiro, D.; Barreto, P. Desmatamento em Áreas Protegidas Reduzidas na Amazônia; IMAZON: Belém, Brazil, 2014. [Google Scholar]
- Bowman, M.S.; Soares-Filho, B.S.; Merry, F.D.; Nepstad, D.C.; Rodrigues, H.; Almeida, O.T. Persistence of cattle ranching in the Brazilian Amazon: A spatial analysis of the rationale for beef production. Land Use Policy 2012, 29, 558–568. [Google Scholar] [CrossRef]
- Pacheco, P. Actor and frontier types in the Brazilian Amazon: Assessing interactions and outcomes associated with frontier expansion. Geoforum 2012, 43, 864–874. [Google Scholar] [CrossRef]
- Richards, P.D.; Walker, R.T.; Arima, E.Y. Spatially complex land change: The indirect effect of Brazil’s agricultural sector on land use in Amazonia. Glob. Environ. Chang. 2014, 29, 1–9. [Google Scholar] [CrossRef] [PubMed]
- Phillips, S.J.; Dudík, M.; Schapire, R.E. A maximum entropy approach to species distribution modeling. In Twenty-First International Conference on Machine Learning—ICML ’04; ACM Press: New York, NY, USA, 2004; Volume 69, p. 83. [Google Scholar]
- Merow, C.; Smith, M.J.; Silander, J.A. A practical guide to MaxEnt for modeling species’ distributions: What it does, and why inputs and settings matter. Ecography 2013, 36, 1058–1069. [Google Scholar] [CrossRef]
- Elith, J.; Phillips, S.J.; Hastie, T.; Dudík, M.; Chee, Y.E.; Yates, C.J. A statistical explanation of MaxEnt for ecologists. Divers. Distrib. 2011, 17, 43–57. [Google Scholar] [CrossRef]
- Dudík, M.; Phillips, S.J.; Schapire, R.E. Performance Guarantees for Regularized Maximum Entropy Density Estimation. In Proceedings of the 17th Annual Conference on Computational Learning Theory, Banff, AB, Canada, 1–4 July 2004; pp. 472–486. [Google Scholar]
- Swets, J. Measuring the accuracy of diagnostic systems. Science 1988, 240, 1285–1293. [Google Scholar] [CrossRef] [PubMed]
- Phillips, S.J.; Anderson, R.P.; Dudík, M.; Schapire, R.E.; Blair, M.E. Opening the black box: An open-source release of Maxent. Ecography 2017, 40, 887–893. [Google Scholar] [CrossRef]
- Hijmans, R.J. Raster: Geographic Data Analysis and Modeling. 2017. Available online: https://CRAN.R-project.org/package=raster (accessed on 23 January 2017).
- Bivand, R.; Lewin-Koh, N. Maptools: Tools for Reading and Handling Spatial Objects. 2017. Available online: https://CRAN.R-project.org/package=maptools (accessed on 23 January 2017).
- GDAL Development Team. GDAL—Geospatial Data Abstraction Library. 2016. Available online: http://gdal.osgeo.org (accessed on 23 January 2017).
- R Core Team. R: A Language and Environment for Statistical Computing. 2017. Available online: https://www.r-project.org/ (accessed on 30 November 2017).
- WorldClim. Global Climate Data: Free Climate Data for Ecological Modeling and GIS. Available online: http://www.worldclim.org/bioclim (accessed on 24 January 2017).
- IBGE/EMBRAPA. Mapa de Solos do Brasil (1:5,000,000). Available online: http://mapas.ibge.gov.br (accessed on 3 November 2016).
- EMBRAPA. Brasil em Relevo. Available online: http://www.relevobr.cnpm.embrapa.br (accessed on 19 September 2017).
- IBGE. Atlas Nacional Digital do Brasil. 2010. Available online: http://www.ibge.gov.br/apps/atlas_nacional/ (accessed on 15 January 2017).
- Ministério dos Transportes, Portos e Aviação Civil. Base de Dados Georreferenciados PNLT 2010. Available online: http://www.transportes.gov.br/conteudo/2822-base-de-dados-georreferenciados-pnlt-2010.html (accessed on 5 February 2017).
- Departamento Nacional de Infraestrutura de Transportes (DNIT). VGeo—Visualizador de Informações Geográficas. Available online: http://servicos.dnit.gov.br/vgeo/ (accessed on 4 April 2017).
- MapBiomas Project. Collection 1 of Brazilian Land Cover & Use Map Series. Available online: http://mapbiomas.org/pages/database/mapbiomas_collection# (accessed on 13 January 2017).
- INCRA. Assentamentos Rurais (Base Digital Georreferenciada). Available online: http://acervofundiario.incra.gov.br/i3geo/ogc/index.php (accessed on 17 March 2017).
- Soares-Filho, B.; Moutinho, P.; Nepstad, D.; Anderson, A.; Rodrigues, H.; Garcia, R.; Dietzsch, L.; Merry, F.; Bowman, M.; Hissa, L.; et al. Role of Brazilian Amazon protected areas in climate change mitigation. Proc. Natl. Acad. Sci. USA 2010, 107, 10821–10826. [Google Scholar] [CrossRef] [PubMed] [Green Version]
- FNP Consultoria & Comércio. Anuário da Agricultura Brasileira de 2014; FNP Consultoria & Comércio: São Paulo, Brazil, 2014. [Google Scholar]
- EMBRAPA. Tecnologias de produção de soja—Região central do Brasil 2012 e 2013. Available online: https://www.embrapa.br/busca-de-publicacoes/-/publicacao/904487/tecnologias-de-producao-de-soja---regiao-central-do-brasil-2012-e-2013 (accessed on 7 April 2017).
- Jasinski, E.; Morton, D.; DeFries, R.; Shimabukuro, Y.; Anderson, L.; Hansen, M. Physical landscape correlates of the expansion of mechanized agriculture in Mato Grosso, Brazil. Earth Interact. 2005, 9, 1–18. [Google Scholar] [CrossRef]
- Biber, D.; Freudenberger, L.; Ibisch, P.L. INSENSA-GIS: An Open-Source Software Tool for GIS Data Processing and Statistical Analysis. 2011. Available online: https://insensa.org/ (accessed on 29 November 2016).
- Schielein, J.; Ponzoni Frey, G.; Miranda Arana, A.J. Friction Map for Brazil in 2014. Available online: https://doi.org/10.5281/zenodo.557151 (accessed on 25 April 2017).
- Pozzi, F.; Robinson, T.; Nelson, A. Accessibility Mapping and Rural Poverty in the Horn of Africa; Working Paper; Pro-Poor Livestock Policy Initiative, FAO: Rome, Italy, 2010. [Google Scholar]
- CSR Maps. Centro de Sensoriamento Remoto da Universidade Federal de Minas Gerais (CSR/UFMG). Available online: http://maps.csr.ufmg.br/ (accessed on 7 January 2017).
- Minella, A. Monetary policy and inflation in Brazil (1975–2000): A VAR estimation. Rev. Bras. Econ. 2003, 57, 605–635. [Google Scholar] [CrossRef]
- Phillips, S.J.; Dudík, M. Modeling of species distributions with Maxent: New extensions and a comprehensive evaluation. Ecography 2008, 31, 161–175. [Google Scholar] [CrossRef]
- IBGE—Instituto Brasileiro de Geografia e Estatística Área Urbana (Base Digital Georreferenciada). Available online: http://downloads.ibge.gov.br/downloads_geociencias.htm (accessed on 2 April 2017).
- Baldwin, R. Use of maximum entropy modeling in wildlife research. Entropy 2009, 11, 854–866. [Google Scholar] [CrossRef]
- Ministério do Meio Ambiente Projeto do Ministério do Meio Ambiente de Conservação e Utilização da Diversidade Biológica Brasileira. Áreas Prioritárias (Base Digital Georreferenciada). Available online: http://www.mma.gov.br/biodiversidade/biodiversidade-brasileira/áreas-prioritárias/item/489 (accessed on 3 February 2017).
- Soares-Filho, B.; Rajão, R.; Merry, F.; Rodrigues, H.; Davis, J.; Lima, L.; Macedo, M.; Coe, M.; Carneiro, A.; Santiago, L. Brazil’s market for trading forest certificates. PLoS ONE 2016, 11, e0152311. [Google Scholar] [CrossRef] [PubMed]
- Yackulic, C.B.; Chandler, R.; Zipkin, E.F.; Royle, J.A.; Nichols, J.D.; Campbell Grant, E.H.; Veran, S. Presence-only modelling using MAXENT: When can we trust the inferences? Methods Ecol. Evol. 2013, 4, 236–243. [Google Scholar] [CrossRef]
- Pontius, R.G.; Boersma, W.; Castella, J.-C.; Clarke, K.; de Nijs, T.; Dietzel, C.; Duan, Z.; Fotsing, E.; Goldstein, N.; Kok, K.; et al. Comparing the input, output, and validation maps for several models of land change. Ann. Reg. Sci. 2008, 42, 11–37. [Google Scholar] [CrossRef]
- van Vliet, J.; Bregt, A.K.; Hagen-Zanker, A. Revisiting Kappa to account for change in the accuracy assessment of land-use change models. Ecol. Model. 2011, 222, 1367–1375. [Google Scholar] [CrossRef]
- van Vliet, J.; Hagen-Zanker, A.; Hurkens, J.; van Delden, H. A fuzzy set approach to assess the predictive accuracy of land use simulations. Ecol. Model. 2013, 261–262, 32–42. [Google Scholar] [CrossRef]
- Visser, H.; de Nijs, T. The map comparison kit. Environ. Model. Softw. 2006, 21, 346–358. [Google Scholar] [CrossRef]
- Houghton, R.A.; Skole, D.L.; Nobre, C.A.; Hackler, J.L.; Lawrence, K.T.; Chomentowski, W.H. Annual fluxes of carbon from deforestation and regrowth in the Brazilian Amazon. Nature 2000, 403, 301–304. [Google Scholar] [CrossRef] [PubMed]
- Fuller, D.O.; Hardiono, M.; Meijaard, E. Deforestation projections for carbon-rich peat swamp forests of Central Kalimantan, Indonesia. Environ. Manag. 2011, 48, 436–447. [Google Scholar] [CrossRef] [PubMed]
- Kim, O.S. An assessment of deforestation models for reducing emissions from deforestation and forest degradation (REDD). Trans. GIS 2010, 14, 631–654. [Google Scholar] [CrossRef]
- Malek, Ž.; Boerboom, L.; Glade, T. Future forest cover change scenarios with implications for landslide risk: An example from Buzau Subcarpathians, Romania. Environ. Manag. 2015, 56, 1228–1243. [Google Scholar] [CrossRef] [PubMed]
- Vieilledent, G.; Grinand, C.; Vaudry, R. Forecasting deforestation and carbon emissions in tropical developing countries facing demographic expansion: A case study in Madagascar. Ecol. Evol. 2013, 3, 1702–1716. [Google Scholar] [CrossRef] [PubMed] [Green Version]
- Ke, X.; Zheng, W.; Zhou, T.; Liu, X. A CA-based land system change model: LANDSCAPE. Int. J. Geogr. Inf. Sci. 2017, 31, 1798–1817. [Google Scholar] [CrossRef]
- Ke, X.; van Vliet, J.; Zhou, T.; Verburg, P.H.; Zheng, W.; Liu, X. Direct and indirect loss of natural habitat due to built-up area expansion: A model-based analysis for the city of Wuhan, China. Land Use Policy 2018, 74, 231–239. [Google Scholar] [CrossRef]
- Altartouri, A.; Nurminen, L.; Jolma, A. Spatial neighborhood effect and scale issues in the calibration and validation of a dynamic model of Phragmites australis distribution—A cellular automata and machine learning approach. Environ. Model. Softw. 2015, 71, 15–29. [Google Scholar] [CrossRef]
- Liu, Y.; Feng, Y.; Pontius, R. Spatially-explicit simulation of urban growth through self-adaptive genetic algorithm and cellular automata modelling. Land 2014, 3, 719–738. [Google Scholar] [CrossRef]
- Vera-Diaz, M.; del, C.; Kaufmann, R.K.; Nepstad, D.C.; Schlesinger, P. An interdisciplinary model of soybean yield in the Amazon Basin: The climatic, edaphic, and economic determinants. Ecol. Econ. 2008, 65, 420–431. [Google Scholar] [CrossRef]
- Rodrigues, T.E.G. Agricultural explosion in Brazil: Exploring the impacts of the Brazilian agricultural development over the Amazon. Int. J. Sociol. Agric. Food 2009, 16, 1–12. [Google Scholar]
- Putz, F.E.; Ellis, P.W.; Griscom, B.W. Topographic restrictions on land-use practices: Consequences of different pixel sizes and data sources for natural forest management policies in the tropics. For. Ecol. Manag. 2018, 422, 108–113. [Google Scholar] [CrossRef]
- Börner, J.; Wunder, S.; Wertz-Kanounnikoff, S.; Tito, M.R.; Pereira, L.; Nascimento, N. Direct conservation payments in the Brazilian Amazon: Scope and equity implications. Ecol. Econ. 2010, 69, 1272–1282. [Google Scholar] [CrossRef]
- Moutinho, P.; Guerra, R.; Azevedo-Ramos, C. Achieving zero deforestation in the Brazilian Amazon: What is missing? Elem. Sci. Anth. 2016, 4, 000125. [Google Scholar] [CrossRef]
- Börner, J.; Marinho, E.; Wunder, S. Mixing carrots and sticks to conserve forests in the Brazilian Amazon: A spatial probabilistic modeling approach. PLoS ONE 2015, 10, e0116846. [Google Scholar] [CrossRef] [PubMed]
- Azevedo-Ramos, C.; Moutinho, P. No man’s land in the Brazilian Amazon: Could undesignated public forests slow Amazon deforestation? Land Use Policy 2018, 73, 125–127. [Google Scholar] [CrossRef]
- Godar, J.; Tizado, E.J.; Pokorny, B. Who is responsible for deforestation in the Amazon? A spatially explicit analysis along the Transamazon Highway in Brazil. For. Ecol. Manag. 2012, 267, 58–73. [Google Scholar] [CrossRef]
- Fearnside, P.M. Soybean cultivation as a threat to the environment in Brazil. Environ. Conserv. 2001, 28, 23–38. [Google Scholar] [CrossRef]
- Pacheco, P.; Aguilar-Støen, M.; Börner, J.; Etter, A.; Putzel, L.; Diaz, M.D.C.V. Landscape transformation in tropical Latin America: Assessing trends and policy implications for REDD+. Forests 2011, 2, 1–29. [Google Scholar] [CrossRef]
- Kastens, J.H.; Brown, J.C.; Coutinho, A.C.; Bishop, C.R.; Esquerdo, J.C.D.M. Soy moratorium impacts on soybean and deforestation dynamics in Mato Grosso, Brazil. PLoS ONE 2017, 12, e0176168. [Google Scholar] [CrossRef] [PubMed]
- IBGE. Produção Agrícola Municipal: Culturas Temporárias e Permanentes; Instituto Brasileiro de Geografia e Estatística: Rio de Janeiro, Brazil, 2017.
- van Gelder, J.W.; Dros, J.M. From Rainforest to Chicken Breast: Effects of Soybean Cultivation for Animal Feed on People and Nature in the Amazon Region—A Chain of Custody Study. Available online: http://commodityplatform.org/wp/wp-content/uploads/2007/09/from-rainforest-to-chickenbreast.pdf (accessed on 12 June 2018).
- Garcez, C.A.G.; de Souza Vianna, J.N. Brazilian biodiesel policy: Social and environmental considerations of sustainability. Energy 2009, 34, 645–654. [Google Scholar] [CrossRef]
- Carbon Dioxide Information Analysis Center, Environmental Sciences Division, Oak Ridge National Laboratory. CO2 Emissions (kt). Available online: http://databank.worldbank.org (accessed on 29 June 2018).
- Morton, D.C.; Noojipady, P.; Macedo, M.M.; Gibbs, H.; Victoria, D.C.; Bolfe, E.L. Reevaluating suitability estimates based on dynamics of cropland expansion in the Brazilian Amazon. Glob. Environ. Chang. 2016, 37, 92–101. [Google Scholar] [CrossRef]
Figure 1.
Modern agricultural frontier framework for soy investment. Dashed arrows represent indirect processes.
Figure 1.
Modern agricultural frontier framework for soy investment. Dashed arrows represent indirect processes.
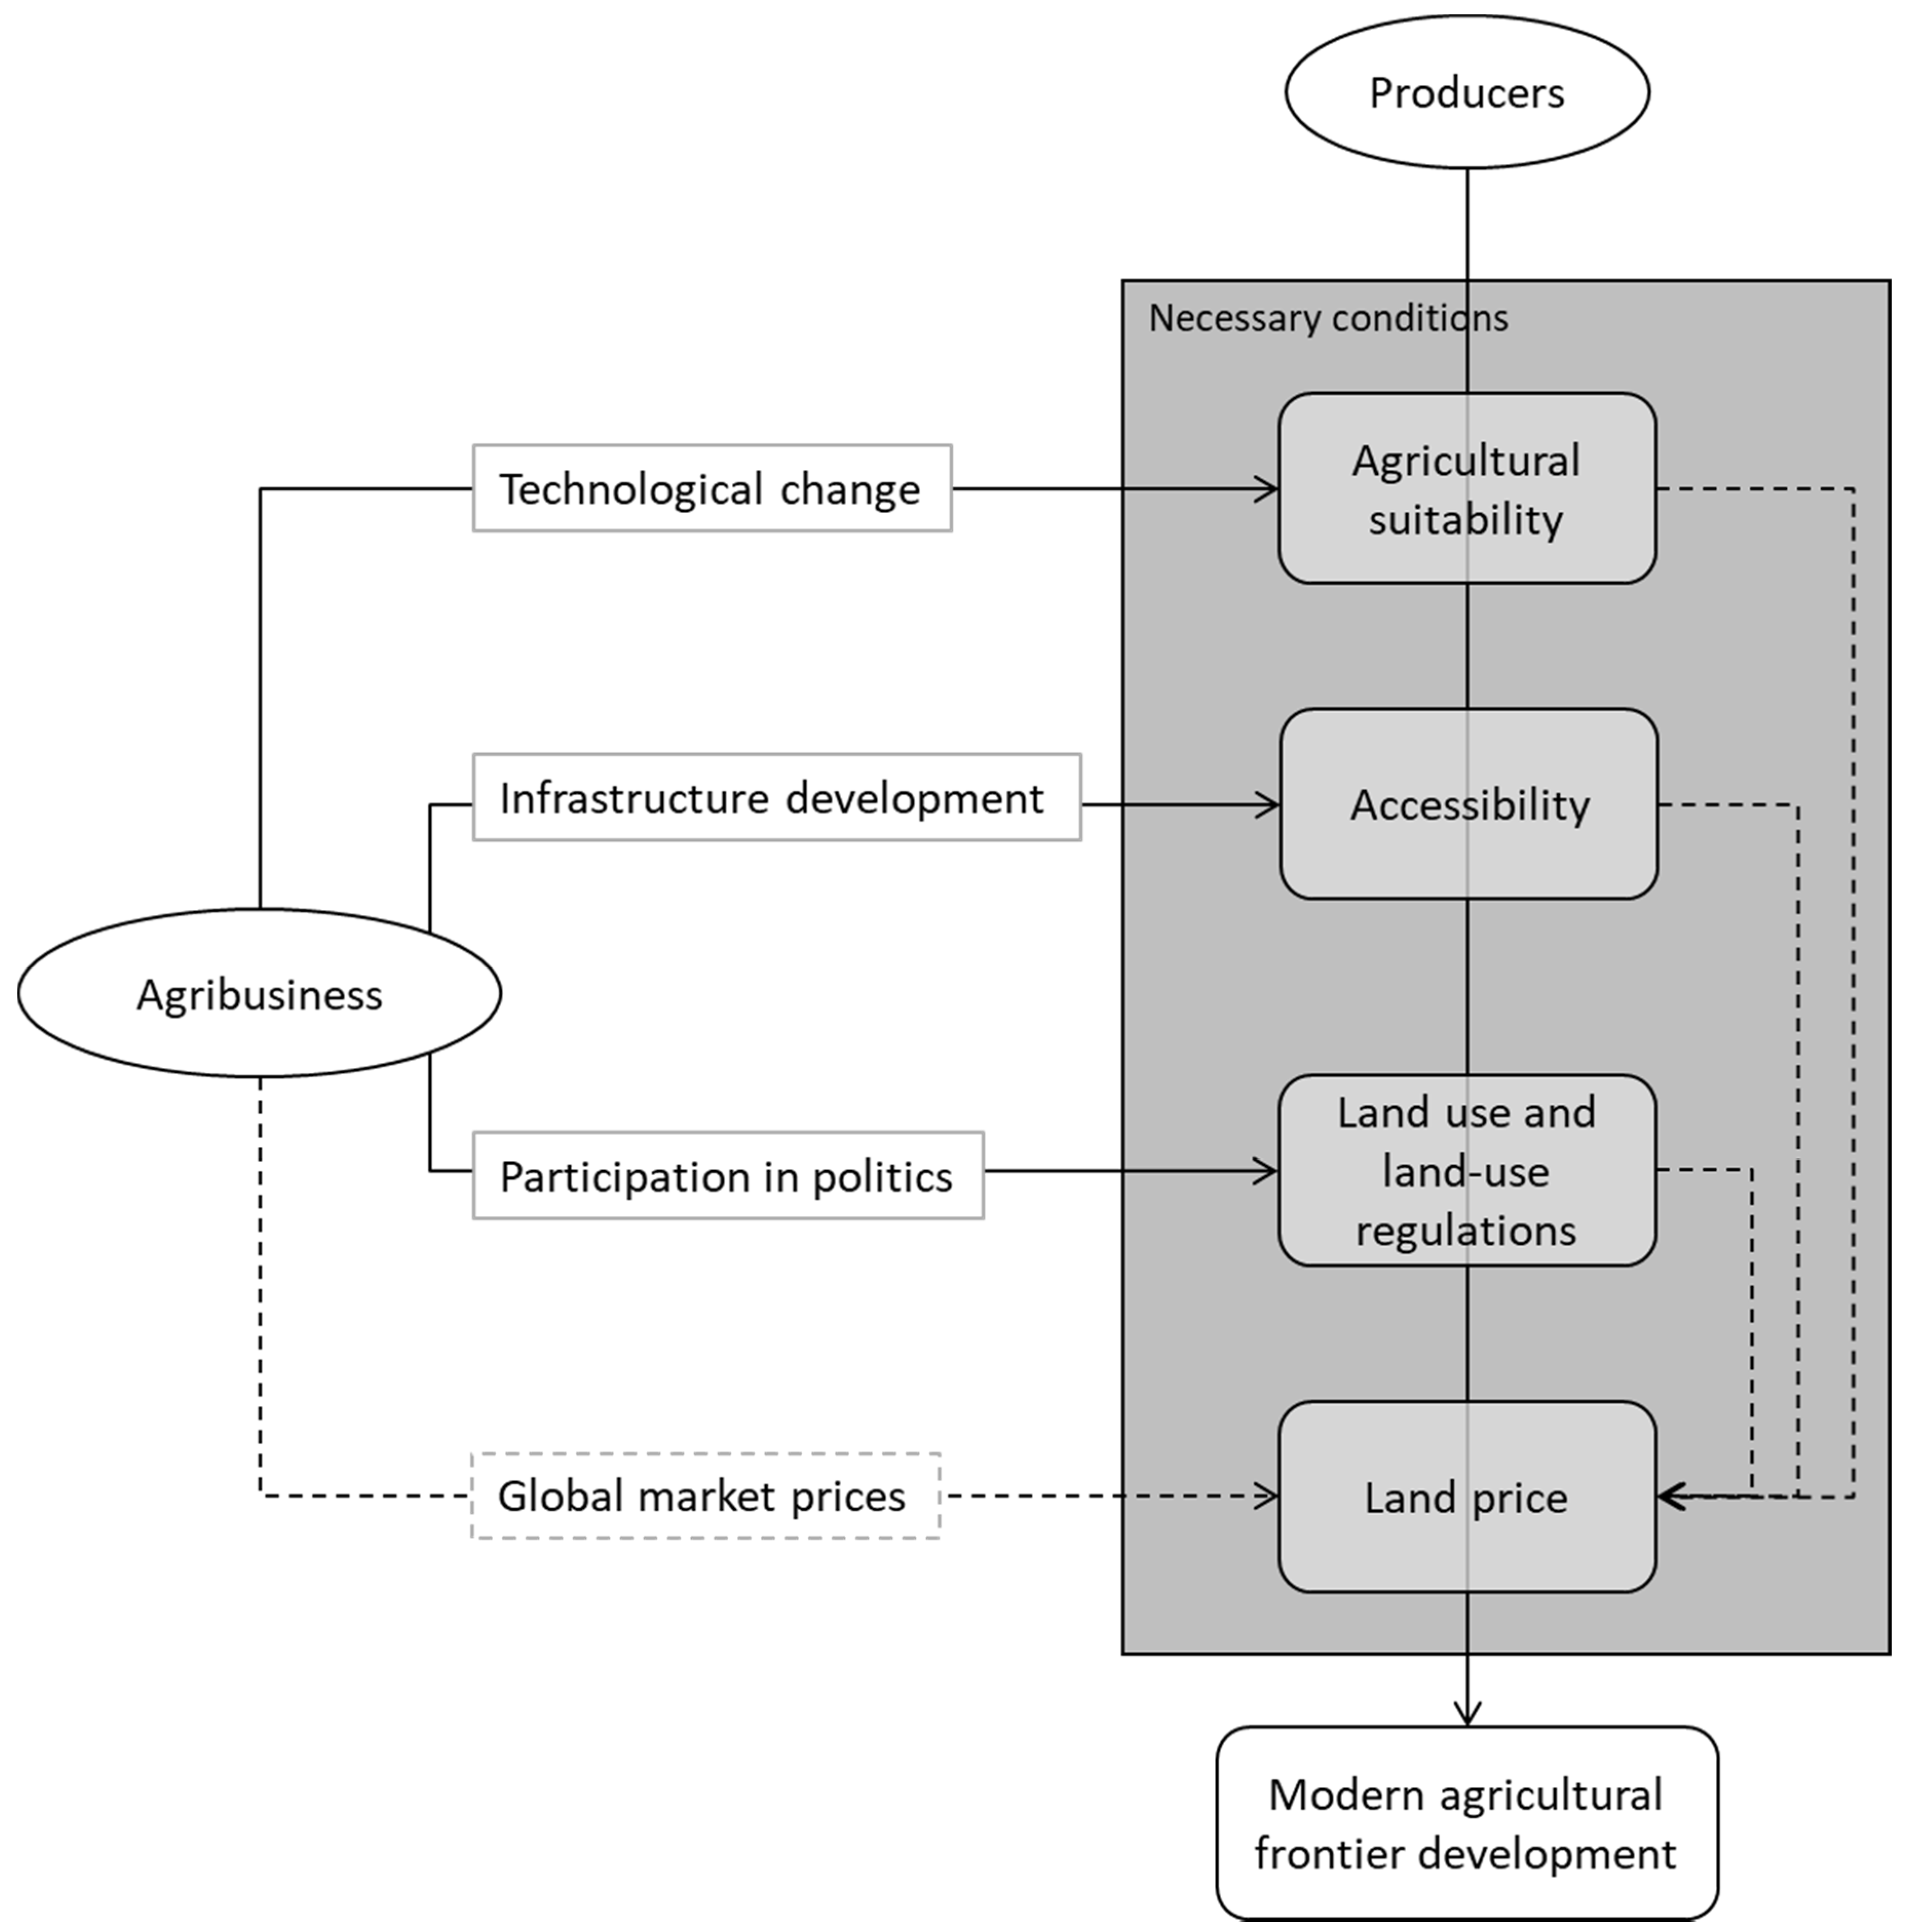
Figure 2.
Results from the Jackknife sensitivity test. Training gains represent the relative contribution of each variable to explain the location of soy occurrence in the Legal Amazon in 2014 (see Table 1 for interpretation of the variable names).
Figure 2.
Results from the Jackknife sensitivity test. Training gains represent the relative contribution of each variable to explain the location of soy occurrence in the Legal Amazon in 2014 (see Table 1 for interpretation of the variable names).

Figure 3.
Probability of soy expansion in the Legal Amazon and forecasted soy expansion for 2020.

Figure 4.
Changes in soy expansion probabilities due to infrastructure improvements between the 2014 scenario (Panel A) and future Scenarios 1, 2 and 3 (Panels B, C, and D, respectively).
Figure 4.
Changes in soy expansion probabilities due to infrastructure improvements between the 2014 scenario (Panel A) and future Scenarios 1, 2 and 3 (Panels B, C, and D, respectively).


Table 1.
Summary of model input variables.
| Category | Variable | Code | Source/Reference |
|---|---|---|---|
| Agricultural Suitability | Annual Mean Temperature | bio1 | [66] |
| Mean Diurnal Range (Mean of monthly (max temp–min temp)) | bio2 | ||
| Isothermality (bio2/bio7) (* 100) | bio3 | ||
| Temperature Seasonality (standard deviation * 100) | bio4 | ||
| Max Temperature of Warmest Month | bio5 | ||
| Min Temperature of Coldest Month | bio6 | ||
| Temperature Annual Range (bio5–bio6) | bio7 | ||
| Mean Temperature of Wettest Quarter | bio8 | ||
| Mean Temperature of Driest Quarter | bio9 | ||
| Mean Temperature of Warmest Quarter | bio10 | ||
| Mean Temperature of Coldest Quarter | bio11 | ||
| Annual Precipitation | bio12 | ||
| Precipitation of Wettest Month | bio13 | ||
| Precipitation of Driest Month | bio14 | ||
| Precipitation Seasonality (Coefficient of Variation) | bio15 | ||
| Precipitation of Wettest Quarter | bio16 | ||
| Precipitation of Driest Quarter | bio17 | ||
| Precipitation of Warmest Quarter | bio18 | ||
| Precipitation of Coldest Quarter | bio19 | ||
| Soil quality/type | [67] | ||
| Elevation | [68] | ||
| Slope | authors | ||
| Accessibility | Cities | [69] | |
| Roads | [70] * | ||
| Railroads | [70] | ||
| Waterways | [70] | ||
| Ports and terminals | [71] | ||
| Storage facilities | [70] | ||
| Crushing facilities | [70] | ||
| Travel cost to cities | dist cities | authors | |
| Travel cost to ports and terminals | dist ports | authors | |
| Travel cost to storage facilities | dist storage | authors | |
| Travel cost to crushing facilities | dist crush | authors | |
| Land use and institutions | Land cover (2008–2014) | [72] | |
| Settlements | [73] | ||
| Protected areas (Sustainable use, Integral protection, Indigenous reserve, Military areas) | [74] | ||
| Land price | Agricultural land price | land price A | [75] |
| Pastureland price | land price P | [75] | |
| Forested land price | land price N | [75] |
* Adapted from the Centro de Sensoriamento Remoto-CSR/UFMG.
Table 2.
Changes in infrastructure status across simulation scenarios.
| Category Roads | 2014 | Scenario 1 | Scenario 2 | Scenario 3 |
|---|---|---|---|---|
| Paved | paved | paved | paved | paved |
| Established | unpaved | unpaved | paved | paved |
| Natural Surface (Leito Natural) | unpaved | unpaved | paved | paved |
| Not informed | unpaved | unpaved | paved | paved |
| Under construction of new lane | unpaved | paved | paved | paved |
| Under pavement | unpaved | paved | paved | paved |
| New lane added | paved | paved | paved | paved |
| Planned | removed | unpaved | paved | paved |
| Under construction | removed | unpaved | paved | paved |
| River crossing | water | water | water | water |
| Railroads | ||||
| In operation | railway | railway | railway | railway |
| Planned | removed | railway | railway | railway |
| Under construction | removed | railway | railway | railway |
| Suspended traffic | removed | railway | railway | railway |
| Not informed | removed | railway | railway | railway |
| New Facilities | ||||
| Storage | - | - | - | yes |
| Crushing | - | - | - | yes |
Note: ‘removed’ refers to categories that were removed in a scenario. The source of the data is found in Table 1.
Table 3.
Changes in the high-risk areas of experiencing soy expansion in the Brazilian Legal Amazon across simulation scenarios.
Table 3.
Changes in the high-risk areas of experiencing soy expansion in the Brazilian Legal Amazon across simulation scenarios.
| Scenario | 2014 (Mha) | Scenario 1 (Variation Compared to 2014) | Scenario 2 (Variation Compared to 2014) | Scenario 3 (Variation Compared to 2014) |
|---|---|---|---|---|
| Total area | 14.66 | 2.45% | 12.97% | 14.57% |
| Protected areas and settlements | ||||
| Not publicly protected | 14.66 | 2.45% | 2.45% | 2.45% |
| Strictly protected | 0.00 | 0.00% | 0.00% | 0.00% |
| Sustainable use | 0.00 | 0.00% | 0.00% | 0.00% |
| Indigenous territories | 0.00 | 0.00% | 0.00% | 0.00% |
| Military | 0.00 | 0.00% | 0.00% | 0.00% |
| Settlements | 1.15 | 1.48% | 11.59% | 12.57% |
| Land use | ||||
| Forest | 0.44 | 9.56% | 38.62% | 51.44% |
| Pasture | 9.18 | 1.82% | 10.96% | 11.38% |
| Agriculture | 1.77 | 1.08% | 4.07% | 4.63% |
| Planted forest | >0.01 | 2.46% | 4.89% | 4.89% |
| Coastal zone forest | 0.00 | 0.00% | >0.01 Mha | >0.01 Mha |
| Other | 3.22 | 3.98% | 19.98% | 23.83% |
| Conservation priority | ||||
| High | 0.05 | 2.99% | 5.07% | 5.07% |
| Very high | 0.06 | 5.65% | 29.89% | 32.79% |
| Extremely High | 3.29 | 3.87% | 23.75% | 24.32% |
| Insufficiently known | 0.27 | 5.09% | 14.61% | 14.40% |
| New areas identified by regional groups | 0.00 | 0.00% | >0.01 Mha | >0.01 Mha |
| Potential biomass (Mg ha−1) | ||||
| 0–100 | 7.77 | 2.35% | 12.40% | 13.60% |
| 100–200 | 0.28 | 1.24% | 12.92% | 13.04% |
| >200 | 6.61 | 2.63% | 13.53% | 15.65% |
© 2018 by the authors. Licensee MDPI, Basel, Switzerland. This article is an open access article distributed under the terms and conditions of the Creative Commons Attribution (CC BY) license (http://creativecommons.org/licenses/by/4.0/).
Share and Cite
MDPI and ACS Style
Frey, G.P.; West, T.A.P.; Hickler, T.; Rausch, L.; Gibbs, H.K.; Börner, J. Simulated Impacts of Soy and Infrastructure Expansion in the Brazilian Amazon: A Maximum Entropy Approach. Forests 2018, 9, 600. https://doi.org/10.3390/f9100600
AMA Style
Frey GP, West TAP, Hickler T, Rausch L, Gibbs HK, Börner J. Simulated Impacts of Soy and Infrastructure Expansion in the Brazilian Amazon: A Maximum Entropy Approach. Forests. 2018; 9(10):600. https://doi.org/10.3390/f9100600
Chicago/Turabian StyleFrey, Gabriel P., Thales A. P. West, Thomas Hickler, Lisa Rausch, Holly K. Gibbs, and Jan Börner. 2018. "Simulated Impacts of Soy and Infrastructure Expansion in the Brazilian Amazon: A Maximum Entropy Approach" Forests 9, no. 10: 600. https://doi.org/10.3390/f9100600
Note that from the first issue of 2016, this journal uses article numbers instead of page numbers. See further details here.