Changing Climatic Averages and Variance: Implications for Mesophication at the Eastern Edge of North America’s Eastern Deciduous Forest


1
Institute of Water Security and Science, West Virginia University, 3107 Agricultural Sciences Building, Morgantown, WV 26506, USA
2
Institute of Water Security and Science, West Virginia University, 4121 Agricultural Sciences Building, Morgantown, WV 26506, USA
3
Davis College of Agriculture, Natural Resources and Design, West Virginia University, Morgantown, WV 26506, USA
*
Author to whom correspondence should be addressed.
Forests 2018, 9(10), 605; https://doi.org/10.3390/f9100605
Submission received: 26 August 2018
/
Revised: 24 September 2018
/
Accepted: 27 September 2018
/
Published: 29 September 2018
(This article belongs to the Section Forest Ecology and Management)
Abstract
:Observed conversion of xerophytic warm genera species to mesophytic cool genera species in North America’s Eastern Deciduous Forest (EDF) suggests species composition is in disequilibrium with recent climatic warming. However, increasing annual average temperatures is an oversimplification of long-term climatic change and the importance of climate variance is often neglected. Seven-year moving averages and standard deviations of annually averaged maximum temperatures, minimum temperatures, daily precipitation, and vapor pressure deficits (VPD) in West Virginia, USA were quantified over a 111-year period of record (1906–2016). Maximum temperatures decreased significantly (−5.3%; p < 0.001), minimum temperatures increased significantly (7.7%; p < 0.001), and precipitation increased (2.2%; p = 0.107). Additionally, maximum temperature variance decreased (−17.4%; p = 0.109), minimum temperature variance decreased significantly (−22.6%; p = 0.042), and precipitation variance increased significantly (26.6%; p = 0.004). Results indicate a reduced diurnal temperature range and significant reductions in estimated VPD (10.3%; p < 0.001) that imply increased relative humidity, cloud cover, and soil moisture that may support increasingly abundant mesophytic cool genera species. Feedback mechanisms associated with extensive changes in land use, fire suppression, and browser population may have exacerbated climatic changes. Long-term assessments of changing climatic averages and variance are needed to ensure sustainability of forest ecosystem services, health, and productivity in a swiftly changing climate across the broader EDF region and similar temperate forest ecosystems globally.
1. Introduction
Many uncertainties regarding climate change exist, including (but not limited to) the ability to identify and preemptively adapt to emerging challenges and opportunities. In many locations globally, the security of natural resources and related commodities in the food, energy, and water sectors are in question due to changes in long-term averages of temperature and precipitation and increasingly frequent climate extremes (e.g., heat waves, droughts, and floods) [1]. Despite cumulative evidence that Earth’s climate is becoming more extreme and less predictable [2,3], relatively little is known about how climate variance is changing. In particular, concurrent changes in climatic averages and variance may better explain changes in ecosystem biodiversity (e.g., forest species composition), hydrology, and carbon dynamics [4]. Therefore, a need exists to simultaneously assess observed trends in climatic averages and variance at local to regional scales, as shown in the current work, to better identify ecosystem threats and adaptively manage food, energy, and water resource security.
Forests provide many ecosystem services (e.g., food and energy, water provisioning, and carbon sequestration), which have been valued at $16.2 trillion per year globally [5] and are threatened by climate change and development [6,7]. Forest disturbances (e.g., wildfire, insect outbreaks, and water stress) can contribute to forest health and resilience, but the frequency and magnitude of disturbances that a forest can tolerate before forest health and ecosystem services are threatened is a needed area of research [6]. Increasing pressure from anthropogenic stressors (e.g., climate change, air pollution, and deforestation) are pushing temperate forests toward, and in some cases, over resilience thresholds [6]. For example, hydroclimatic events (e.g., droughts and floods) have become more intense [3] and the impacts associated with droughts have been exacerbated by warming temperatures [6]. Hydroclimatic events of greater frequency and intensity may alter forest dynamics, exceed forest ecosystems’ climate tolerance thresholds, exhaust ecosystem resilience, and threaten the sustainable supply of forest ecosystem services [6,7,8].
Recently, climate events have directly or indirectly triggered abrupt tree mortality in many locations globally [6]. For example, across the western United States, persistent and recurring drought combined with increasingly hot temperatures have simultaneously stressed host trees and increased survival and growth rates of native bark beetle populations [6,9]. While bark beetle outbreaks occur during hot and dry conditions, other pests and pathogens prefer moist conditions (e.g., Phytophthora ramorum Werres). Thus, effects of drought and excessive wetness in forest ecosystems require further investigation [10].
At the western edge of North America’s Eastern Deciduous Forest (EDF), increasing mean annual precipitation and interannual variability coincided with rapid mortality of a dominant forest species, white oak (Quercus alba Linnaeus). Increased precipitation quantity and variability suggests excessive wetness may have synergized with biotic agents such as Phytophthora and Pythium [10,11,12,13,14]. Many other antagonistic biotic agents (i.e., pests and pathogens) have impacted or are currently impacting the eastern EDF. Examples include chestnut blight (Endothia parasitica Murrill), emerald ash borer (Agrilus planipennis Fairmaire), gypsy moth (Lymantria dispar Linnaeus), hemlock woolly adelgid (Adelges tsugae Annand), and beech bark disease (Cryptococcus fagisuga Lindinger and Neonectria Wollenw; [15,16,17,18,19]). It is ultimately of great concern that antagonistic biotic agents have impacted the health, diversity, productivity, and economics of the eastern EDF, considering that climate change may exacerbate those vulnerabilities.
1.1. Eastern Deciduous Forest’s Changing Climate
Long term (~500 year) reconstructions of Palmer Drought Severity Index (PDSI) [20] using tree rings across the central oak region of the EDF indicated eight severe multi-year droughts between 1500 and 1872, which may have preferentially favored oak regeneration and recruitment [21]. However, no droughts of similar duration occurred between 1872 and 2005, suggesting greater moisture availability that may increasingly favor regeneration and recruitment of more drought sensitive species [21]. The lack of severe droughts between 1872 and 2005 is surprising considering the well-documented Dust Bowl era (i.e., 1932–1939) when drought was exacerbated by poor land-management practices resulting in unprecedented summer heat [22]. Another extreme drought was focused in the southwestern United States during the 1950s, but irrigation and improved agricultural practices reduced the socioeconomic impacts [23]. While the worst impacts associated with these multi-year droughts were not focused in the EDF region, widespread heat was observed downwind across the eastern United States including West Virginia (WV) and the broader Appalachian region [1]. However, the duration of 20th century droughts doesn’t compare to droughts recorded earlier in the second millennium that persisted for longer than a decade even though the minimum PDSI values for droughts during both epochs were similar [24]. Ultimately, altered disturbance regimes may have synergized with long term shifts in climate (i.e., shorter droughts), a hypothesis that contradicts the notion that eastern US forests are in climate disequilibrium [25].
The concept of eastern US forests in climate disequilibrium originates from an observed conversion from warm (e.g., oak) to cool (e.g., maple) genera despite regional increases in average temperatures during the 20th century [25]. The combination of warming average temperatures and a forest composition shift toward species adapted to cooler climates indicated that disturbances other than changing climate (e.g., fire regime, land-use change, browser population) were responsible for the observed changes in forest composition [25,26,27]. However, increases in average annual temperature across the central EDF (including WV) were small (0.17 °C) relative to the difference in average annual temperature within the ecological ranges of warm and cool species (3.7 °C) [28]. As a result, long-term warming of average temperatures is an oversimplification of regional climate change indicating a need to analyze observed changes in maximum and minimum temperatures separately.
1.2. West Virginia’s Changing Forest Ecosystem
The species composition of a forest reflects a legacy of historic disturbances, which for the eastern EDF includes millennia of regular fires set by Native and Euro-Americans [25], widespread changes in land use and land cover [26], an increasing browser population [27], and climate change [21]. In the Allegheny Mountains of WV, the largest decreases in relative abundance of forest tree species pre- (1780–1856) and post- (1993) [29] settlement (−5.8% to −3.9%) were basswood, chestnut, sugar maple, and hemlock species whereas the largest increases in relative abundance (3.5% to 11.3%) were black cherry, red maple, red spruce, and birch species [30]. Across the deeply dissected and unglaciated Appalachian Plateau, immediately west of the Allegheny Mountains, importance values (relative frequency and abundance) for red/silver maple and other soft hardwoods increased most (10.1 and 15.9, respectively), whereas red oak and white oak decreased most (−7.4 and −25.3, respectively) relative to the pre-settlement forest composition [31]. Contemporary forest inventory analyses indicate the compositional shift of forests across the state of WV continued through the early 21st century (2000 to 2013) with increasing abundance of yellow-poplar, American beech, black cherry, and red and sugar maple species and decreasing abundance of hickory and white, northern red, and black oak species [32]. Additionally, oaks and maples represented approximately 6% and 27% of trees between 5 cm and 10 cm DBH, respectively, indicating that maples are likely to become increasingly dominant [32]. Therefore, West Virginia’s forest composition has shifted toward more shade-tolerant and pyrophobic species compared to the pre-settlement era, but the relative influence of multiple interactive disturbance regimes remains unclear [21].
In a literature review, Ref. [21] determined that documentation of the oak-to-maple transition in forests of eastern North America is extensive and rigorous, but understanding of the relative importance of mechanisms (e.g., fire regime, climate change, land use change, browser population) inducing the species transition is more speculative. Fire scars on tree cross sections dating back to 1656 support anthropogenic fire as a factor in the pre-settlement oak forests [33], particularly at the western margin of the EDF, but other portions of the EDF lack fire scar data [21]. Furthermore, the transition from Native American to Euro-American land use occurred when indigenous populations had been decimated by Old World diseases (estimated 78% population decline between 1492 and 1800; [34]) suggesting that a continuous anthropogenic burn regime across the entire EDF was unlikely [21]. The initiation of the oak-maple dynamic in the mid-20th century corresponded with extensive fire suppression efforts [35] and a less diverse understory due to preferential browsing by an exceptionally large deer herd [27,36]. The combination of active fire prevention, extensive preferential browsing, and a lack of dead and down coarse woody debris altered seedbed conditions [37] indicating multiple interactive disturbance mechanisms altered the EDF’s species diversity following extreme changes in land use/land cover.
Old growth hardwood forest that dominated WV prior to Euro-American settlement (middle to late 18th century; [31]) was cleared for timber extraction, agricultural development, and settlement before and during the early 20th century until the emergence of intensive forest management practices [38]. Changes in WV’s land use and land cover are representative of the broader EDF where old growth forest was converted to agricultural land uses before farms were abandoned allowing for rapid forest recovery [39]. For example, old growth hardwood forest covered approximately two thirds of WV in 1880 [26], in 1909, agriculture or pasture lands covered approximately 72% of WV (Figure S1), and by 1949 approximately 64% of WV was forested [40]. Forest cover gradually increased through the 1975 forest survey (79%; [40]) and areal coverage remained steady through the 2013 forest survey, but timber volume increased to record levels in 2013 consistent with a maturing forest ecosystem [32]. After four decades of rapid afforestation (1909–1949) the areal coverage of WV’s forested land uses appeared to have equilibrated with direct anthropogenic disturbances (i.e., logging) around 1975, but indirect anthropogenic disturbances (i.e., climate change) are complex, spatially variable, and not well-understood [41]. Therefore, the overarching objective of this work was to quantify long-term trends in observed climatic averages and variability of maximum temperature, minimum temperature, and precipitation across the eastern edge of the EDF (West Virginia, USA). The overarching hypothesis of this work was that trends in West Virginia’s climate are consistent with the observed transition from warm to cool genera species at the eastern edge of the EDF.
2. Materials and Methods
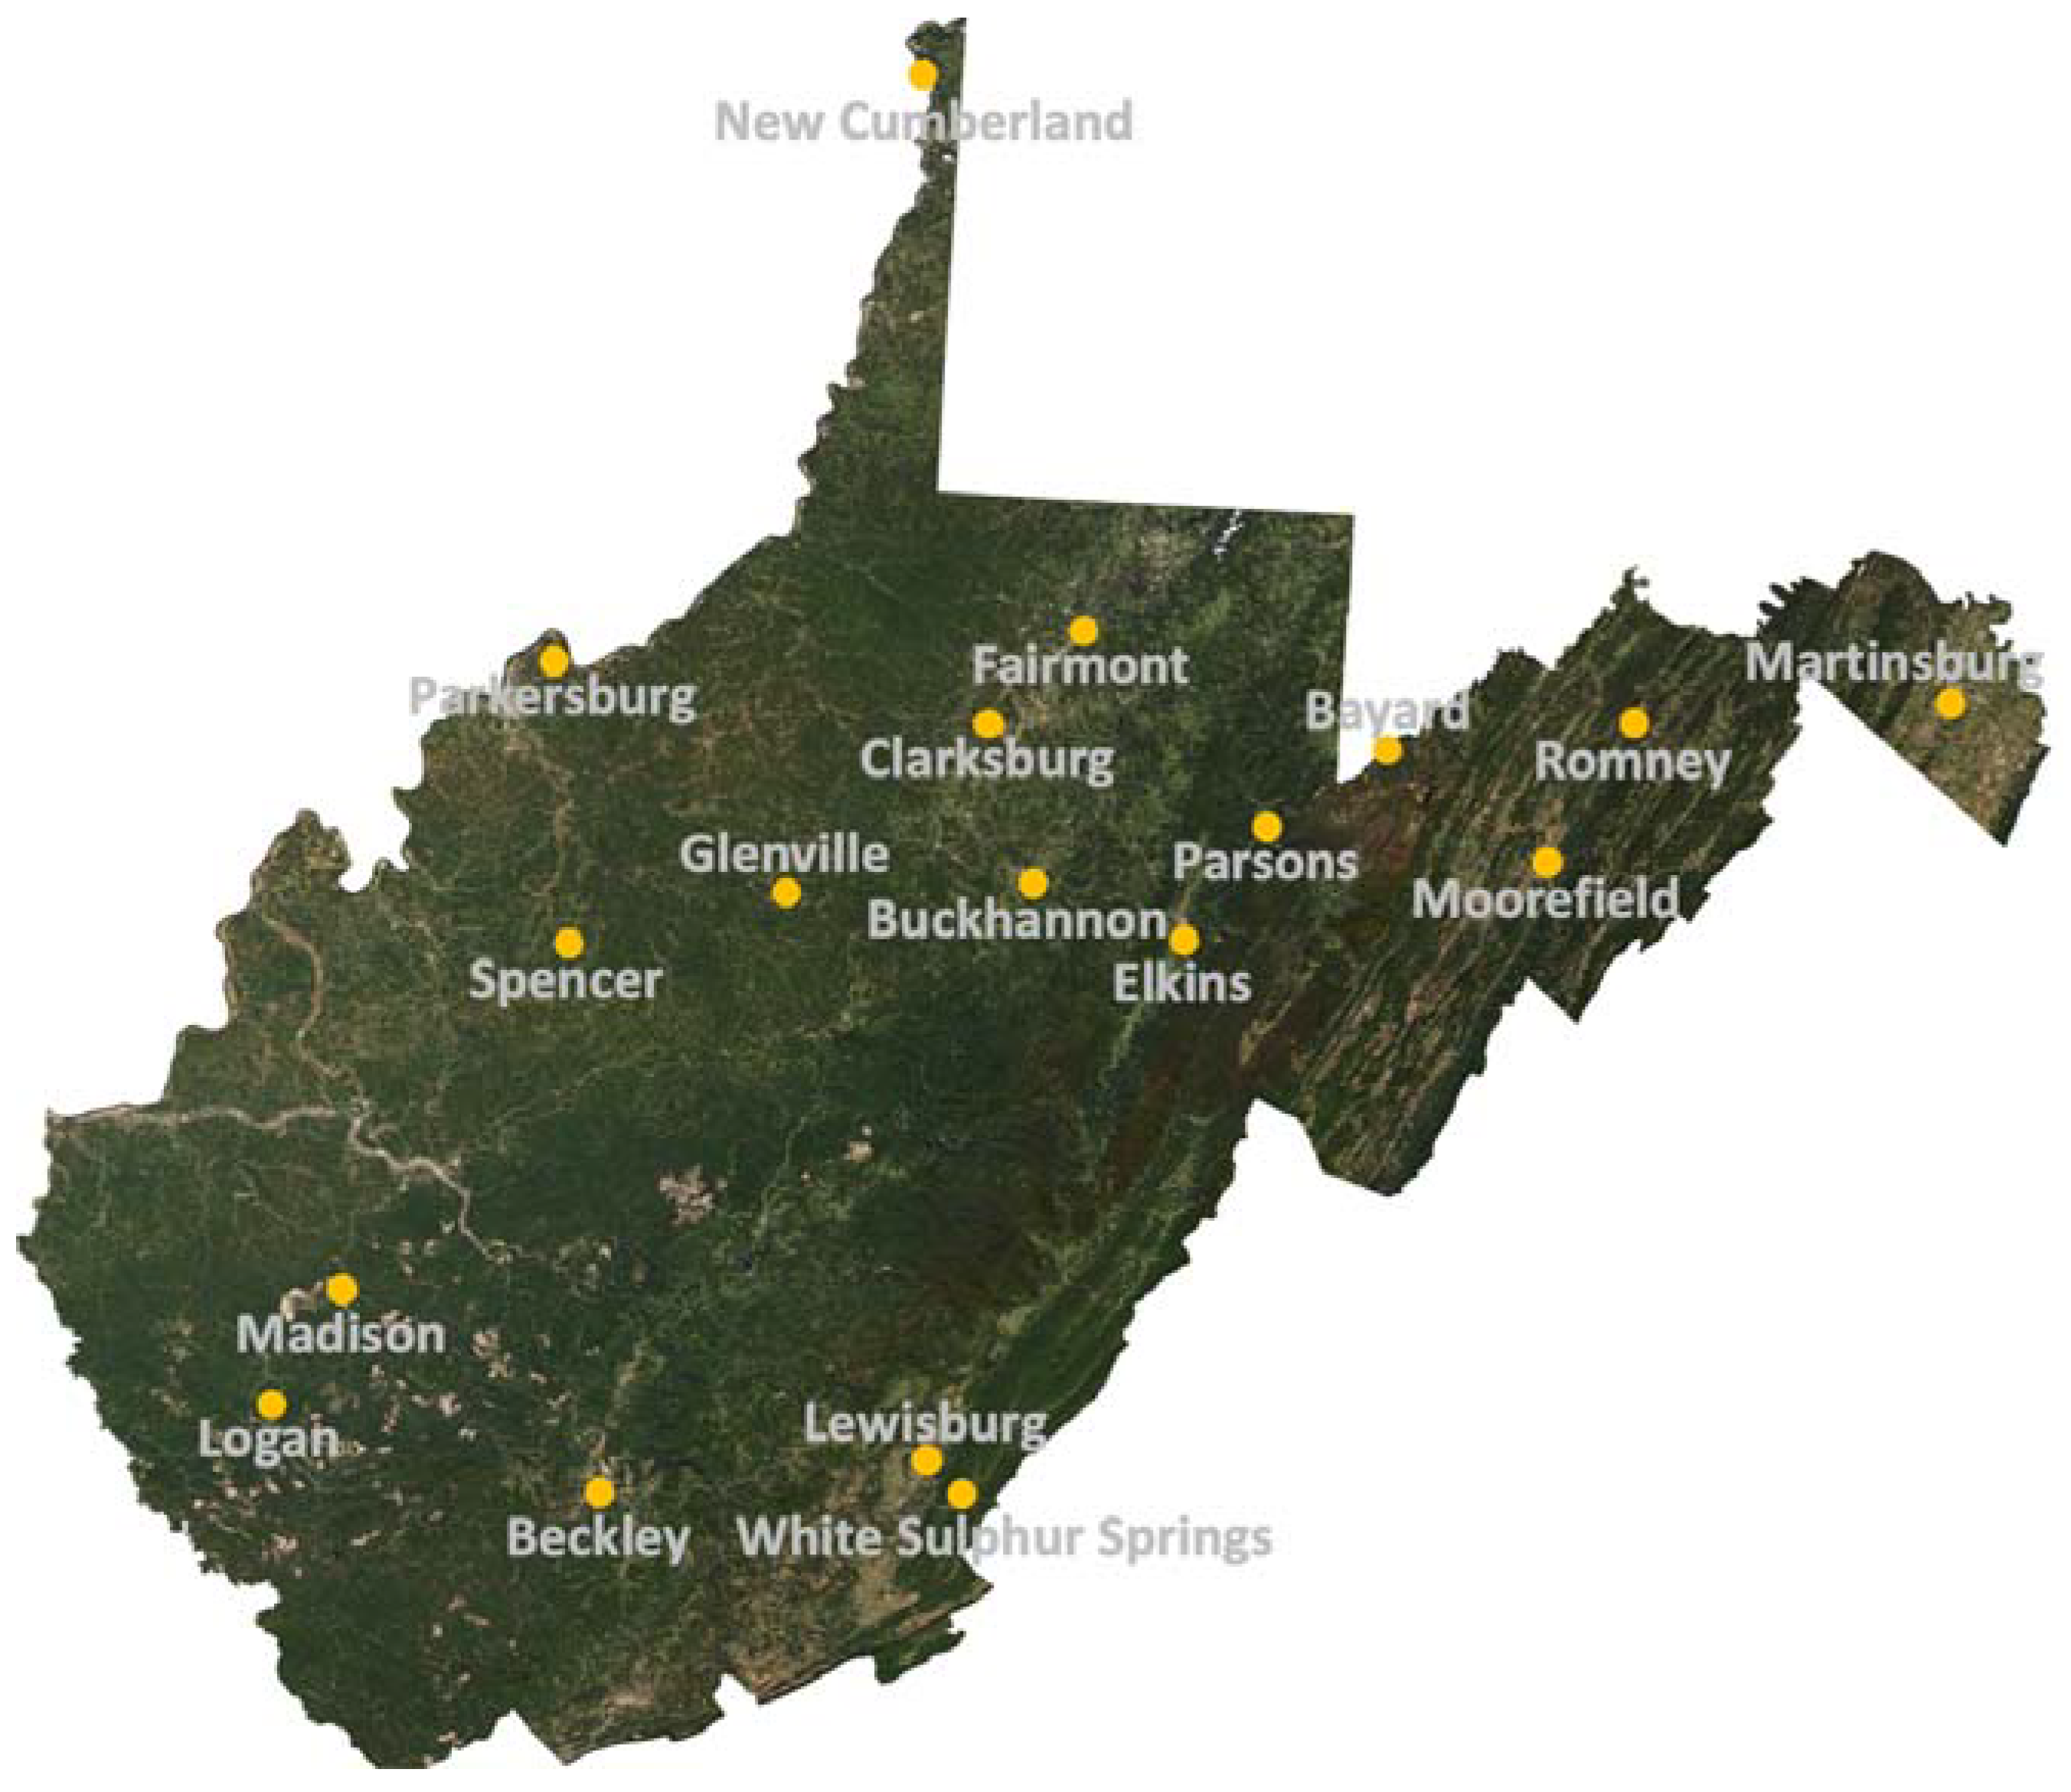
Daily summaries of total precipitation, maximum temperature, and minimum temperature were acquired from the National Oceanic and Atmospheric Administration’s (NOAA) National Center for Environmental Information (NCEI). NOAA’s NCEI represents a consolidation of three national data centers: the National Climate Data Center, the National Geophysical Data Center, and the National Oceanographic Data Center that took place in 2015 to address rapidly increasing demands for environmental data (https://www.ncei.noaa.gov/about). Stations with start dates between 1900 and 1930 were selected (n = 18) to maximize consistency of climate data during and after the period of rapid afforestation in WV, which may have attenuated or negated the impacts of a warming climate [25]. The spatial distribution of selected stations is shown in Figure 1 and the end date for all eighteen stations was 31 December 2016. The average elevation of all 18 stations was 396 m with a minimum of 165 m at Martinsburg, WV and a maximum of 722 m at Bayard, WV. The spatial and vertical distribution of selected climate stations is assumed to be representative of trends across West Virginia, which has an average elevation of 461 m with minimum and maximum elevations of 73 m and 1482 m, respectively. All leap days (i.e., 29 February) were excluded from analyses and data from each station were post-processed to ensure all missing dates were included resulting in a continuous time series with 365 days in each year. Years with data gaps exceeding 15% of possible daily observations (>54 daily observations per year) were removed from analyses [42]. Of 117 possible annual averages or totals, each observation location had between 77 and 110 annual averages for maximum and minimum temperature and between 84 and 110 annual precipitation totals due to differences in period of records and data gaps. However, averaging across all 18 stations provided a continuous time series of each variable between 1900 and 2016 that was suitable for quantifying moving seven-year averages and standard deviations of maximum temperature, minimum temperature, and precipitation.
A seven-year period is arguably long enough to estimate climate variance, short enough to induce rapid biological consequences [10], and is consistent with time scales of forest ecosystem service sensitivity [41]. El Niño-Southern Oscillation (ENSO) is the dominant source of inter-annual climate variability globally that may influence forest species reproduction, resource acquisition strategies, and health on periodic time scales of 2–7 years [43,44]. At the western edge of the EDF (i.e., Missouri, USA), two consecutive record wet years (2008–2009) may have enhanced root pathogen populations, such as Phytophthora, and vulnerable white oak stands succumbed to historic heat and drought in 2012 [12]. This episode of rapid white oak mortality confirms that climate variance on intra-decadal time scales is a key driver of EDF biodiversity, health, hydrology, ecosystem services, and carbon dynamics [4]. For example, it was estimated that the extreme drought and heat observed across Western Europe in 2003 released an amount of CO2 comparable to three to five years of CO2 sequestration under normal conditions [45]. Therefore, a seven-year period is long enough to include the dominant mode of global scale inter-annual climate variability, short enough to induce rapid biological consequences, and is consistent with timescales of ecosystem service sensitivity.
Vapor pressure deficit (VPD) is a key ecosystem driver of photosynthesis, water vapor flux, and plant productivity [10] and is therefore an important forest productivity metric. The lack of absolute or relative humidity observations confounded direct calculation of VPD over a long period of record [46]. However, for humid continental climates (i.e., WV) minimum temperatures are often used as an indirect measure of daily dew point temperature with observed differences averaging less than 1.0 °C annually [46]. Thus, trends in VPD were estimated using the Teten’s formula [47], where saturation vapor pressure was calculated using annual average temperature and the ambient vapor pressure was calculated using annual average minimum temperatures. Linear regression was performed on all moving averages and moving standard deviations of maximum temperature, minimum temperature, precipitation, and VPD to determine long-term trends. Analysis of Variance (ANOVA) was performed to determine whether trends were significantly different at the 0.05 confidence interval (CI = 0.05). All post-processing, temporal and spatial averaging, standard deviation, and VPD calculations were performed in Microsoft Excel (2013, Redmond, WA, USA), whereas all regression and ANOVA analyses were performed and plotted with OriginPro (2018, Northampton, MA, USA).
3. Results and Discussion
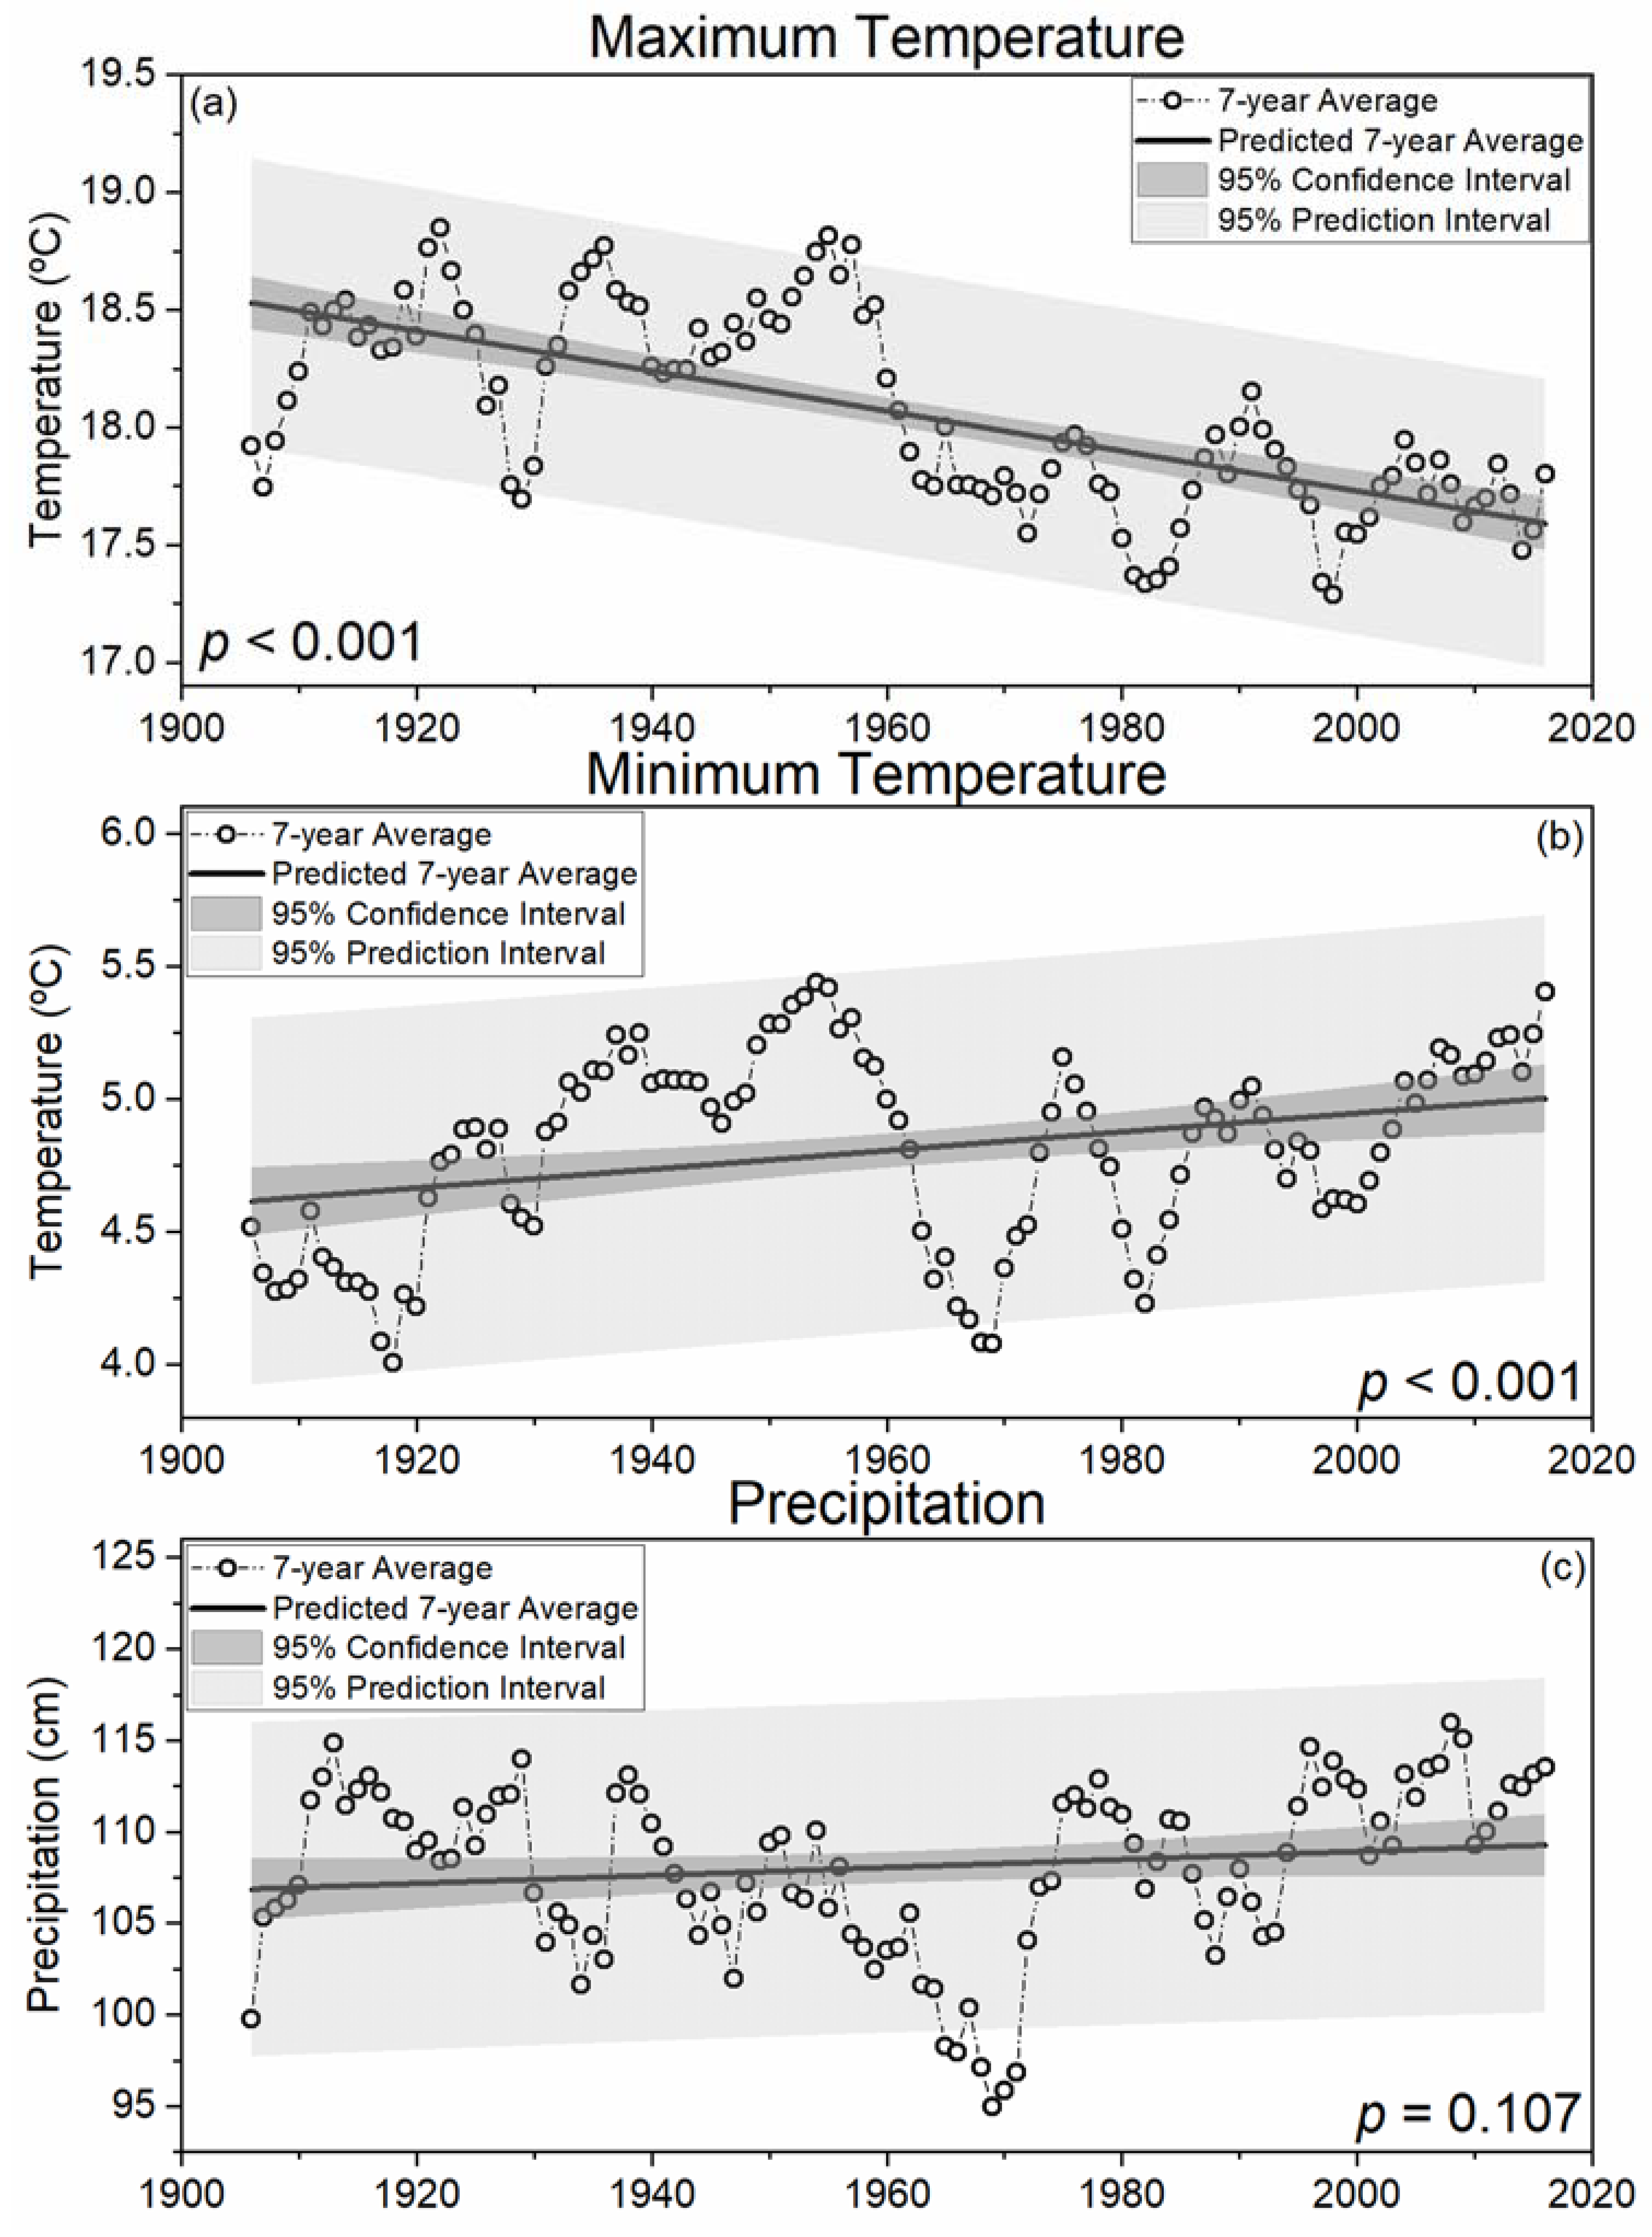
In West Virginia, moving seven-year averages indicate significant (p < 0.001) decreases in maximum temperatures and increases in minimum temperatures (1906–2016) consistent with an increasingly temperate climate (Figure 2). Combined, trends in maximum and minimum temperatures imply a decreasing diurnal temperature range consistent with increasing cloud cover, precipitation, and soil moisture [49]. Increased cloud cover influences above-canopy light intensity [50] and therefore alters habitat suitability, thus selecting for more shade tolerant species composition in West Virginia [25]. Moving seven-year averages of maximum (18.0 °C) and minimum (4.9 °C) temperatures resulted in the long term average temperature of 11.45 °C (1906–2016; Table 1). However, the predicted 7-year average indicated a 0.4 °C increase in minimum temperatures and a 0.9 °C decrease in maximum temperatures indicating a predicted 0.25 °C decrease in WV’s moving seven-year average of annual temperatures between 1906 (11.55 °C) and 2016 (11.3 °C). These results indicate that WV’s climate has approached the threshold temperature separating cool and warm genera (10.75 °C; [25]), suggesting the shift in the EDF’s species composition may not be in disequilibrium with observed trends in WV temperature.
In 2018, Zhang et al. detected changes in EDF species composition on time scales typically associated with climatic averages (i.e., 30 years), suggesting that climate-induced shifts in forest species composition have occurred since 1906. Rapid deforestation of WV’s old growth forests was discontinued around 1920 when the forest industry moved further south and west [26] and farm abandonment and extensive fire prevention methods resulted in rapid redevelopment of vast hardwood forests [51]. It was estimated that 38% of contemporary WV forests were established during the 30-year period from 1920 to 1949 (Figure S1) [40] when both maximum and minimum temperatures were relatively warm (Figure 2). Indeed, three of the five years tied for the warmest seven-year moving average of maximum temperatures (18.8 °C; Table 1) occurred between 1920 and 1949 (1921, 1922, and 1936) and the other two occurrences were in 1955 and 1957 (Figure 2). Similarly, four of the five years tied for the warmest seven-year moving average of minimum temperatures (5.4 °C; Table 1) occurred consecutively between 1952 and 1955 with the fifth occurrence in 2016 (Figure 2). As a result, 1955 had the warmest seven-year moving average temperature (12.1 °C; not shown), which is close to the average temperature observed with warm genera tree species (i.e., 12.35 °C) [25]. Therefore, the regeneration of vast hardwood forests in WV occurred during warm decades when extreme droughts resulted in unprecedented heat across broad swaths of the United States (i.e., 1930s; 1950s) [22,23], which likely favored recruitment of xeric, warm genera species (e.g., oak).
Reduced maximum temperatures combined with increasing precipitation, particularly since the 1960s (Figure 2), may have increased moisture availability to plants in a biologically meaningful way [21]. All three years tied for the coolest seven-year moving average of maximum temperatures (17.3 °C; Table 1) occurred during or after the 1980s (1982, 1997, and 1998) and with only one exception (1991; 18.2 °C), every seven-year period since 1962 had average maximum temperatures below the long-term average (18.1 °C; Table 1). Regression of moving seven-year averages of total annual precipitation in WV indicated a 2.2% (2.4 cm) increase between 1906 (106.9 cm) and 2016 (109.3 cm). On average, approximately 108.1 cm of precipitation fell annually in each seven-year period between 1906 and 2016. The wettest seven-year period since 1906 ended in 2008 (116.0 cm annually) and every seven-year period ending between 1994 and 2016 had more precipitation than the long term average. Thus, below normal maximum temperatures and above normal precipitation has occurred during every seven-year period for more than two decades, which has likely contributed to increased recruitment and regeneration of more mesophytic cool genera species (e.g., maple) [32].
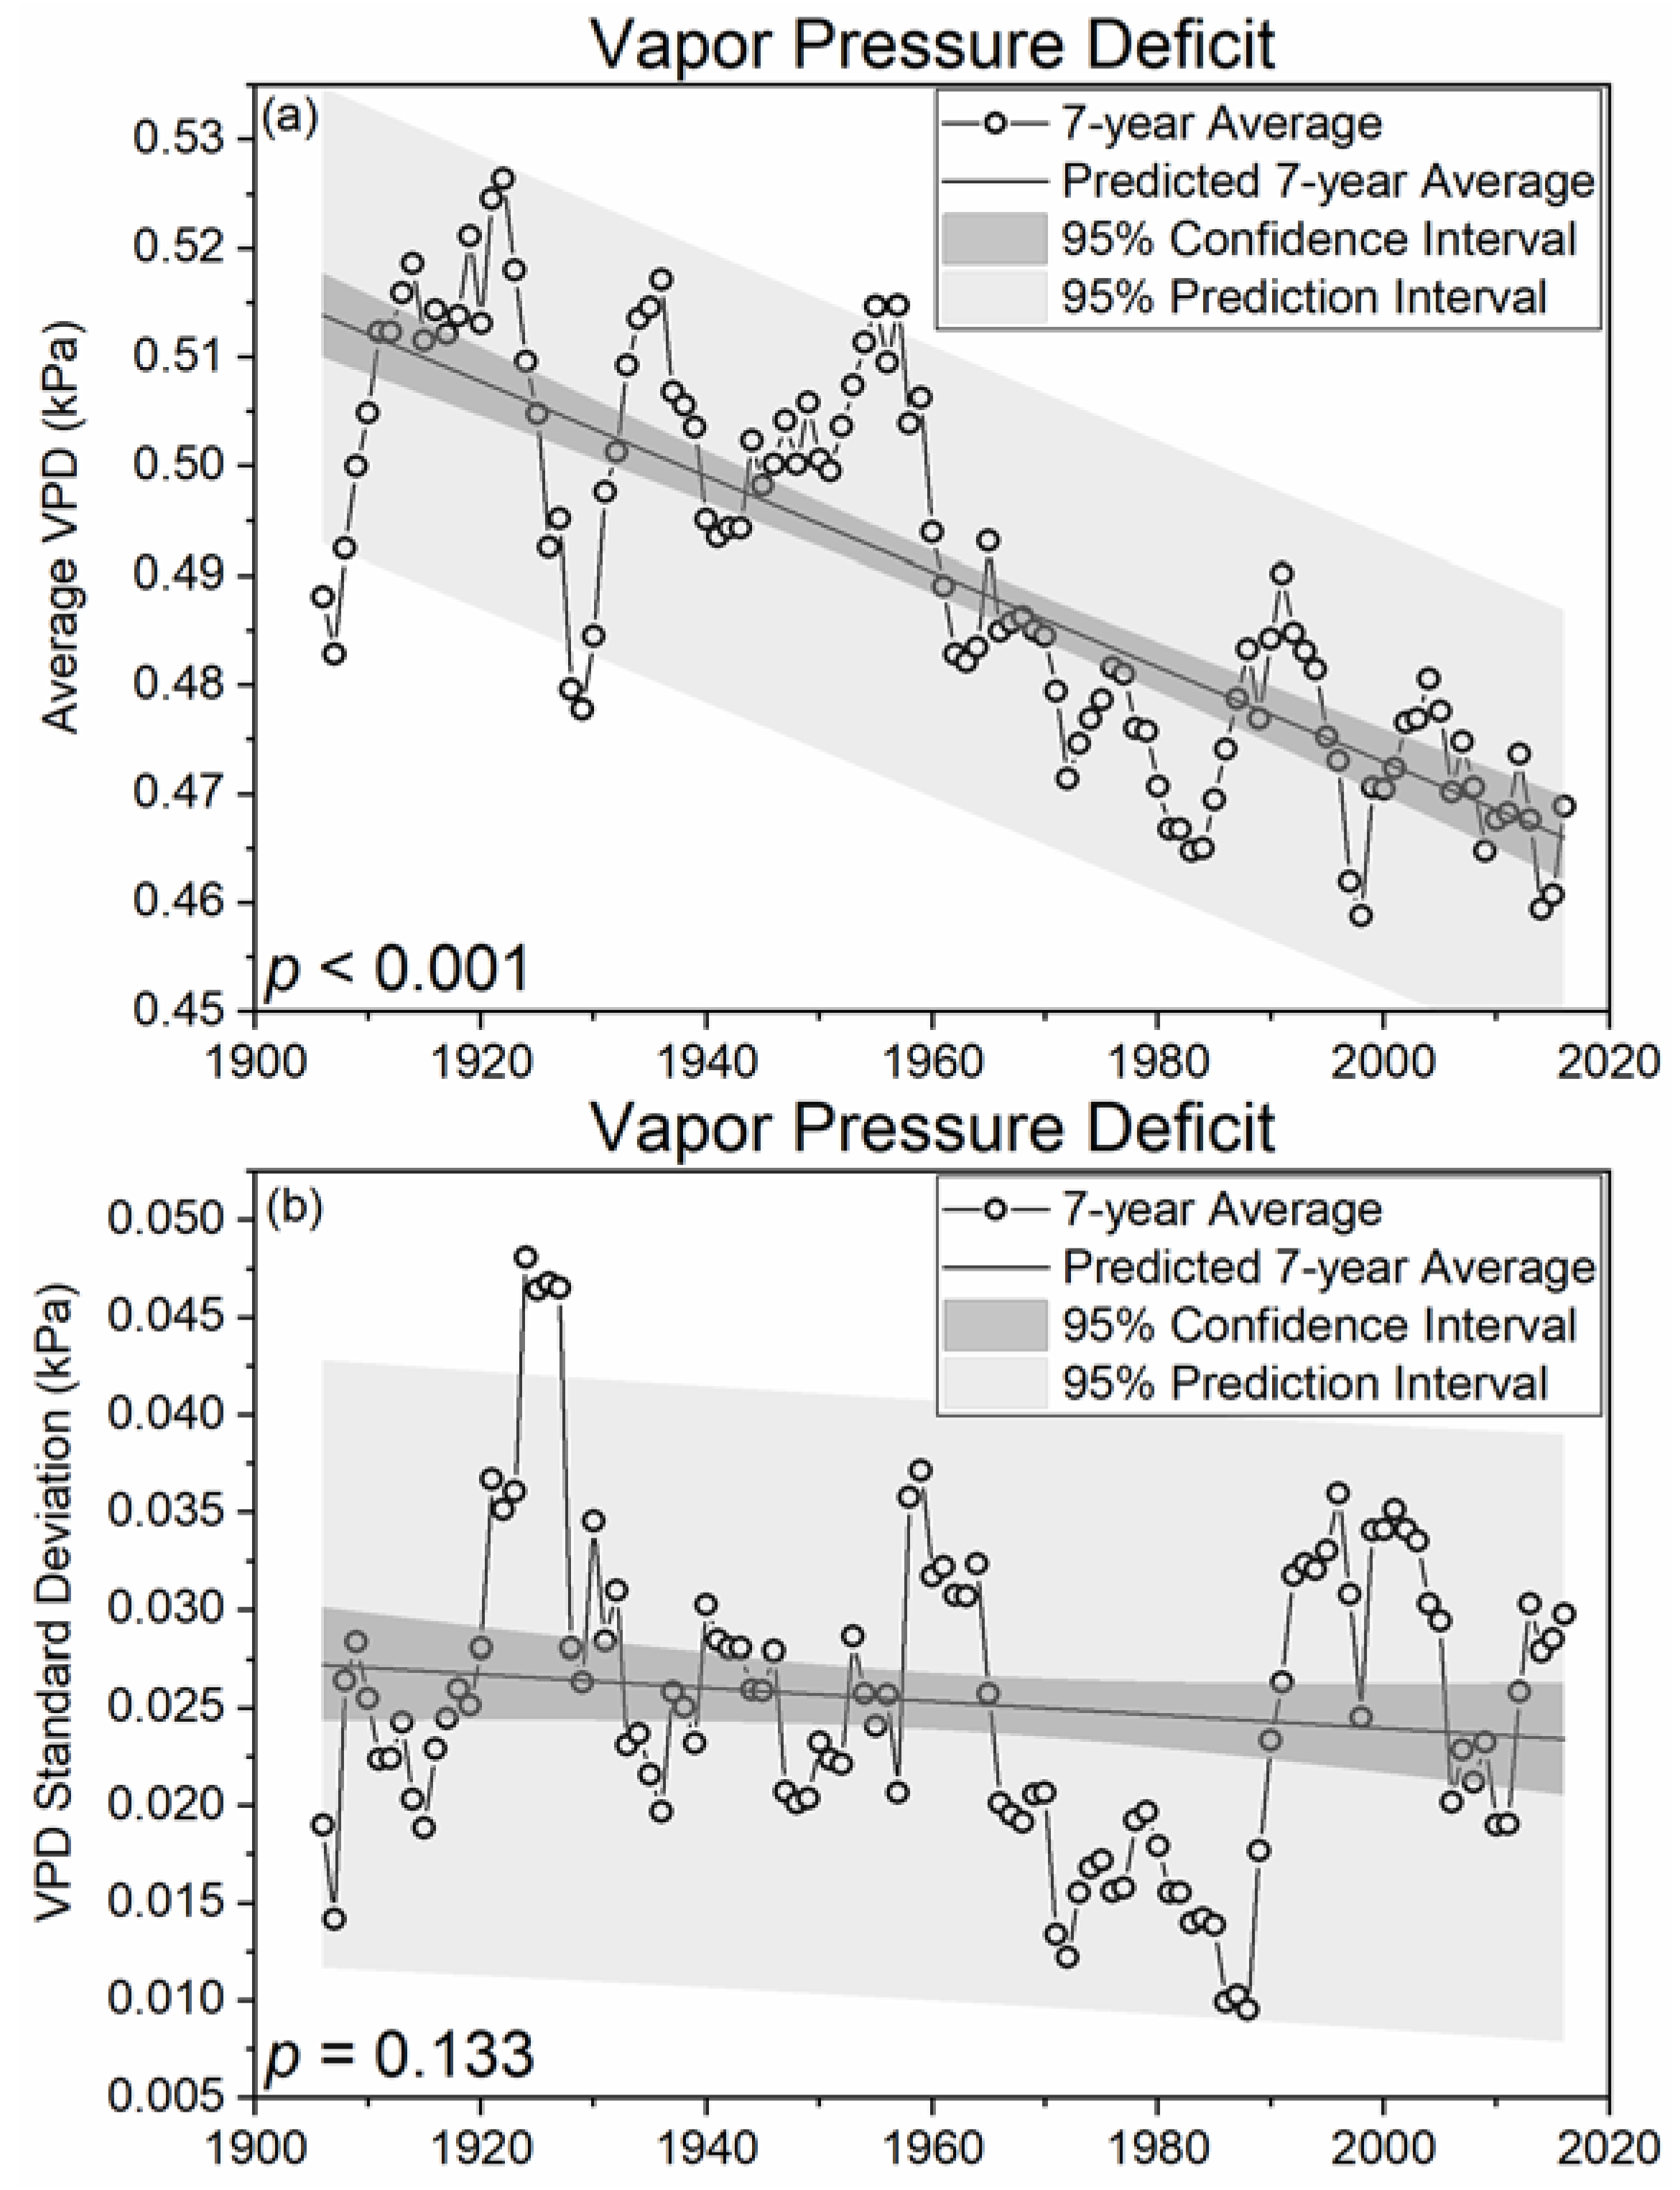
Concerns related to increasing climate variability have risen over the past three decades since many biological systems are more sensitive to climate extremes than gradual changes in climatic averages [45]. In WV the moving seven-year standard deviation of minimum temperatures has decreased significantly (p = 0.042) and variance of maximum temperatures has decreased (Figure 3), indicating that WV’s climate is increasingly temperate with less intra-decadal temperature variability. However, precipitation variability has increased significantly (p = 0.004; Figure 3) indicating less predictability and implying an increasing risk of extreme precipitation events consistent with global trends [3]. Decreasing temperature variance and increasing precipitation variance may be a key driver of changing EDF species composition and biodiversity that also affects ecosystem carbon dynamics and hydrology [4]. In 2003, Greenland et al. hypothesized that ecosystems shift with climate variability producing potent feedback mechanisms that may be exemplified by the mesophication of the eastern EDF and similar forest ecosystems globally. However, ecosystems are rarely dominated by climate variability at one specific timescale, as is presented in this work, indicating a need to further examine climate variability at a variety of timescales using long-term observed datasets. Therefore, an increasingly temperate climate with decreasing temperature variance and increasing precipitation variance implies the greatest threat to WV’s forest ecosystems associated with a warming climate may be from increased soil moisture and ambient relative humidity (i.e., reduced vapor pressure deficit).
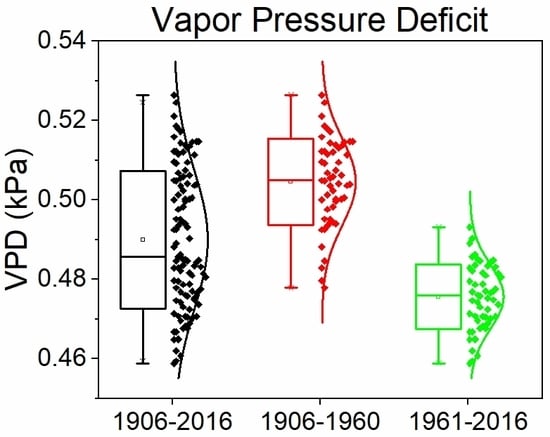
It is commonly assumed that warming temperatures associated with climate change will simultaneously increase vapor pressure deficits (VPD) and stomatal conductance at global scales [52]. However, both low and high VPD values are regarded as detrimental to plant productivity since low VPD values limit stomatal conductance, mineral nutrient uptake, defense against biotic (i.e., pathogens), and abiotic stress factors [10,53,54]. Results of the current work indicate a significant (p < 0.001; Figure 4) 10.3% decrease in VPD and a 16.2% decrease in 7-year moving standard deviations of VPDs between 1906 and 2016. These results indicate a great need to consider changes in humidity to improve understanding of forest health and productivity challenges associated with an increasingly temperate, wetter, and more humid climate. Combined, these observed climatic trends suggest evaporative demand is declining in West Virginia, which contrasts with recent regional modelling studies that showed simultaneous increases in humidity and evaporative demand [55], distinct processes that are physically incongruous. On average, increasing atmospheric water vapor concentrations are reducing the concentration gradient from plant to atmosphere, which may increasingly favor recruitment and regeneration of mesophytic tree species such as maple, beech, and yellow-poplar. Low VPD values may increase vulnerability to antagonistic biotic agents (e.g., Phytophthora and Pythium) that could result in rapid species mortality [10]. Furthermore, reduced wind speeds have been observed in many locations globally, resulting in reduced evaporative demand that could exacerbate changes with an increasingly humid WV climate [56]. Thus, climatic changes in WV may increase abiotic stress for xeric species (i.e., oak) and allow for rapid development of pathogen and fungal-like oomycetes, starkly contrasting impacts to forests of western North America that may continue to experience hotter droughts. These are therefore areas of great and immediate research need to preemptively adapt to emerging challenges posed by multiple interactive disturbance mechanisms including changes in land use, climatic averages and variance, fire frequency, and browser population to ensure the long term sustainability of valuable forest ecosystem services.
4. Summary
During the most recent 150 years, WV’s old growth hardwood forests were cleared for timber extraction, agricultural development (estimated 72% of land area in 1909), and settlement. Subsequent farm abandonment allowed for rapid afforestation (estimated 38% increase) between 1909 and 1949 that gradually slowed until an estimated 79% of WV was forested between 1975 and 2013. The rapid regeneration of WV’s vast hardwood forests occurred during decades when extreme droughts resulted in unprecedented heat across broad swaths of the United States (i.e., 1930s; 1950s), which likely favored recruitment of xerophytic warm genera species (e.g., Quercus spp.). Since the 1960s, West Virginia’s climate became increasingly wet and temperate, characterized by a decreasing diurnal temperature range, reduced temperature variance, and increased precipitation variance. Thus, small increases in annual average temperatures mask significant (p < 0.001) and opposing trends in maximum and minimum temperatures suggesting annual average temperatures are an oversimplification of Appalachian climatic changes. For example, a smaller diurnal temperature range with less variability implies persistently increased cloud cover, which changes above-canopy light quality and may favor shade-tolerant species (e.g., red maple and sugar maple) that are exclusively pyrophobic [25]. Therefore, climatic shifts that increasingly favor mesophytic cool genera species were likely exacerbated by feedbacks associated with afforestation, fire suppression, and increased browser population. As such a great need exists to examine existing climate data using the methods documented here to better understand, anticipate, and adapt to emerging forest health and management challenges in the EDF and other similar forest ecosystems globally.
5. Conclusions
Between 1906 and 2016, West Virginia’s climate became wetter and more temperate with less temperature variability and more precipitation variability. Maximum temperatures decreased significantly (−5.3%; p < 0.001), minimum temperatures increased significantly (7.7%; p < 0.001), and precipitation increased (2.2%; p = 0.107). Relative changes in maximum and minimum temperatures indicate the diurnal temperature range has decreased consistent with significantly reduced (10.3%; p < 0.001) vapor pressure deficits. Combined, reductions in diurnal temperature range and vapor pressure deficit suggest increased relative humidity and cloud cover that may limit evapotranspiration. Additionally, reduced temperature variance indicates changes in diurnal temperature range and estimated VPD were persistent from year-to-year. For example, in the final 30 years of the period of record (1987–2016) the moving seven-year averages of maximum and minimum temperatures were below and above the long term average for 29 and 22 years, respectively. Despite significantly increased precipitation variance (p = 0.004) there were 23 consecutive years (1994–2016) with seven-year moving averages of precipitation above the long term average. Therefore, observed changes in West Virginia’s climate are consistent with increased recruitment and establishment of mesophytic, cool genera, shade tolerant, and pyrophobic species (i.e., mesophication) and historic disturbances may have exacerbated climatic changes.
Supplementary Materials
The following are available online at https://www.mdpi.com/1999-4907/9/10/605/s1, Figure S1: Map of West Virginia—Showing virgin and cut-over forest areas.
Author Contributions
Conceptualization, E.K., J.H.; Data curation, E.K.; Formal analysis, E.K.; Funding acquisition, J.H.; Investigation, E.K.; Methodology, E.K., J.H.; Supervision, J.H.; Visualization, E.K.; Writing—Original draft, E.K.; Writing–Review & Editing, J.H.
Funding
This work was supported by the National Science Foundation under Award Number OIA-1458952, the USDA National Institute of Food and Agriculture, Hatch project 1011536, and the West Virginia Agricultural and Forestry Experiment Station. Results presented may not reflect the views of the sponsors and no official endorsement should be inferred. The funders had no role in study design, data collection and analysis, decision to publish, or preparation of the manuscript.
Acknowledgments
Special thanks are due to multiple anonymous reviewers and many scientists of the Interdisciplinary Hydrology Laboratory (www.forh2o.net).
Conflicts of Interest
The authors declare no conflict of interest.
References
- Vose, R.S.; Easterling, D.R.; Kunkel, K.E.; LeGrande, A.N.; Wehner, M.F. Temperature changes in the United States. Clim. Sci. Spec. Rep. 2017, 1, 185–206. [Google Scholar] [CrossRef]
- Horton, D.E.; Johnson, N.C.; Singh, D.; Swain, D.L.; Rajaratnam, B.; Diffenbaugh, N.S. Contribution of changes in atmospheric circulation patterns to extreme temperature trends. Nature 2015, 522, 465–469. [Google Scholar] [CrossRef] [PubMed] [Green Version]
- Trenberth, K.E. Changes in precipitation with climate change. Clim. Res. 2011, 47, 123–138. [Google Scholar] [CrossRef] [Green Version]
- Greenland, D.; Goodin, D.G.; Smith, R.C. Climate Variability and Ecosystem Response at Long-Term Ecological Research Sites; Oxford University Press: New York, NY, USA, 2003; ISBN 0195150597. [Google Scholar]
- Costanza, R.; de Groot, R.; Sutton, P.; van der Ploeg, S.; Anderson, S.J.; Kubiszewski, I.; Farber, S.; Turner, R.K. Changes in the global value of ecosystem services. Glob. Environ. Chang. 2014, 26, 152–158. [Google Scholar] [CrossRef]
- Millar, C.I.; Stephenson, N.L. Temperate forest health in an era of emerging megadisturbance. Science 2015, 349, 823–826. [Google Scholar] [CrossRef] [PubMed]
- Trumbore, S.; Brando, P.; Hartmann, H. Forest health and global change. Science 2015, 349, 814–818. [Google Scholar] [CrossRef] [PubMed]
- Zell, C.; Hubbart, J.A. Interdisciplinary linkages of biophysical processes and resilience theory: Pursuing predictability. Ecol. Model. 2013, 248, 1–10. [Google Scholar] [CrossRef]
- Bentz, B.J.; Regniere, J.; Fettig, C.J. Climate change and bark beetles of the western United States and Canada: Direct and indirect effects. Bioscience 2010, 60, 602–613. [Google Scholar] [CrossRef]
- Hubbart, J.A.; Guyette, R.; Muzika, R.M. More than drought: Precipitation variance, excessive wetness, pathogens and the future of the western edge of the Eastern Deciduous Forest. Sci. Total Environ. 2016, 566–567, 463–467. [Google Scholar] [CrossRef] [PubMed]
- Augspurger, C.K.; Wilkinson, H.T. Host specificity of pathogenic Pythium species: Implications for tree species diversity. Biotropica 2007, 39, 702–708. [Google Scholar] [CrossRef]
- Reed, S.E.; English, J.T.; Muzika, R.-M.; Kabrick, J.M.; Wright, S. Characteristics of sites and trees affected by rapid white oak mortality. In Proceedings of the 20th Central Hardwood Forest Conference, Columbia, MO, USA, 28 March–1 April 2016. [Google Scholar]
- Reinhart, K.O.; Royo, A.A.; Van Der Putten, W.H.; Clay, K. Soil feedback and pathogen activity in Prunus serotina throughout its native range. J. Ecol. 2005, 93, 890–898. [Google Scholar] [CrossRef] [Green Version]
- Sturrock, R.N.; Frankel, S.J.; Brown, A.V.; Hennon, P.E.; Kliejunas, J.T.; Lewis, K.J.; Worrall, J.J.; Woods, A.J. Climate change and forest diseases. Plant Pathol. 2011, 60, 133–149. [Google Scholar] [CrossRef] [Green Version]
- Anagnostakis, S.L. Chestnut blight: The classical problem of an introduced pathogen. Mycologia 1987, 79, 23. [Google Scholar] [CrossRef]
- Cale, J.A.; Teale, S.A.; Johnston, M.T.; Boyer, G.L.; Perri, K.A.; Castello, J.D. New ecological and physiological dimensions of beech bark disease development in aftermath forests. For. Ecol. Manag. 2015, 336, 99–108. [Google Scholar] [CrossRef]
- Kauffman, B.W.; Clatterbuck, W.K.; Liebhold, A.M.; Coyle, D.R. Gypsy Moth in the Southeastern U.S.: Biology, Ecology, and Forest Management Strategies; U.S. Department of Agriculture, Forest Service, Southern Regional Extension Forestry: Athens, GA, USA, 2017.
- Herms, D.A.; McCullough, D.G. Emerald ash borer invasion of North America: History, biology, ecology, impacts, and management. Annu. Rev. Entomol. 2014, 59, 13–30. [Google Scholar] [CrossRef] [PubMed]
- Kim, J.; Hwang, T.; Schaaf, C.L.; Orwig, D.A.; Boose, E.; Munger, J.W. Increased water yield due to the hemlock woolly adelgid infestation in New England. Geophys. Res. Lett. 2017, 44, 2327–2335. [Google Scholar] [CrossRef]
- Wayne, C. Palmer Meteorological Drought. Available online: https://www.ncdc.noaa.gov/temp-and-precip/drought/docs/palmer.pdf (accessed on 1 August 2018).
- Mcewan, R.W.; Dyer, J.M.; Pederson, N. Multiple interacting ecosystem drivers: Toward an encompassing hypothesis of oak forest dynamics across eastern North America. Ecography 2011, 34, 244–256. [Google Scholar] [CrossRef]
- Cook, B.I.; Miller, R.L.; Seager, R. Amplification of the North American “Dust Bowl” drought through human-induced land degradation. Proc. Natl. Acad. Sci. USA 2009, 106, 4997–5001. [Google Scholar] [CrossRef] [PubMed]
- Cook, E.R.; Seager, R.; Cane, M.A.; Stahle, D.W. North American drought: Reconstructions, causes, and consequences. Earth Sci. Rev. 2007, 81, 93–134. [Google Scholar] [CrossRef]
- Herweijer, C.; Seager, R.; Cook, E.R.; Emile-Greay, J. North American droughts of the last millennium from a gridded network of tree-ring data. J. Clim. 2007, 20, 1353–1376. [Google Scholar] [CrossRef]
- Nowacki, G.J.; Abrams, M.D. Is climate an important driver of post-European vegetation change in the Eastern United States? Glob. Chang. Biol. 2015, 21, 314–334. [Google Scholar] [CrossRef] [PubMed]
- Lewis, R.L. Transforming the Appalachian Countryside Railroads, Deforestation, and Social Change in West Virginia, 1880–1920; The University of North Carolina Press: Chapel Hill, NC, USA, 1998; ISBN 9780807847060. [Google Scholar]
- Redding, J. History of deer population trends and forest cutting on the Allegheny National Forest. In Proceedings of the 10th Central Hardwood Forest Conference, Morgantown, WV, USA, 5–8 March 1995. [Google Scholar]
- Prasad, A.; Iverson, L.; Matthews, S.; Peters, M. A Climate Change Atlas for 134 Forest Tree Species of the Eastern United States (Database); U.S. Department of Agriculture, Forest Service, Northern Research Station: Delaware, OH, USA, 2007.
- Hurst, D.M. Ecological Classification and Gradient Analysis in the Monongahela National Forest; Pennsylvania State University: State College, PA, USA, 1994. [Google Scholar]
- Abrams, M.D.; McCay, D.M. Vegetation-site relationships of witness trees (1780–1856) in the presettlement forests of eastern West Virginia. Can. J. For. Res. 1996, 26, 217–224. [Google Scholar] [CrossRef]
- Rentch, J.S.; Hicks, R.R.J. Changes in presettlement forest composition for five areas in the central hardwood forest, 1784–1990. Nat. Areas J. 2005, 25, 228–238. [Google Scholar]
- Morin, R.S.; Cook, G.W.; Barnett, C.J.; Butler, B.J.; Crocker, S.J.; Hatfield, M.A.; Kurtz, C.M.; Lister, T.W.; Luppold, W.G.; McWilliams, W.H.; et al. West Virginia Forests 2013. Available online: https://www.nrs.fs.fed.us/pubs/52444 (accessed on 30 August 2016).
- Guyette, R.P.; Dey, D.C.; Stambaugh, M.C. Fire and human history of a barren-forest mosaic in southern Indiana. Am. Midl. Nat. 2003, 149, 21–34. [Google Scholar] [CrossRef]
- Denevan, W.M. The pristine myth: The landscape of the Americas in 1492. Ann. Assoc. Am. Geogr. 1992, 82, 369–385. [Google Scholar] [CrossRef]
- Abrams, M.D. The demise of fire and “ mesophication ” of forests in the eastern United States. Bioscience 2008, 58, 123–138. [Google Scholar] [CrossRef]
- Whitney, G.G. Fifty years of change in the arboreal vegetation of Heart’s Content, an old-growth hemlock-white pine-northern hardwood stand. Ecology 1984, 65, 403–408. [Google Scholar] [CrossRef]
- Mladenoff, D.J.; Stearns, F. Eastern hemlock regeneration and deer browsing in the northern Great Lakes region: A re-examination and model simulation. Conserv. Biol. 1993, 7, 889–900. [Google Scholar] [CrossRef]
- Birdsey, R.; Pregitzer, K.; Lucier, A. Forest carbon management in the United States. J. Environ. Qual. 2006, 35, 1461. [Google Scholar] [CrossRef] [PubMed]
- Curtis, P.S.; Hanson, P.J.; Bolstad, P.; Barford, C.; Randolph, J.C.; Schmid, H.P.; Wilson, K.B. Biometric and eddy-covariance based estimates of annual carbon storage in five eastern North American deciduous forests. Agric. For. Meteorol. 2002, 113, 3–19. [Google Scholar] [CrossRef] [Green Version]
- Bones, J. The Forest Resources of West Virginia; U.S. Department of Agriculture, Forest Service, Northeastern Forest Experiment Station: Broomall, PA, USA, 1978.
- Zhang, T.; Niinemets, Ü.; Sheffield, J.; Lichstein, J.W. Shifts in tree functional composition amplify the response of forest biomass to climate. Nature 2018, 556, 99–102. [Google Scholar] [CrossRef] [PubMed]
- Baddour, O.; Kontongomde, H. The Role of Climatological Normals in a Changing Climate. Available online: https://library.wmo.int/doc_num.php?explnum_id=4546 (accessed on 27 September 2018).
- Detto, M.; Wright, S.J.; Calderón, O.; Muller-Landau, H.C. Resource acquisition and reproductive strategies of tropical forest in response to the El Niño-Southern Oscillation. Nat. Commun. 2018, 9, 913. [Google Scholar] [CrossRef] [PubMed]
- Trenberth, K.E.; Branstator, G.W.; Karoly, D.; Kumar, A.; Lau, N.-C.; Ropelewski, C. Progress during TOGA in understanding and modeling global teleconnections associated with tropical sea surface temperatures. J. Geophys. Res. Ocean. 1998, 103, 14291–14324. [Google Scholar] [CrossRef] [Green Version]
- Frank, D.; Reichstein, M.; Bahn, M.; Thonicke, K.; Frank, D.; Mahecha, M.D.; Smith, P.; van der Velde, M.; Vicca, S.; Babst, F.; et al. Effects of climate extremes on the terrestrial carbon cycle: Concepts, processes and potential future impacts. Glob. Chang. Biol. 2015, 21, 2861–2880. [Google Scholar] [CrossRef] [PubMed] [Green Version]
- Kimball, J.S.; Running, S.W.; Nemani, R. An improved method for estimating surface humidity from daily minimum temperature. Agric. For. Meteorol. 1997, 85, 87–98. [Google Scholar] [CrossRef]
- Buck, A.L. New equations for computing vapor pressure and enhancement factor. J. Appl. Meteorol. 1981, 20, 1527–1532. [Google Scholar] [CrossRef]
- Allen, J. NASA Image Based on Data from the MODIS Rapid Response Team, Goddard Space Flight Center. Available online: https://earthobservatory.nasa.gov/images/8344/mining-permits-across-west-virginia (accessed on 1 August 2018).
- Dai, A.; Trenberth, K.E.; Karl, T.R. Effects of clouds, soil moisture, precipitation, and water vapor on diurnal temperature range. J. Clim. 1999, 12, 2451–2473. [Google Scholar] [CrossRef]
- Carter, R.E.; Klinka, K. Variation in shade tolerance of Douglas fir, western hemlock, and western red cedar in coastal British Columbia. For. Ecol. Manag. 1992, 55, 87–105. [Google Scholar] [CrossRef]
- Brose, P.; Schuler, T.; Van Lear, D.; Berst, J. Bringing fire back: The changing regimes of the Appalachian mixed-oak forests. J. For. 2001, 99, 30–35. [Google Scholar] [CrossRef]
- Novick, K.A.; Ficklin, D.L.; Stoy, P.C.; Williams, C.A.; Bohrer, G.; Oishi, A.C.; Papuga, S.A.; Blanken, P.D.; Noormets, A.; Sulman, B.N.; et al. The increasing importance of atmospheric demand for ecosystem water and carbon fluxes. Nat. Clim. Chang. 2016, 6, 1023–1027. [Google Scholar] [CrossRef] [Green Version]
- Lihavainen, J.; Ahonen, V.; Keski-Saari, S.; Sõber, A.; Oksanen, E.; Keinänen, M. Low vapor pressure deficit reduces glandular trichome density and modifies the chemical composition of cuticular waxes in silver birch leaves. Tree Physiol. 2017, 37, 1166–1181. [Google Scholar] [CrossRef] [PubMed]
- Oksanen, E.; Lihavainen, J.; Keinänen, M.; Keski-Saari, S.; Kontunen-Soppela, S.; Sellin, A.; Sõber, A. Northern Forest Trees Under Increasing Atmospheric Humidity; Springer: Heidelberg, Germany, 2018; Volume 79, pp. 1–20. [Google Scholar]
- Gaertner, B.A.; Zegre, N.; Warner, T.; Fernandez, R.; He, Y.; Merriam, E.R. Climate, forest growing season, and evapotranspiration changes in the central Appalachian Mountains, USA. Sci. Total Environ. 2019, 650, 1371–1381. [Google Scholar] [CrossRef]
- McVicar, T.R.; Roderick, M.L.; Donohue, R.J.; Li, L.T.; Van Niel, T.G.; Thomas, A.; Grieser, J.; Jhajharia, D.; Himri, Y.; Mahowald, N.M.; et al. Global review and synthesis of trends in observed terrestrial near-surface wind speeds: Implications for evaporation. J. Hydrol. 2012, 416–417, 182–205. [Google Scholar] [CrossRef]
Figure 1.
Observed climate record site locations in West Virginia, USA. Satellite image credit: National Aeronautics and Space Administration (NASA; [48]).
Figure 1.
Observed climate record site locations in West Virginia, USA. Satellite image credit: National Aeronautics and Space Administration (NASA; [48]).

Figure 2.
Seven-year moving averages of state averaged (n = 18) maximum temperature ((a); °C), minimum temperature ((b); °C), and total annual precipitation ((c); cm) for West Virginia, USA.
Figure 2.
Seven-year moving averages of state averaged (n = 18) maximum temperature ((a); °C), minimum temperature ((b); °C), and total annual precipitation ((c); cm) for West Virginia, USA.

Figure 3.
Seven-year standard deviations of state averaged (n = 18) maximum temperature ((a); °C), minimum temperature ((b); °C), and total annual precipitation ((c); cm) for West Virginia, USA.
Figure 3.
Seven-year standard deviations of state averaged (n = 18) maximum temperature ((a); °C), minimum temperature ((b); °C), and total annual precipitation ((c); cm) for West Virginia, USA.

Figure 4.
Seven-year moving averages (a) and standard deviations (b) of state averaged (n = 18) vapor pressure deficits (VPD; kPa) for West Virginia, USA.
Figure 4.
Seven-year moving averages (a) and standard deviations (b) of state averaged (n = 18) vapor pressure deficits (VPD; kPa) for West Virginia, USA.


Table 1.
Descriptive statistics of moving seven-year averages and seven-year standard deviations of maximum temperature (°C), minimum temperature (°C), and precipitation (cm) in West Virginia, USA. The slope (change per decade) of linear regressions were included.
Table 1.
Descriptive statistics of moving seven-year averages and seven-year standard deviations of maximum temperature (°C), minimum temperature (°C), and precipitation (cm) in West Virginia, USA. The slope (change per decade) of linear regressions were included.
| Min | Median | Max | Mean | St Dev | Trend | ||
|---|---|---|---|---|---|---|---|
| 7-year Moving Average | Max | 17.3 | 18.0 | 18.8 | 18.1 | 0.4 | −0.085 * |
| Min | 4.0 | 4.9 | 5.4 | 4.8 | 0.4 | 0.035 * | |
| Precip. | 95.0 | 108.8 | 116.0 | 108.1 | 4.6 | 0.218 | |
| VPD | 0.459 | 0.486 | 0.526 | 0.490 | 0.017 | −4.35 × 10⁻⁴ * | |
| 7-year Moving St Dev | Max | 0.2 | 0.7 | 1.3 | 0.7 | 0.2 | −0.010 |
| Min | 0.1 | 0.6 | 1.1 | 0.6 | 0.2 | −0.010 * | |
| Precip. | 4.3 | 11.8 | 22.5 | 12.6 | 4.2 | 0.352 * | |
| VPD | 0.010 | 0.025 | 0.048 | 0.025 | 0.008 | −3.46 × 10⁻⁵ |
Max = Maximum, Min = Minimum, St Dev = Standard Deviation, Precip. = Precipitation, VPD = Vapor Pressure Deficit, * = significant trend (p < 0.05).
© 2018 by the authors. Licensee MDPI, Basel, Switzerland. This article is an open access article distributed under the terms and conditions of the Creative Commons Attribution (CC BY) license (http://creativecommons.org/licenses/by/4.0/).
Share and Cite
MDPI and ACS Style
Kutta, E.; Hubbart, J.A. Changing Climatic Averages and Variance: Implications for Mesophication at the Eastern Edge of North America’s Eastern Deciduous Forest. Forests 2018, 9, 605. https://doi.org/10.3390/f9100605
AMA Style
Kutta E, Hubbart JA. Changing Climatic Averages and Variance: Implications for Mesophication at the Eastern Edge of North America’s Eastern Deciduous Forest. Forests. 2018; 9(10):605. https://doi.org/10.3390/f9100605
Chicago/Turabian StyleKutta, Evan, and Jason A. Hubbart. 2018. "Changing Climatic Averages and Variance: Implications for Mesophication at the Eastern Edge of North America’s Eastern Deciduous Forest" Forests 9, no. 10: 605. https://doi.org/10.3390/f9100605
Note that from the first issue of 2016, this journal uses article numbers instead of page numbers. See further details here.