Article

Short-Term Vegetation Responses to Invasive Shrub Control Techniques for Amur Honeysuckle (Lonicera maackii [Rupr.] Herder)

by
Graham S. Frank
1,2,*,
Michael R. Saunders
1,2 and
Michael A. Jenkins
1,2
1
Department of Forestry and Natural Resources, Purdue University, 715 W. State St., West Lafayette, IN 47907, USA
2
Hardwood Tree Improvement and Regeneration Center (HTIRC), 715 W. State St., West Lafayette, IN 47907, USA
*
Author to whom correspondence should be addressed.
Forests 2018, 9(10), 607; https://doi.org/10.3390/f9100607
Submission received: 27 August 2018 / Revised: 25 September 2018 / Accepted: 27 September 2018 / Published: 30 September 2018
(This article belongs to the Special Issue Hardwood Reforestation and Restoration)

Abstract

:
Invasive shrubs in forest understories threaten biodiversity and forest regeneration in the eastern United States. Controlling these extensive monotypic shrub thickets is a protracted process that slows the restoration of degraded forest land. Invasive shrub removal can be accelerated by using forestry mulching heads, but evidence from the western United States indicates that mulching heads can promote exotic species establishment and mulch deposition can reduce native plant species abundance. We compared the effectiveness of the mulching head and the “cut-stump” method for controlling the invasive shrub Amur honeysuckle (Lonicera maackii), as well as their impacts on native plant community recovery, in mixed-hardwood forests of Indiana. After two growing seasons, mulching head treatment resulted in greater L. maackii regrowth and regeneration. The recovery of native plant abundance and diversity following shrub removal did not differ between the two methods. However, mulch deposition was associated with increased abundance of garlic mustard (Alliaria petiolata), an invasive forb. Increasing mulching head treatment depth reduced L. maackii regrowth, but additional study is needed to determine how it affects plant community responses. The mulching head is a promising technique for invasive shrub control and investigating tradeoffs between reducing landscape-scale propagule pressure and increased local establishment will further inform its utility.

1. Introduction

Throughout the eastern United States, invasive woody shrubs are nearly ubiquitous in hardwood forest understories and pose a serious threat to successful forest management and restoration [1]. Examples of these invasive shrubs—mostly introduced in the late 18th to late 19th centuries—include numerous species of bush honeysuckle (Lonicera spp.) as well as Japanese barberry (Berberis thunbergii DC.), burning bush (Euonymus alatus [Thunb.] Siebold), and others. Proliferations of these invasive shrubs can change forest structure by forming dense monotypic thickets in the understory [2]. These thickets pose a threat to forest health by inhibiting native tree regeneration [3,4] and reducing the cover and diversity of herbaceous plants [5]. Structural change in the understory vegetation also affects wildlife, such as promoting seed predation, with implications for forest regeneration and biodiversity [6,7,8]. Controlling dense, well-established populations of invasive shrubs is both expensive and time consuming. For example, between 1994 and 2005, workers in Great Smoky Mountains National Park spent over 17,000 h controlling woody invasive plants [1]. Minimizing time and resources allocated to such efforts will depend on developing techniques to expedite the control of mature populations of invasive shrubs that have reached the saturation phase of invasion.
Controlling invasive shrubs is challenging because it not only requires the mechanical cutting of stems but also retreating the vigorous stump sprouting that occurs after cutting [9]. Clearing saws are frequently used to cut invasive shrubs due to their affordability, ease of use, and limited collateral damage. However, the follow-up treatment of resprouts with herbicides can be both time consuming and cost prohibitive [10]. Mulching treatments conducted with rotary mulching heads (i.e., forestry heads, mastication heads, or wood shredders; hereafter “mulching heads”) are an alternative method that may accelerate shrub removal in dense thickets. Mulching heads are capable of shattering root collars (MRS pers. obs.), which can reduce resprouting [11] and may in turn reduce the need for herbicide treatments. According to Ward et al. [12], mulching head treatments were slightly more effective than clearing saws with no stump treatment for controlling the thicket-forming invasive shrub Japanese barberry, though comparisons with clearing saw removal should include the widely-recommended herbicide application to cut stumps (henceforth “cut-stump” method; [1]). For controlling Chinese privet (Ligustrum sinense Lour.), an invasive evergreen shrub found primarily in riparian areas of the southeastern United States, both techniques resulted in rapid regrowth the following year [13].
In addition to effectiveness and cost-efficiency, impacts on the native understory community must be considered when evaluating removal techniques [14]. Effective restoration requires control techniques that efficiently remove shrubs without degrading native plant populations or promoting further invasive species establishment [15,16,17]. Because the effectiveness of mulching heads in reducing shrub survival depends on shattering the root collar, using this equipment may result in substantial soil disturbance and damage to the roots and rhizomes of native perennials. While Luken et al. [18] found that experimental soil disturbance within small gaps (5 m diameter) created in honeysuckle thickets did not affect understory plant communities, large-scale control efforts may increase light availability to a greater extent, compounding the effects of substrate disturbance.
Mulching head treatments also deposit a layer of woody debris on the forest floor. This mulch layer may inhibit native plant cover and diversity through physical effects on understory species [19] but may also reduce future reinvasion of invasive shrubs. Thick layers of litter have been shown to limit the establishment of Amur honeysuckle (Lonicera maackii [Rupr.] Herder (Caprifoliaceae); hereafter “honeysuckle”) as well as garlic mustard (Alliaria petiolata [M. Bieb.] Cavara & Grande), an invasive biennial forb frequently promoted by honeysuckle removal [17,20,21,22]. However, previous research has not determined whether inputs of mulch act similarly to thick litter layers in inhibiting the establishment of invasive shrubs in eastern hardwood forests.
Few studies have examined the effects of mulching head treatments on understory plant communities or compared its effects to those of cut-stump treatments, and none have distinguished the individual and interactive effects of substrate disturbance and mulch deposition from this technique on plant community recovery. Existing studies found greater non-native herbaceous cover following cut-stump removal of Japanese barberry [12] and greater re-establishment of Chinese privet after mulching head treatment [16] but otherwise similar plant community recovery between the two treatments. While these studies provide valuable information about plant community response to different treatments, additional evidence from systems with different dominant invasives, climate regimes, and native plant communities is necessary to tailor control techniques for specific restoration prescriptions.
Amur honeysuckle is a strong candidate for examining the efficacy of mulching head treatments and their effects on understory flora due to its tendency to form dense thickets [23]. This species is highly invasive in eastern hardwood forests, where it is widely dispersed by birds and deer [24,25], readily establishes along forest edges and in young stands [26], and can enter the expansion phase of population growth within 10 to 15 years [27], posing a challenge for control efforts. Honeysuckle is a strong competitor, in part due to its efficient resource use and long leaf phenology relative to native counterparts [28,29].
The primary objective of this study was to examine how understory plant communities respond to honeysuckle removal using mulching head treatments as compared to the currently recommended cut-stump method. Within this primary objective, we aimed to: (1) compare the effectiveness of the two methods at reducing honeysuckle cover and densities; (2) compare the effects of each method on native herbaceous plants, native woody seedlings, recruitment of new honeysuckle seedlings, and other exotic plant species; and (3) isolate the effects of mulch deposition from those of soil disturbance on the community structure of understory flora. We expected that both honeysuckle removal methods would increase understory diversity and cover but that herbaceous cover would be reduced by mulch deposition and that increases in herbaceous diversity would be primarily driven by exotic and ruderal species. We also expected that soil disturbance from the mulching head treatment would increase honeysuckle seedling densities and garlic mustard cover but that these effects would be mitigated by mulch deposition.

2. Methods

2.1. Study Area

Study sites were situated in mature secondary mixed-hardwood forests within the Central Till Plain region of Indiana at two locations near West Lafayette, Indiana—(1) Purdue University, Richard G. Lugar Forestry Farm (hereafter LF) and (2) Purdue University, Wildlife Area (hereafter PWA). Both locations consist of natural forest tracts intermixed with tree plantations and/or tallgrass prairie and are surrounded by an agricultural matrix. Mature L. maackii invasions formed dense thickets in the understories at all four sites. Prior to this study, none of the study sites had been treated for invasive plants. Estimated L. maackii establishment at each site was 30, 37, 33, and 25 years prior to the commencement of the study at the three sites at LF (LF1, LF2, LF3), and the site at PWA, respectively, based on annual growth rings from stem cross-sections collected at ground height from the five largest individuals at each site. Pretreatment density L. maackii stems >1.37 m tall ranged from 2104 stems ha−1 at PWA to 6729 stems ha−1 at LF2. Mean (±standard error) L. maackii cover in the 1–5 m stratum at each site ranged from 57.7% ± 6.8% at LF3 to 67.7% ± 5.3% at PWA. We selected sites that each had a component of Quercus L. spp. (oaks) and Carya Nutt. spp. (hickories) in the overstory, and each site also included Acer L. spp. (maples) and Prunus serotina Ehrh. (black cherry) in the overstory (Table 1). All sites were flat to gently sloping. Soils at LF sites are primarily Miami silt loams with some Kalamazoo and Ockley silt loams; PWA soils are Miami and Rainsville silt loams [30].

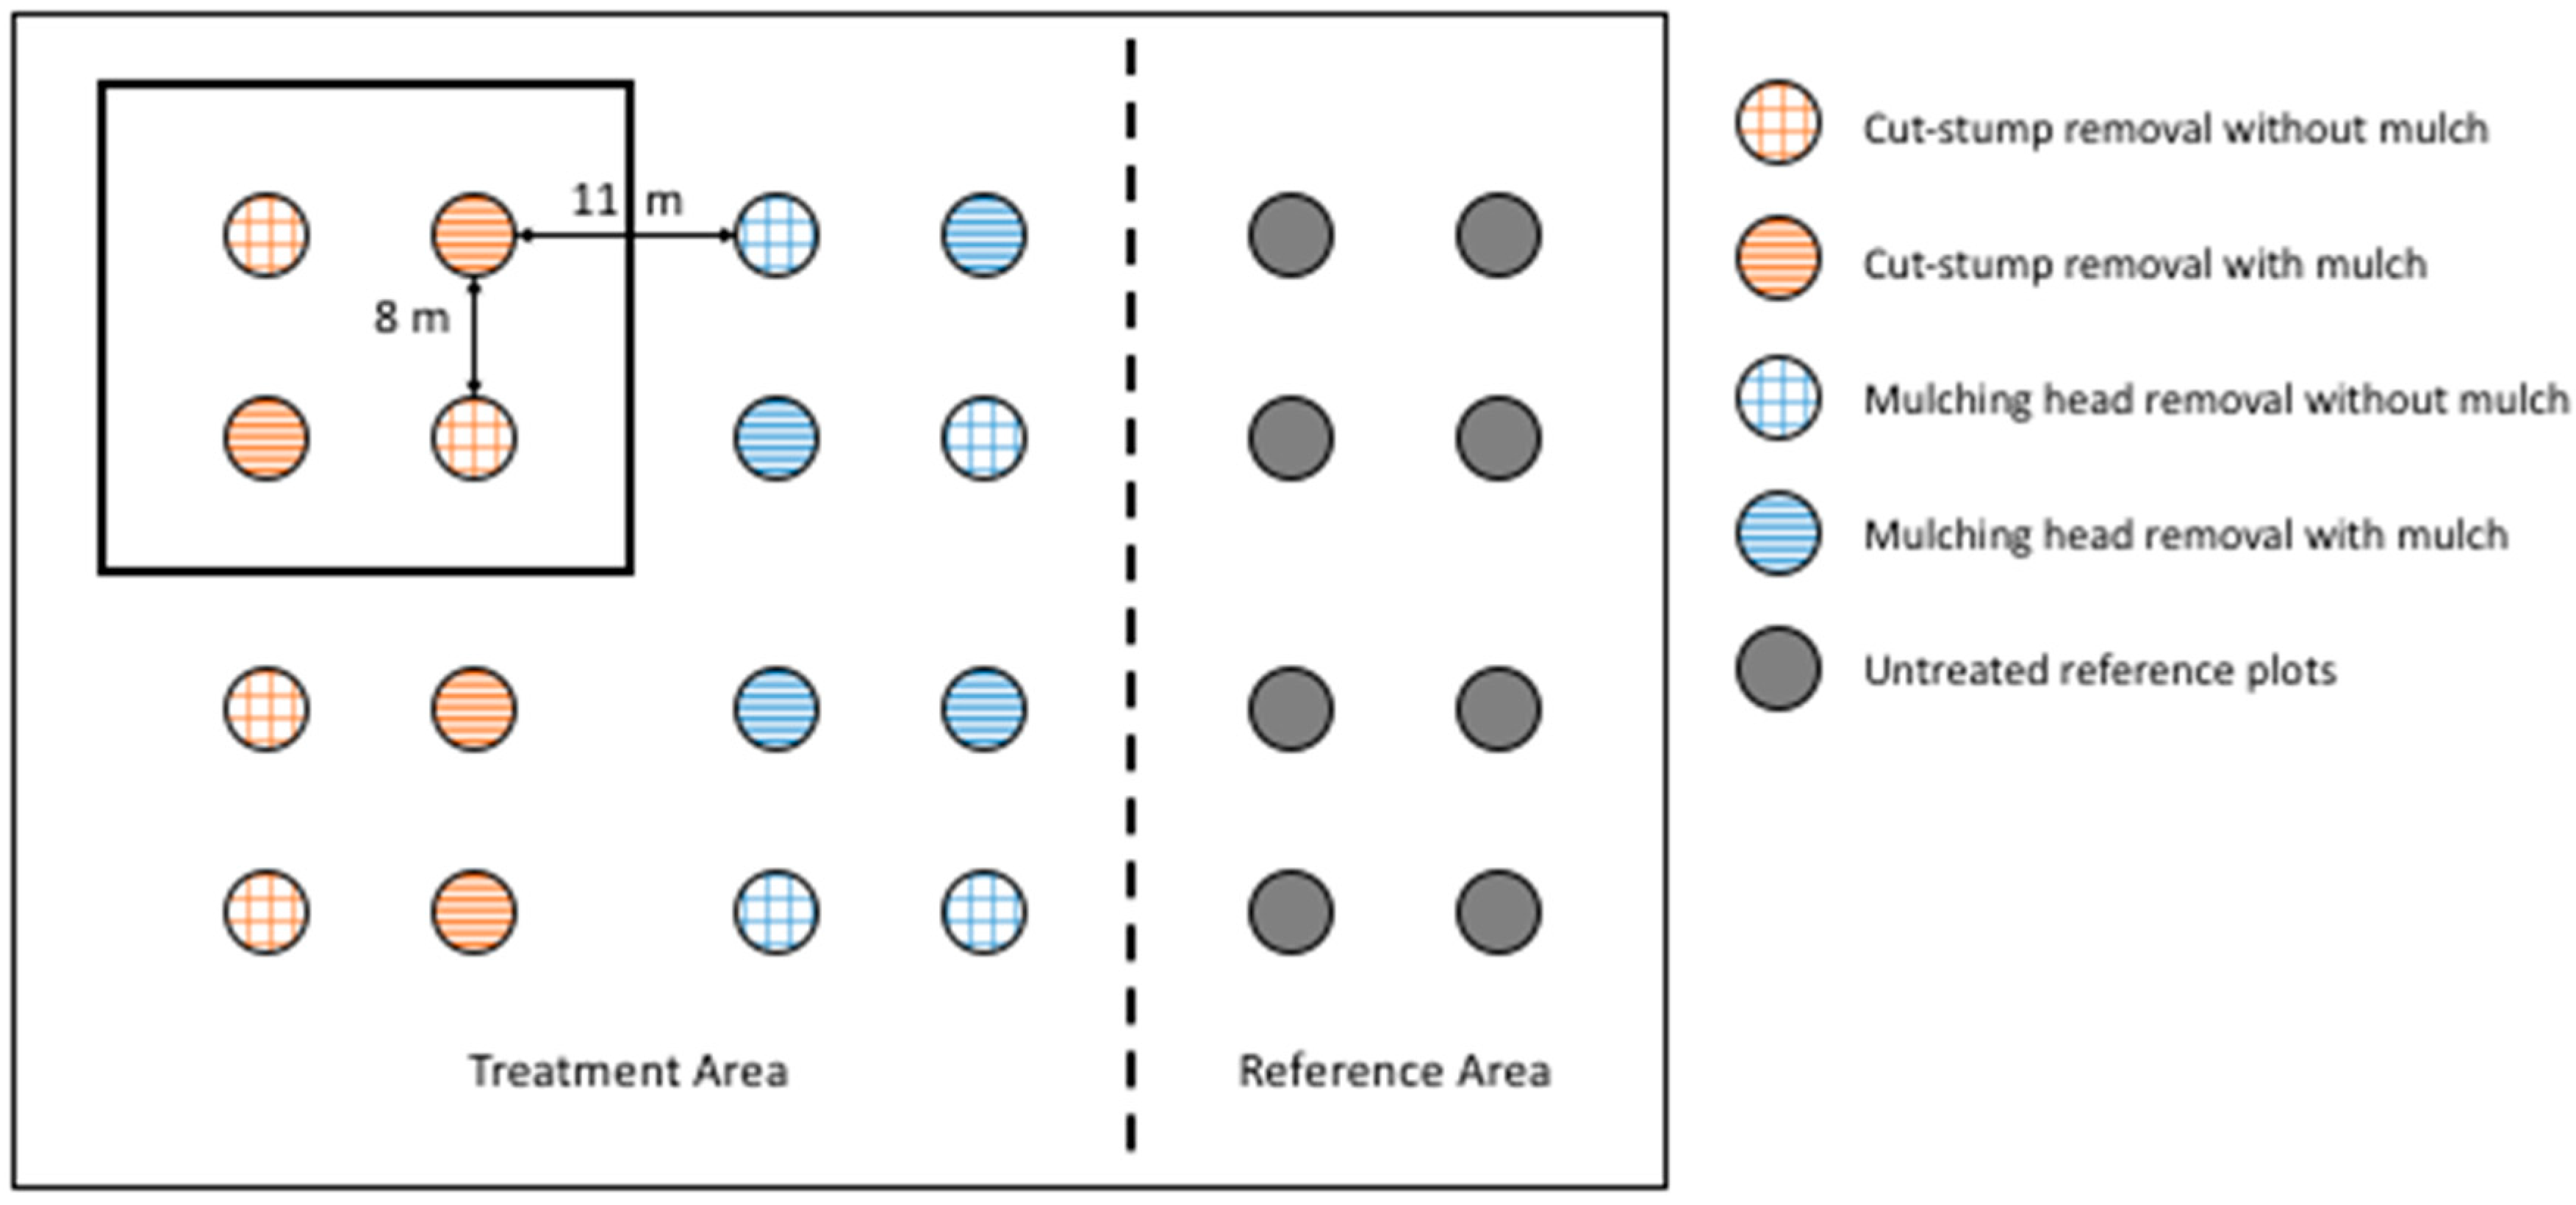
2.2. Experimental Design

Each study site contained a total of 24 vegetation monitoring plots arranged on a grid, consisting of 16 treatment plots and eight untreated reference plots. Plots were grouped into clusters of four, which would all receive the same honeysuckle removal treatment, in order to provide a buffer between different removal methods. Within groups of four plots, plot center points were placed 8 m apart. The nearest adjacent plot center points between separate four-plot groups were 11 m apart (Figure 1). Initial plot placement was randomly selected, with the constraint that the entire grid would be at least 10 m from any forest edge or previously-treated honeysuckle removal areas. Reference plots at each site were grouped together to avoid unintentional disturbance during honeysuckle removal but were randomly assigned to one side or the other of the experimental plots.
We randomly assigned one of two honeysuckle removal treatments—either “cut-stump” or “mulching head” removal—to each four-plot group such that each site had eight plots of each removal treatment. The cut-stump treatment consisted of cutting shrubs at the base with a gas-powered clearing saw and treating the resulting stumps with a volume-based herbicide mix of 15% triclopyr (Garlon 4 Ultra®; DowAgroSciences, Indianapolis, IN, USA), 3% imazypyr (Stalker®; BASF, Florham Park, NJ, USA), and 82% bark oil (Ax-It®; Townsend Corporation, Muncie, IN, USA) using a hand sprayer. We removed honeysuckle slash to avoid altering the light environment or physically obstructing browsing. Mulching head removal treatments were accomplished using a skidsteer-mounted forestry mulching head (Bull Hog®; Fecon Inc., Lebanon, OH, USA), attempting to clear honeysuckle shrubs as thoroughly as possible while avoiding incidental damage to native saplings and overstory trees. We removed any residual honeysuckle stems missed by the mulching head due to their proximity with native trees using a clearing saw but did not treat these with herbicide. Honeysuckle removal took place between 13 November and 4 December 2015.
To isolate the effects of mulch deposition from those of substrate disturbance by the mulching head, we added or removed mulch at two randomly selected plots within each four-plot treatment group. We took four measurements of mulch thickness at each mulching head treatment plot prior to mulch manipulations and attempted to replicate the highest site average depth of 2.5 cm across all mulched plots. Mulch additions were made primarily with woodchips from honeysuckle removed from cut-stump plots but included a small proportion of black cherry to imitate residual mulch from mulching head treatments.

2.3. Vegetation Sampling

We monitored understory plant communities at each plot prior to honeysuckle removal in 2015 and following removal in both 2016 and 2017 to directly estimate changes in community composition. We sampled spring perennials in late April to early May, which were defined as native perennial forbs that flower primarily from April to June [31]. We then conducted a thorough sampling of all plant taxa present from late July to early August (summer sampling). At each plot, we sampled all vegetation cover below 1 m (“herb-layer”) within four 1-m2 quadrats placed 1 m (for summer sampling) or 2 m (for spring sampling) from plot center in each cardinal direction. Within each quadrat, we estimated percent cover to the nearest integer for each plant taxon and counted woody stems by taxon, classifying the latter into two height classes: less than 0.5 m or 0.5 to 1.37 m.
We also estimated honeysuckle midstory cover (1.01 to 5 m) using cover class midpoints [32] in 4-m2 quadrats oriented randomly, but consistently between years, at each plot. Shrubs and saplings greater than 1.37 m in height and less than 10 cm diameter at breast height (DBH; 1.37 m) were counted within 40 m2 circular plots at two plots per treatment block and were classified into one of two size classes: (1) less than 5 cm DBH or (2) 5 to 9.9 cm DBH. We estimated percent canopy cover using a spherical crown densiometer (Forestry Suppliers Inc., Jackson, MS, USA), averaging four readings at each plot center point. We determined overstory composition using a variable radius plot (basal area factor 2.296 m2 ha−1) originating at the center of each block.

2.4. Soil Temperature

We collected data on soil temperature for 60 consecutive days from 12 March through 10 May 2017 by burying an iButton® data logger (Maxim Integrated, San Jose, CA, USA) approximately 1–2 cm below the surface of the mineral soil at the center of each plot. iButtons were coated in a thin layer of a spray-on rubber coating (PlastiDip®; Plasti Dip International, Blaine, MN, USA) before burying to protect against water damage and were programed to record temperature to the nearest 0.5 °C every hour. These data were summarized by calculating the mean, maximum, and minimum for each day at each plot.

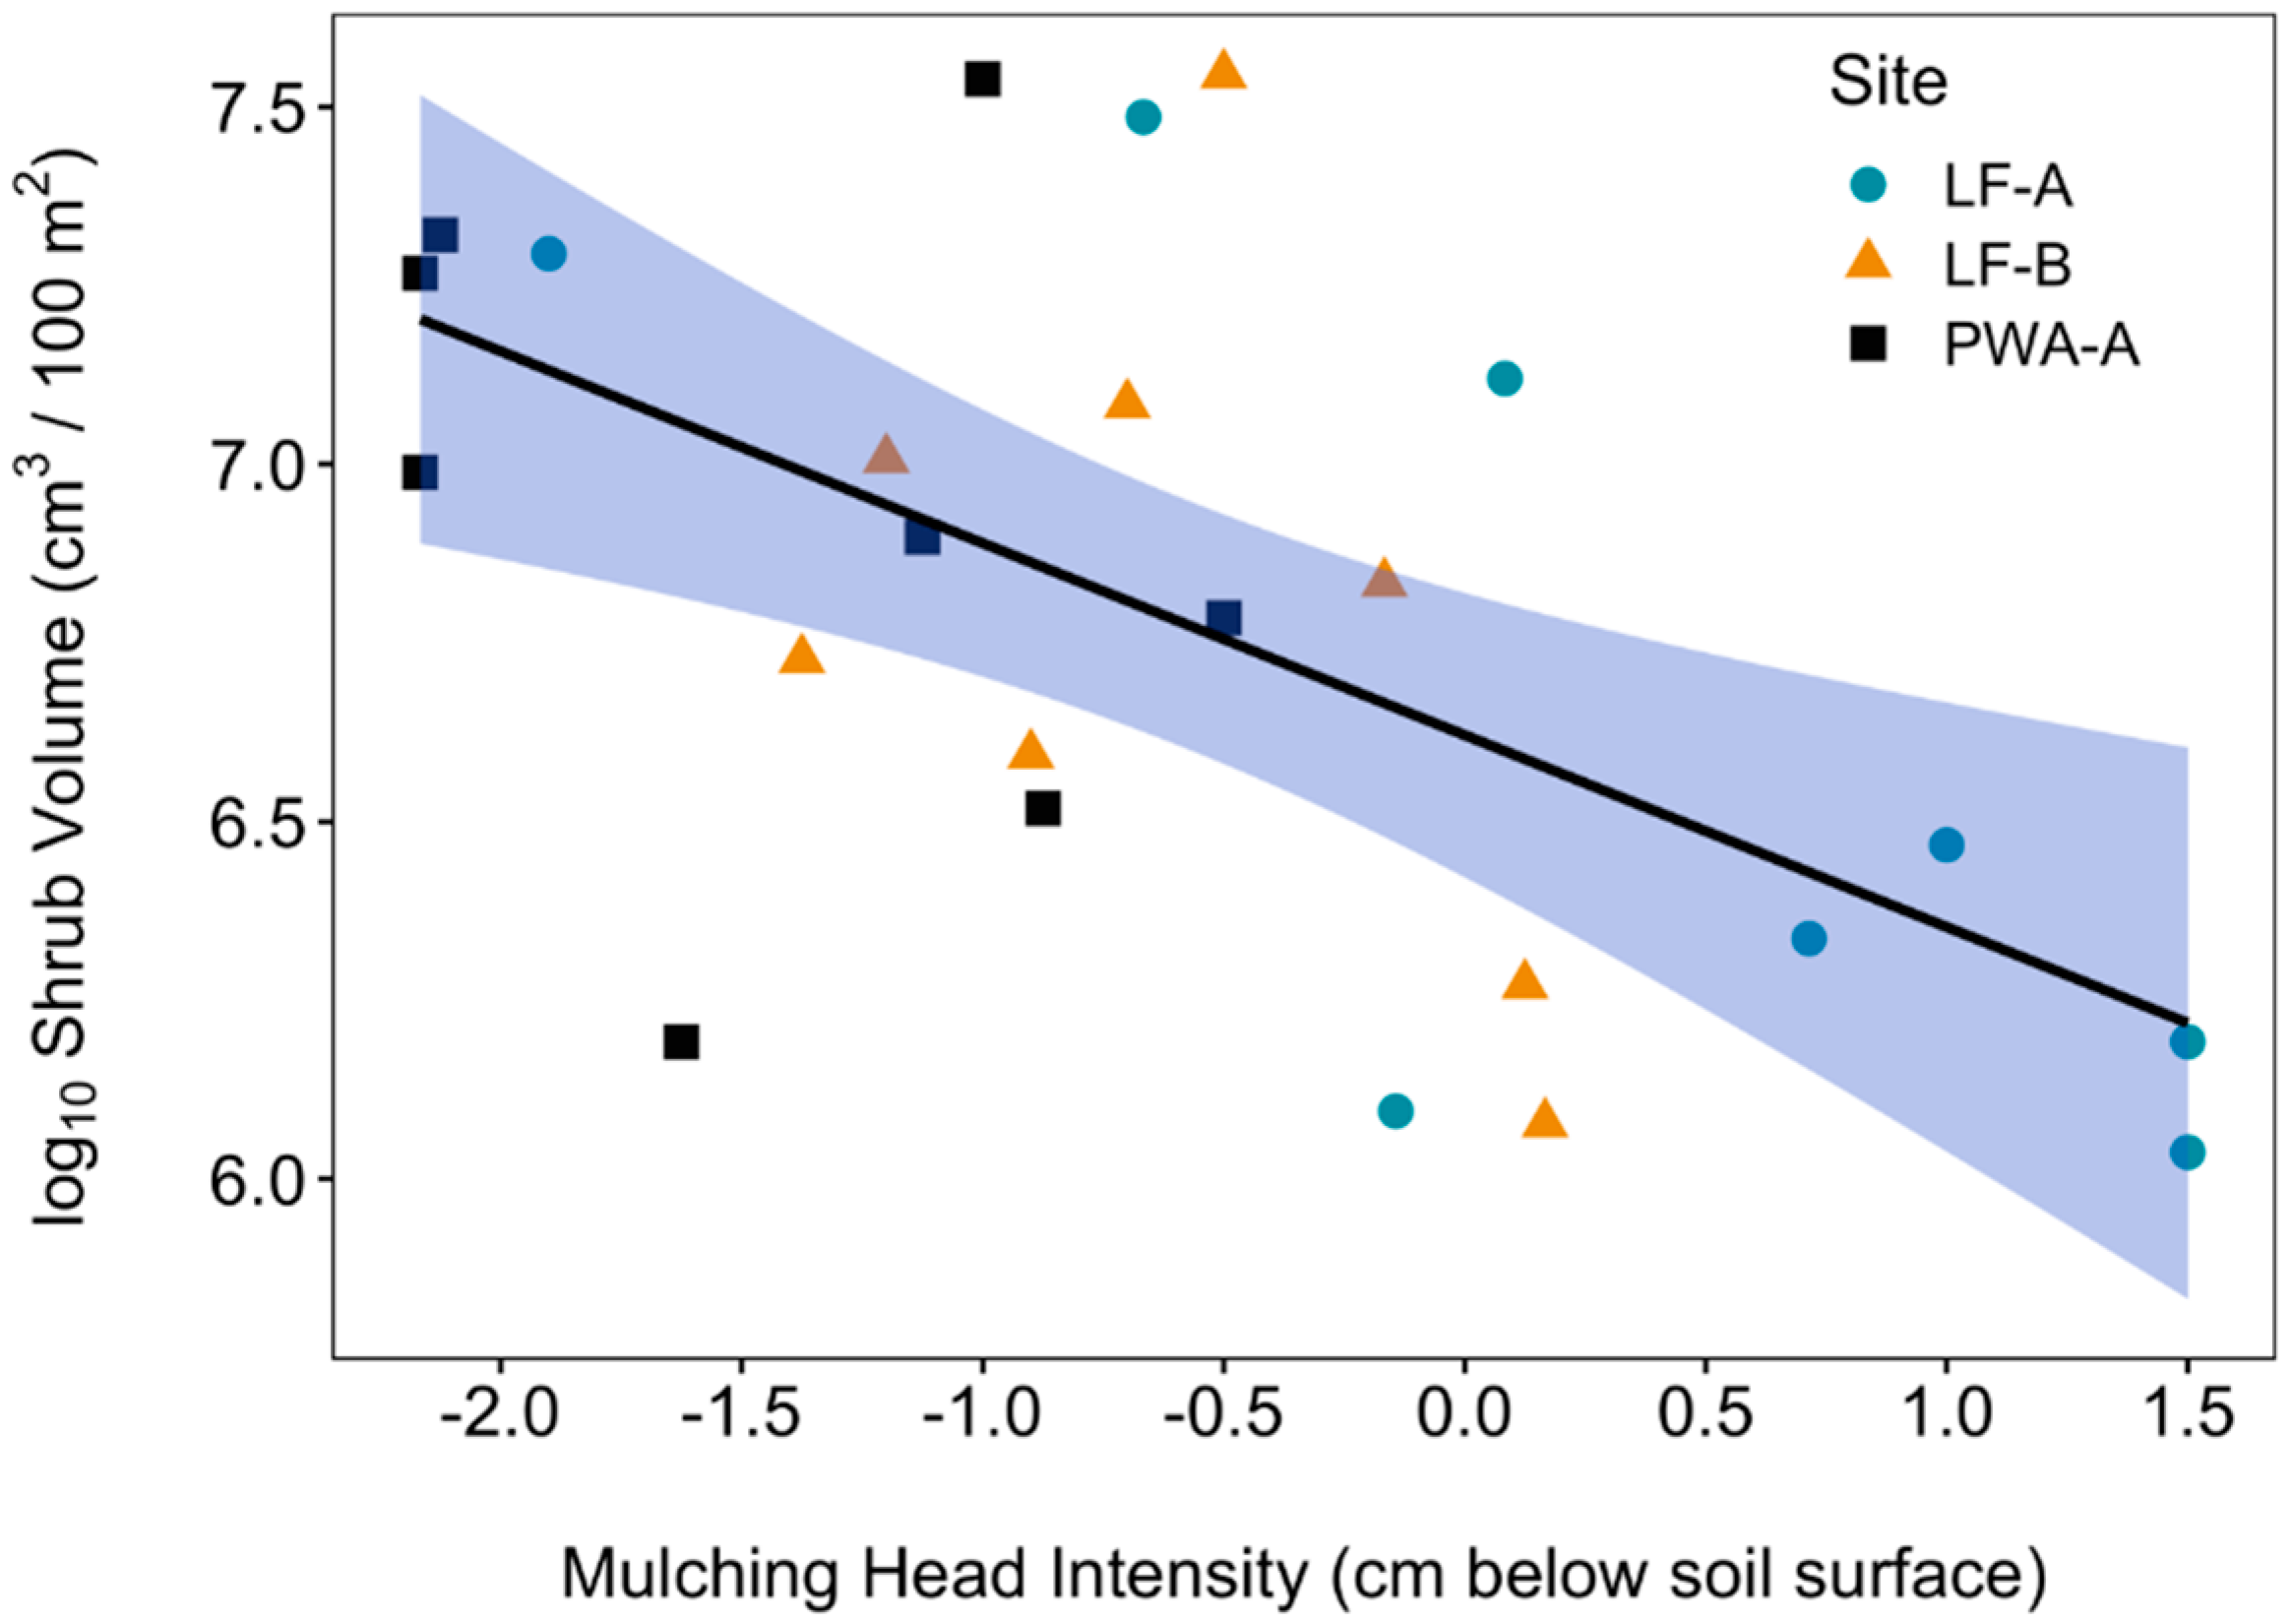
2.5. Mulching Head Treatment Intensity

To determine how mulching head treatment intensity (i.e., depth) affects resprouting, we conducted an additional experiment at three other sites (two at LF and one at PWA), where eight plots were established on a grid with 8 × 8 m spacing. We determined depth of mulching head disturbance using wooden stakes pounded into the ground in 4-m intervals on a grid at each site, with the top 10 cm aboveground. While many stakes broke below ground during the treatment, a minimum of three of the nine stakes within 6 m of each plot were measurable (median 4.5) and we used these to calculate average treatment intensity at each plot.
On a single day the following spring, we counted the number of resprouting stumps in 40-m2 circular plots around the centers of the eight plots at each site and measured the height, crown size (length and width), and number of stems of each resprout. Volume of each resprout was estimated by modelling the shrub as an ellipsoid with
  v o l u m e = 4 3 π ( l e n g t h × w i d t h × h e i g h t 2 )  
and the sum of these values was calculated to estimate total resprout volume per plot.

2.6. Data Preparation

To determine plot-level estimates of percent cover for each taxon in the herb-layer, we calculated the mean across four 1-m2 quadrats from each plot. Woody seedling counts were summed across quadrats and multiplied by 25 to provide plot-level density estimates in seedlings 100 m−2. Shrub and sapling counts within each 40-m2 plot were multiplied by 250 to provide estimates in stems ha−1. We also calculated total herbaceous cover and the total density of native seedling species at each plot.
For spring perennials, summer herbaceous plants, and woody seedlings, we calculated three measures of species diversity: taxonomic richness (S), the number of taxa present; Shannon’s Diversity Index (H′), calculated as:
H =   i = 1 S p i ln p i  
where p i is the proportion of the i th taxon in the dataset using cover for herbaceous plants and count for woody stems; and Pielou’s Evenness Index (J′), calculated as:
J =   H H max  
For the summer herb-layer plant community, we also calculated a floristic quality index (FQI) for each plot by assigning a coefficient of conservation (C) to each taxon according to values for Indiana [33] and then using the following equation [34]:
  FQI = C ave × S  
This metric has been used previously to monitor the quality of understory community recovery after Lonicera morrowii removal [35]. C values for taxa identified to a pair of possible species (e.g., Viola pubescens or V. striata) were averaged but never differed by more than two points. Exotic species were automatically assigned a C value of 0. Grasses and sedges, which were only identified to family and genus, respectively, and unidentified taxa were excluded from FQI calculations.

2.7. Data Analysis

We analyzed whether changes in the response variables throughout the course of the study differed between treatments using linear mixed-effects models in the R package lme4 [36]. These models included fixed effects for “treatment”—a composite factor for removal method and mulch presence/absence—sampling year, and the interaction between sampling year and treatment. Random effects in these models included a random intercept for each site and a random year effect for each plot within a site. This longitudinal mixed-effects model for the response of garlic mustard (Alliaria petiolata) failed to converge, so garlic mustard responses were analyzed with two separate models for the changes from 2015 to 2016 and from 2015 to 2017. The linear mixed-effects model for soil temperature included a fixed effect for treatment, random day effect for each plot, and random intercepts for each site and day.
To analyze differences between treatments in honeysuckle resprouting responses, we selected the most parsimonious subset of variables from a saturated model that included treatment, the pretreatment densities of each honeysuckle size class, and the interactions between treatment and these size classes. Models from this analysis were selected using Akaike’s Information Criterion corrected for small sample sizes (AICc; [37]) in the R package MuMIn [38] and were constrained to include the fixed effect for treatment and a random intercept for each site.
We used square root or natural log transformations, when necessary, to improve normality and homogeneity of variance of residuals. If the model term of interest (treatment or sampling year × treatment interaction) was significant (α = 0.05) or approaching significance (α = 0.10), we tested planned comparisons for this term between: reference treatment and zero (i.e., did the response change in reference areas over the course of the study?); reference treatment and each operational treatment (i.e., cut-stump without mulch added—“Cut[−]”—and mulching head treatment without mulch removed—“MH[+]”); shrub removal with mulch and without; cut-stump removal and mulching head removal; and between the two operational treatments. Degrees of freedom were obtained using Satterthwaite’s approximation in R package lmerTest [39] and are presented to the nearest integer for ease of interpretation. We tested planned comparisons using R package multcomp [40], and present single-step, adjusted p-values based on the joint normal or t-distribution of the linear function. Original data and R code for all analyses and figures are available in Supplementary Materials.

3. Results

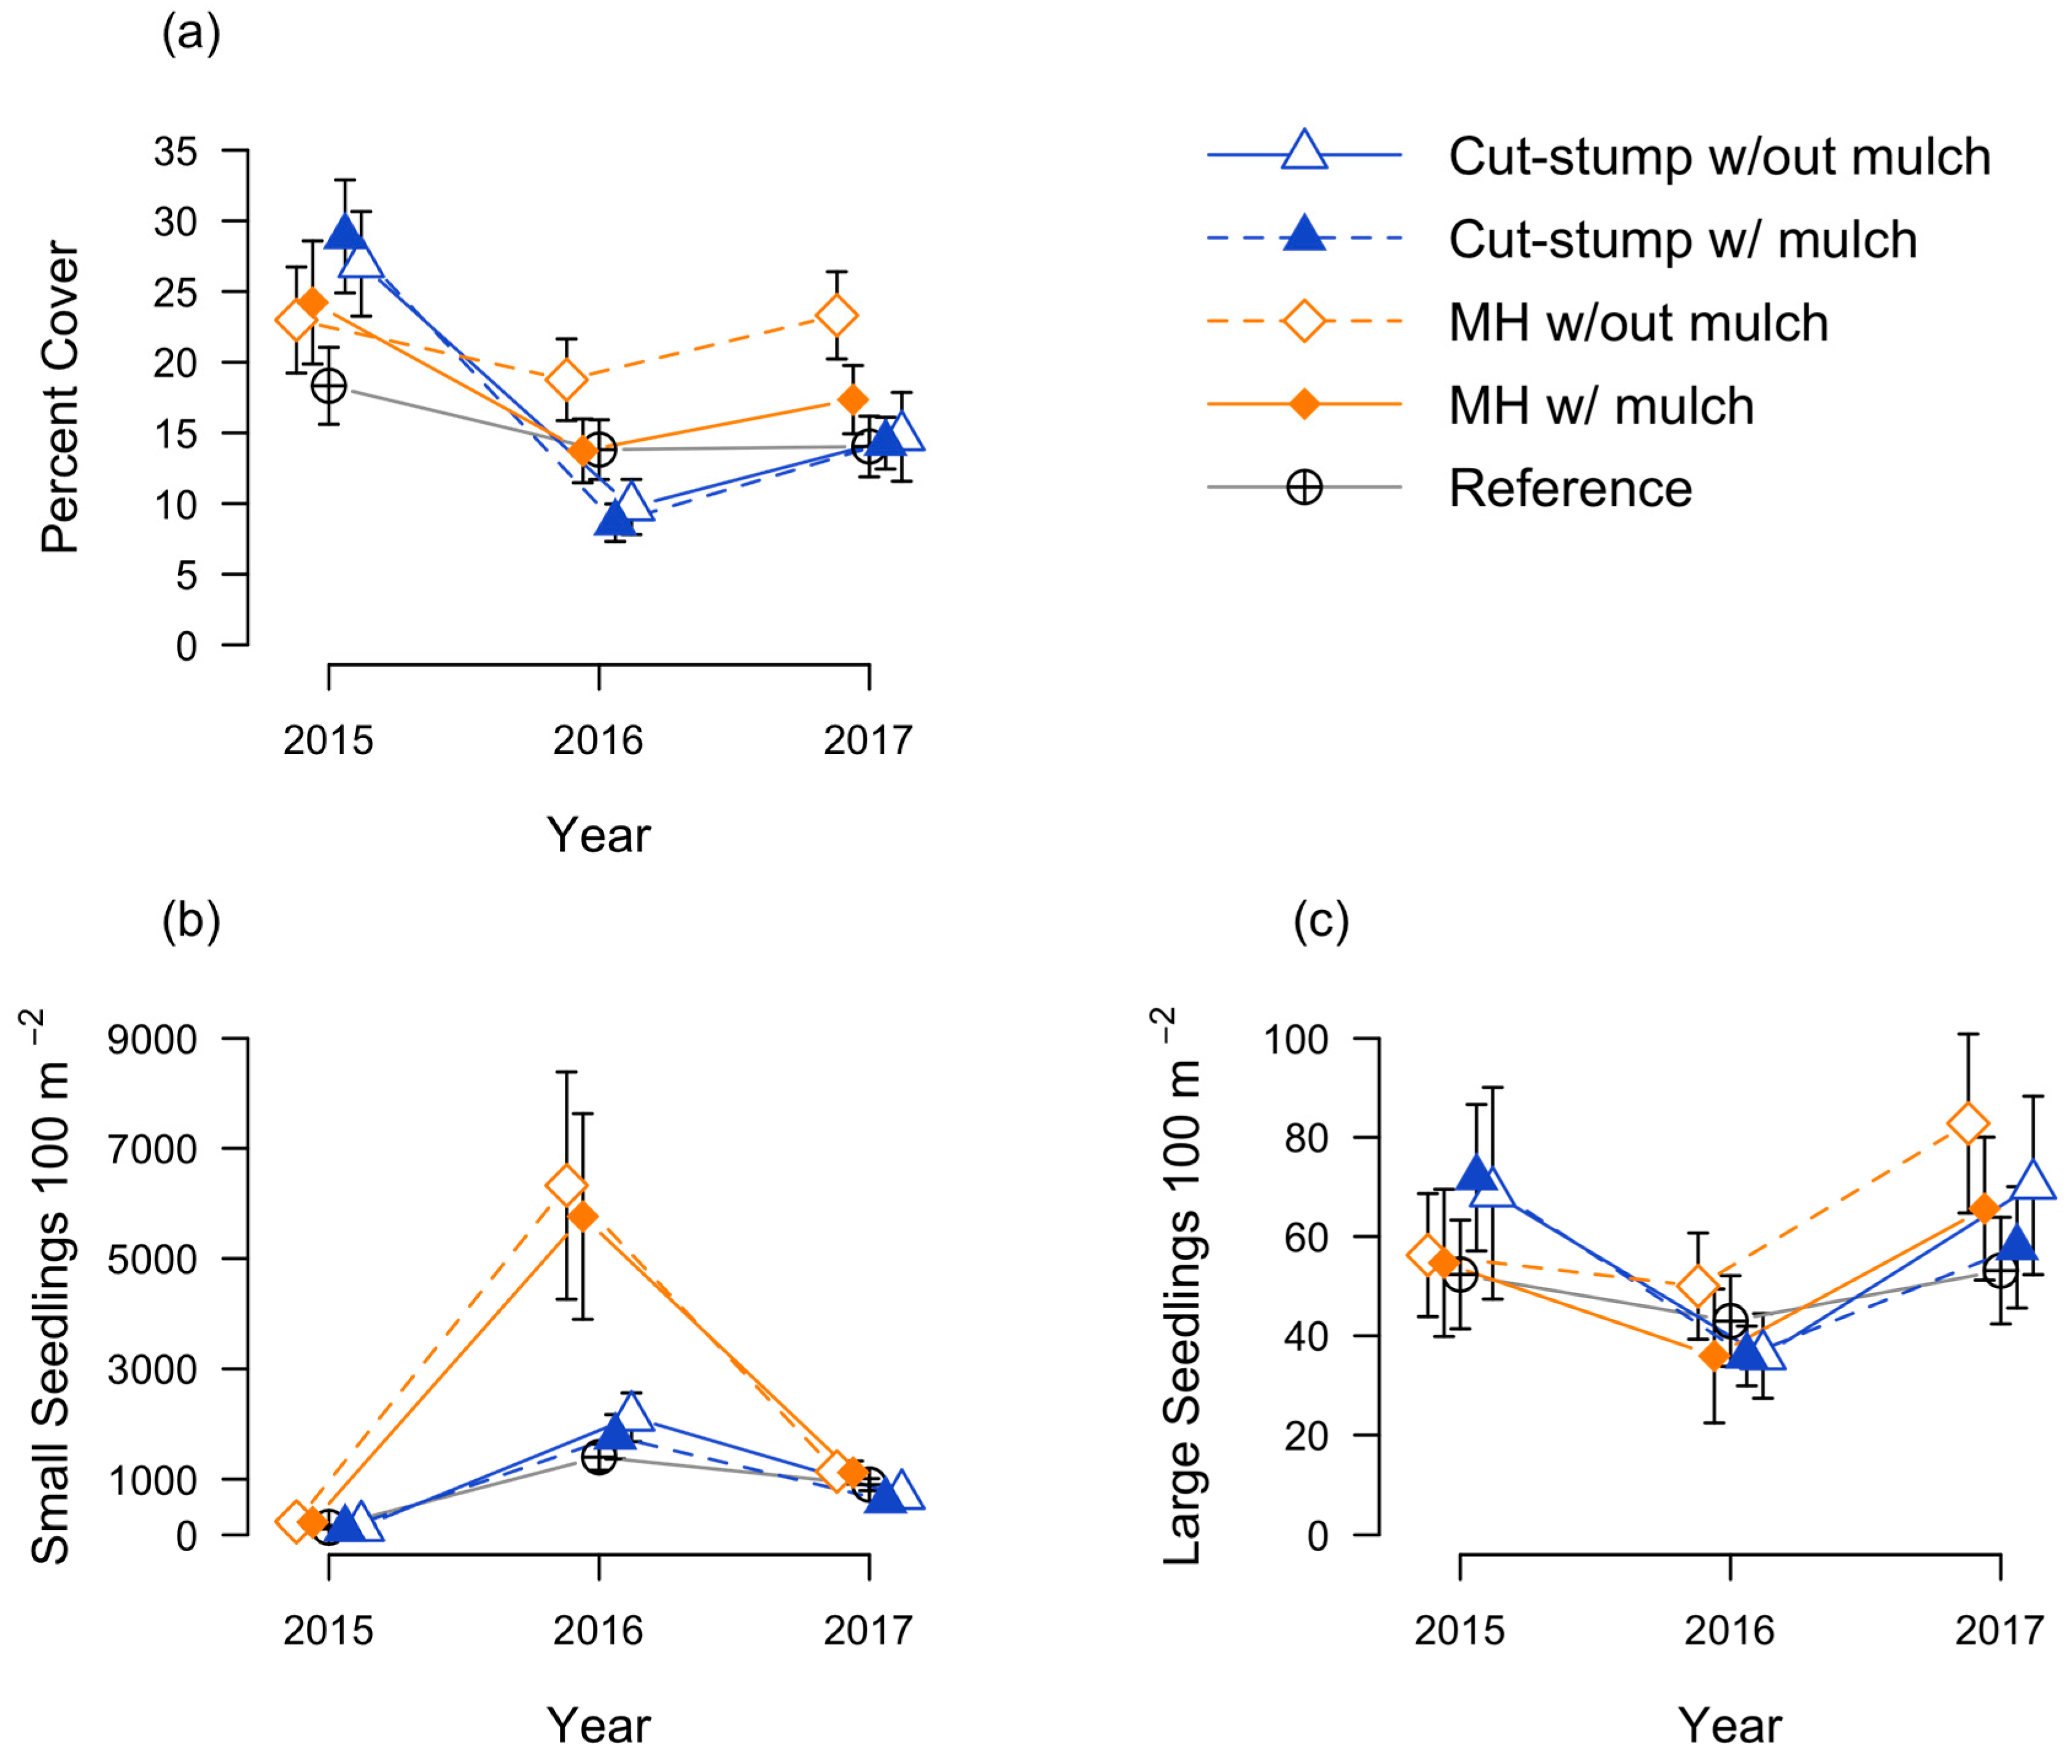
3.1. Honeysuckle Responses

Both removal methods were initially successful at removing sapling-layer honeysuckle (>1.37 m tall), but stump sprouts quickly reentered the sapling layer. Sapling-layer honeysuckle were initially reduced from 4005 ± 307 shrubs ha−1 (mean ± standard error) across all pretreatment plots in 2015 to 94 ± 45 shrubs ha−1 in cut-stump removal plots and 110 ± 51 shrubs ha−1 in mulching head treatment plots in 2016. As resprouting stumps continued to grow from 2016 to 2017, the density of sapling-layer shrubs increased to 391 ± 143 stems ha−1 in cut-stump plots and to 781 ± 196 stems ha−1 in mulching head plots, though changes throughout the study period were not statistically different for the two removal treatments (p > 0.99). Sapling-layer honeysuckle densities changed little in reference areas, from 3734 ± 457 stems ha−1 in 2015 to 4016 ± 552 stems ha−1 in 2017 (p > 0.99).
Resprouting responses differed between the treatments, and these responses were influenced by pretreatment honeysuckle density (Table 2). Planned comparisons revealed that the presence of mulch negatively affected the height of resprouts (p = 0.03) but that height did not vary between removal methods. The mulching head treatment was associated with more stems per stump than cut-stump removal (p < 0.01), but mulch itself did not affect stems per stump. Significant interactions between treatment method and pretreatment honeysuckle densities for each resprout metric indicated that the degree to which pretreatment honeysuckle densities influenced resprouting depended on the treatment method (Table 2). The effect of small (<5 cm DBH) sapling-layer honeysuckle on densities of resprouts was greater in plots treated with the mulching head than with cut-stump removal (p < 0.01) and there was a weaker effect of large (>5 cm DBH) sapling layer honeysuckle on stems per stump following mulching head removal than cut-stump removal (p < 0.01). Midstory honeysuckle cover decreased more in each operational treatment than in reference areas (both p < 0.01; Table 3), but these changes were not different between operational treatments (p > 0.99).
We tested the role of mulching head treatment depth in determining honeysuckle resprouting at a separate set of sites. Plot-averaged mulching head treatment intensity ranged from 2.2 cm above soil surface to 1.5 cm below soil surface. Higher mulching head treatment intensity showed weak but statistically significant negative associations with the density of resprouting stumps (p = 0.03, R2 = 0.069) and the size of resprouting shrubs (p = 0.04, R2 = 0.112). However, the relationship between treatment intensity (i.e., depth) and the total estimated volume of resprouting shrubs on a plot was considerably stronger (p < 0.01, R2 = 0.311; Figure 2). Total shrub volume combines both shrub size and stem density into a single value and is likely the most informative response metric for management that frequently includes foliar herbicide applications to resprouting stems.
Overall, cut-stump removal reduced herb-layer honeysuckle cover (below 1 m) more than the mulching head treatment (p < 0.01), though the comparison between the operational treatments, Cut[−] and MH[+], was less pronounced (Table 4). The cut-stump control method resulted in lower herb-layer honeysuckle cover the first summer following removal, following reductions in percent cover of 17.2 ± 3.2 and 20.3 ± 3.9 in Cut[−] and Cut[+] plots and 4.2 ± 4.3 and 10.5 ± 4.5 in MH[−] and MH[+] plots, respectively, despite being higher initially (Figure 3 and Table 3). The following year, herb-layer honeysuckle cover increased similarly in both removal treatments (Figure 3).
Honeysuckle seedlings responded strongly to shrub removal initially but declined in all treatments the following year. Seedlings of the smaller size class (<0.5 m) increased in density by 1988 ± 429 seedlings 100 m−2 in Cut[−] plots and by 5542 ± 1853 seedlings 100 m−2 in MH[+] plots, as compared to a mean increase of 1266 ± 232 seedlings 100 m−2 in reference areas (Figure 3b). Despite initial differences, densities of small seedlings were more similar between treatments the following year (Figure 3b), resulting in no overall sampling year effect between treatments (p > 0.10, Table 4). Densities of large honeysuckle seedlings (0.5–1.37 m) decreased in the first year following shrub removal and increased the next year in all shrub removal treatments (Figure 3c); there was no difference in sampling year effects for this size class (p > 0.10, Table 4).

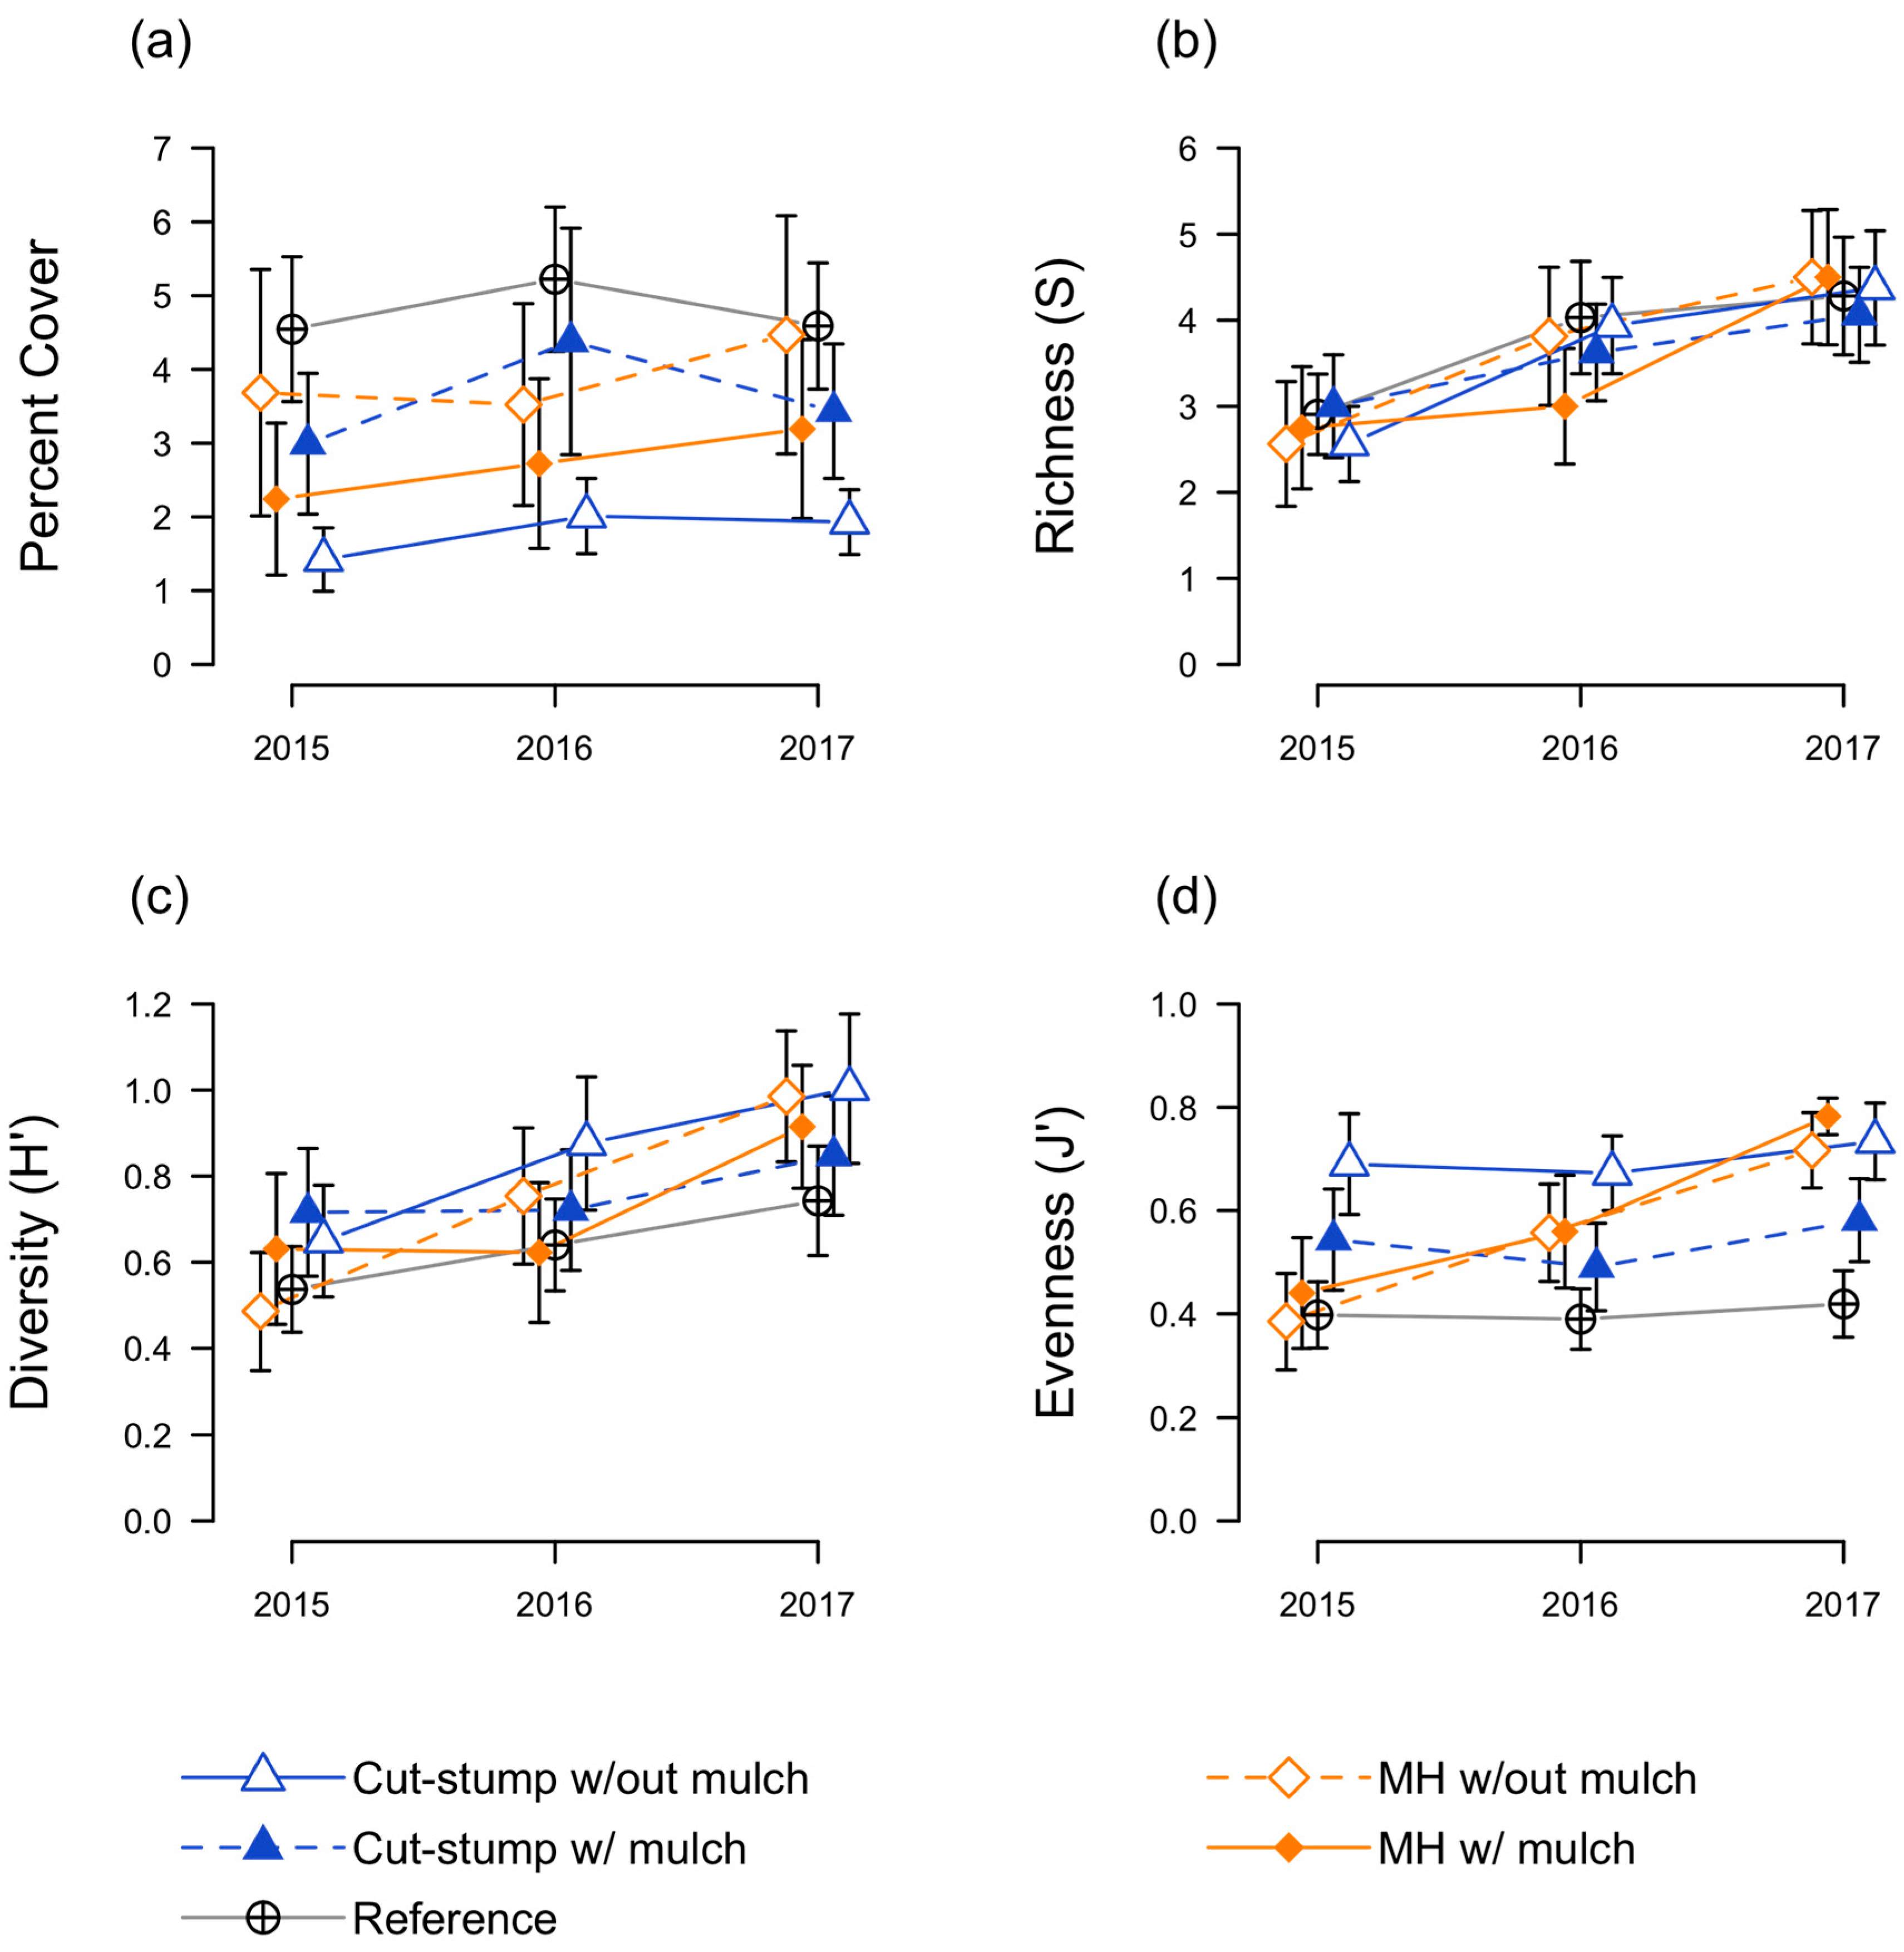
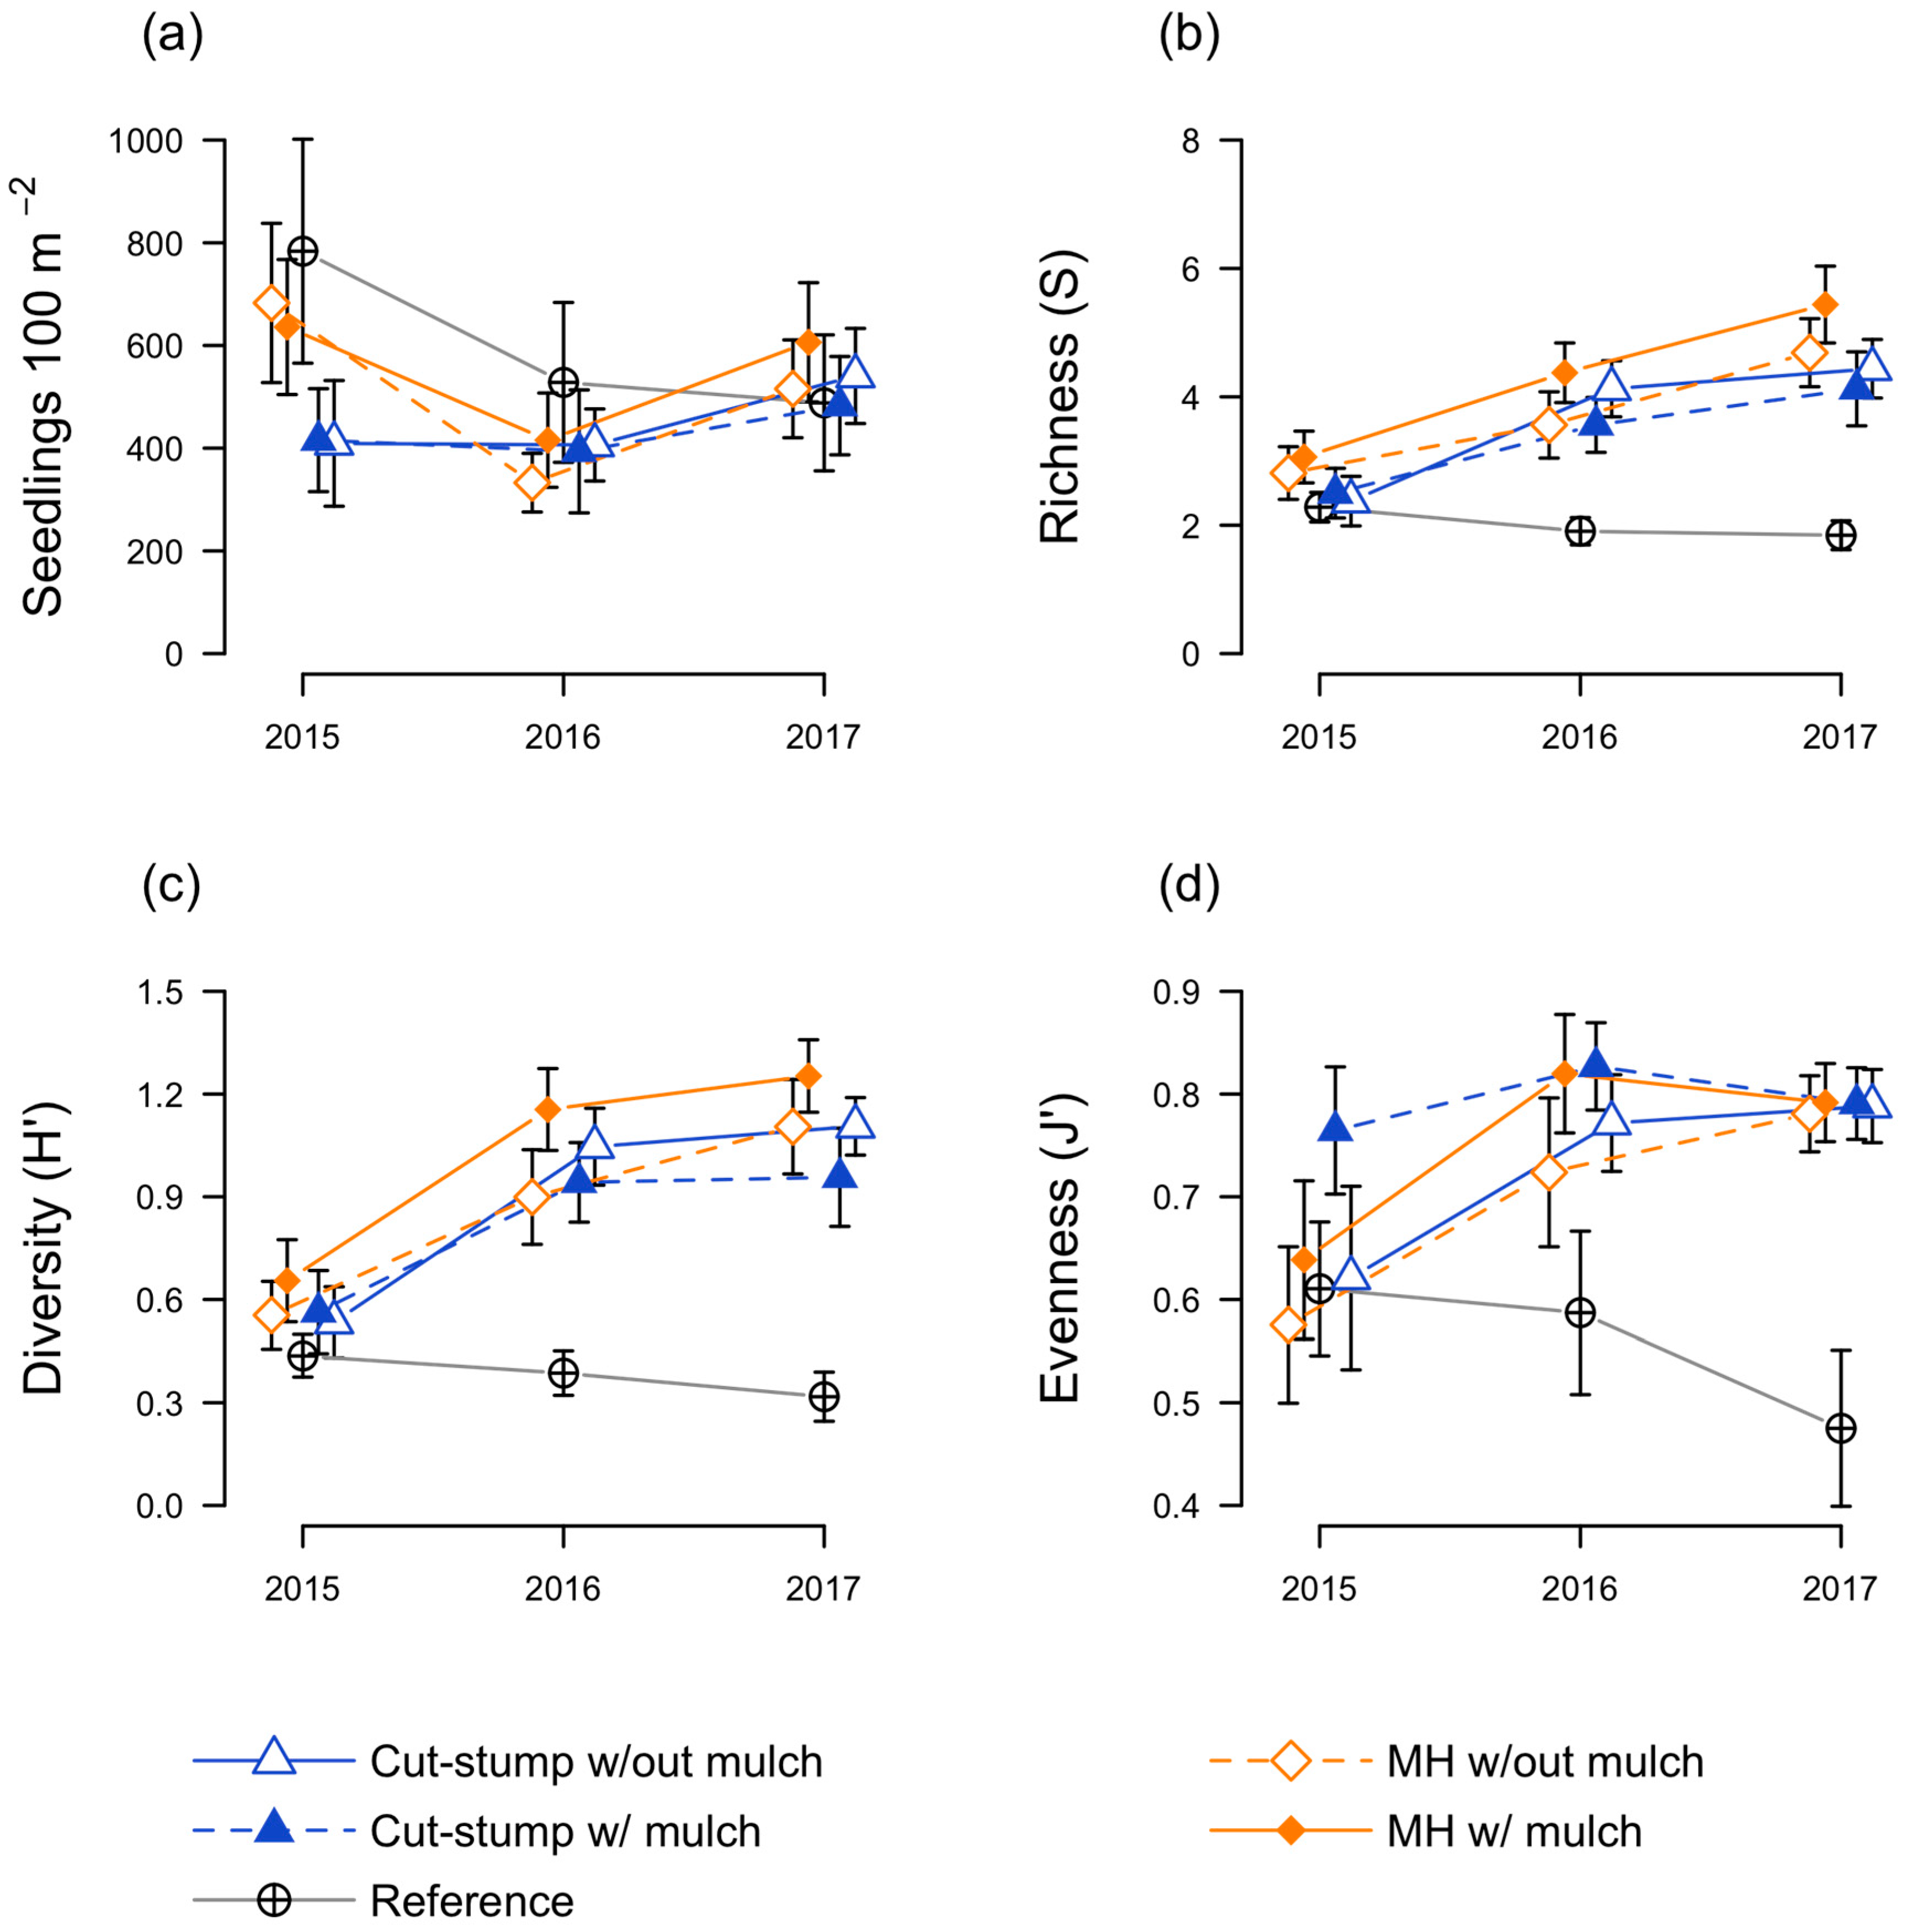
3.2. Native Seedling Responses

Decreases in native woody seedling densities between 2015 and 2016 were lower in Cut[−] plots (−3 ± 79 seedlings 100 m−2) than in MH[+] plots (−220 ± 72 seedlings 100 m−2), although plots randomly assigned to the mulching head treatment had higher native seedling densities prior to removal, and in 2016 the densities of native seedlings were similar in Cut[−] (406 ± 70 seedlings 100 m−2) and MH[+] (416 ± 92 seedlings 100 m−2) plots (Figure 4a). Native seedling densities decreased in reference areas throughout the study but increased in all removal treatments between 2016 and 2017 (Figure 4a), and there was no difference between the two operational treatments, Cut[−] and MH[+], in sampling year effects on native seedling densities (Table 4).
The most abundant native woody seedlings prior to shrub removal were white ash (Fraxinus americana L.) and sugar maple (Acer saccharum Marshall), which accounted for 45.7% ± 3.8% and 25.4% ± 3.3% of pretreatment native seedlings, respectively. Taken together, the pretreatment percentage of these shade tolerant species did not differ between treatment assignments (p = 0.35). A longitudinal linear mixed-effects model indicated a negative sampling year effect on the percentage of these two species (p = 0.04), but this effect did not differ between treatments (p = 0.16).
Native seedling S and H′ increased similarly following both removal treatments (Figure 4b,c), and these changes were no different between removal treatments (Table 4). Native seedling J′ decreased in reference areas over the course of the study and increased following shrub removal treatments (Figure 4d). However, while there was an interaction between treatment and sampling year (p = 0.02), we were unable to detect any differences in the change in native seedling J′ between individual operational treatments and the reference (Table 4).

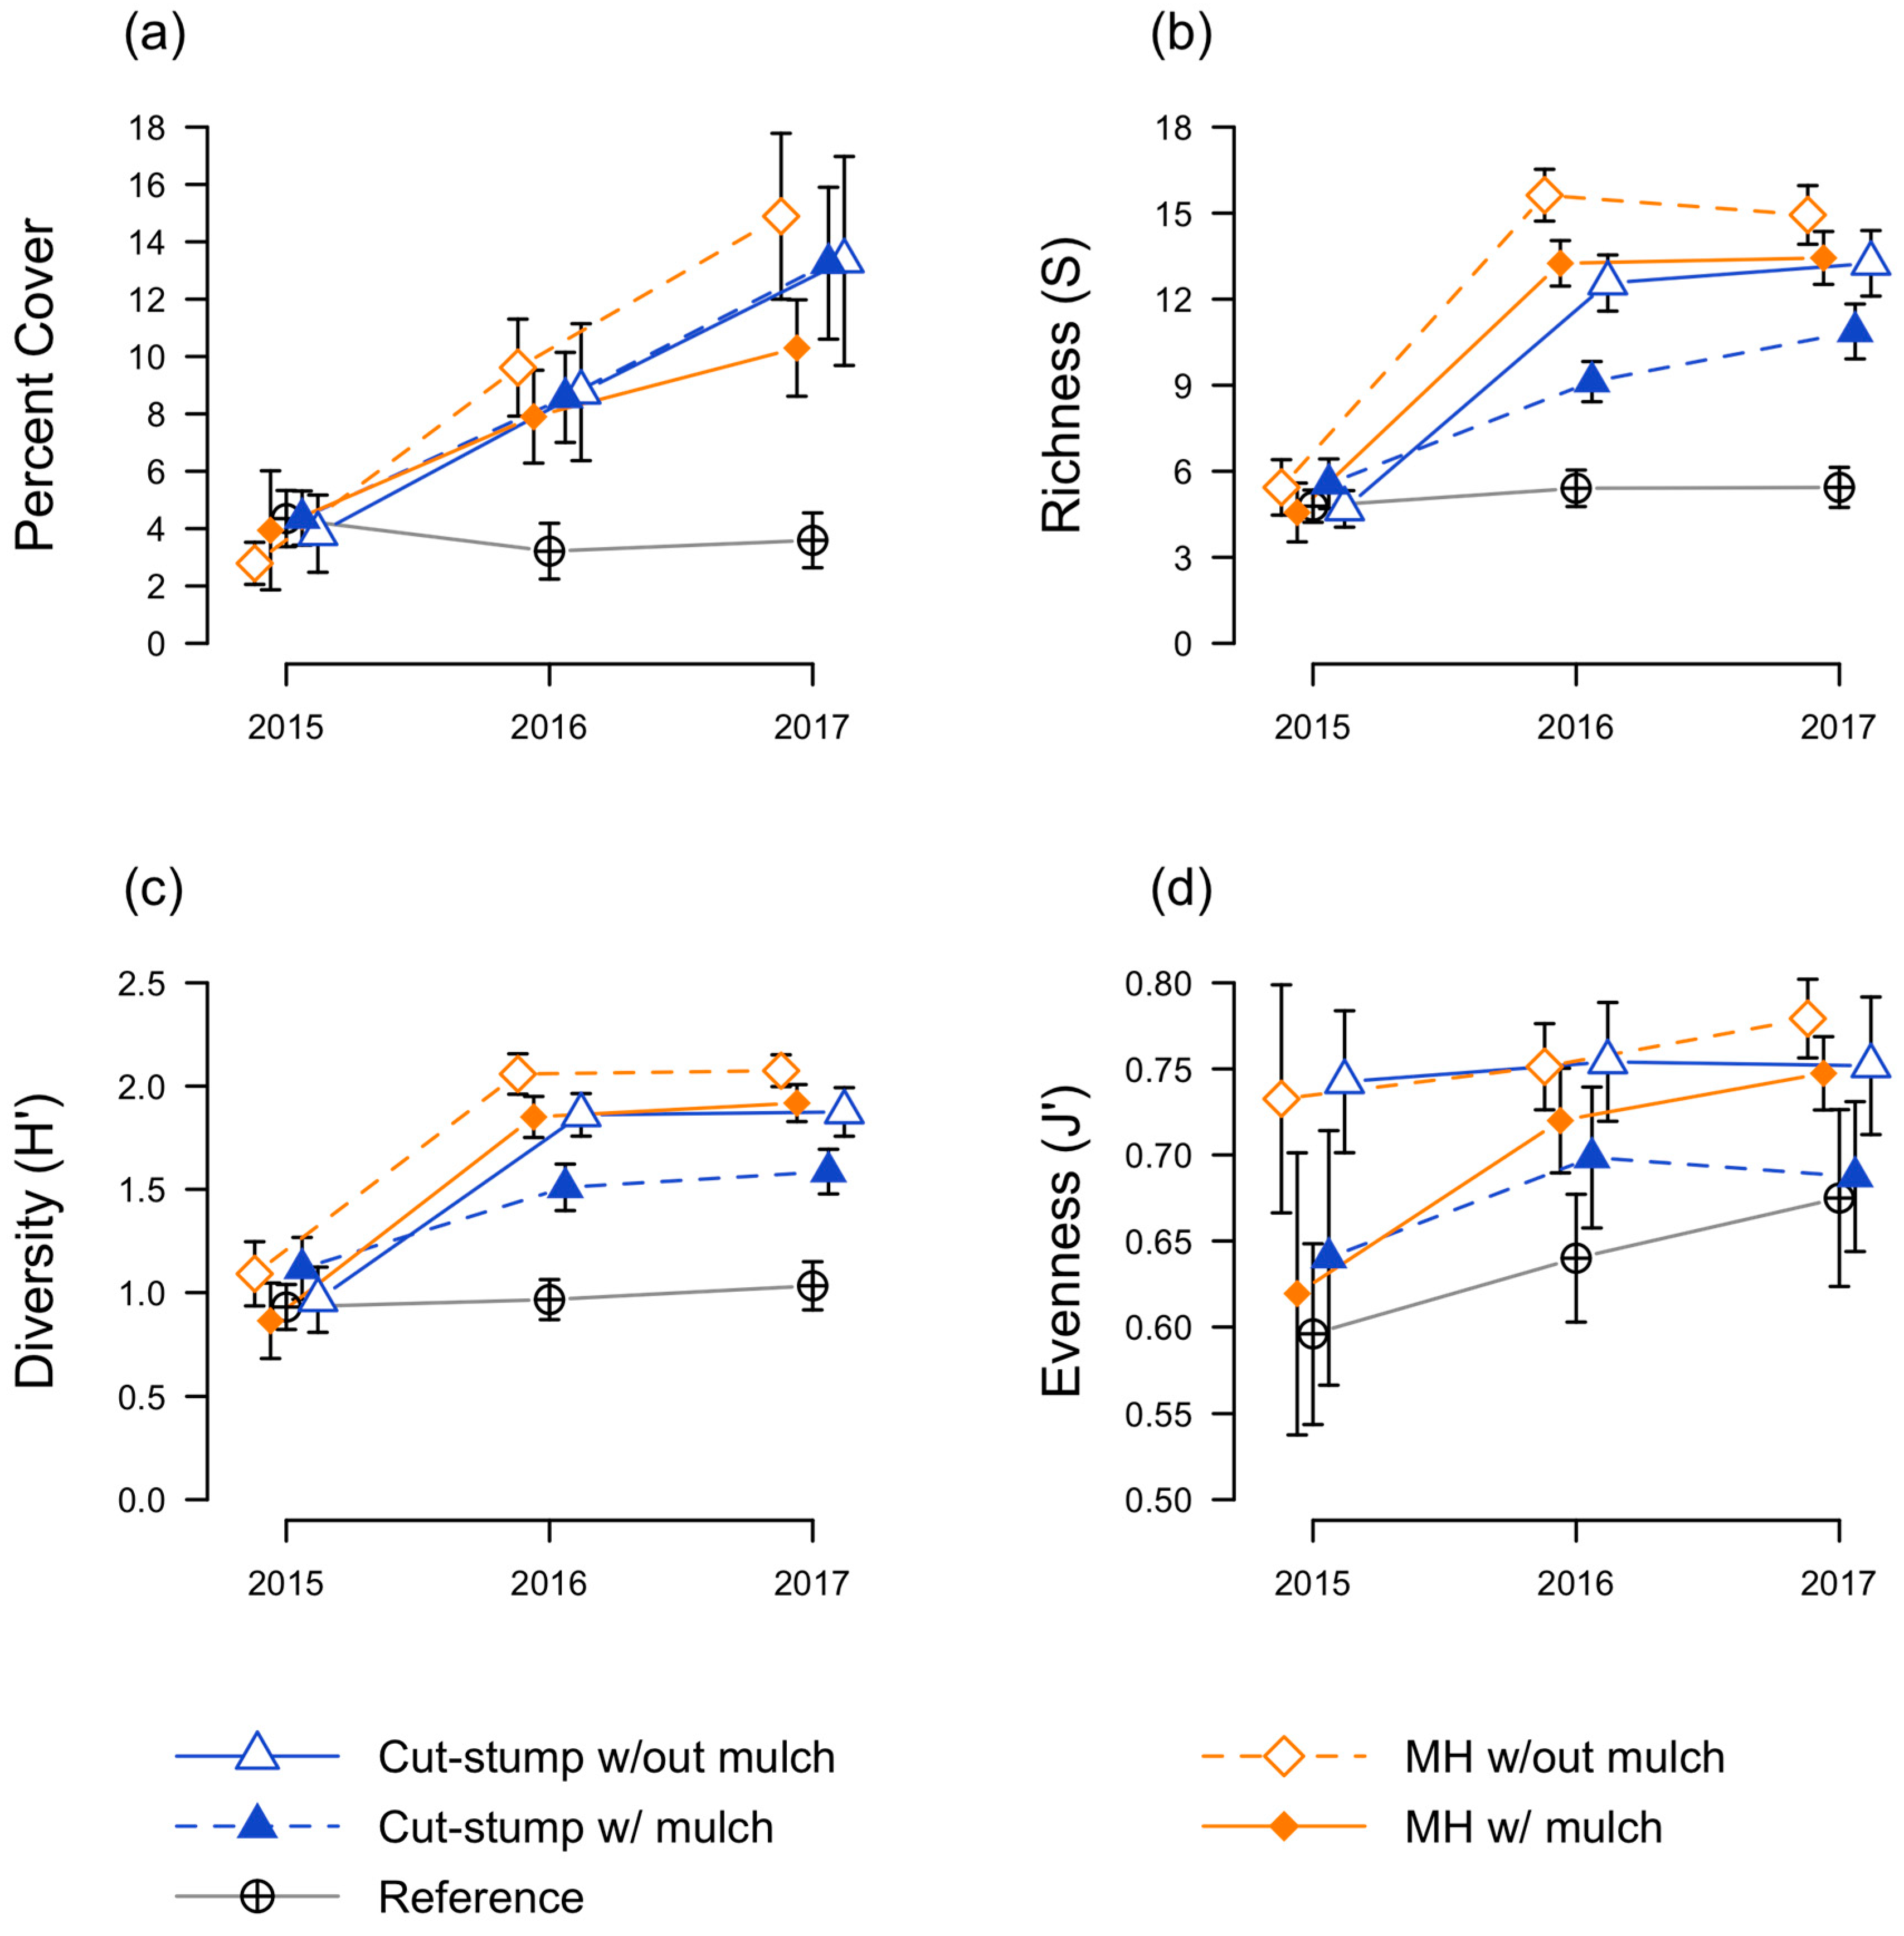
3.3. Herbaceous Plant Responses

Cover of spring perennials changed little over the course of the study and was generally low across treatments (Figure 5a). Slight changes in spring perennial cover were not different between treatments (Table 4). Spring perennial S and H′ increased across all treatments, including reference areas, over the course of the study, though H′ decreased slightly in both treatments with mulch in the first spring following shrub removal (Figure 5b,c). Spring perennial J′ pretreatment values varied between treatments (Table 4) but increased more following the mulching head treatment than cut-stump (Figure 5d).
Total summer cover of herbaceous plants increased following all shrub removal treatments, and cover increases continued in the second post-treatment growing season (Figure 6a). Pretreatment mean percent cover of herbaceous plants ranged from 0.5 ± 0.2 at PWA to 6.1 ± 1.6 at site LF2 (grand mean 3.9 ± 0.6). Increases in percent herbaceous cover were greater in each operational treatment than in reference sites (both p < 0.01) and were similar across removal treatments (p > 0.10, Table 4). Herbaceous percent cover increased 9.2 ± 1.2 across cut-stump and mulching head treatments over the course of the study, as compared to a 0.8 ± 0.5 decrease in reference areas (Figure 6a).
Summer herbaceous S and H′ both increased following shrub removal, but these increases were sharper initially than between the first and second post-treatment growing seasons and did not differ between operational removal treatments (both p > 0.10, Figure 6b,c). Mean herbaceous S increased by 8.1 ± 0.6 in shrub removal areas, as compared to an increase of 0.7 ± 0.4 in reference areas (Table 4). Mean herbaceous H′ increased 0.9 ± 0.2 in Cut[−] and 1.1 ± 0.2 in MH[+] plots, as compared to 0.1 ± 0.1 in reference areas (both p < 0.01, Table 4). Herbaceous J′ was highly variable and there were no differences in the change in herbaceous J′ between treatments (Figure 6d and Table 4).
Cover of native perennials increased more following MH[+] treatment than in reference areas (p = 0.03), and cover of native vines increased more in both operational treatments than in reference areas (both p = 0.01), but removal treatments did not differ in the responses of any herbaceous groups, including exotics (Table 4). Percent cover of garlic mustard responded similarly to both operational treatments in the first year, increasing from 0.1 ± 0.0 prior to removal treatments up to 1.1 ± 0.5 after Cut[−] treatment and 1.1 ± 0.4 after MH[+]. While garlic mustard cover was generally lower during the 2017 sampling period, decreasing to 0.3 ± 0.2 in Cut[−] plots and to 0.2 ± 0.1 in MH[+], two-year change in garlic mustard cover was higher following Cut[−] treatment than MH[+] treatment (p = 0.06). However, the number of fruiting garlic mustard individuals in 2017 was greater in MH[+] than Cut[−] treatment plots. Differences between operational treatments were driven by mulch (p < 0.01) rather than removal method (p = 0.26).

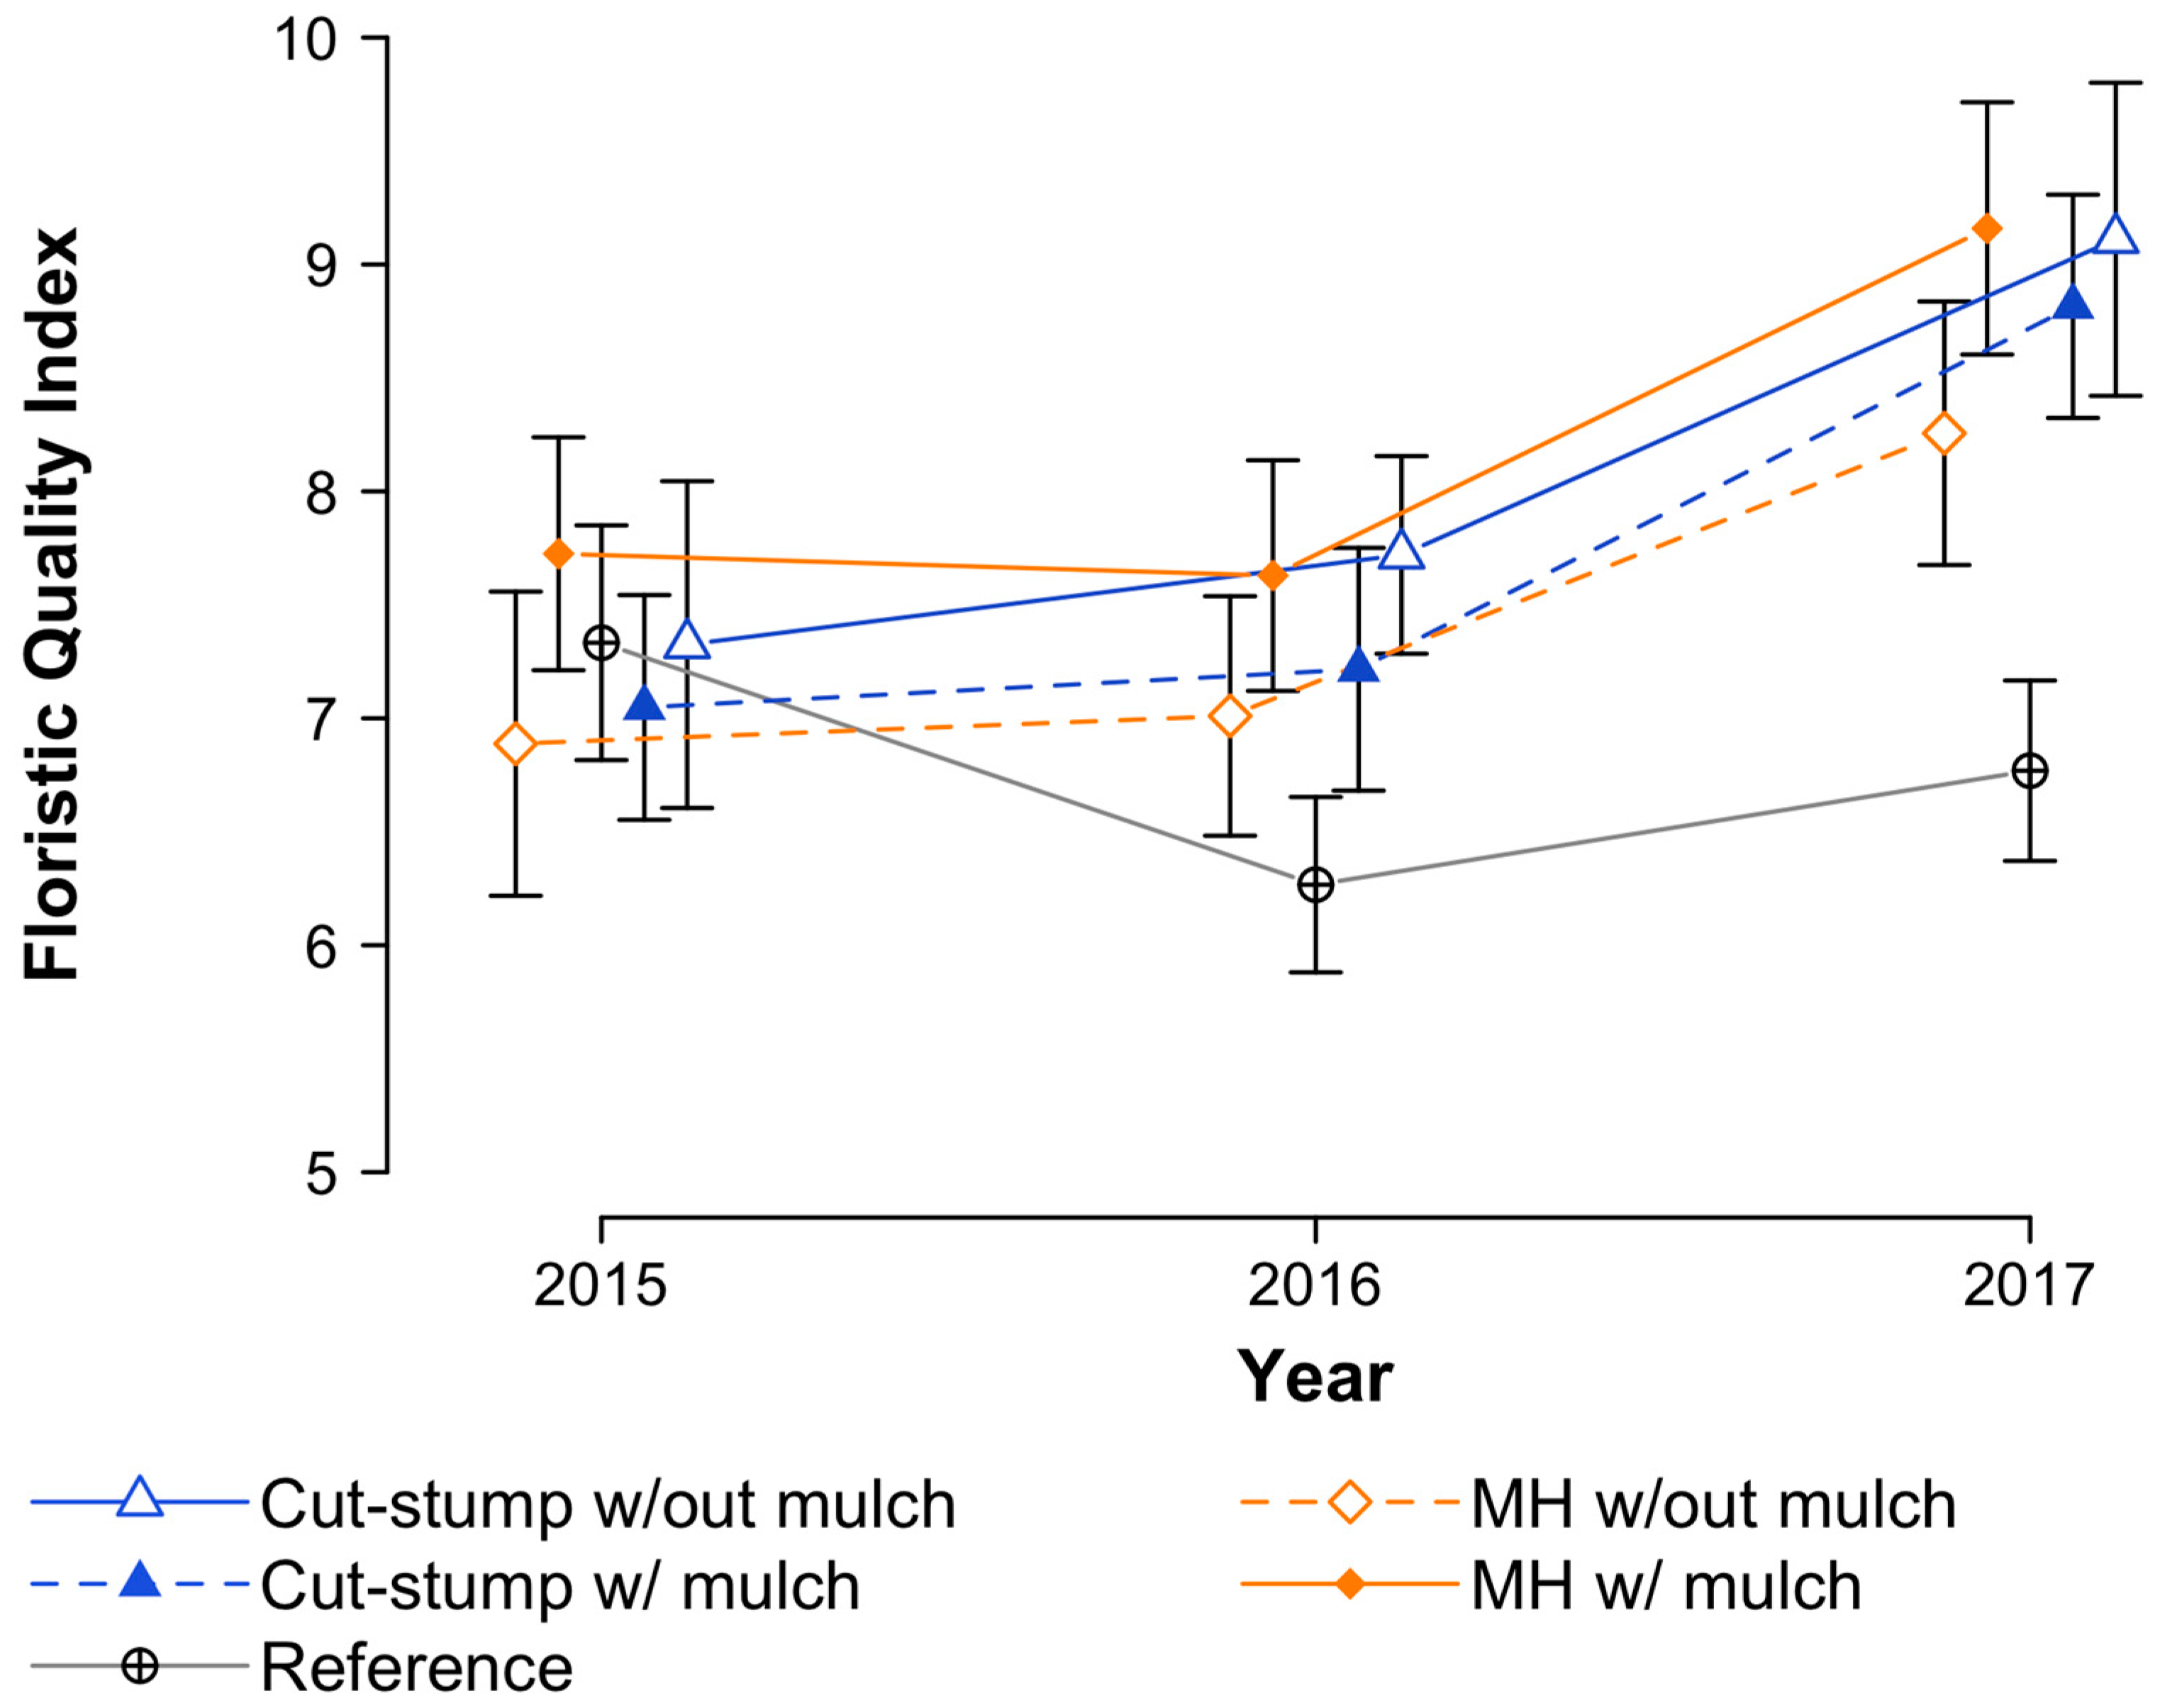
3.4. Floristic Quality

FQI calculated at the plot scale (4-m2) for herb-layer species changed little in treatment plots following shrub removal but responded positively the following year, whereas FQI in reference plots declined slightly (Figure 7). Overall, FQI increased 0.95 ± 0.36 per year more in Cut[−] plots and 0.77 ± 0.36 per year more in MH[+] plots compared to reference areas (p = 0.04; p = 0.14), in which FQI did not change over the course of the study (p = 0.92). Mean Cave across all plots prior to shrub removal was 2.5 ± 0.1, decreasing the following year to 1.9 ± 0.1 and 1.8 ± 0.1 in Cut[−] and MH[+] treatments, then rebounding somewhat to 2.2 ± 0.2 and 2.1 ± 0.1 in those same treatments, respectively.

3.5. Soil Temperature

Honeysuckle removal treatments elevated soil temperatures, and mulch reduced daily temperature variability within removal areas. Daily mean soil temperature at 1 cm depth was 0.56° ± 0.08° higher in removal plots without mulch than in removal areas and was 0.57° ± 0.08° higher in removal plots with mulch than in removal areas (both p < 0.01). Across both removal methods, mulch did not affect mean temperature (p > 0.99). Removal plots with mulch had higher daily minimum soil temperatures and lower daily maximum temperatures than those without mulch (min.: p < 0.01, max.: p = 0.05). This buffering effect of mulch on temperature extremes resulted in no difference in daily soil temperature ranges between mulched removal plots and untreated reference plots (p = 0.31), whereas temperatures in removal plots without mulch ranged 0.32° ± 0.07° more than in reference areas on a daily basis (p < 0.01).

4. Discussion

4.1. Treatment Effectiveness

In this comparison of two methods for invasive shrub removal, the mulching head was generally less effective than cut-stump removal at controlling invasive bush honeysuckle, as indicated by more rapid regrowth of herb-layer honeysuckle cover. This difference in honeysuckle cover was likely driven by differences in the responses of resprouting stumps we observed between removal methods. Without treating cut stumps, previous work on other invasive shrub taxa found no differences in regrowth between clearing saw and mulching head methods [12], suggesting that differences in resprouting between the two techniques may be driven by stump treatments. We saw faster regrowth of honeysuckle cover following both treatments compared to barberry responses observed by Ward et al. [12]. Conducting shrub removal in late fall, as opposed to early spring, may be responsible for more prolific resprouting, as non-structural carbohydrate stores in roots are highest in the fall just before leaf abscission [35].
Honeysuckle removal in nearby sites the following year indicated that increasing the depth of the mulching head treatment can mitigate resprouting (Figure 2), suggesting that a relatively shallow treatment depth in this study may be partially responsible for the relatively vigorous honeysuckle resprouting we observed in mulching head treatment areas. However, native plant community impacts of the mulching head along a gradient of treatment intensity have not yet been investigated, and one of the reasons for similar native community responses between control methods in this study may be that we limited soil disturbance associated with the mulching head treatment. This balance between reducing resprouting and protecting belowground plant structures requires additional study as best management practices are developed for this relatively new control technique.
Although we did not examine the phenology of treated stumps, one explanation for shorter resprouting shrubs in mulched plots is that mulch buffered soil against cold winter temperatures, and shrubs in these plots may have taken longer to meet the chilling requirement required to break endodormancy, though the chilling requirement for Amur honeysuckle is minimal [41]. Interactions between treatment method and pretreatment stem density effects on resprouting suggest that the mulching head treatment was less effective at controlling the resprouting of small sapling-layer shrubs but more effective than the cut-stump method for controlling large sapling layer shrubs, though we were unable to track individual stems due to the nature of the mulching head treatment.

4.2. Responses of Exotic Flora

Greater honeysuckle percent cover in mulching head-treated plots in 2016 compared to cut-stump plots is also attributable to the strong response of honeysuckle seedlings in the first year, which is consistent with rapid honeysuckle seedling responses in other removal experiments [17]. Canopy openness was no different between removal methods (Table 3), so the much greater density of honeysuckle seedlings following mulching head treatment is more likely the result of soil disturbance, which has been implicated in the germination of other invasive shrubs [42]. Re-establishment of Chinese privet was also higher in areas treated with a mulching head in riparian forests in Georgia, USA [16]. The mulching head likely disrupts the litter layer on the forest floor more than the cut-stump method, which can increase the germination and establishment of both honeysuckle and garlic mustard seedlings [20]. We expected that mulch would limit the density of emergent honeysuckle seedlings, but any such effect was dwarfed by the difference between removal methods (Figure 3b).
We also expected that garlic mustard, an exotic invasive herb that regularly colonizes sites after honeysuckle removal [15,17,21], would be promoted more by the mulching head treatment, but suppressed by residual mulch, and this hypothesis was partially supported. Increases in garlic mustard cover were similar between treatments, despite greater honeysuckle cover in mulching head plots. Recent work suggests that direct interactions with other components of the understory plant community may not be as strong a determinant of garlic mustard abundance as ungulate herbivory pressure [43]. Despite these similar initial increases in garlic mustard cover between treatments, there were more fruiting garlic mustard individuals in mulched plots the second year. Due to the biennial life history strategy of garlic mustard, with basal rosettes that overwinter, severe winter conditions can limit garlic mustard survival [44]. Insulated soil temperatures beneath mulch may have contributed to higher winter survival rates, resulting in more fruiting individuals the following growing season.
The senescence of a large proportion of honeysuckle seedlings after the first year post-treatment is also consistent with previous work on honeysuckle control [15]. Self-thinning of woody seedlings can be a density-dependent response to soil pathogens, even in temperate forests [45], suggesting that without the strong resprouting response observed in this study, more of these honeysuckle germinants may have persisted. While honeysuckle invasion reduces conspecific seed viability [46], honeysuckle seedlings may grow better in soils previously conditioned by invasive shrubs [47]. Moreover, invasive shrubs may be less susceptible to fungal pathogens due to enemy release [48], but some evidence suggests that Amur honeysuckle may be susceptible to a leaf blight fungus that affects native Lonicera species [15]. Testing understory responses to the mulching head in combination with strategies to further mitigate regrowth, including greater treatment intensities, treating in the spring, and applying follow-up control methods, will help to elucidate how the pulse of honeysuckle regeneration after mulching head treatments responds to lower densities of resprouting mature individuals.

4.3. Native Plant Community Recovery

Generally, native plant community recovery was similar between both treatment methods, despite greater honeysuckle regrowth following the mulching head treatment. In this region, woodlands flat enough to permit mulching head utilization have likely been subject to numerous severe disturbances during the last 200 years, including row cropping, grazing pressure, and high grading. This history of anthropogenic disturbance, coupled with approximately 30 years of honeysuckle invasion, may have had a filtering effect on the existing plant communities such that species more sensitive to substrate disturbance had been excluded long before the initiation of this study [49]. Several recovery metrics exhibited greater differences between treatments the first year after shrub removal than the trajectory over the course of the entire study would suggest. Had the study only followed shrub removal effects for one post-treatment growing season, mulching head impacts on native seedling densities, stronger responses of honeysuckle seedling densities in mulching head plots, and negative effects of mulch on spring perennial diversity would have indicated that the mulching head was less suitable for achieving restoration goals than the cut-stump method. However, the lack of these differences over a two-year study period emphasizes the necessity for multi-year monitoring of restoration objectives.
While total cover of summer herbaceous plants responded positively to all removal treatments, the cover of spring perennials did not recover during the course of this study, in contrast to other studies reporting rapid responses of spring herbs to invasive shrub removal [17,50]. However, the pretreatment cover of spring perennial herbs observed by Shields et al. [17] was far higher than in this study, and highly variable spring perennial cover between plots in this study may have been driven by the distribution of mayapple (Podophyllum peltatum L.) across study sites. Mayapple is relatively broadleaved compared to the other spring perennials in this study and accounted for 35.6% of all spring perennial cover recorded during the study but occurred at only 28 of 96 plots in 2017. Where it did occur, mayapple accounted for 54.3 ± 5.9% of spring perennial cover, indicating that this particular species may have driven the high variability in spring perennial cover and masked responses in the rest of the spring flora.
We observed a delay in the recovery of the FQI during the first year post-treatment, despite immediate increases in species richness, corresponding with concurrent declines in Cave. FQI values two years after removal in this study were slightly lower than those calculated after Lonicera morrowii removal in Pennsylvania [35], likely due to the smaller plot size used in this study (4 m2 vs. 5 m2). However, Cave values in removal areas in 2017 were lower than comparable reference sites in the Central Till Plain (e.g., mature upland forest: Cave = 3.3 [34]), indicating that initial honeysuckle removal treatments at these sites did not completely restore the quality of the understory community to that of a similar uninvaded habitat.
In addition to focusing on Amur honeysuckle, two features of this study set it apart from previous comparisons of the effectiveness of forestry mulching heads and cut-stump treatments for invasive shrub removal and impacts on understory community [12,16]. Namely, we did not apply any sort of follow-up treatment to control regrowth from stumps during the 21-month period following initial removal covered by this study and we specifically separated the effects of mulch deposition from physical effects of the two removal methods. We decided against follow-up foliar herbicide applications in order to inform how initial shrub control treatments would influence the vigor of regrowth and assess the necessity for follow-up treatments. Waiting until the second post-treatment growing season to apply follow-up treatments, typically foliar herbicide applications, is likely to require greater herbicide volumes and time investment due to an increase in the number of resprouting stumps that attain heights 0.5–1.37 m (Figure 3c) or even reach the sapling layer (>1.37 m). This increase in larger honeysuckle individuals corresponded with greater honeysuckle cover in the second year post-treatment, despite steep declines in the number of smaller honeysuckle seedlings. We observed increases in native plant cover and diversity despite invasive shrub cover rebounding quickly, which is consistent with other findings that follow-up treatments do not impact native community recovery in the short term [12].
Mulch deposition had small effects on honeysuckle resprout height and soil temperature variability. While mulch deposition had no statistically significant effects on native plant community recovery in this study, there were consistent trends of mulch having effects counter to those of the mulching head removal method in isolation, which may be responsible for the similar responses observed between operational Cut[−] and MH[+] treatments (Table 4).

5. Conclusions

This study indicates that forestry mulching heads are a promising tool for expediting the removal of heavy shrub invasions from eastern hardwood forests and thereby restoring the native forest understory community. Native plant community responses were similar between the mulching head and cut-stump treatments and increases in Amur honeysuckle seedlings following mulching head treatment were largely temporary. Although the mulching head treatment was slightly less effective than the cut-stump method at preventing honeysuckle regrowth in this study, our results indicate that greater treatment depth with the mulching head can reduce post-treatment shrub volume. Furthermore, its ability to remove mature invasive shrubs rapidly over large areas may help to reduce recolonization from adjacent seed sources when used in a management context. This potential for reduced propagule pressure at the landscape scale, and possible implications for invasion dynamics, should be the subject of future research. Floristic quality indices showed a relatively weak response to any shrub removal technique in this study, suggesting that these communities are dominated by disturbance-tolerant species that may have relatively low conservation value. Therefore, removal of invasive woody plants is only one of a suite of approaches that managers may need to employ to restore many degraded hardwood forests.

Supplementary Materials

Original data and R code used in analyses are available online at https://www.mdpi.com/1999-4907/9/10/607/s1.

Author Contributions

Conceptualization: G.S.F., M.R.S., and M.A.J.; Data Curation: G.S.F.; Formal Analysis: G.S.F.; Funding Acquisition: M.A.J.; Investigation: G.S.F. and M.A.J.; Methodology: M.R.S. and M.A.J.; Project Administration: M.A.J.; Resources: M.R.S. and M.A.J.; Software: G.S.F.; Supervision: M.A.J.; Validation: G.S.F., M.R.S., and M.A.J.; Visualization: G.S.F.; Writing—Original Draft: G.S.F.; Writing—Review and Editing: M.R.S. and M.A.J.

Funding

Funding for this study was provided by the Hardwood Tree Improvement Center at Purdue University with funds from the Fred M. van Eck Foundation for Purdue University. Additional funding was provided by the USDA National Institute of Food and Agriculture, McIntire Stennis Cooperative Forestry Research Program (project IND011533MS).

Acknowledgments

We gratefully acknowledge the assistance of Brian Beheler, Michael Loesch-Fries, Charlotte Owings, Ivy Widick, and Will Zak in implementing treatments and collecting field data.

Conflicts of Interest

The authors declare no conflicts of interest.

References

  1. Webster, C.R.; Jenkins, M.A.; Jose, S. Woody invaders and the challenges they pose to forest ecosystems in the eastern United States. J. For. 2006, 104, 366–374. [Google Scholar] [CrossRef]
  2. Mascaro, J.; Schnitzer, S.A. Rhamnus cathartica L. (common buckthorn) as an ecosystem dominant in southern Wisconsin forests. Northeast. Nat. 2007, 14, 387–402. [Google Scholar] [CrossRef]
  3. Hartman, K.M.; McCarthy, B.C. Restoration of a forest understory after the removal of an invasive shrub, Amur honeysuckle (Lonicera maackii). Restor. Ecol. 2004, 12, 154–165. [Google Scholar] [CrossRef]
  4. Schulte, L.A.; Mottl, E.C.; Palik, B.J. The association of two invasive shrubs, common buckthorn (Rhamnus cathartica) and Tartarian honeysuckle (Lonicera tatarica), with oak communities in the midwestern United States. Can. J. For. Res. 2011, 41, 1981–1992. [Google Scholar] [CrossRef]
  5. Collier, M.H.; Vankat, J.L.; Hughes, M.R. Diminished plant richness and abundance below Lonicera maackii, an invasive shrub. Am. Midl. Nat. 2002, 147, 60–71. [Google Scholar] [CrossRef]
  6. Meiners, S.J. Apparent competition: An impact of exotic shrub invasion on tree regeneration. Biol. Invasions 2007, 9, 849–855. [Google Scholar] [CrossRef]
  7. Schmidt, K.A.; Whelan, C.J. Effects of exotic Lonicera and Rhamnus on songbird nest predation. Conserv. Biol. 1999, 13, 1502–1506. [Google Scholar] [CrossRef]
  8. Watling, J.I.; Hickman, C.R.; Orrock, J.L. Invasive shrub alters native forest amphibian communities. Biol. Conserv. 2011, 144, 2597–2601. [Google Scholar] [CrossRef]
  9. Luken, J.O.; Mattimiro, D.T. Habitat-specific resilience of the invasive shrub Amur honeysuckle (Lonicera maackii) during repeated clipping. Ecol. Appl. 1991, 1, 104–109. [Google Scholar] [CrossRef] [PubMed]
  10. Bailey, B.G.; Saunders, M.R.; Lowe, Z.E. A cost comparison of five midstory removal methods. In Proceedings of the 17th Central Hardwood Forest Conference, Lexington, KY, USA, 5–7 April 2010; pp. 535–543. [Google Scholar]
  11. Ducrey, M.; Turrel, M. Influence of cutting methods and dates on stump sprouting in Holm oak (Quercus ilex L) coppice. Ann. For. Sci. 1992, 49, 449–464. [Google Scholar] [CrossRef]
  12. Ward, J.S.; Williams, S.C.; Worthley, T.E. Comparing effectiveness and impacts of Japanese barberry (Berberis thunbergii) control treatments and herbivory on plant communities. Invasive Plant Sci. Manag. 2013, 6, 459–469. [Google Scholar] [CrossRef]
  13. Hanula, J.L.; Horn, S.; Taylor, J.W. Chinese privet (Ligustrum sinense) removal and its effect on native plant communities of riparian forests. Invasive Plant Sci. Manag. 2009, 2, 292–300. [Google Scholar] [CrossRef]
  14. Flory, S.L.; Clay, K. Invasive plant removal method determines native plant community responses. J. Appl. Ecol. 2009, 46, 434–442. [Google Scholar] [CrossRef] [Green Version]
  15. Boyce, R.L. Recovery of native plant communities in southwest Ohio after Lonicera maackii removal. J. Torrey Bot. Soc. 2015, 142, 193–204. [Google Scholar] [CrossRef]
  16. Hudson, J.R.; Hanula, J.L.; Horn, S. Impacts of removing Chinese privet from riparian forests on plant communities and tree growth five years later. For. Ecol. Manag. 2014, 324, 101–108. [Google Scholar] [CrossRef]
  17. Shields, J.M.; Saunders, M.R.; Gibson, K.D.; Zollner, P.A.; Dunning, J.B.; Jenkins, M.A. Short-term response of native flora to the removal of non-native shrubs in mixed-hardwood forests of Indiana, USA. Forests 2015, 6, 1878–1896. [Google Scholar] [CrossRef]
  18. Luken, J.O.; Kuddes, L.M.; Tholemeier, T.C. Response of understory species to gap formation and soil disturbance in Lonicera maackii thickets. Restor. Ecol. 1997, 5, 229–235. [Google Scholar] [CrossRef]
  19. Miller, E.M.; Seastedt, T.R. Impacts of woodchip amendments and soil nutrient availability on understory vegetation establishment following thinning of a ponderosa pine forest. For. Ecol. Manag. 2009, 258, 263–272. [Google Scholar] [CrossRef]
  20. Bartuszevige, A.M.; Hrenko, R.L.; Gorchov, D.L. Effects of leaf litter on establishment, growth and survival of invasive plant seedlings in a deciduous forest. Am. Midl. Nat. 2007, 158, 472–477. [Google Scholar] [CrossRef]
  21. Cipollini, K.; Ames, E.; Cipollini, D. Amur honeysuckle (Lonicera maackii) management method impacts restoration of understory plants in the presence of white-tailed deer. Invasive Plant Sci. Manag. 2009, 2, 45–54. [Google Scholar] [CrossRef]
  22. Wilson, H.N.; Arthur, M.A.; Schörgendorfer, A.; Paratley, R.D.; Lee, B.D.; McEwan, R.W. Site characteristics as predictors of Lonicera maackii in second-growth forests of central Kentucky, USA. Nat. Areas J. 2013, 33, 189–198. [Google Scholar] [CrossRef]
  23. Luken, J.O. Population structure and biomass allocation of the naturalized shrub Lonicera maackii (Rupr.) Maxim. in forest and open habitats. Am. Midl. Nat. 1988, 119, 258–267. [Google Scholar] [CrossRef]
  24. Bartuszevige, A.M.; Gorchov, D.L. Avian seed dispersal of an invasive shrub. Biol. Invasions 2006, 8, 1013–1022. [Google Scholar] [CrossRef]
  25. Castellano, S.M.; Gorchov, D.L. White-tailed deer (Odocoileus virginianus) disperse seeds of the invasive shrub, amur honeysuckle (Lonicera maackii). Nat. Areas J. 2013, 33, 78–80. [Google Scholar] [CrossRef]
  26. Flory, S.L.; Clay, K. Invasive shrub distribution varies with distance to roads and stand age in eastern deciduous forests in Indiana, USA. Plant Ecol. 2006, 184, 131–141. [Google Scholar] [CrossRef]
  27. Shields, J.M.; Jenkins, M.A.; Saunders, M.R.; Zhang, H.; Jenkins, L.H.; Parks, A.M. Age distribution and spatial patterning of an invasive shrub in secondary hardwood forests. For. Sci. 2014, 60, 830–840. [Google Scholar] [CrossRef]
  28. Fridley, J.D. Extended leaf phenology and the autumn niche in deciduous forest invasions. Nature 2012, 485, 359–362. [Google Scholar] [CrossRef] [PubMed]
  29. Heberling, J.M.; Fridley, J.D. Functional traits and resource-use strategies of native and invasive plants in Eastern North American forests. New Phytol. 2013, 200, 523–533. [Google Scholar] [CrossRef] [PubMed]
  30. Web Soil Survey. Soil Survey Staff, Natural Resources Conservation Service, United States Department of Agriculture. Available online: https://websoilsurvey.sc.egov.usda.gov (accessed on 15 October 2015).
  31. Yatskievych, K. Field Guide to Indiana Wildflowers; Indiana University Press: Bloomington, IN, USA, 2000; ISBN 0-253-21420-3. [Google Scholar]
  32. Peet, R.K.; Wentworth, T.R.; White, P.S. A flexible, multipurpose method for recording vegetation composition and structure. Castanea 1998, 63, 262–274. [Google Scholar]
  33. Rothrock, P.E. Floristic Quality Assessment in Indiana: The Concept, Use, and Development of Coefficients of Conservatism; Final Report; ARN A: Indianapolis, IN, USA, 2004. [Google Scholar]
  34. Rothrock, P.E.; Homoya, M.A. An evaluation of Indiana’s floristic quality assessment. Proc. Indiana Acad. Sci. 2005, 114, 9–18. [Google Scholar]
  35. Love, J.P.; Anderson, J.T. Seasonal effects of four control methods on the invasive morrow’s honeysuckle (Lonicera morrowii) and initial responses of understory plants in a southwestern Pennsylvania old field. Restor. Ecol. 2009, 17, 549–559. [Google Scholar] [CrossRef]
  36. Bates, D.; Maechler, M.; Bolker, B.; Walker, S. Fitting linear mixed-effects models using lme4. J. Stat. Softw. 2015, 67, 1–48. [Google Scholar] [CrossRef]
  37. Sugiura, N. Further analysts of the data by akaike’s information criterion and the finite corrections. Commun. Stat. Theory Methods 1978, 7, 13–26. [Google Scholar] [CrossRef]
  38. Barton, K. MuMIn: Multi-Model Inference. R Package Version 1.15.6. Available online: https://CRAN.R-project.org/package=MuMIn (accessed on 10 January 2016).
  39. Kuznetsova, A.; Brockhoff, P.B.; Christensen, R.H.B. lmerTest: Tests in linear mixed effects models. J. Stat. Softw. 2017, 82, 13. [Google Scholar] [CrossRef]
  40. Hothorn, T.; Bretz, F.; Westfall, P. Simultaneous inference in general parametric models. Biom. J. 2008, 50, 346–363. [Google Scholar] [CrossRef] [PubMed]
  41. Polgar, C.; Gallinat, A.; Primack, R.B. Drivers of leaf-out phenology and their implications for species invasions: Insights from Thoreau’s Concord. New Phytol. 2014, 202, 106–115. [Google Scholar] [CrossRef] [PubMed]
  42. De Villalobos, A.E.; Vázquez, D.P.; Martin, J.L. Soil disturbance, vegetation cover and the establishment of the exotic shrub Pyracantha coccinea in southern France. Biol. Invasions 2010, 12, 1023–1029. [Google Scholar] [CrossRef]
  43. Kalisz, S.; Spigler, R.B.; Horvitz, C.C. In a long-term experimental demography study, excluding ungulates reversed invader’s explosive population growth rate and restored natives. Proc. Natl. Acad. Sci. USA 2014, 111, 4501–4506. [Google Scholar] [CrossRef] [PubMed]
  44. Biswas, S.R.; Wagner, H.H. A temporal dimension to the stress gradient hypothesis for intraspecific interactions. Oikos 2014, 123, 1323–1330. [Google Scholar] [CrossRef]
  45. Packer, A.; Clay, K. Soil pathogens and spatial patterns of seedling mortality in a temperate tree. Nature 2000, 404, 278–281. [Google Scholar] [CrossRef] [PubMed]
  46. Orrock, J.L.; Christopher, C.C.; Dutra, H.P. Seed bank survival of an invasive species, but not of two native species, declines with invasion. Oecologia 2012, 168, 1103–1110. [Google Scholar] [CrossRef] [PubMed]
  47. Kuebbing, S.E.; Classen, A.T.; Call, J.J.; Henning, J.A.; Simberloff, D. Plant-soil interactions promote co-occurrence of three nonnative woody shrubs. Ecology 2015, 96, 2289–2299. [Google Scholar] [CrossRef] [PubMed]
  48. DeWalt, S.J.; Denslow, J.S.; Ickes, K. Natural-enemy release facilitates habitat expansion of the invasive tropical shrub Clidemia hirta. Ecology 2004, 85, 471–483. [Google Scholar] [CrossRef]
  49. Dorrough, J.; Scroggie, M.P. Plant responses to agricultural intensification. J. Appl. Ecol. 2008, 45, 1274–1283. [Google Scholar] [CrossRef] [Green Version]
  50. Miller, K.E.; Gorchov, D.L. The invasive shrub, Lonicera maackii, reduces growth and fecundity of perennial forest herbs. Oecologia 2004, 139, 359–375. [Google Scholar] [CrossRef] [PubMed]
Figure 1. Schematic of an example site layout. Circles represent plot center points, with fill colors indicating different removal methods (cut-stump or mulching head). Removal methods were randomly assigned to each four-plot grouping (e.g., black square top-left) to avoid incidental impacts of the mulching head on non-target plots. Mulch cover (presence/absence) is represented by different fill patterns and was randomly assigned to two plots within each four-plot group. Circles with solid gray fill indicate reference plots (to the right of the dashed line). Spacing between plots in the same group was 8 m and spacing between plots of different groups was 11 m.
Forests 09 00607 g001
Figure 2. Relationship between mulching head treatment depth and the volume of resprouting shrubs. R2 = 0.311, p < 0.01. Different symbols correspond to each site and shading indicates the 95% confidence interval. Shrub removal treatments and measurements of resprouting shrubs were conducted in winter and spring 2017, respectively, at three separate sites, near West Lafayette, IN, USA. Sites were located in the same areas (LF and PWA) but were distinct from sites used in comparing mulching head and cut-stump treatments. Negative x-axis values indicate distance above soil surface.
Forests 09 00607 g002
Figure 3. Honeysuckle responses to removal treatments conducted in November and December 2015, including percent cover below 1 m (a), density of honeysuckle seedlings <0.5 m tall (b), and density of honeysuckle seedlings 0.5–1.37 m tall (c). Honeysuckle removal was accomplished using cut-stump or forestry mulching head (“MH”) treatments, with mulch removed/absent or added/present. Honeysuckle were not removed in reference areas for comparison. Dashed lines indicate management techniques with mulch manipulated (added/removed) and solid lines represent operational (no mulch manipulation) management techniques. Values are means ± standard error. Data were collected from mid-July to late August at four mature secondary hardwood forest sites near West Lafayette, IN, USA.
Forests 09 00607 g003
Figure 4. Densities (a) and diversity indices (bd) of native woody species prior to invasive shrub removal (2015) and following shrub removal (2016–2017) accomplished using cut-stump or forestry mulching head (“MH”) treatments, with mulch removed/absent or added/present. Invasive shrubs were not removed in reference areas for comparison. Dashed lines indicate management techniques with mulch manipulated (added/removed) and solid lines represent operational (no mulch manipulation) management techniques. Values are means ± standard error. Data were collected from mid-July to late August at four mature secondary hardwood forest sites near West Lafayette, IN, USA.
Forests 09 00607 g004
Figure 5. Percent cover (a) and diversity indices (bd) of spring perennial herbaceous plants prior to invasive shrub removal (2015) and following shrub removal (2016–2017) accomplished using cut-stump or forestry mulching head (“MH”) treatments, with mulch removed/absent or added/present. Invasive shrubs were not removed in reference areas for comparison. Dashed lines indicate management techniques with mulch manipulated (added/removed) and solid lines represent operational (no mulch manipulation) management techniques. Values are means ± standard error. Data were collected from mid-July to late August at four mature secondary hardwood forest sites near West Lafayette, Indiana, USA.
Forests 09 00607 g005
Figure 6. Percent cover (a) and diversity indices (bd) of understory herbaceous plant species prior to invasive shrub removal (2015) and following shrub removal (2016–2017) accomplished using cut-stump or forestry mulching head (“MH”) treatments, with mulch removed/absent or added/present. Invasive shrubs were not removed in reference areas for comparison. Dashed lines indicate management techniques with mulch manipulated (added/removed) and solid lines represent operational (no mulch manipulation) management techniques. Values are means ± standard error. Data were collected from mid-July to late August at four mature secondary hardwood forest sites near West Lafayette, IN, USA.
Forests 09 00607 g006
Figure 7. Floristic quality index (FQI) for understory communities, including exotic species, before (2015) and after (2016 and 2017) invasive shrub removal was accomplished using cut-stump or forestry mulching head (“MH”) treatments, with mulch removed/absent or added/present. Invasive shrubs were not removed in reference areas for comparison. Dashed lines indicate management techniques with mulch manipulated (added/removed) and solid lines represent operational (no mulch manipulation) management techniques. Values are mean FQI ± standard error. Data were collected from four mature secondary hardwood forest sites near West Lafayette, IN, from mid-July to early August each year.
Forests 09 00607 g007
Table 1. Mean basal area (m2 ha−1) of overstory tree species at each site. Three sites were at the Richard G. Lugar Forestry Farm (LF1–3) and a fourth was at the Purdue Wildlife Area (PWA) in West Lafayette, IN. Data were collected using a variable radius plot (basal area factor = 2.296 m2 ha−1) during summer 2016 in treatment areas and winter 2016–2017 in reference areas.
SpeciesCommon NameBasal Area
LF1LF2LF3PWA
Acer saccharinum L.silver maple------1.53
Acer saccharum Marshallsugar maple2.301.153.83--
Carya spp. Nutt.hickory species0.775.365.748.04
Celtis occidentalis L.common hackberry0.77--2.300.38
Cornus florida L.flowering dogwood0.38------
Crataegus spp. L.hawthorn species0.380.77----
Fraxinus americana L.white ash1.912.303.44--
Juglans nigra L.black walnut2.303.061.53--
Liriodendron tulipifera L.tulip tree0.77------
Morus alba L.white mulberry------0.77
Picea rubens Sarg.red spruce----2.30--
Platanus occidentalis L.American sycamore--0.38----
Prunus serotina Ehrh.black cherry3.440.771.916.12
Quercus alba L.white oak--3.06--2.30
Quercus imbricaria Michx.shingle oak--1.910.381.15
Quercus rubra L.northern red oak4.21--0.381.53
Quercus velutina Lam.black oak0.381.53--1.91
Robinia pseudoacacia L.black locust--0.770.38--
Sassafras albidum (Nutt.) Neessassafras3.06----2.68
Tilia americana L.American basswood0.38--0.38--
Ulmus americana L.American elm0.770.380.77--
Ulmus rubra Muhl.slippery elm0.77--0.77--
Total Site Basal Area 22.5821.4324.1126.40
Table 2. Honeysuckle resprouting responses to cut-stump and forestry mulching head removal treatments. Models were selected using Akaike’s Information Criterion corrected for small sample sizes (AICc). Resprouting data were collected in 28.27 m2 circular plots in late-April to early-May 2016 following shrub removal treatments the previous November–December at four mature secondary hardwood forest sites near West Lafayette, IN, USA.
Cut-StumpMulching HeadModel Predictors
No MulchWith MulchNo MulchWith Mulch Test Statisticp-Value
Resprouting stump density 100 m−280 ± 2389 ± 2495 ± 2495 ± 25TreatmentF3,51 = 0.770.52
Shrubs(lg)F1,50 = 27.54<0.01
Shrubs(sm)F1,51 = 0.600.44
Seedlings(sm)F1,53 = 2.800.10
Treatment × Shrubs(sm)F3,51 = 3.750.02
Height of resprouting stumps (cm)31 ± 226 ± 325 ± 225 ± 2TreatmentF3,56 = 2.700.054
Seedlings(lg)F1,56 = 2.420.13
Treatment × Seedlings(lg)F3,56 = 2.850.046
Stems per resprouting stump11 ± 18 ± 19 ± 110 ± 1TreatmentF3,54 = 3.850.01
Shrubs(lg)F1,4 = 8.610.04
Shrubs(sm)F1,53 = 4.810.03
Treatment × Shrubs(lg)F3,54 = 3.430.02
Shrubs(lg): Pretreatment density of honeysuckle individuals >1.37 m tall and >5 cm diameter, Shrubs(sm): >1.37 m tall and <5 cm diameter, Seedlings(lg): 0.5–1.37 m tall, Seedlings(sm): <0.5 m tall.
Table 3. Percent cover (mean ± standard error) of understory honeysuckle, midstory honeysuckle, and overall canopy in response to cut-stump and mulching head honeysuckle control. Understory, midstory, and canopy cover were estimated in four 1-m2 quadrats, one 4-m2 quadrat, or four spherical densiometer readings, respectively, at each plot. F and p-values are from linear mixed models testing whether each variable varied between treatments. Satterthwaite’s approximation for degrees of freedom was used to estimate p-values and p-values are presented to the nearest integer. Data were collected in late July to early August each year at four mature secondary hardwood forest sites near West Lafayette, IN, USA.
Ref.Cut-StumpMulching Head
--No MulchWith MulchNo MulchWith MulchF Value [df]p-Value
Canopy cover (%)2015 (Pretreatment)95 ± 0.394 ± 0.694 ± 0.694 ± 0.494 ± 0.41.26 [4,88]0.29
2015–2016 Change−2 ± 0.3−4 ± 0.9−3 ± 0.9−5 ± 0.9−4 ± 0.94.55 [4,88]<0.01
2015–2017 Change1 ± 0.4−2 ± 0.8−3 ± 0.9−3 ± 0.7−3 ± 0.88.13 [4,88]<0.01
Midstory (1–5 m) L. maackii cover (%)2015 (Pretreatment)68 ± 4.555 ± 6.760 ± 6.676 ± 6.154 ± 8.72.01 [4,91]0.10
2015–2016 Change9 ± 2.5−54 ± 6.8−60 ± 6.6−76 ± 6.1−54 ± 8.744.12 [4,90]<0.01
2015–2017 Change4 ± 3.4−52 ± 7.5−59 ± 6.6−75 ± 6.2−52 ± 8.633.93 [4,91]<0.01
Herb-layer (0–1 m) L. maackii cover (%)2015 (Pretreatment)18 ± 2.727 ± 3.729 ± 4.023 ± 3.824 ± 4.43.50 [4,88]0.01
2015–2016 Change−5 ± 1.3−17 ± 3.2−20 ± 3.9−4 ± 4.3−11 ± 4.57.86 [4,88]<0.01
2015–2017 Change−4 ± 1.7−12 ± 3.1−15 ± 4.20 ± 3.8−7 ± 3.54.50 [4,88]<0.01
Table 4. Linear mixed effects model results for understory community response metrics to different shrub removal treatments, including richness (S), Shannon’s diversity index (H′), and Pielou’s evenness (J′) each subset of understory taxa, floristic quality index (FQI) for the entire understory community, and cover of herbaceous plant groups based on life history strategy. Treatments included cut-stump (C) or forestry mulching head (M), with mulch ([+]) or without ([−]), and an untreated reference (R). Spring perennial cover data were collected late-April to early-May and all other data were collected mid-July to early-August from 2015 to 2017 at four mature secondary hardwood forest sites near West Lafayette, IN, USA.
TreatmentTreatment × Year
ANOVAANOVAPlanned Comparisons (z Values)
dfFdfFR vs. 0R vs. C[−]R vs. M[+]C[−] vs. M[+]C vs. M[−] vs. [+]
L. maackii
Herb-Layer Cover (<1 m)4, 812.25 ·4, 913.91 **−1.51−2.37 ·−0.231.853.46 **−0.84
Seedlings <0.5 m 4, 692.40 ·4, 1320.63------------
Seedlings 0.5–1.37 m4, 1050.444, 1871.30------------
Herb-Layer Native Plants ††
Cover4, 710.314, 9114.37 **−1.805.84 **4.91 **−0.81−0.10−1.05
FQI4, 890.434, 912.91 **0.712.64 *2.15−0.43−0.640.04
S4, 981.774, 14529.06 **0.367.73 **8.10 **−2.032.48 ·0.32
H′4, 804.064, 917.36 **1.703.45 **4.02 **0.502.26−1.55
J′4, 802.11 ·4, 851.49------------
Spring Perennials
Cover4, 872.43 ·4, 911.57------------
S4, 889.414, 910.39------------
H′4, 880.784, 912.17 ·2.71 *1.251.01−0.211.63−1.93
J′4, 732.67 *4, 823.66 **0.48−0.312.50 ·2.37 ·3.31 **0.16
Summer Herbs
Cover4, 760.454, 9121.52−1.015.97 **6.59 **0.541.83−1.06
S4, 1141.654, 14718.69 **0.886.10 **6.34 **0.212.13−1.83
H′4, 821.574, 919.88 **0.934.22 **4.98 **0.662.11−1.19
J′ 4, 671.704, 680.73------------
Annual Natives4, 1270.864, 992.20 ·−0.010.690.98−0.33−0.49−0.59
Biennial Natives4, 870.694, 912.92 *0.250.640.800.38−0.050.24
Perennial Natives4, 860.204, 9114.33 **0.161.972.74 *−1.971.62−0.25
Native Vines4, 851.434, 918.13 **−2.253.10 **3.14 **0.270.810.77
Native Graminoids4, 960.604, 1765.87 **0.250.141.73−0.872.37 ·1.06
Exotics4, 17215.904, 1692.18 ·−0.280.190.03−1.10−0.06−0.82
Native Seedlings
Cover4, 840.634, 1825.03 **−2.51 ·3.89 **2.18−1.49−0.56−1.54
Density4, 560.784, 912.44 ·−2.172.85 *1.15−1.48−1.93−0.16
S4, 851.554, 919.79 **−1.364.48 **5.04 **0.490.620.07
H′4, 871.694, 918.30 **−1.274.25 **4.41 **0.140.69−0.49
J′4, 771.284, 753.08 *−1.542.272.31 ·0.011.28−1.26
· p < 0.10; * p < 0.05; ** p < 0.01; †† Includes all native woody and herbaceous species from summer sampling period; does not include spring perennials; Site PWA excluded due to an excessive number of zero values prior to shrub removal.

