Article

Effects of Douglas Fir Stand Age on Soil Chemical Properties, Nutrient Dynamics, and Enzyme Activity: A Case Study in Northern Apennines, Italy

1
Dipartimento di Scienze e Tecnologie Agro-alimentari, Alma Mater Studiorum—Università di Bologna, Via Fanin, 40, 40127 Bologna, Italy
2
Dipartimento per la Innovazione nei sistemi Biologici, Agroalimentari e Forestali—Università degli Studi della Tuscia, via San Camillo de Lellis, 01100 Viterbo, Italy
*
Author to whom correspondence should be addressed.
Forests 2018, 9(10), 641; https://doi.org/10.3390/f9100641
Submission received: 6 August 2018 / Revised: 27 September 2018 / Accepted: 9 October 2018 / Published: 13 October 2018

Abstract

:
The aim of this study was to determine the effect of a Douglas fir plantation along a stand chronosequence in the North Apennine (Italy) on soil carbon and nitrogen stocks, as well as on soil chemical and biochemical properties involved in the nutrients biogeochemical cycle. In 2014, three sites of Douglas fir stands, aged 80, 100, and 120 years, were selected in Vallombrosa forest to study the dynamics of soil nutrients in the ecosystem. Along the Douglas fir chronosequence, general evidence of surface element accumulation was found, including a conspicuous increase of alkaline element with respect to Al, which was attributed to the increase of soil pH along the Douglas fir stand age classes. A general increase of specific enzyme activity (per unit of organic carbon) and functional diversity were observed in the epipedon of the Douglas fir stand over 100 years of age. Moreover, the (chitinase + leucine aminopeptidase) to acid phosphatase ratio progressively increased from 0.15 to 0.31 in the epipedon of the chrononsequence, while the β-glucosidase to (chitinase + leucine aminopeptidase) ratio decreased from 1.45 to 0.83, suggesting nitrogen limitation with respect to carbon. In fact, the soil carbon stock progressively increased along the chronosequence, in the epipedon from 17 to 53 Mg C ha−1 and in the endopedon from 17 to 37 Mg C ha−1. Conversely, the soil nitrogen stock increased from 1.2 to 2.4 Mg N ha−1, but not over the 100-year-old stand class. In conclusion, soil organic matter accumulation became sufficient to define the umbric horizon in the Northern Apennines when the Douglas fir plantation reached the age of 100 years. Over this age class of plants, a limitation of soil nitrogen may occur, affecting enzyme activities regulating the biogeochemical cycle of nutrients.

1. Introduction

Regenerating forests and plantations may represent important C sinks because of the C storage in both plant biomass and soils [1]. The forest floor comprises the most dynamic part of soil organic carbon (SOC) stock; therefore, it is important to predict the effects of forest ecosystem management on SOC stock [2]. In addition, forest ecosystems are rarely studied concerning their temporal dynamics, although it has been demonstrated that changes in soil organic matter (SOM) dynamics occur with forest aging [3,4]. Plant succession and associated space-for-time substitutions are an important and often necessary tool for studying temporal dynamics of soil processes involved in C sequestration across multiple time-scales [5]. They can be reliably used to study aspects of soil development and changes in SOM that occur between temporally linked sites over time-scales of centuries to millennia. Douglas fir (Pseudotsuga menziesii Mirb. Franco) has played an important role in Italian plantation forestry because, within its optimal vegetation zone, which ranges from 600 to 1000 m above sea level, no indigenous conifer has similar characteristics of productivity and timber quality [6]. It is known that in the North Apennine before the Second World War (year 1940), the reforestation of Douglas fir had the main purpose of occupying the areas degraded for grazing or those that were subjected to excessive clearing, mostly during the First World War [7,8]. In this context, soil was strongly eroded and showed an impoverished epipedon with low nutrient contents and humified organic matter. The Douglas fir reforestation of marginal areas of forest with low productivity then had the principal purpose of recovering this deficiency and improving soil fertility. In fact, it is known that Douglas fir plantations provide a prompt increase of SOM content [9], even if different compositions of SOM may also occur [10]. For instance, a significant reduction in the aromatic substance content of dissolved organic C was found in litter leachates of the Douglas fir species compared to that of other plantations [10]. To fully understand the mechanistic responses of belowground C and the dynamics of changing SOM properties, microbial activity parameters such as enzyme activity must be considered. The most widely assayed enzymes are those involved in the degradation of lignocellulose (e.g., cellobiohydolase and β-glucosidase), proteins, chitin, and peptidoglycan (e.g., leucine aminopeptidase and N-acetyl-β-glucosaminidase), or hydrolyzing nucleic acids, phospholipids, and other ester phosphates (e.g., acid or alkaline phosphatase) [11]. Sinsabaugh et al. [12] found that the ratios between those enzymatic activities may reflect the equilibria between the elemental composition of microbial biomass and detrital organic matter as well as the efficiencies of microbial nutrient assimilation and growth. Therefore, the enzymatic ratios provide a functional measure of the threshold at which the balance of elements in ecological and pedogenetic processes can be controlled [12].
Moreover, the plant cover affects the soil profile development of Cambisols with different expressions of the eutric qualifier [13] through changes of SOM stability and soil pH [14]. However, little is known about the effect of exotic species age, such as Douglas fir, on soil processes involved in carbon sequestration and nutrient dynamics, as well as on the biogeochemical cycle of elements along soil profiles [15]. Nitrogen (N) might be the primary limiting nutrient in these forests under various management; thus, N retention can be critical for long-term productivity [16]. Of particular interest in stand recovery is the point at which N losses resulting from clear-cutting become equal to levels found in old-growth forests [17,18]. In a previous chronosequence study, it was demonstrated that the sustainable management of Douglas fir in the Monts du Beaujolais (France) might preclude a rotation shorter than 50 years [19], while Marques et al. [20] suggested that the sustainable management of Douglas fir stands may require nutrient input by fertilization. Jussy et al. [21] reported that as nutrient losses decrease with the increasing stand age of Douglas fir, forest rotations of over 60 years are recommended, as fertility budgets are closer to equilibrium. However, the optimum age of Douglas fir to obtain high productivity, C sequestration, and soil quality improvement have never been tested in the North Apennine (Italy). For this reason, the hypothesis tested was that soil profile development under Douglas fir is depending on forest stand age. Therefore, the aim of this study was to determine the effect of Douglas fir plantation on soil carbon and nitrogen stocks, as well as on chemical and biochemical properties involved in the nutrient biogeochemical cycle in three stand age areas of the North Apennine (Italy).

2. Materials and Methods

The Vallombrosa Forest in 1866 became state property with the introduction of arboretum plants, some of them for experimental purposes. The drafting of the first settlement plan dates back to 1876 and was followed by others on a ten-year basis [22]. Those plans spited out the forest into cultivation compartments of about 20–30 ha, which in turn were subdivided into cultivation units (Forest parcels) [23].
The introduction of the experimental Douglas fir dates back to the late nineteenth century with the aim of spreading this exotic species in many areas of the northern Apennines for reforestation and soil improvement in degraded areas [24,25]. In this investigation three parcels of Douglas fir (Pseudotsuga menziesii Mirb. Franco) stands homogeneous for pedogenetic factors, as seen in Figure 1, aged 80, 100, and 120 years, were selected in the Vallombrosa Forest to study the dynamics of soil nutrients in the ecosystem. The Vallombrosa Forest is a State Natural Reserve Biogenetic, entered in the Official List of protected areas in accordance with Law 394/91. In addition, it is part of the Natura 2000 network, included within the Site of Community Importance “Vallombrosa Forest” and St. Anthony (code IT5140012), and it is also classified as a Site of Regional Importance (SIR) (Legge Regionale Toscana 56/2000). This area is located on a mountain range which extends from the Tuscan-Emilian Apennines, jutting out to the southeast to the step of Consume, then spreading in Pratomagno. The Reserve covers over 513 ha on the western side of the massif of Pratomagno, including the summit of Mount Secchieta (1440 m a.s.l.), to the village of Tosi (470 m a.s.l.) in the Northwest, as seen in Figure 1. The ridge is made of a single lithology, an Oligocene sandstone consisting of thick arenaceous beds intercalated with thin layers of siltstone. The mineralogical assemblage is composed mainly of quartz, feldspars, kaolinite, chlorite, and micas [26]. The climate at Vallombrosa is humid temperate, with a mean annual precipitation of about 1400 mm and a mean annual temperature of 10.2 °C. January is the coldest month (1.9 °C), while July the warmest (19.6 °C). Snowfall is frequent in winter and common in early spring [26].
Silver fir (Abies alba Mill.) and European beech (Fagus sylvatica L.) are the dominant tree species of the area; moreover, experimental plantations of exotic species, e.g., Douglas fir (Pseudotsuga menziesii Mirb. Franco), are present in parcels, representing reforestation stands with different ages [27].

2.1. Soil Sampling

Three areas of Vallombrosa Forest were chosen in 2014 for soil sampling, as seen in Figure 1. The three areas were selected to ensure similar pedological conditions except stand age, so that they represented a stand chronosequence with 80-, 100-, and 120-year-old plantations. The stand age within the areas is homogeneous according to the date of plantation documented by the settlement plan shown in Figure 1.
A soil profile was opened in each area (DOUG 8, DOUG 10, and DOUG 12 at elevations of 1047, 1026, and 943 m a.s.l., respectively) and taken as reference soil (about 1 m wide and 1 m deep); genetic horizons were described and then sampled in order to define the soil depth of epipedon and endopedon. The soil homogeneity within each area was assessed by a preliminary investigation on soil morphological features (soil horizons differentiation and depth) as systematic random locations along two 30 m transects. Then six soil samples were randomly collected across the same transects at each area to get replications of the epipedon (A1 and A2 soil superficial horizons) and endopedon (Bw, BC, C soil deep horizons) at each site.

2.2. Soil Bulk Density and Physicochemical Analyses

Four cylinders for each soil profile at the epi- and endopedons were collected to determine the bulk density of soils. Total bulk density is calculated by the following equation:
BD = TW/VH
where TW is the total oven-dry weight of soil removed from the metal cylinder; VH is the cylinder volume.
At the laboratory, the samples were oven-dried at 105 °C for 24 h and the oven-dry weight was determined. Organic carbon stocks, as shown in Equation (2), for fixed soil volumes of two soil layers (i) were calculated based on the bulk density (BD) as shown in Equation (1), the relative contribution of fine earth material (soil <2 mm) total soil mass, layer thickness, and organic carbon (OC) concentration which was determined for each soil sample collected in the random spots.
OC stock (t ha−1) = OCi concentration (g kg−1) BDi (g cm−3) × layer thickness (cm) × 0.1
All of the samples obtained by the genetic horizons were air-dried and sieved (<2 mm), and the soil analyses were carried out on the obtained fine earth fractions. The pH was determined potentiometrically in a 1:2.5 soil:deionized water suspension. The texture was obtained by the pipette method after the dispersion of the sample in a sodium hexametaphosphate solution [28]. Total organic C and total N content was determined by dry combustion (EA-1110 Thermo Scientific Lab, Waltham, MA, USA). The cation exchange capacity (CEC) was determined after exchange with 0.05 N cobalthexamine chloride solution [29,30]. The exchange acidity was determined in KCl 1 M. The total element concentrations were measured by Inductively Coupled Plasma-Optical Emission Spectrometry (ICP-OES, Ametek, Spectro Analytical Instruments, Kleve, Germany) after HNO3:HCl (1:3 v:v, suprapure Merck, Kenilworth, NJ, USA) microwave digestion of samples [14]. The amount of amorphous Al and Fe oxides, extracted with acid ammonium oxalate [31] allowed us to calculate the spodicity index (SI) [13] as Alo + 1/2Feo. The SI was calculated to assess if the cheluviation/chilluviation of organo-metal complexes was enhanced by the Douglas fir aging. Pedogenic aluminum oxides (Ald) were estimated through extraction with Na–dithionite–citrate–bicarbonate [32]. The Fe and Al content of the extracts were analysed by ICP-OES.

2.3. Soil Organic Matter Properties

For each genetic horizon the organic C was extracted (TEC) with a solution of 0.1 M NaOH and 0.1 M Na4P2O7 at 65 °C for 24 h. The humic acids (HA) were separated from TEC by acidification (pH < 2) and centrifugation, while fulvic acids (FA) were separated from the non-humified organic material by solid chromatography with polyvinyl pyrrolidone resin [33]. The organic C content in the TEC, HA, and FA fractions was determined by wet oxidation at 160 °C with K2Cr2O7 1/3 M, according to the method of Springer and Klee [34]. Following the determination of TEC and humic (HA and FA), the non-humic substances was obtained by the difference NH = TEC − (HA + FA) and the humification index [35] was calculated:
HI = [NH]/(HA + FA)

2.4. Soil Enzyme Activities and Functional Diversity

Soil enzyme activity provides a functional fingerprint of soil microbial communities and can be an indicator of nutrient biogeochemical change following Douglas fir ecosystem disturbance [36]. Therefore, a suite of enzymes was measured for each soil sample according to the methods of Marx et al. [37] and Vepsalainen et al. [38], based on the use of fluorogenic substrates. Soils were analyzed for β-cellobiohydrolase (EC 3.2.1.91), N-acetyl-β-glucosaminidase (EC 3.2.1.30), β-glucosidase (EC 3.2.1.21), α-glucosidase (EC 3.2.1.20), acid phosphatase (EC 3.1.3.2), xylosidase (EC 3.2.2.27), and Leucine aminopeptidase (EC 3.4.1.1) using 4-MUF-β-d-cellobioside, 4-MUF-N-acetyl-β-glucosaminide, 4-MUF-β-d-glucoside, 4-MUF-α-d-glucoside, 4-MUF-phosphate, 4-MUF-7-β-d-xyloside, and L-Leucine-7-amido-4-methylcoumarin hydrochloride as substrates, respectively.
A moist sample (equivalent weight to 2 g oven-dried material) was weighed in a sterile jar and 50 mL of Na-acetate buffer (pH 5.5) was added. A homogenous suspension was obtained by homogenizing with UltraTurrax at 9600 rpm for 3 min. Aliquots of 100 µL were withdrawn and dispensed into a 96-well microplate. Then, 100 µL of 1 mM substrate solution was added, giving a final substrate concentration of 500 µM. Fluorescence was measured after 0, 30, 60, 120, and 180 min of incubation at 30 °C. Fluorescence (excitation 360 nm; emission 450 nm) was measured with an automated fluorometric plate-reader (Fluoroskan Ascent). The enzyme specific activity (per unit of Corg) was calculated in order to keep the amount of organic matter as an internal control [39]. The Synthetic Enzymatic Index (SEI) was calculated as the sum of all enzyme activity, representing a synthetic measure of the microbial functional capacity [40]. In addition, the following indices were calculated to reveal the soil nutrient balance and soil development:
  • β-glucosidase to chitinase + leucine aminopeptidase ratio (BG/(NAG + LAP)), as an indicator of the nitrogen limitation with respect to carbon [12];
  • Chitinase + leucine aminopeptidase to acid phosphatase ratio (NAG + LAP)/PHOS), as an indicator of the phosphorus limitation with respect to nitrogen [41];
Finally, using the enzyme activities, the soil functional diversity was assessed by calculating the Shannon diversity index [42], corresponding to the entropy concept defined by:
H′ = −Σpi × ln pi
where pi is the ratio of the activity of a particular enzyme to the sum of all enzymatic activities [43,44].

2.5. Foliar Nutrients

Three samples, each including five mature sunny leaves, were collected per species on each half-plot. Total N and microelement (Fe, Mn, Al) contents were determined for these samples using elemental combustion analysis (EA-1110 Thermo Scientific Lab. (Waltham, MA, USA) and ICP-OES after HNO3:H2O2 (3:1.5 v:v, suprapure Merck (Kenilworth, NJ, USA) microwave digestion of samples, respectively. Data were expressed both on the leaf mass basis and the N-ratio basis [45]. The method is based on two main assumptions: (1) within a wide range, the concentration of a nutrient element is not per se essential to the “vitality” of a plant; the proportions of elements relative to nitrogen are just as important; and (2) the optimal proportion between nutrient elements is similar for all vascular plants and can be defined in relation to nitrogen.

2.6. Statistical Analysis

Differences in soil chemical and biochemical properties and organic C and N stocks were evaluated by one-way analysis of variance (ANOVA) with epipedon/endopedon as the factor, for each stand age; while the six independent samples collected at each area represented the soil replications. Before analysis, the homogeneity of variances was verified using Levene’s test. Statistical analysis was carried out using the JMP 9.0 statistical software package (SAS Institute, Cary, NC, USA).

3. Results

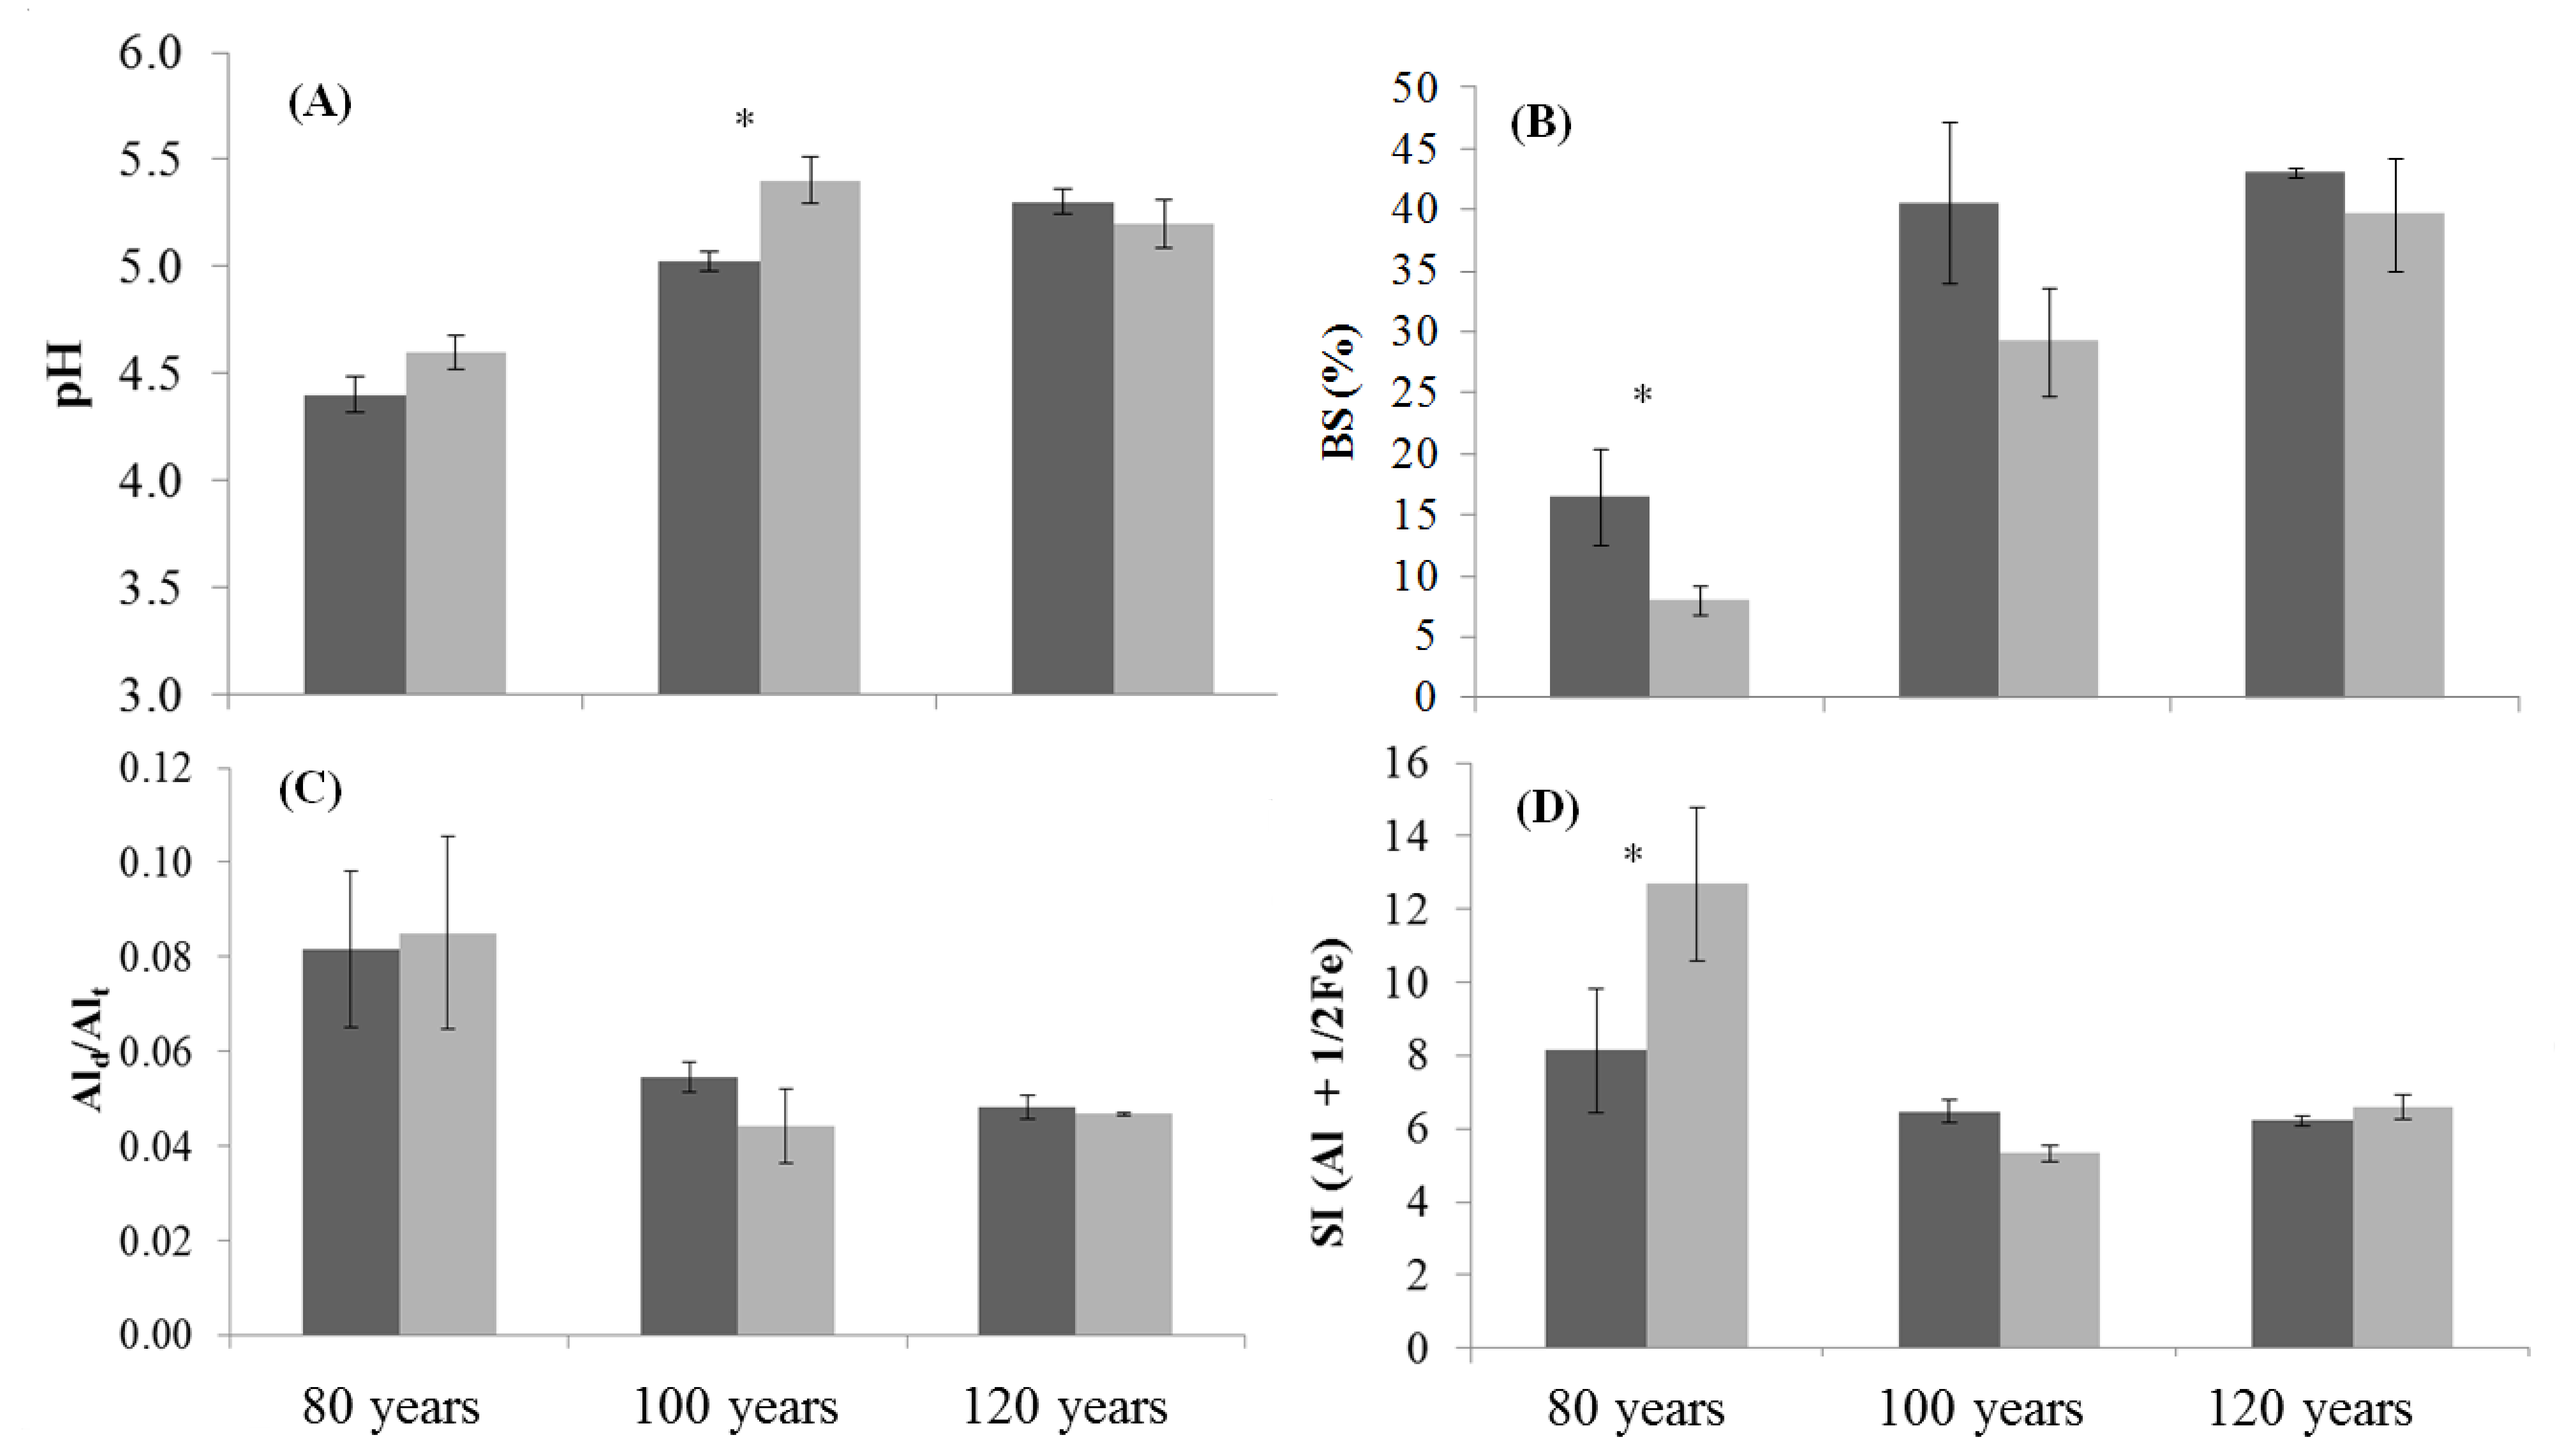
3.1. Soil Properties of Stand Age Classes

The soils showed a limited thickness with a lithic contact within 50 cm of the mineral soil surface. A progressive deepening of organo-mineral horizons was observed. Therefore, as seen in Figure 2, in the pedons DOUG10 and DOUG12, the sum of A horizons was higher than 20 cm. Under wet conditions, the colour of the surface layers varied from dark brown to brown and from dark reddish to brown in deeper horizons as seen in Table 1. The A1 and A2 horizons (epipedon) showed a value and chroma ≤3, recorded in Table 1. The main physicochemical properties of the investigated pedons are shown in Table 2. The pH values increased with pedon depth according to the stand age classes (ranging from 4.4 to 5.4), while the base saturation was less than 50% for all horizons. The soils texture was predominantly sandy. The organic C decreased with the depth of the soil profiles; in the epipedon, it was always higher than 20 g kg−1. According to the soil taxonomy, the pedon DOUG 8 is classified as Dystrudepts, while pedons DOUG10 and DOUG12 are classified as Humudepts [46] due to the clear identification of an umbric horizon [26]. In these last soil profiles, a differentiation of organic layers (Oi, Oe, Oa) was observed to deepen on organo-minerals horizons as seen in Figure 2. Moreover, an increase of organic C content was observed in the epipedon along the chronosequence as shown in Table 2. Soil pH, cation exchange capacity, and base saturation (BS) in the soil upper layers increased from 80- to 120-year-old plantations, as seen in Figure 3A,B, while FAld/Alt as well as the spodicity index (Alo + 1/2Fe) decreased from 80- to 100-year-old plantations, as shown in Figure 3C,D.

3.2. Soil Carbon and Nitrogen Stocks

The soil C stock increased in both the epi- and endopedons with increasing stand age class, as seen in Figure 4A. The soil C storage in the epipedon of 80-, 100-, and 120-year-old plantations was 17, 37, and 53 Mg C ha−1, respectively. The nitrogen stock showed an increase in both the epi- and endopedons of 80- to 100-year-old stand ages, while a similar value was registered in 100- to 120-year-old plantations as seen in Figure 4B. The N storage in the epipedon of 80-, 100-, and 120-year-old plantations was 1.4, 2.6, and 3.0 Mg N ha−1. However, a significant reduction in the N stock was observed in the endopedon with respect to the epipedon of the oldest age class (1.4, 2.6, and 2.1 Mg N ha−1).

3.3. Foliar Nutrients

The nutrient foliar content of Fe, Al, and Mn increased as the age of the plantation increased. Conversely, the N content of leaves decreased with increasing stand age class as seen in Table 3. Therefore, when the elements were expressed according to the N-ratio, as shown in Table 3, the values were slightly reduced by the age of the plantation. The Fe/N and Al/N ratios ranged from 72 to 256 and 144 to 372, respectively, as seen in Table 3.

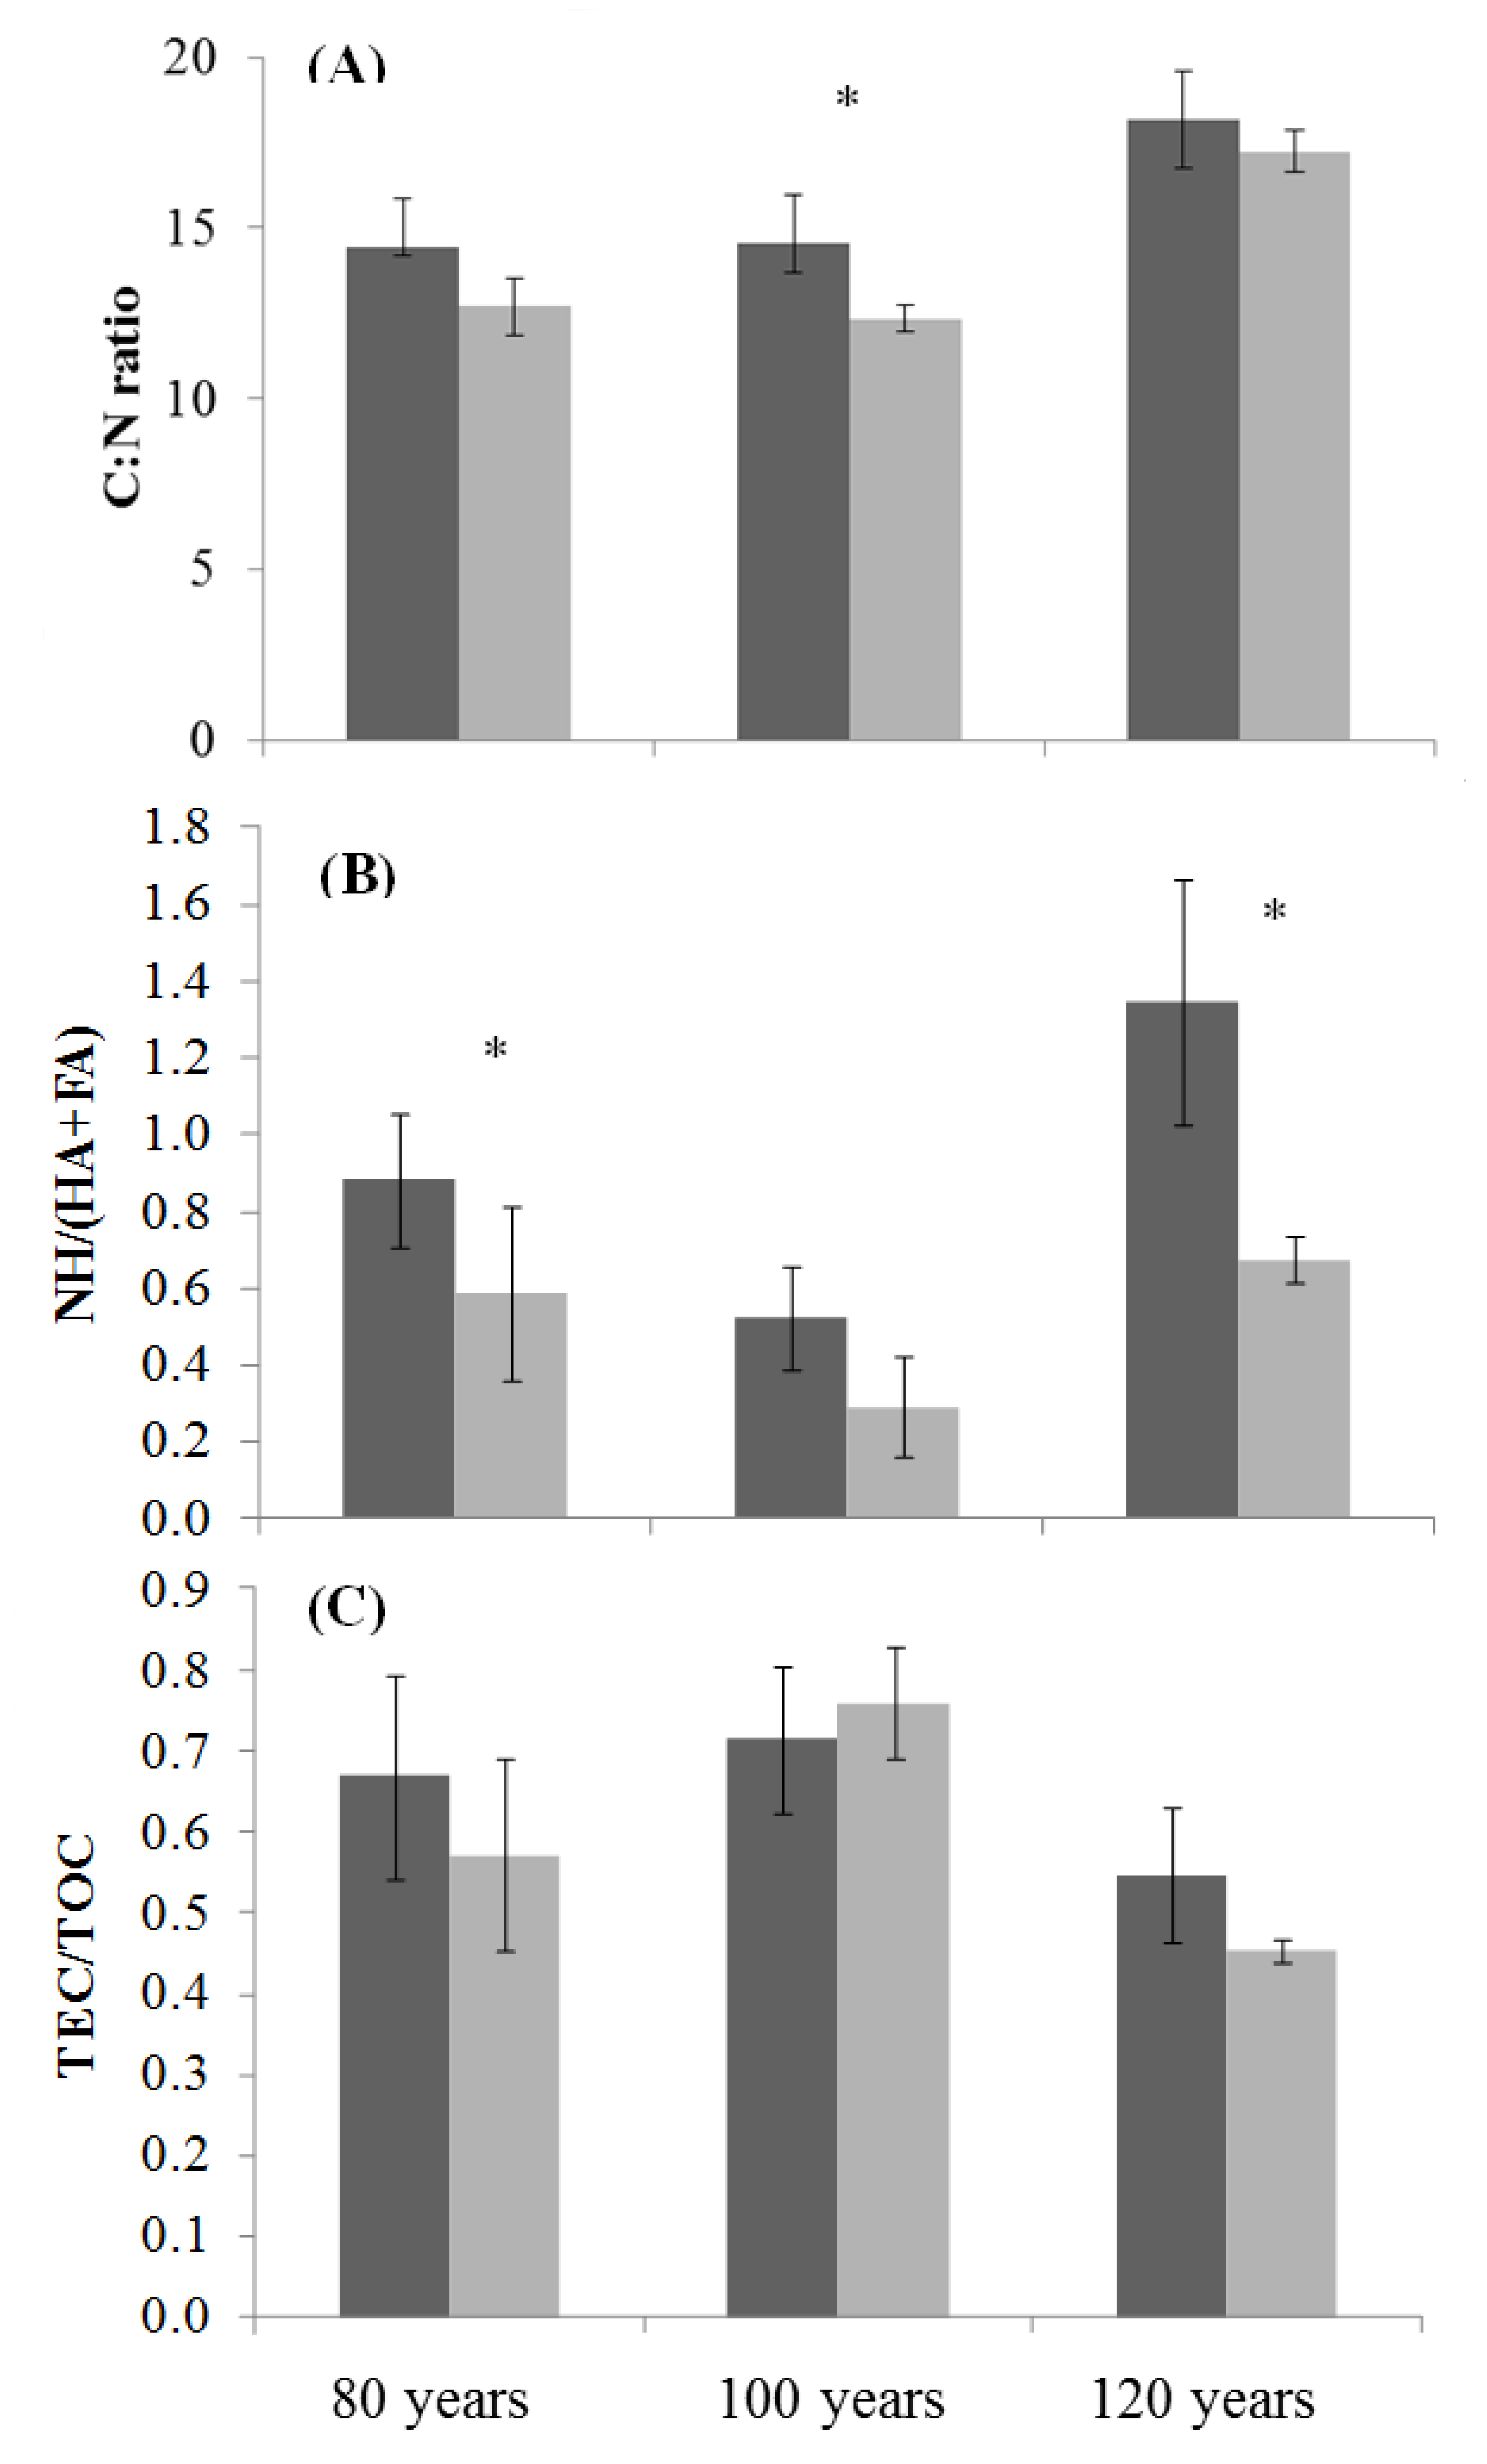
3.4. Soil Organic Matter Properties

The soil organic matter showed a higher C:N ratio in the epipedon than in the endopedon of the first two age classes (80 and 100 years). Conversely, similar values of 18 and 17 were registered in the surface and deep soil horizons of the oldest age class, while a general increase in the soil C:N ratio was registered in the epipedon of the oldest plantation (from 14 to 18), as seen in Figure 5A.
The humification index increased with an increase of non-humic substances pool, as shown in Figure 5B, especially in the surface soil from 100- to 120-year-old plantations. Conversely, a decrease of humic substances was detected as a reduction of the extractable to total carbon ratio in the highest age class (120 years), as seen in Figure 5C.

3.5. Soil Enzyme Activity and Functional Diversity

An increase of the Synthetic Enzymatic Index (SEI), expressed per unit of organic carbon, was observed in surface soil of 100 years old plantation maintaining similar values in the following age class, as seen in Figure 6A. The functional diversity, expressed by Shannon index calculated on enzyme activities base, seen in Figure 6B, was also significantly higher in the surface than in the deep soil and increased with the stand age class. Moreover, the (LAP + NAG)/PHO increased in the surface soil progressively from 80- to 120-year-old plantations, as shown in Figure 6C. Conversely, the BG/(LAP + NAG) showed an increase along the epipedon of the chronosequence, seen in Figure 6D.

4. Discussion

A considerable change of soil organic matter accumulation was observed passing through 80- to over 100-year-old age classes due to the clear identification of umbric horizon only in the last two age classes (100 and 120 years). Moreover, the maximum values of soil organic carbon stocks were reached in the epipedon and endopedon of the 120-year-old plantation (53 and 37 Mg C ha−1, respectively). The sum of the C stocks obtained in the two soil layers was 90 Mg C ha−1, and a similar value was obtained in a previous study conducted on Douglas fir plantations at the same elevation level in the North Apennine [9]. Conversely, in this area an average of 99.5 ± 45.8 Mg ha−1 was registered only in the epipedon of other forest species [26]. The C accumulation has been attributed to climatic and biological reasons, since drought and frigid temperature usually reduce microbial activity and organic matter mineralization. Moreover, the fraction of extractable carbon increased with the age of plantations even if in the last age class (120 years) a decline of humic substances may occur, because a soil nitrogen limitation was inferred from the decline of the N stock in the surface and deep soils. Certini et al. [48] found that about 60% of SOM in the umbric epipedon of the Vallombrosa Forest is not extractable by diluted alkali. This fraction includes both slightly decomposed organic matter and highly polymerized humic substances. However, it has been demonstrated that the extractable carbon has a prevalently non-humic nature [49], while molecules of high molecular weight with a low degree of aromaticity dominate [48]. Nitrogen is the primary limiting nutrient in Douglas fir plantations [50]. In this study, a critical gap for soil nitrogen was supposed in the over 100-year-old plantations since at this age a reduction of soil N stock was found and changes on biochemical indicators of nutrient unbalance were detected. Several recent studies on soil enzyme activity have considered a wide range of ecosystem types, extending to a large range of abiotic factors [51,52,53] in order to determine biochemical indicators, such as BG/(NAG + LAP) and (NAG + LAP)/PHO, to be used to assess nutrient imbalances. In this study, both of those ratios showed similar results in the endopedon but differences were recorded in the epipedon. In particular, in the epipedon the BG/(LAP + NAG) ratio decreased while the (LAP + NAG)/PHO increased along the chronosequence. Using data from a variety of ecosystems [12], the decrease of BG/(NAG + LAP) and the increase of (NAG + LAP)/PHOS along the chronosequence suggests a N imbalance compared with C and P. Compared with soils globally, our enzyme ratios suggest that all endopedons were N-limited with respect to C since BG/(NAG + LAP) = 0.6 was lower than the threshold value of 1.41 reported by Sinsabaugh et al. [12]. Conversely, the (NAG + LAP)/PHOS ratio ranging from 0.15 to 0.31 was not higher than the threshold value of 0.41; therefore, nitrogen limitation was not observed with respect to P. The ratio between N-scavenging enzymes to acid phosphatase may also represent a potential index to link enzyme activity to soil development [54,55]. In this study, since the obtained results showed no difference of N-scavenging enzymes to acid phosphatase in the deep mineral soil, the enzyme activities did not indicate changes in soil development along the chronosequence, although they were a sensitive indicator of nitrogen imbalance along the epipedon of the chronosequence.
In addition, an increase of soil-specific enzyme activities, expressed per unit of organic carbon, was observed mainly in 80- to 100-year-old plantations, while the specific enzyme activity of soil in the 120-year-old stand was similar to that of the previous age class (100 years). The enzyme activity of mineralizing microflora, per unit of organic carbon, was probably inhibited by the organic matter properties such as the higher C:N ratio and humification index, since a lower nitrogen availability occurred in the oldest stand class. This result suggested a different level of potentially hydrolyzing activity, depending on nitrogen depletions with respect to the carbon stock.
Even if coniferous litter is usually low in bases and broadleaf hardwood forests typically return to the soil a large amount of bases [56], Douglas fir—compared with domestic coniferous species—has lower acidifying effects on the upper soil layers and contributes to better humus forms, recycling nutrients more effectively and producing litter which could be easily decomposed [57]. In this study, the increase of soil pH, calcium, and base saturation from 80- to 120-year-old plantations suggests the surface accumulation of alkaline elements. Moreover, a higher amount of pedogenic Al oxides, both amorphous (Alo) and well-crystalline (Ald), was found in both the epi- and endopedons of the youngest plantation. The increase of pedogenic Al oxides along the soil profile of Douglas fir in the youngest plantation suggests a more expressed weathering process in these soils than in the oldest ones (100 and 120 years), an observation which is also supported by the high value of the Alo + 1/2Feo, especially in the deep soil. In fact, in the Castanetum zone, much shorter periods are normally required for the establishment of soil weathering than under subalpine vegetation, where the development of Cambisols from Leptosols was observed after 120 years of soil evolution driven by vegetation [58]. Therefore, this study detected changes in the SOM accumulation and quality which probably affect the weathering process in Douglas fir of age classes over 100 years, through a progressive increase of epipedon thickness. Finally, according to the stand age class, the slight increase of micronutrient content in needles suggests a positive effect of Douglas fir age on plant uptake. As regards to the foliar element content, the optimal proportion between nutrients is similar for almost all vascular plants, and can be defined as a nitrogen ratio [42]. In this study, the increase of element/n ratios with the increase of plantation age suggests that the soil nitrogen limitation to plant growth does not necessarily reduce the requirements for other nutrients.

5. Conclusions

The analysis of the nutrient pool and soil biochemical properties proved to be a useful information to guide management decisions defining the optimum age of Douglas fir to obtain high C sequestration and soil quality improvement in the North Apennine environment. In the specific area under study, a general evidence was found of surface element accumulation due to Douglas fir plantations. A more conspicuous accumulation of alkaline element with respect to Al was found according to the increase of soil pH along the Douglas fir stand age classes. Soil organic matter deposition became sufficient for umbric horizon definition when the Douglas fir plantation reached the age of 100 years. Over this age class, a limitation of soil nitrogen occurred, affecting microbial functional diversity and the biogeochemical cycle of nutrients. However, since the obtained results are referred to a specific single area for each stand age, further investigations in more sites are required to confirm those findings.

Author Contributions

Conceptualization, G.V. and L.V.A.; methodology, G.V. and L.V.A.; software, S.M.; validation, S.M., R.P., G.V. and L.V.A.; formal analysis, S.M. and L.V.A.; investigation, R.P., S.M., G.V. and L.V.A.; resources, S.M., G.V. and L.V.A.; data curation, L.V.A. and S.M.; writing—original draft preparation, S.M.; Writing—Review & Editing, S.M., G.V. and L.V.A.; Visualization, S.M., R.P., G.V. and L.V.A.; supervision, S.M.; project administration, L.V.A..; funding acquisition, S.M., G.V. and L.V.A.

Funding

This research received no external funding.

Acknowledgments

This study was carried out on the Pavari’s network of experimental plots for the introduction of exotic species in Italy, managed by the Research Centre for Forestry Council of Research and Experimentation in Agriculture (CRA-SEL). The study was conducted by a partnership between the Department of Agricultural Science Alma Mater Studiorum, University of Bologna and the Council for Research and Experimentation in Agriculture. The authors thank the staff of the State Forestry Territorial Office for Biodiversity Vallombrosa.

Conflicts of Interest

The authors declare no conflict of interest.

References

  1. Watson, R.T.; Noble, I.R.; Bolin, B.; Ravin-Dranath, N.H.; Verando, D.J.; Dokken, D.J. Land Use, Land Use Change and Forestry; Special Report of the Intergovernmental Panel on Climate Change: Cambridge, UK, 2000. [Google Scholar]
  2. Lal, R. Soil carbon sequestration impacts on global climate change and food security. Science 2004, 304, 1623–1626. [Google Scholar] [CrossRef] [PubMed]
  3. Aubert, M.; Bureau, F.; Alard, D.; Bardat, J. Effect of tree mixture on the humic epipedon and vegetation diversity in managed beech forests (Normandy, France). Can. J. For. Res. 2004, 34, 233–248. [Google Scholar] [CrossRef]
  4. Hedde, M.; Aubert, M.; Decaëns, T.; Bureau, F. Dynamics of soil carbon in a beechwood chronosequence forest. For. Ecol. Manag. 2008, 255, 193–202. [Google Scholar] [CrossRef]
  5. Pickett, S.T.A. Space-for-time substitutions as an alternative to long-term studies. In Long-Term Studies in Ecology; Likens, G.E., Ed.; Springer: New York, NY, USA, 1989; pp. 110–135. [Google Scholar]
  6. Corona, P.; Scotti, R.; Tarchiani, N. Relationship between environmental factors and site index in Douglas –fir plantations in central Italy. For. Ecol. Manag. 1998, 110, 195–207. [Google Scholar] [CrossRef]
  7. Pavari, A.; de Philippis, A. La sperimentazione di specie forestali esotiche in Italia: La sperimentazione del primo ventennio. In Annali della Sperimentazione Agraria; Tip. Failli: Roma, Italy, 1941; Volume 38, p. 648. [Google Scholar]
  8. Gabbrielli, A. Aldo Pavari sperimentatore. (L’Italia Forestale e Montana) Ital. J. For. Mount. Environ. 2010, 66, 411–420. [Google Scholar] [CrossRef]
  9. Antisari, L.V.; Falsone, G.; Carbone, S.; Marinari, S.; Vianello, G. Douglas-fir reforestation in North Apennine (Italy): Performance on soil carbon sequestration, nutrients stock and microbial activity. Appl. Soil Ecol. 2015, 86, 82–90. [Google Scholar] [CrossRef]
  10. Jaffrain, J.; Gérard, F.; Meyer, M.; Ranger, J. Assessing the quality of dissolved organic matter in forest soils using ultraviolet absorption spectrophotometry. Soil Sci. Soc. Am. J. 2007, 71, 1851–1858. [Google Scholar] [CrossRef]
  11. Allison, S.D.; Gartner, T.; Holland, K.; Weintraub, M.; Sinsabaugh, R.L. Soil Enzymes: Linking Proteomics and Ecological Processes. In Manual of Environmental Microbiology, 3rd ed.; Hurst, C.J., Knudsen, G.R., McInerney, M.J., Stetzenbach, L.D., Walter, M.V., Eds.; ASM Press: Washington, DC, USA, 2007; pp. 704–711. [Google Scholar]
  12. Sinsabaugh, R.L.; Hill, B.; Shah, J.J.F. Ecoenzymatic stoichiometry of microbial organic nutrient acquisition in soil and sediment. Nature 2009, 462, 795–799. [Google Scholar] [CrossRef] [PubMed]
  13. IUSS. Working Group World Reference Base for Soil Resources 2006; first update 2007; World Soil Resources Reports: Rome, Italy, 2007. [Google Scholar]
  14. Antisari, L.V.; Marinari, S.; Dell’Abate, M.T.; Baffi, C.; Vianello, G. Plant cover and epipedon SOM stability as factors affecting brown soil profile development and microbial activity. Geoderma 2011, 161, 212–224. [Google Scholar] [CrossRef]
  15. Welke, S.E.; Hope, G.D. Influences of stand composition and age on forest floor processes and chemistry in pure and mixed stands of Douglas-fir and paper birch in interior British Columbia. For. Ecol. Manag. 2005, 219, 29–42. [Google Scholar] [CrossRef]
  16. Blanco, J.A. Forests may need centuries to recover their original productivity after continuous intensive management: An example from Douglas-fir stands. Sci. Total Environ. 2012, 437, 91–103. [Google Scholar] [CrossRef] [PubMed]
  17. Perry, D.A.; Molina, R.; Amaranthus, M.P. Mycorrhizae, mycorrhizospheres, and reforestation: Current knowledge and research needs. Can. J. For. Res. 1987, 17, 929–940. [Google Scholar] [CrossRef]
  18. Griffiths, R.P.; Baham, J.E.; Caldwell, B.A. Soil solution chemistry of ectomycorrhizal mats in forest soil. Soil Biol. Biochem. 1994, 26, 331–337. [Google Scholar] [CrossRef]
  19. Ranger, J.; Allie, S.; Gelhaye, D.; Pollier, B.; Turpault, M.P.; Granier, A. Nutrient budgets for a rotation of a Douglas-fir plantation in the Beaujolais (France) based on a chronosequence study. For. Ecol. Manag. 2002, 171, 3–16. [Google Scholar] [CrossRef]
  20. Marques, R.; Ranger, J.; Villette, S.; Granier, A. Nutrient dynamics in a chronosequence of Douglas-fir (Pseudotsuga menziesii (Mirb). Franco) stands on the Beaujolais Mounts (France). 2. Quantitative approach. For. Ecol. Manag. 1997, 92, 167–197. [Google Scholar] [CrossRef]
  21. Jussy, J.H.; Colin-Belgrand, M.; Ranger, J. Production and root uptake of mineral nitrogen in a chronosequence of Douglas-fir (Pseudotsuga menziesii) in the Beaujolais Mounts. For. Ecol. Manag. 2000, 128, 197–209. [Google Scholar] [CrossRef]
  22. Patrone, G. Piano di Assestamento delle Foreste di Vallombrosa e di S. Antonio per il Quindicennio 1970–1984; Ministero dell’Agricoltura e delle Foreste, Azienda di Stato per le Foreste Demaniali: Rome, Italy, 1970. [Google Scholar]
  23. Travaglini, D. Piano di Gestione e Silvomuseo 2006–2025 della Foresta di Vallombrosa: Compartimentazione e cartografia. Ann. dell’Accad. Italiana Sci. For. 2009, 58, 139–150. [Google Scholar]
  24. Pavari, A. Studio Preliminare sulle Colture di Specie Forestali Esotiche in Italia. In Annali del Regio Istituto Superiore Forestale Nazionale; Ricci: Firenze, Italy, 1916; Volume 1, pp. 159–379. [Google Scholar]
  25. Nocentini, S. Le specie forestali esotiche: La sperimenazione di Aldo Pavari e le prospettive attuali. L’Italia For. Mont. 2010, 65, 449–457. [Google Scholar] [CrossRef]
  26. Sanesi, G.; Certini, G. The umbric epipedon in the N Apennines, Italy—An example from the Vallombrosa Forest. J. Plant Nutr. Soil Sci. 2005, 168, 392–398. [Google Scholar] [CrossRef]
  27. Ferretti, F. Le prove di introduzione delle specie forestali esotiche: L’esperienza condotta a Vallombrosa. Primo Contrib. Ann. ISSA 1998, 29, 93–114. [Google Scholar]
  28. Gee, G.W.; Bauder, J.W. Particle Size Analysis. In Methods of Soil Analysis; Klute, A., Ed.; American Society of Agronomy: Madison, WI, USA, 1986; Volume 9, pp. 383–411. [Google Scholar]
  29. Orsini, L.; Rémy, J.C. Utilisaion du chlorure de cobaltihexamine pour la détermination simultanée de la capacité d’échange et des bases échangeables des sols. Sci. Sol. 1976, 4, 269–279. [Google Scholar]
  30. Ciesielski, H.; Sterckeman, T. Determination of CEC and exchangeable cations in soils by means of cobalt hexamine trichloride. Effects of experimental conditions. Agronomie 1997, 17, 1–8. [Google Scholar] [CrossRef]
  31. Schwertmann, U.; Fitzpatrick, R.W.; Taylor, R.M.; Lewis, D.G. The influence of aluminum on iron oxides. Part ii. Preparation and properties of A1-substituted hematites. Clays Clay Miner. 1979, 27, 105–112. [Google Scholar] [CrossRef]
  32. Mehra, O.P.; Jackson, M.L. Iron oxide removal from soils and clays by a dithionite-citrate system buffered with sodium bicarbonate. Clays Clay Miner. 1960, 7, 317–327. [Google Scholar] [CrossRef]
  33. Antisari, L.V.; Dell’Abate, M.T.; Buscaroli, A.; Gherardi, M.; Nisini, L.; Vianello, G. Role of soil organic matter characteristics in a pedological survey: “Bosco Frattona” natural reserve (Site of Community Importance, Italy) case study. Geoderma 2010, 156, 302–315. [Google Scholar] [CrossRef]
  34. Springer, U.; Klee, J. Prüfung der Leistungsfähigkeit von einigen wichtigeren Verfahren zur Bestimmung des Kohlenstoffs mittels Chromschwefelsäure sowie Vorschlag einer neuen Schnellmethode. Z. Pflanzenernähr. Düng. Bodenkd. 1954, 64, 1–26. [Google Scholar] [CrossRef]
  35. Sequi, P.; de Nobili, M.; Leita, L.; Cercignani, G. A new index of humification. Agrochimica 1986, 30, 175–179. [Google Scholar]
  36. McGinnis, M.L.; Holub, S.M.; Myrold, D.D. Regional assessment of soil microbial functional diversity of Douglas-fir forests. Soil Sci. Soc. Am. J. 2014, 78, 125–135. [Google Scholar] [CrossRef]
  37. Marx, M.C.; Wood, M.; Jarvis, S.C. A microplate fluorimetric assay for the study of enzyme diversity in soils. Soil Biol. Biochem. 2001, 33, 1633–1640. [Google Scholar] [CrossRef]
  38. Vepsalainen, M.; Kukkonen, S.; Vestberg, M.; Sirvio, H.; Niemi, R.M. Application of soil enzyme activity test kit in a field experiment. Soil Biol. Biochem. 2001, 33, 1665–1672. [Google Scholar] [CrossRef]
  39. Trasar-Cepeda, C.; Leirós, M.C.; Gil-Sotres, F. Hydrolytic enzyme activities in agricultural and forest soils. Some implications for their use as indicators of soil quality. Soil Biol. Biochem. 2008, 40, 2146–2155. [Google Scholar] [CrossRef] [Green Version]
  40. Moscatelli, M.C.; Secondi, L.; Marabottini, R.; Papp, R.; Stazi, S.R.; Mania, E.; Marinari, S. Assessment of soil microbial functional diversity: Land use and soil properties affect CLPP-MicroResp and enzymes responses. Pedobiologia 2018, 66, 36–42. [Google Scholar] [CrossRef]
  41. Zeglin, L.H.; Bottomley, P.J.; Jumpponen, A.; Rice, C.W.; Arango, M.; Lindsley, A.; McGowan, A.; Mfombep, P.; MYrold, D.D. Altered precipitation regime affects the function and composition of soil microbial communities on multiple time scales. Ecology 2013, 94, 2334–2345. [Google Scholar] [CrossRef] [PubMed]
  42. Kennedy, A.C.; Smith, K.L. Soil microbial diversity and the sustainability of agricultural soils. Plant Soil 1995, 170, 75–86. [Google Scholar] [CrossRef]
  43. Shannon, C.E.; Weaver, W. The Mathematical Theory of Communication; University of Illinois Press: Urbana, IL, USA, 1949. [Google Scholar]
  44. Spellerberg, I.F.; Fedor, P.J. A tribute to Claude Shannon (1916–2001) and a plea for more rigorous use of species richness, species diversity and the ‘Shannon–Wiener’ Index. Glob. Ecol. Biogeogr. 2003, 12, 177–179. [Google Scholar] [CrossRef]
  45. Linder, S. Foliar analysis for detecting and correcting nutrient imbalances in Norway spruce. Ecol. Bull. 1995, 44, 178–190. [Google Scholar]
  46. Soil Survey Staff. Keys to Soil Taxonomy, 12th ed.; USDA-Natural Resources Conservation Service: Washington, DC, USA, 2014.
  47. Schoeneberger, P.J.; Wysocki, D.A.; Benham, E.C. Field Book for Describing and Sampling Soils; Version 3.0; Natural Resources Conservation Service, National Soil Survey Center: Lincoln, NE, USA, 2012.
  48. Certini, G.; Agnelli, A.; Corti, G.; Capperucci, A. Composition and mean residence time of molecular weight fractions of organic matter extracted from two soils under different forest species. Biogeochemistry 2004, 71, 299–316. [Google Scholar] [CrossRef]
  49. Agnelli, A.; Trumbore, S.E.; Corti, G.; Ugolini, F.C. The dynamics of organic matter in soil rock fragments investigated by 14C dating and 13C measurements. Eur. J. Soil Sci. 2002, 53, 147–159. [Google Scholar] [CrossRef]
  50. Perry, D.A. Forest Ecology; Johns Hopkins University Press: Baltimore, MD, USA, 1994. [Google Scholar]
  51. Sinsabaugh, R.L.; Shah, J.J.F. Ecoenzymatic stoichiometry of recalcitrant organic matter decomposition: The growth rate hypothesis in reverse. Biogeochemistry 2011, 102, 31–43. [Google Scholar] [CrossRef]
  52. Sinsabaugh, R.L.; Shah, J.J.F. Ecoenzymatic stoichiometry and ecological theory. Ann. Rev. Ecol. Evol. Syst. 2012, 43, 313–343. [Google Scholar] [CrossRef]
  53. Wallenstein, M.; Allison, S.D.; Ernakovitch, J.; Steinweg, M.; Sinsabaugh, R.L. Controls on the temperature sensitivity of soil enzymes: A key driver of in situ enzyme activity rates. Soc. Biol. 2011, 22, 245–258. [Google Scholar] [CrossRef]
  54. Caldwell, B.A. Enzyme activities as a component of soil biodiversity: A review. Pedobiologia 2005, 49, 637–644. [Google Scholar] [CrossRef]
  55. Marinari, S.; Bonifacio, E.; Moscatelli, M.C.; Antisari, L.V.; Vianello, G. Soil development and microbial functional diversity: Proposal for a methodological approach. Geoderma 2013, 192, 437–445. [Google Scholar] [CrossRef]
  56. Bonneau, M. Le diagnostic foliaire. Revue Forestičre Française 1988, 40, 19–26. [Google Scholar] [CrossRef]
  57. Kupka, I.; Podrázský, V.; Kubeček, J. Soil-forming effect of Douglas-fir at lower altitudes—A case study. J. For. Sci. 2013, 59, 345–351. [Google Scholar] [CrossRef]
  58. Egli, M.; Fitze, P.; Mirabella, A. Weathering and evolution of soils formed on granitic, glacial deposits: Results from chronosequences of Swiss alpine environments. Catena 2001, 45, 19–47. [Google Scholar] [CrossRef]
Figure 1. Location of soil survey. DOUG8, DOUG10 and DOUG12 are soil profiles opened in the three Douglas fir stand age areas. In table are shown the surface extension, the elevation and the slope of the forest parcels.
Forests 09 00641 g001
Figure 2. Soil organic and organo-mineral horizon along the Douglas fir stand chronosequence: depth and organic carbon distribution.
Forests 09 00641 g002
Figure 3. Chemical properties of epipedon (dark grey) and endopedon (light grey) along the Douglas fir stand chronosequence: soil pH (A), BS = base saturation (B), Ald/Alt = Pedogenic aluminium oxides to total aluminium (C), SI = spodicity index (D). Bars represent standard error, asterisk indicate significant difference (* p ≤ 0.05) between epipedon and endopedon at each stand age (n = 6).
Forests 09 00641 g003
Figure 4. Soil carbon (A) and nitrogen (B) stocks in epipedon (dark grey) and endopedon (light grey) along the Douglas fir stand chronosequence. Bars are standard errors, asterisk indicate significant difference (*** p < 0.001) between epipedon and endopedon at each stand age (n = 6).
Forests 09 00641 g004
Figure 5. Soil organic matter properties in the epipedon (dark grey) and endopedon (light grey) along the Douglas fir stand chronosequence: C:N ratio (A), humification index: non-humic (NH) to humic carbon ratio (B), extractable to total carbon ratio (C). Bars are standard errors, asterisk indicate significant difference (* p ≤ 0.05) between epipedon and endopedon at each stand age (n = 6).
Forests 09 00641 g005
Figure 6. Soil biochemical properties of epipedon (dark grey) and endopedon (light grey) along the Douglas fir stand chronosequence: Synthetic Enzymatic Index per unit of organic carbon (SEI) (A) microbial functional diversity (H′enz) (B), Leucine-amminopeptidasi + chitinase to phosphatase ratio (C), β-glucosidase to Leucine-amminopeptidasi + chitinase ratio (D). Bars are standard errors, asterisk indicate significant difference (* p < 0.05, ** p < 0.01, *** p < 0.001) between epipedon and endopedon at each stand age (n = 6).
Forests 09 00641 g006
Table 1. Description of soil profiles according to Schoeneberger et al. [47].
AgeProfileHorizonsBoundaryColor MunsellStructureTextureConsistenceRootsRock Fragments
MasterDepth (cm)DTdryMoistGSTDMSPQSSV%R
80DOUG 8Oi4–2AS
Oe/Oa2–0AW10YR3/37.5YR3/2
A10–4CW10YR4/37.5YR3/31fGRl/clSVFR(w)s(w)p1fFGR22
A24–12CS10YR4/47.5YR3/31fABKlSVFR(w)ss(w)ps2f/mFGR32
Bw12–20CS10YR5/410YR4/41fABKslSHFR(w)so(w)ps0fMGR31
BC20–24DI10YR6/410YR4/41mABKslSHFR(w)ss(w)ps0fMGR41
C24–40+U10YR6/410YR6/40mSGslMHFI(w)ss(w)ps MGR81
100DOUG 10Oi3–2AS
Oe2–0AS
A10–5CW10YR4/37.5YR2.5/31f/mSBKlSVFR(w)ss(w)p1f/m 0
A25–16/17CW10YR4/47.5YR3/31fSBKlSFR(w)so(w)ps1f/mFGR22
Bw16/17–31CS10YR5/47.5YR4/61fABKslSHFR(w)so(w)ps1mMGR101
C21–40+U10YR6/410YR4/60mSGslMHFR(w)ss(w)p CGR161
120DOUG 12Oi5–4AS
Oe4–2.5AS
Oa2.5–0AS10YR3/25YR3/1
A10–8AW10YR4/35YR3/21f/mGRslSVFR(w)so(w)ps3f/mCGR72
A28–25CW10YR4/45YR4/41fSBKslSVFR(w)so(w)ps2fMGR82
Bw25–31CS10YR5/45YR6/41f/mABKslSHFR(w)so(w)ps0fFGR71
C31–60+U10YR6/47.5YR5/80mSGlSHFR(w)so(w)ps
Horizon Boundary: (D) Distinctness: A = abrupt, C = clear, G = gradual, D = diffuse, (T) Topography: S = smooth, W = wavy, I = irregular, U = unknown; Structure: (G) Grade: 0 = structureless, 1 = weak, (S) Size: vf = very fine, f = fine, m = medium, co = coarse, (T) Type: GR = granular, PL = platy, ABK = angular blocky, SBK = subangular blocky, SG = single grain; Texture Field estimation: cl = clay–loam, l = loam, sl = sandy loam; Consistence Rupture resistance: (D) Dry: S = soft, SH = slightly hard, MH = moderately hard, (M) Moist: VFR = very friable, FR = friable, FI = firm, (S) Stickiness: (w)so = non-sticky, (w)ss = slightly sticky, (w)s = moderately sticky, (P) Plasticity: (w)ps = slightly plastic, (w)p = moderately plastic; Roots: (Q) Quantity: 0 = very few, 1 = few, 2 = common, 3 = many, (S) Size: vf = very fine, f = fine, m = medium, co = coarse; Rock fragments: (S) Size: FGR = fine gravelly, MGR = medium gravelly; CGR = coarse gravelly, (V%) Fragment content % by volume, (R) Roundness: 1 = angular, 2 = subangular, 3 = subrounded.
Table 2. Main physico-chemical properties of investigated pedons. Values are mean ± standard error (n = 3).
Stand Age (years)HorizonsDepthYearpHCorgSandSiltClayCECBS
cm g kg−1g kg−1Cmol(+) kg−1%
80A10–3804.4 ± 1.247.7 ± 1.6364 ± 23359 ± 25277 ± 2116.0 ± 1.222.7 ± 0.3
A23–12804.2 ± 1.435.0 ± 2.0407 ± 56336 ± 21257 ± 2513.9 ± 0.916.8 ± 0.4
Bw12–20804.7 ± 1.632.1 ± 1.1721 ± 32239 ± 1640 ± 1111.9 ± 1.112.0 ± 1.0
Bc20–24804.4 ± 0.828.9 ± 1.5692 ± 58245 ± 1963 ± 810.8 ± 0.58.6 ± 0.9
C24–40+804.8 ± 0.827.8 ± 2.3615 ± 63314 ± 2971 ± 109.1 ± 0.47.9 ± 0.5
100A10–51005.0 ± 0.953.4 ± 2.8369 ± 36420 ± 38211 ± 1517.9 ± 1.347.6 ± 1.2
A25–16/171005.1 ± 1.333.9 ± 1.9361 ± 45416 ± 35223 ± 1618.5 ± 1.546.6 ± 0.9
Bw16/17–311005.5 ± 1.122.4 ± 1.4604 ± 25323 ± 2473 ± 1016.4 ± 0.934.1 ± 1.2
C21–401005.6 ± 1.212.3 ± 2.1716 ± 45231 ± 2153 ± 511.5 ± 0.737.0 ± 1.1
120A10–81205.2 ± 1.491.2 ± 1.8620 ± 36239 ± 21141 ± 1938.9 ± 1.143.8 ± 1.1
A28–221205.4 ± 1.534.7 ± 1.3639 ± 72209 ± 32152 ± 1126.4 ± 1.342.4 ± 0.4
Bw22–311205.4 ± 1.243.9 ± 1.9662 ± 34217 ± 19121 ± 919.5 ± 1.145.3 ± 0.5
C31–40+1205.0 ± 1.818.3 ± 2.3473 ± 38383 ± 22144 ± 108.0 ± 0.934.1 ± 0.3
Table 3. Leaf nutrient content expressed on leaf dry mass base and with respect to nitrogen ratio. Mean value ± standard error (n = 5).
Stand Age (years) AlFeMnNAl/NFe/NMn/N
µg g−1%
80268 ± 25120 ± 11249 ± 311.6 ± 0.1144 ± 2972 ± 8112 ± 27
100354 ± 13158 ± 12440 ± 201.4 ± 0.1222 ± 53107 ± 28287 ± 24
120545 ± 32364 ± 17285 ± 181.3 ± 0.1372 ± 38256 ± 25195 ± 19

