Article

Climate Sensitivity of Tropical Trees Along an Elevation Gradient in Rwanda

by
Myriam Mujawamariya
1,
Aloysie Manishimwe
1,
Bonaventure Ntirugulirwa
1,2,
Etienne Zibera
1,
Daniel Ganszky
3,
Elisée Ntawuhiganayo Bahati
1,
Brigitte Nyirambangutse
1,
Donat Nsabimana
1,
Göran Wallin
3 and
Johan Uddling
3,*
1
Department of Biology, University of Rwanda, University Avenue, P.O. Box 117, Huye, Rwanda
2
Rwanda Agriculture and Animal Development Board, P.O. Box 5016, Kigali, Rwanda
3
Department of Biological and Environmental Sciences, University of Gothenburg, P.O. Box 461, SE-405 30 Gothenburg, Sweden
*
Author to whom correspondence should be addressed.
Forests 2018, 9(10), 647; https://doi.org/10.3390/f9100647
Submission received: 15 September 2018 / Revised: 10 October 2018 / Accepted: 12 October 2018 / Published: 17 October 2018

Abstract

:
Elevation gradients offer excellent opportunities to explore the climate sensitivity of vegetation. Here, we investigated elevation patterns of structural, chemical, and physiological traits in tropical tree species along a 1700–2700 m elevation gradient in Rwanda, central Africa. Two early-successional (Polyscias fulva, Macaranga kilimandscharica) and two late-successional (Syzygium guineense, Carapa grandiflora) species that are abundant in the area and present along the entire gradient were investigated. We found that elevation patterns in leaf stomatal conductance (gs), transpiration (E), net photosynthesis (An), and water-use efficiency were highly season-dependent. In the wet season, there was no clear variation in gs or An with elevation, while E was lower at cooler high-elevation sites. In the dry season, gs, An, and E were all lower at drier low elevation sites. The leaf-to-air temperature difference was smallest in P. fulva, which also had the highest gs and E. Water-use efficiency (An/E) increased with elevation in the wet season, but not in the dry season. Leaf nutrient ratios indicated that trees at all sites are mostly P limited and the N:P ratio did not decrease with increasing elevation. Our finding of strongly decreased gas exchange at lower sites in the dry season suggests that both transpiration and primary production would decline in a climate with more pronounced dry periods. Furthermore, we showed that N limitation does not increase with elevation in the forests studied, as otherwise most commonly reported for tropical montane forests.

1. Introduction

Tropical forests play a significant role as a carbon sink, currently dampening the ongoing rise in atmospheric CO2 [1]. Through their high rates of evapotranspiration, they also strongly control land hydrology and energy partitioning, thus affecting both local and regional climate [2]. In spite of the importance of tropical forests for global, regional, and local climate and climate change, their climate sensitivity is poorly known compared to that of temperate and boreal forests [3,4,5]. Knowledge gaps are particularly severe for tropical montane forests [6,7,8]. The montane tropics are likely to undergo considerable change under global warming, with plants facing dual challenges of climatic change and invading lowland species [8,9]. A better understanding of the climate sensitivity of tropical tree species is fundamental to forecasting these changes.
Tropical species in general are considered to have a narrow thermal niche as a consequence of the small temporal variation in temperature [10,11]. They are also thought to operate at, or near, their physiological thermo-optimum, such that warming might be negative for physiological performance and growth [12,13,14]. The threat of climate change to tropical tree species is likely to be particularly severe for tree species with a limited ability to migrate, such as large-seeded species and montane species that are already at the top [9,15]. The speed of climate warming is generally higher than the potential speed of montane tree species migration to a higher altitude to maintain their thermal niches [15]. This will compromise the growth and survival of tropical trees unless they can thermally acclimate to warmer conditions. There is evidence of recent changes in tree community composition in montane rainforests, driven primarily by increased tree mortality within the warmer part of a given species’ distribution range [16].
Not only warming, but also more pronounced rainfall seasonality and increased frequency and severity of droughts, have been projected for many tropical forests in the future [17]. Lower soil water availability strongly limits CO2 and H2O fluxes between tropical ecosystems and the atmosphere during drier periods [18,19]. Low precipitation and heat may interact such that heat increases the severity of drought stress and vice versa, as observed in controlled experiments [20]. Warming leads to more pronounced droughts as a consequence of increased atmospheric vapor pressure deficit (VPD) and evapotranspiration. Drought stress may cause increased heat stress due to the limited capacity for transpirational leaf cooling under dry conditions. Increased knowledge about these interactions is crucial to forecast forest–atmosphere interactions in a changing climate.
There are indications that late-successional (LS) species are more sensitive to warming than early-successional (ES) species. In a controlled experiment with seedlings, warming negatively affected the growth and photosynthesis of LS species, but not ES species [21]. In the same experiment, LS species had lower photosynthetic thermal optimum temperatures than ES species [22]. In a common garden experiment with seedlings of tropical tree species in Rwanda, photosynthetic heat stress was considerably higher in montane LS species compared to ES or exotic plantation species [23]. This was the combined result of low stomatal conductance (gs) and a large leaf size, leading to higher leaf temperatures (Tleaf) in LS species. The thermal optima of photosynthetic biochemistry did not differ among species in that study, suggesting that interspecific variation in warming responses might be more strongly linked to leaf traits controlling the leaf energy balance than to differences in biochemical temperature sensitivities. It should be noted that all the studies mentioned above were conducted on seedlings and their relevance for mature trees in the field is thus uncertain.
Elevation gradients offer the potential to study climate change responses of montane plants and ecosystems. Of course, factors other than temperature co-vary with elevation, such as cloudiness and radiation, precipitation, soil conditions, and atmospheric absolute O2 and CO2 concentrations. However, with careful interpretation, elevation gradients can serve as laboratories for global change research to explore the temperature and precipitation controls on plant resource acquisition and ecosystem functioning under ecologically realistic conditions [7,24]. Previous tropical elevation gradient studies have shown that leaf transpiration (E) typically decreases with increasing elevation, likely as a result of decreasing temperature and VPD at a higher elevation [25,26,27]. For photosynthesis, however, different tropical studies have reported different altitudinal trends. Light-saturated net photosynthesis (Asat) did not vary with elevation in a dominant tree species in Hawaiian forest ecosystems along a 100–2500 m gradient [28]. Similarly, there was no change in Asat with elevation in 40 tropical tree species along a 1000–3000 m elevation gradient in the Ecuadorian Andes [29]. However, there have also been reports of both decreases [30,31] and increases in Asat with elevation in other studies [32,33]. A Rwandan study specifically investigating biochemical photosynthetic capacity (at a given temperature) at two elevations demonstrated higher values at a high elevation [34]. A few studies have also investigated the 13C/12C carbon isotope composition of leaf tissues to explore possible patterns in water-use efficiency with elevation. They all reported higher δ13C ratios, and thus lower 13C discrimination, with increasing elevation [35,36,37]. This implies that the so-called intrinsic water-use efficiency (iWUE), which is the ratio of net photosynthesis (An) to gs, increased with elevation in these studies.
A limitation of these previous studies with different tree species is that sites at different elevations also had different tree species, making it hard to distinguish between the roles played by genetic adaptation and acclimation in explaining observed differences in tree and forest traits. Such separation requires the study of the same species (within a narrow genotype range) along the entire gradient. This is the approach taken in the present study.
The common view is that nutrient limitations change with elevation in tropical regions, such that lowland forests are typically phosphorous (P) limited, while cooler montane forests are rather nitrogen (N) limited due to slower microbial N mineralization rates [38,39,40]. Indeed, decreasing leaf N content or N:P ratio with increasing altitude has been observed in several Neotropical studies [35,41,42,43], as well as in Hawaiian montane forests [36]. However, a study in Borneo reported that leaf N and P contents expressed per unit leaf area increased with altitude [44]. In addition, a recent study showed that tropical montane trees in Rwanda exhibited high leaf N concentrations and intermediate N:P ratios compared to what has been reported for other tropical montane forests, indicating P limitation or N-P co-limitation [45]. This study did not explore if relative nutrient limitations (e.g., N:P ratio) varied with elevation, since it was conducted in plots at rather similar elevations. Together, the above-mentioned studies show that there is no simple pattern in terms of how N limitations vary along elevation gradients in tropical forests, and that more research is needed to explore how these depend on regional and local conditions.
The overall aim of this study is to explore how leaf and tree traits and resource use vary with climate along a tropical elevation gradient in Rwanda, located on the Albertine Rift in central Africa. We measured structural, chemical, and physiological traits in a set of species with contrasting successional strategies to address the following hypotheses: (i) Leaf transpiration decreases while photosynthesis is relatively stable and water use efficiency increases with elevation; (ii) leaf temperatures greatly exceed air temperatures in late-successional species, but less so in early-successional species with higher transpiration and smaller leaves; and (iii) N limitation does not increase with elevation, as otherwise most commonly reported.

2. Materials and Methods

2.1. Sites, Climate, Species, and Measurement Campaigns

This study was conducted in Ruhande Arboretum (“Arboretum” hereafter) plus four sites in Nyungwe National Park (“Nyungwe” hereafter). The Arboretum is a forest plantation located in the transitional tropical rainforest zone in southern Rwanda (2°36′55.2′′ S, 29°44′53.8′′ E, 1638–1737 m elevation; [46]). The Arboretum was established in 1934 and since then, 227 tree species (50 native to Rwanda) have been planted, in most part, as replicated (n = 3) monospecific 50 × 50 m plots within its 200 ha plantation area. Nyungwe is a tropical montane rainforest located in southwestern Rwanda (2°17′–2°50′ S, 29°07′–29°26′ E, 1600–2950 m elevation; [47]). Nyungwe National Park is one of the top priority sites for conservation in the Albertine Rift based upon the numbers of endemic and globally threatened species [48]. Nyungwe covers 1013 km2 and forms, together with the contiguous Kibira national park in Burundi, the largest block of tropical montane forest remaining in Africa [49].
Dominant natural vegetation zones in Rwanda are: Afromontane rainforest, Lake Victoria transitional rainforest, and evergreen and semi-evergreen bushland and thicket [50]. This study was conducted at sites in montane (Nyungwe) and transitional (Arboretum) rainforest areas. Overall, temperature decreases and precipitation increases with increasing elevation, but there is also an east-west gradient such that precipitation at a given elevation is lower further east (Table 1). The dry season in Nyungwe is in July and August, while it may last from May to September and is more pronounced in the Arboretum [46,51].
Data were collected at five sites along an elevational gradient: The lowest and warmest Arboretum site (A) at ~1700 m elevation and four sites in Nyungwe: Cyamudongo (C; 1800–1900 m), Nyungwe West (N1) (~1950 m), Nyungwe East (N2; ~2500 m), and Nyungwe Bigugu Mountain (N3; ~2700 m). While N1, N2, and N3 are all within the main forest block of Nyungwe, C is a smaller (4.3 km2) relict forest area, located at 10 km west of the Nyungwe forest and surrounded by agricultural land. The elevation gradient ranging from ~1700 m to ~2700 m spanned a range of mean annual temperatures (MAT) at 1.7 m of approximately 13–19 °C (Table 1). Additionally, mean daytime temperatures and minimum (1%ile) and maximum (99%ile) temperatures declined systematically with increasing elevation. VPD was markedly lower and radiation somewhat lower at a high elevation. Annual precipitation spanned from ~1000 mm in A to ~3000 mm in N1. The three-month period preceding and covering the measurement campaigns during wet and dry seasons was markedly warmer, drier, and exhibited higher VPD at the low A site compared with N1 and N2. Both temperature and precipitation were measured over several years with weather stations at three of the sites (A, N1, N2; [46,51]). At C and N3, only temperature and air humidity at 1.7 m above the ground were measured using small temperature mini-loggers (Model TinyTag Plus 2, Gemini data loggers Ltd., United Kingdom) during a period of six to seven weeks (September to November 2017) to allow for comparisons with the other sites.
Data were collected from two early-successional (ES) and two late- successional (LS) species which are abundant in Nyungwe and could mostly be found along the entire elevation gradient: Syzygium guineense (LS), Carapa grandiflora (LS), Macaranga kilimandscharica (ES), and Polyscias fulva (ES). The first three species are the three most abundant tree species in Nyungwe, together accounting for 42% of the large trees (DBH > 30 cm) in the forest [49]. There were two cases where a species could not be found at one of the sites: S. guineense was not found at Cyamudongo (1800–1900 m elevation) and C. grandiflora was not present at 2700 m altitude as this species is distributed between 1600–2500 m in Rwanda [52]. Further extension of the elevation gradient was not possible due to species distribution ranges; Nyungwe lacks large trees much beyond 2700 m in Nyungwe (highest peak at 2950 m). Six trees per species were sampled at each site.
Data collection was conducted during three campaigns: two wet season campaigns between 15 February and 21 March in 2017 and between 24 January and 4 March in 2018; and one dry season campaign during 2–30 September in 2017. Six trees per species and site were measured in each campaign, aiming at selecting trees with diameters at breast height (DBH) of 15–40 cm. Such trees were found, except for Polyscias fulva at N3, where smaller trees had to be sampled (Table S1). The same trees were measured during each campaign.

2.2. Leaf Gas Exchange

Leaf gas exchange was measured for one site per day with the order of species on each day being randomized. Measurements were conducted during 10:00–16:00 h. Three leaves per tree were measured, resulting in a total of 72 measurements (4 species × 6 trees × 3 leaves) per site and measurement campaign. A 20 m long carbon fiber telescopic pole was used to access branches in the upper canopy and the measurements were taken as soon as possible after the branch was cut (usually within 15 min) to minimize possible post-cut decreases in gs. Gas exchange measurements were made with a LI6400 (Li-COR, Inc. Lincoln: Nebraska, NE, USA) during the latter two campaigns (one wet and one dry) and with an SC-1 porometer (Decagon devices Inc. Pullman: Washington, DC, USA) during the first campaign (wet). In a separate data collection, both instruments were used to measure gs on the same leaves (and leaf parts) of different species exhibiting a broad range of gs. This instrument comparison showed that the SC-1 measured considerably higher gs than the LI6400 (Figure S1). The relationship between the SC-1 and LI6400 data (equation in Figure S1) was used to adjust gs data collected by the SC-1 since the LI6400 was considered more reliable.
Measurements with the LI6400 were made using the standard 2 × 3 cm leaf chamber and light source (6400-02B LED Light Source, LI-COR Biosciences: Lincoln, NE, USA) using a flow rate of 300–400 µmol m−2 s−1. The photosynthetic photon flux density (PPFD) inside the leaf chamber was set at 1800 µmol m−2 s−1. The CO2 of air entering the leaf chamber was set at 415 µmol mol−1, leading to a CO2 concentration near 400 µmol m−2 s−1 inside the leaf chamber. The chamber air temperature was set to approximate ambient and was changed throughout the measurement day. The air desiccant of the instrument was not used.

2.3. Leaf Temperature

The same leaves measured for gas exchange were also measured for leaf temperature (Tleaf). This was done just after the gas exchange measurement, using an infrared thermometer (Trotec BP10 IR, Trotec Laser GmbH: Ismaning, Germany). When measuring Tleaf, the leaf was held in a horizontal position, with the thermometer at a 45° angle to the leaf and a distance of 5 cm from the leaf surface to avoid leaf shading. Wind speed (u) varied considerably among measurement days. To account for the influence of varying wind speed on Tleaf, all observations of the leaf-to-air temperature difference (TleafTair) were standardized to a wind speed of 1 m s−1 as follows:
The leaf boundary layer conductance for heat (gheat) was calculated as
g heat = 0.135 ( u d ) 0.5
Values of gheat were calculated both at measured wind speed (gheatobs) and at a wind speed of 1 m s−1 (gheatstd). The standardized TleafTair at a 1 m s−1 wind speed (ΔTstd) was then calculated from the ratio of these conductances and the observed TleafTair (ΔTobs):
Δ T std = Δ T obs g heatobs g heatstd
Air temperature and wind speed were measured adjacent to the leaf at the time of Tleaf measurements, using a portable weather station (WMR86N, Oregon Scientific, Tualatin, OR, USA). PPFD was measured adjacent to the leaf at a horizontal angle, using a portable PPFD sensor (MQ-500, Apogee Instruments, Inc.: Logan, UT, USA). The portable weather station was placed in the shade, while the PPFD sensor was exposed to the sky.

2.4. Tree and Leaf Structural Traits

Tree stem DBH was determined using diameter tape, while tree height was measured using a clinometer (Vertex IV, Haglöfs Sweden AB: Långsele, Sweden). Wood density was measured by taking wood cores at the breast height with an increment borer (Haglöf Sweden AB: Långsele, Sweden). Thereafter, the diameter (5.15 mm) and length (below bark to centre of the stem) of the fresh cores and the mass of the oven dried (70 °C) cores were used to calculate the wood density (g cm−3).
Leaf structural traits were measured on the same leaves measured for gas exchange. Leaf length and width were measured to the nearest mm by a ruler. Leaf thickness was measured at three locations of each leaf, to the nearest 0.01 mm using an electronic caliper, avoiding major veins. On each measured leaf, three to five leaf discs of a known area were sampled and were oven-dried at 70 °C for at least 48 h and then weighed for leaf mass per unit leaf area (LMA) determination.

2.5. Chemical Traits

A proxy of area-based leaf chlorophyll content was measured using an SPAD-502 meter (Konica Minolta Sensing, Inc., Ltd.: Osaka, Japan). For each leaf, the average SPAD value was calculated from 10 measurements evenly distributed across the leaf surface. Analyses of leaf nutrient content and stable carbon isotope composition were done on dried leaf material from the first measurement campaign. Dry leaf samples were ground into a fine powder using a ball mill (model MM 301, Retsch: Haan, Germany). Samples were analyzed for C and N and their stable isotopes (12C, 13C, 14N, 15N) using a continuous flow isotope ratio mass spectrometer (UC Davis Stable Isotope Facility: Davis, CA, USA). A set of 37 non-N elements were determined using elements inductively coupled plasma mass spectrometry (VG101 analysis, ACME Analytical Laboratories: Vancover, BC, Canada), including the plant macronutrients P, K, S, Ca, and Mg and the micronutrients Cu, Zn, Mn, Fe, and B.
Values of 13C abundance in air (δa) and leaf tissue (δl) expressed in per mil (‰) relative to the standard Pee Dee Belemnite were used to calculate leaf 13C discrimination (Δleaf; [53]) as:
Δ leaf = δ a δ l 1 + δ l
Values of δleaf were calculated from leaf samples analyzed for stable C isotopic composition as described above and δa was taken as −8.4‰.
The ratio of the CO2 concentration inside the leaf (ci) to that of the surrounding air (ca) was calculated from Δleaf as:
c i c a = ( Δ leaf a ) / ( b a )
where a and b are constants representing fractionation due to diffusion (4.4‰) and carboxylation (27‰), respectively, and ca and ci represent the partial pressure of CO2 (PCO2) in the ambient atmosphere and inside the leaf, respectively [53]. The iWUE determined based on carbon isotope data was calculated as ca minus ci, which equals the An:gs ratio, with gs expressed for CO2 instead of H2O (as otherwise reported here).

2.6. Statistical Analyses

Differences among sites and among species for the different leaf structural, physiological, and chemical traits were tested using two-way ANOVA with site and species as fixed factors. Pairwise multi-comparisons among individual sites and species were conducted with the Tukey HSD test. Averages of data from different leaves on the same tree were used in these tests to treat trees as the statistical unit. Wet and dry season data were tested separately. Wet season data were very similar for the two wet season measurement campaigns and were therefore averaged across both campaigns prior to analysis. Differences in TleafTair among species were tested using analysis of covariance (ANCOVA) with species as a fixed factor and PPFD as a covariate. Data were pooled across sites in this test due to the large variability in radiation among sites measured on different days. Differences were considered statistically significant at p < 0.05. Statistical analyses were performed using SPSS software (IBM SPSS Statistics for Windows, Version 16.0, IBM Corporation: Armonk, NY, USA).

3. Results

First, two comments on how we evaluate elevation patterns and species differences in the following. The order of species measured were different (randomized) on different measurement days and sites (we measured one site per day). This is the main reason for the many site by species interactions in our statistical tests (Table S2). We therefore focus on the main effects of sites and species in our interpretations, not on the numerous site by species interactions. Furthermore, elevation patterns were evaluated based on the pattern of among-site differences revealed by the posthoc tests. There had to be a consistent and directional change with elevation for concluding that there was an elevation pattern.

3.1. Physiological Traits

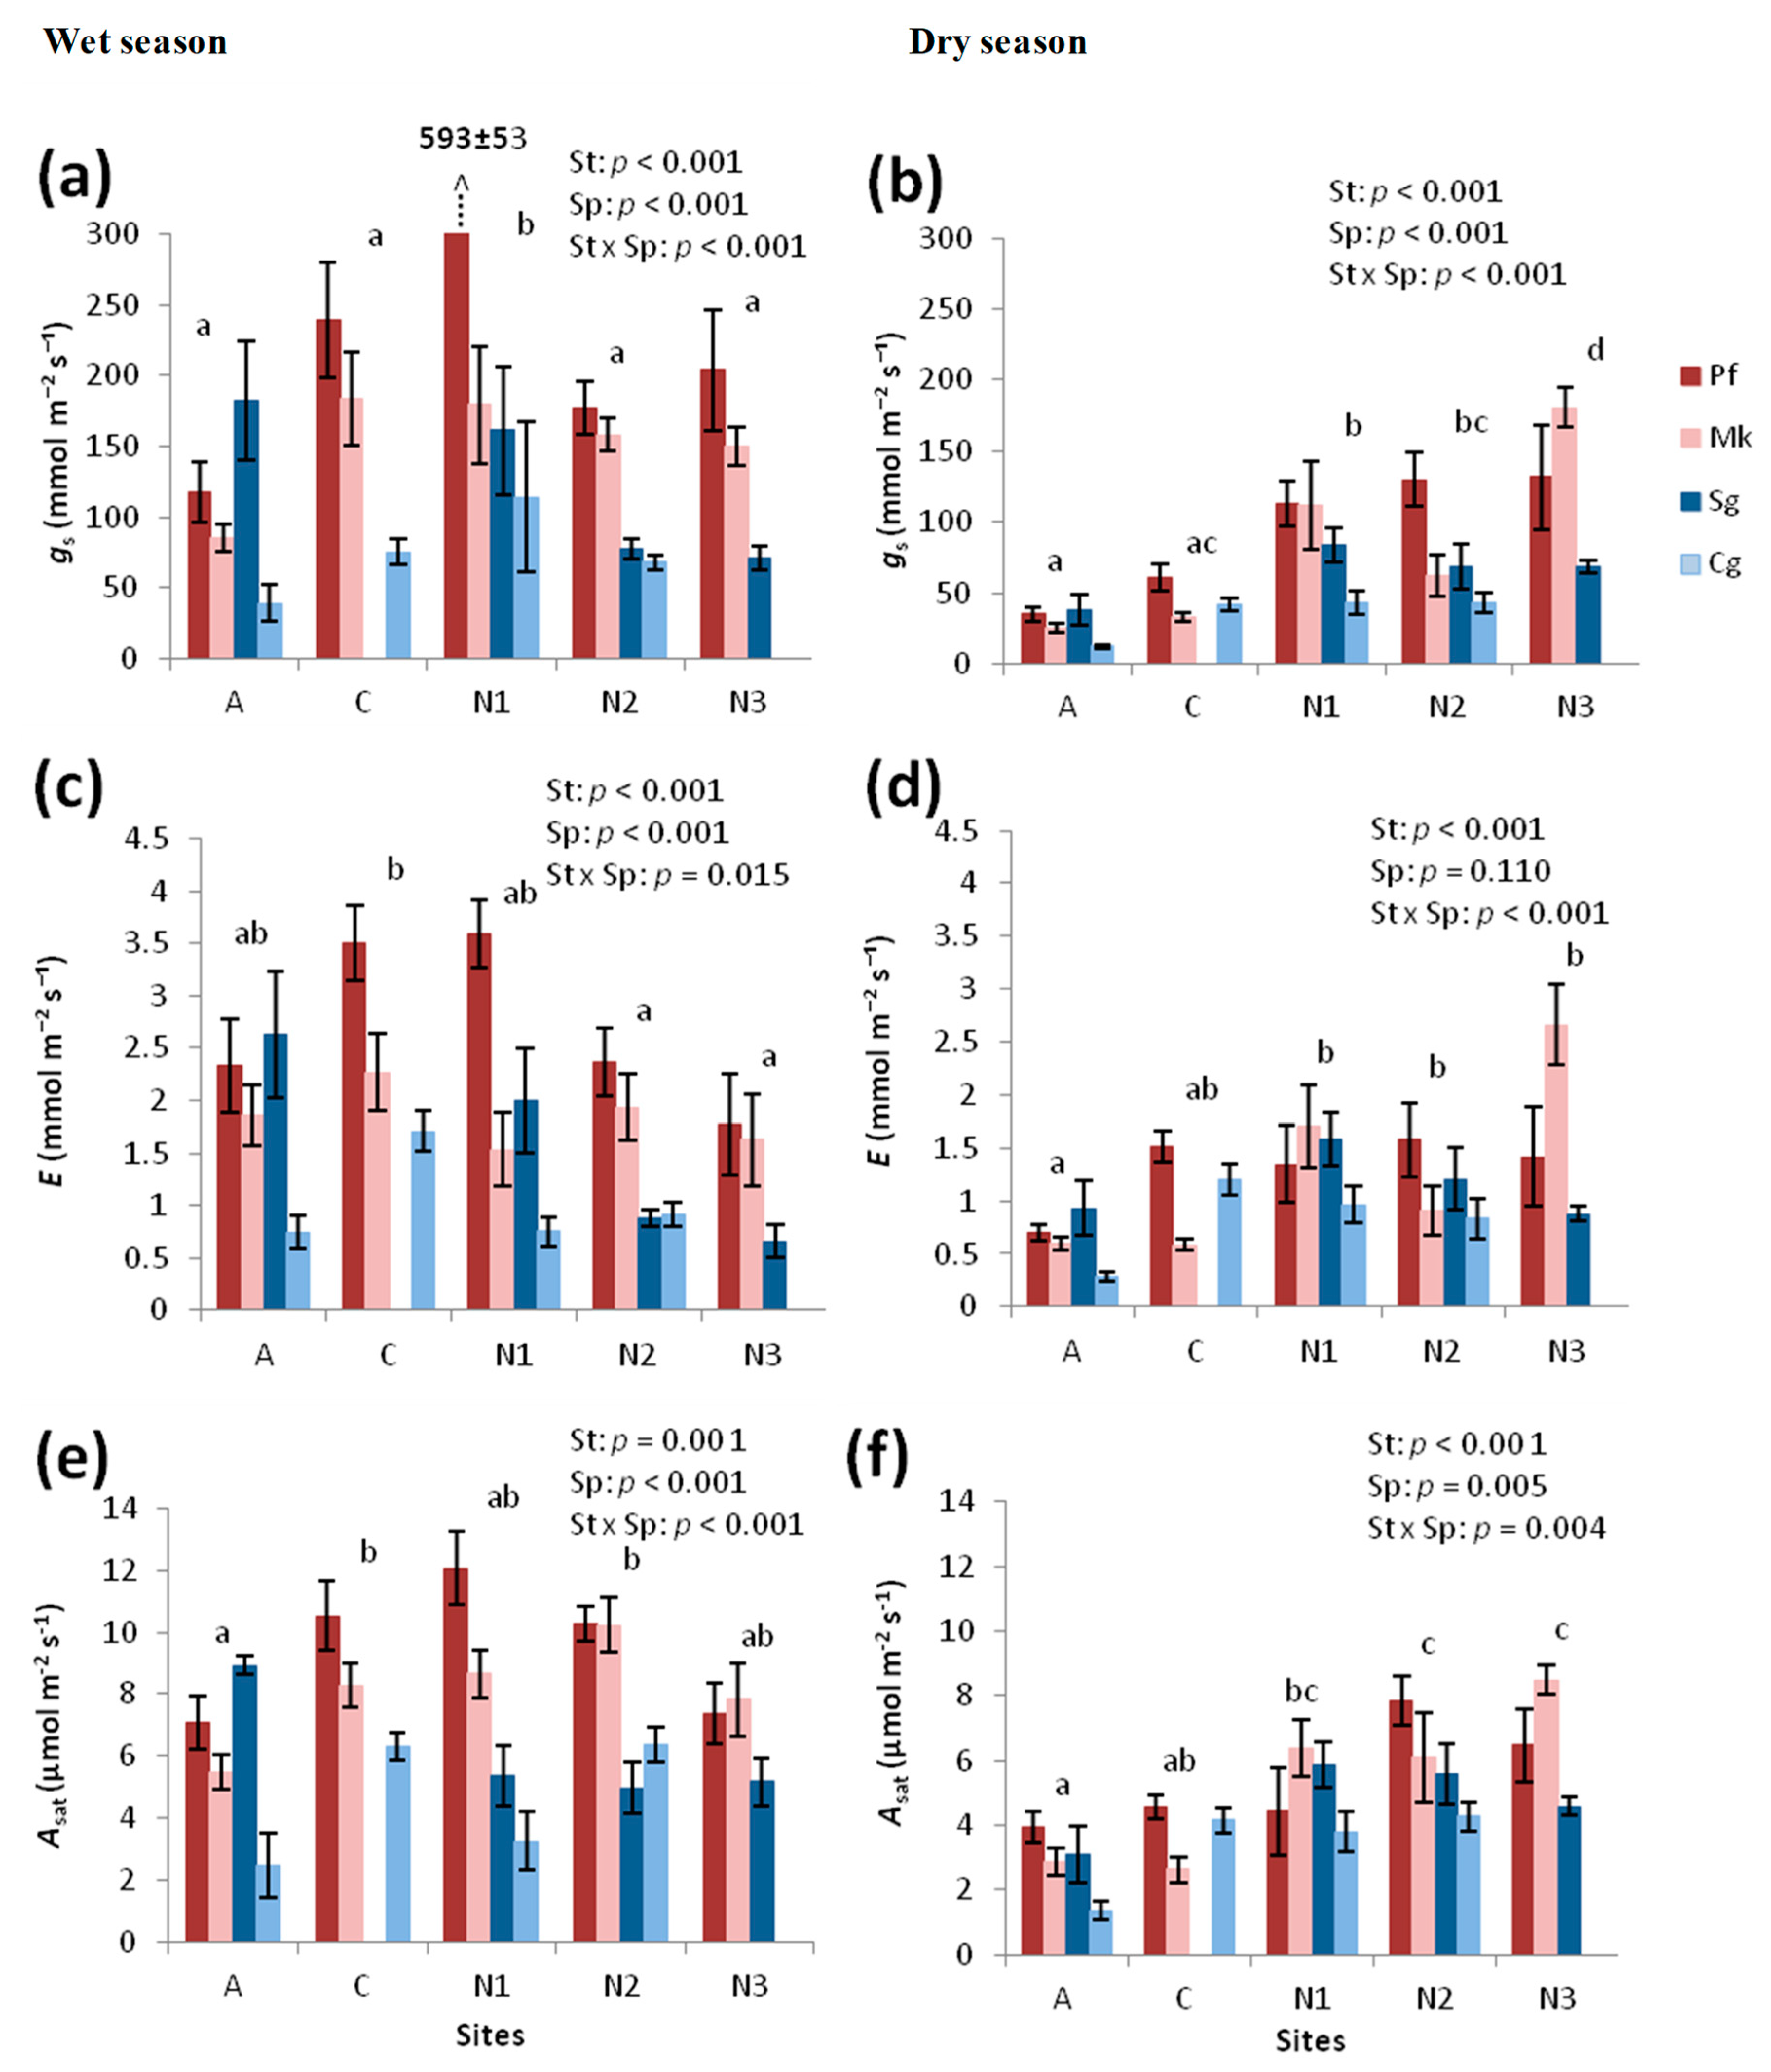
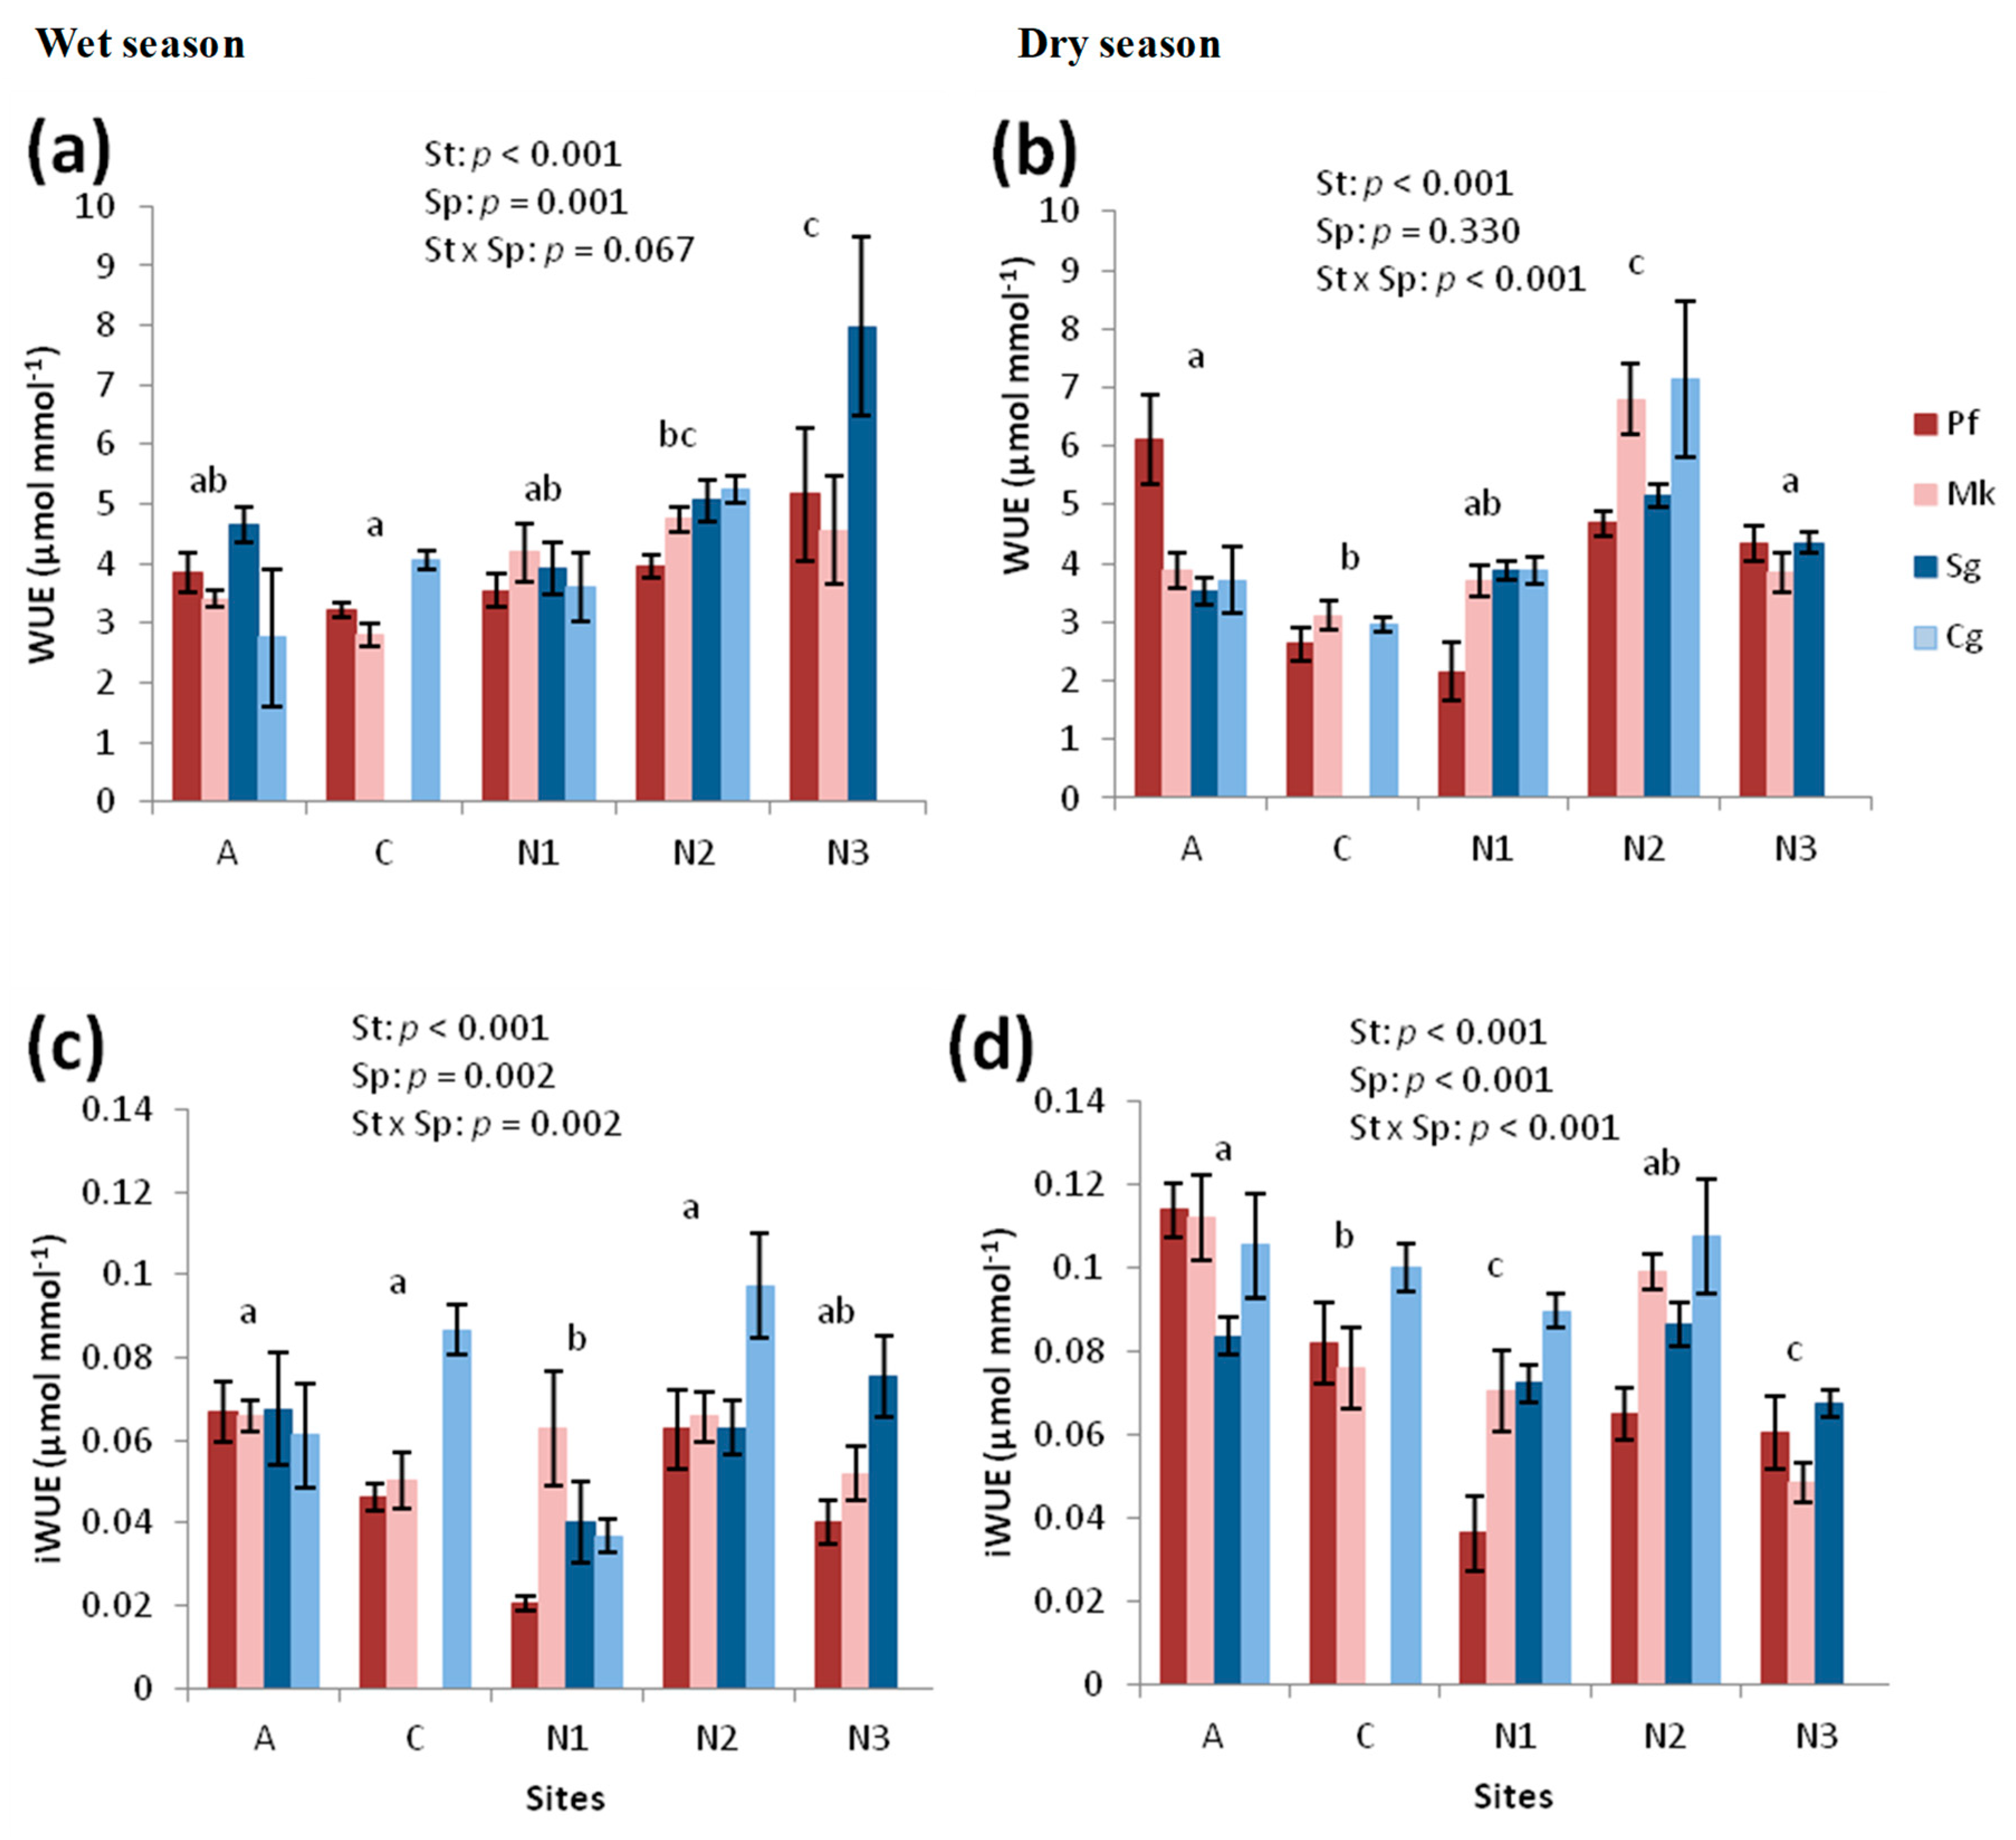
3.1.1. Leaf Gas Exchange

In both wet and dry seasons, gs differed significantly among species, as well as among sites at different elevations (p < 0.001; Figure 1a,b; Table S2). During the dry season gs markedly increased with increasing elevation, while there was no clear relationship between gs and elevation in the wet season. In the wet season, the only site standing out was the mid-elevation site (N1), which had significantly higher gs compared to all other sites. This was the case in the wet season measurement campaigns of both 2017 and 2018 and was not an artefact of measuring at too low VPD inside the leaf chamber (it was ~0.5 kPa; data not shown).
Transpiration rates mostly decreased with elevation in the wet season, while there was a strong increasing trend in the dry season (Figure 1c,d). The wet season trend did not, however, hold along the entire elevation gradient since the lowest site was not significantly different compared to any other site.
Species differences were significant for gs in both the wet and dry season, but for E, only in the wet season (Figure 1a–d; Table S2). The ES species P. fulva mostly had higher gs and E than other species during both wet and dry seasons (Figure 1a–d). The difference was particularly strong for gs in site N1 during the wet season; an observation made in both wet season campaigns. In addition, the ES species M. kilimandscharica had higher gs and E than the LS species C. grandiflora in both seasons. In both wet and dry seasons, gs and E decreased in the order P. fulva, M. kilimandscharica, S. guineense, and C. grandiflora. These results thus show that gs and E are higher in ES species than in LS species.
Elevational trends in Asat were also highly season dependent and there were significant differences among sites (p ≤ 0.001) and species (p ≤ 0.005) during both wet and dry seasons (Figure 1e,f; Table S2). During the wet season, there was no overall change with elevation as Asat was highest at intermediate elevation sites. During the dry season, however, Asat markedly increased with elevation. Species differences in Asat were similar to those for gs and E, i.e., decreasing in the order P. fulva, M. kilimandscharica, S. guineense, and C. grandiflora. The LS species C. grandiflora (p ≤ 0.002) had lower Asat than the ES species P. fulva and M. kilimandscharica during both seasons (Table S2).
The elevation trends in WUE (i.e., the An:E ratio) determined from gas exchange measurements were highly seasonal dependent. In the wet season, WUE increased significantly with elevation, while no clear elevation trend was present in the dry season (Figure 2a,b). The LS species S. guineense had higher WUE than other species in the wet season, but there were no significant differences among species in the dry season (Table S2).
There was no consistent change in iWUE (i.e., the An:gs ratio) with elevation in the wet season, but iWUE strongly decreased with elevation during the dry season (Figure 2c,d). Values of iWUE decreased in the order C. grandiflora, S.guineense, M. kilimandscharica, and P. fulva; i.e., it was higher in LS compared to ES species. However, the only significant species differences were C. grandiflora versus P. fulva in the wet season and C. grandiflora compared to all other species in the dry season (Table S2).

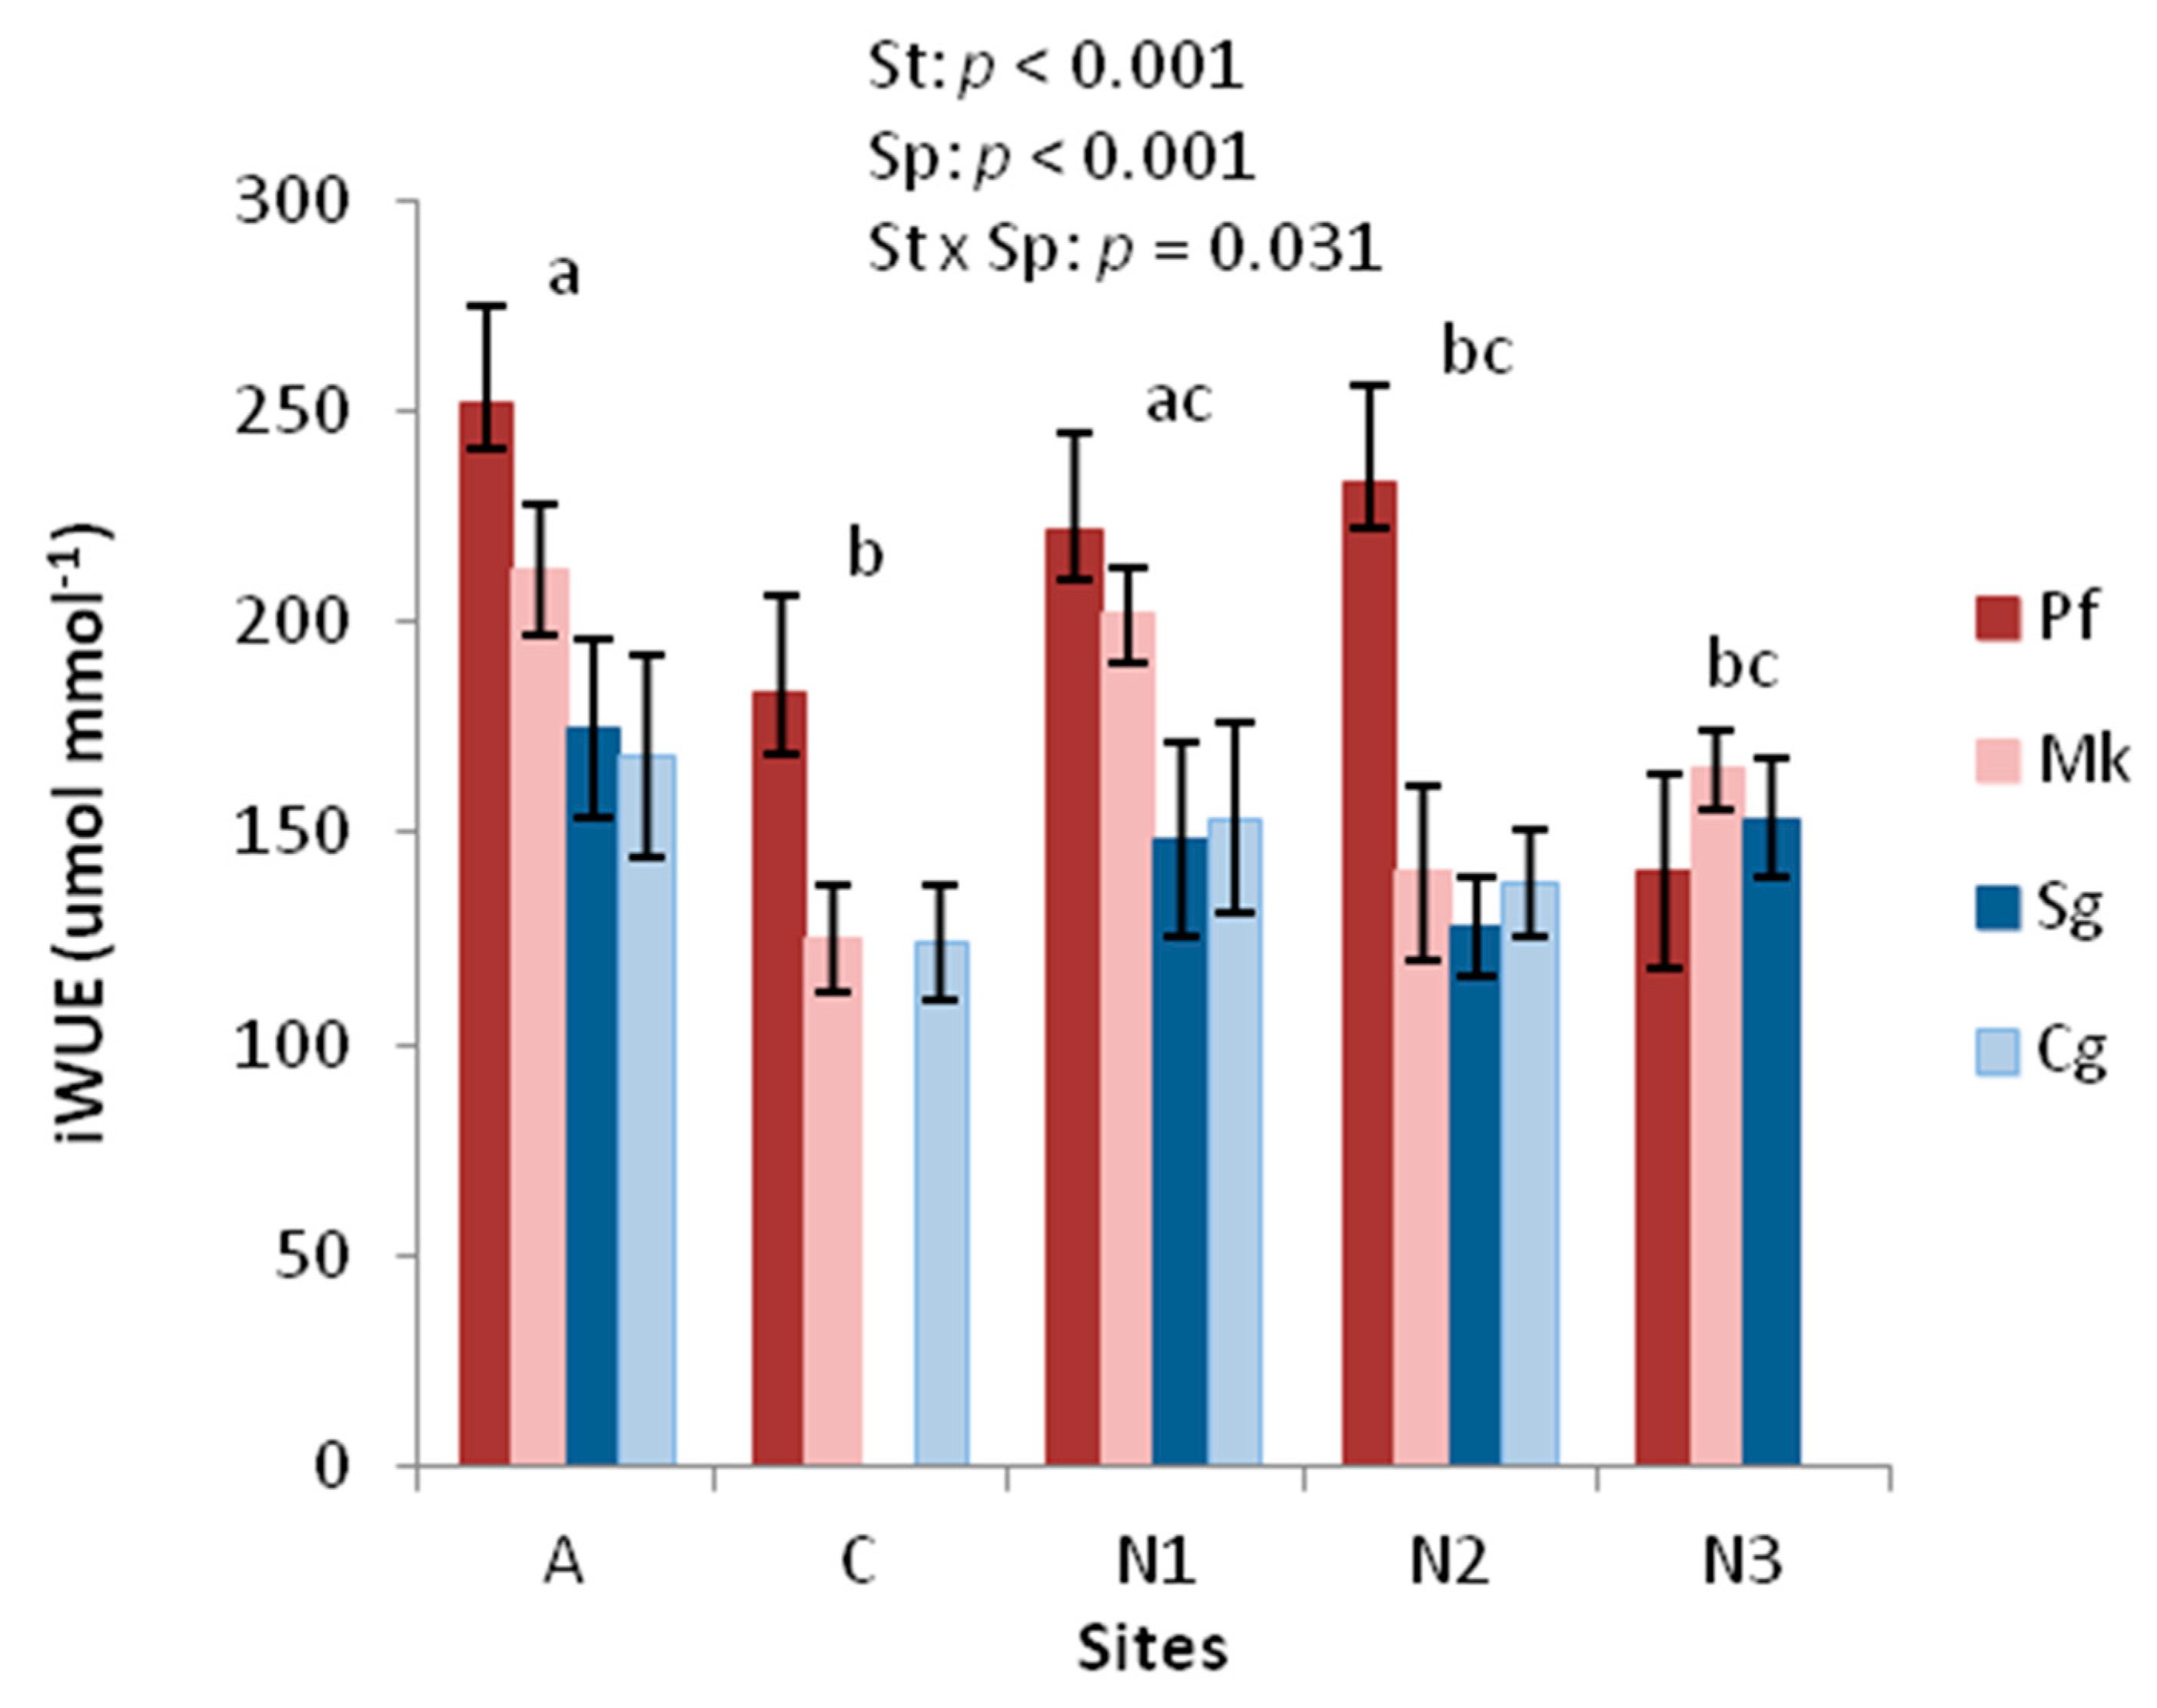
3.1.2. iWUE from Stable Carbon Isotopes

There was no clear elevation trend in iWUE (i.e., caca = the An:gs ratio with gs expressed for CO2) based on stable carbon isotope data, although it was higher at the lowest site compared with three out of four of the other sites (Figure 3). The ES species P. fluva had higher iWUE than all other species (Table S2).

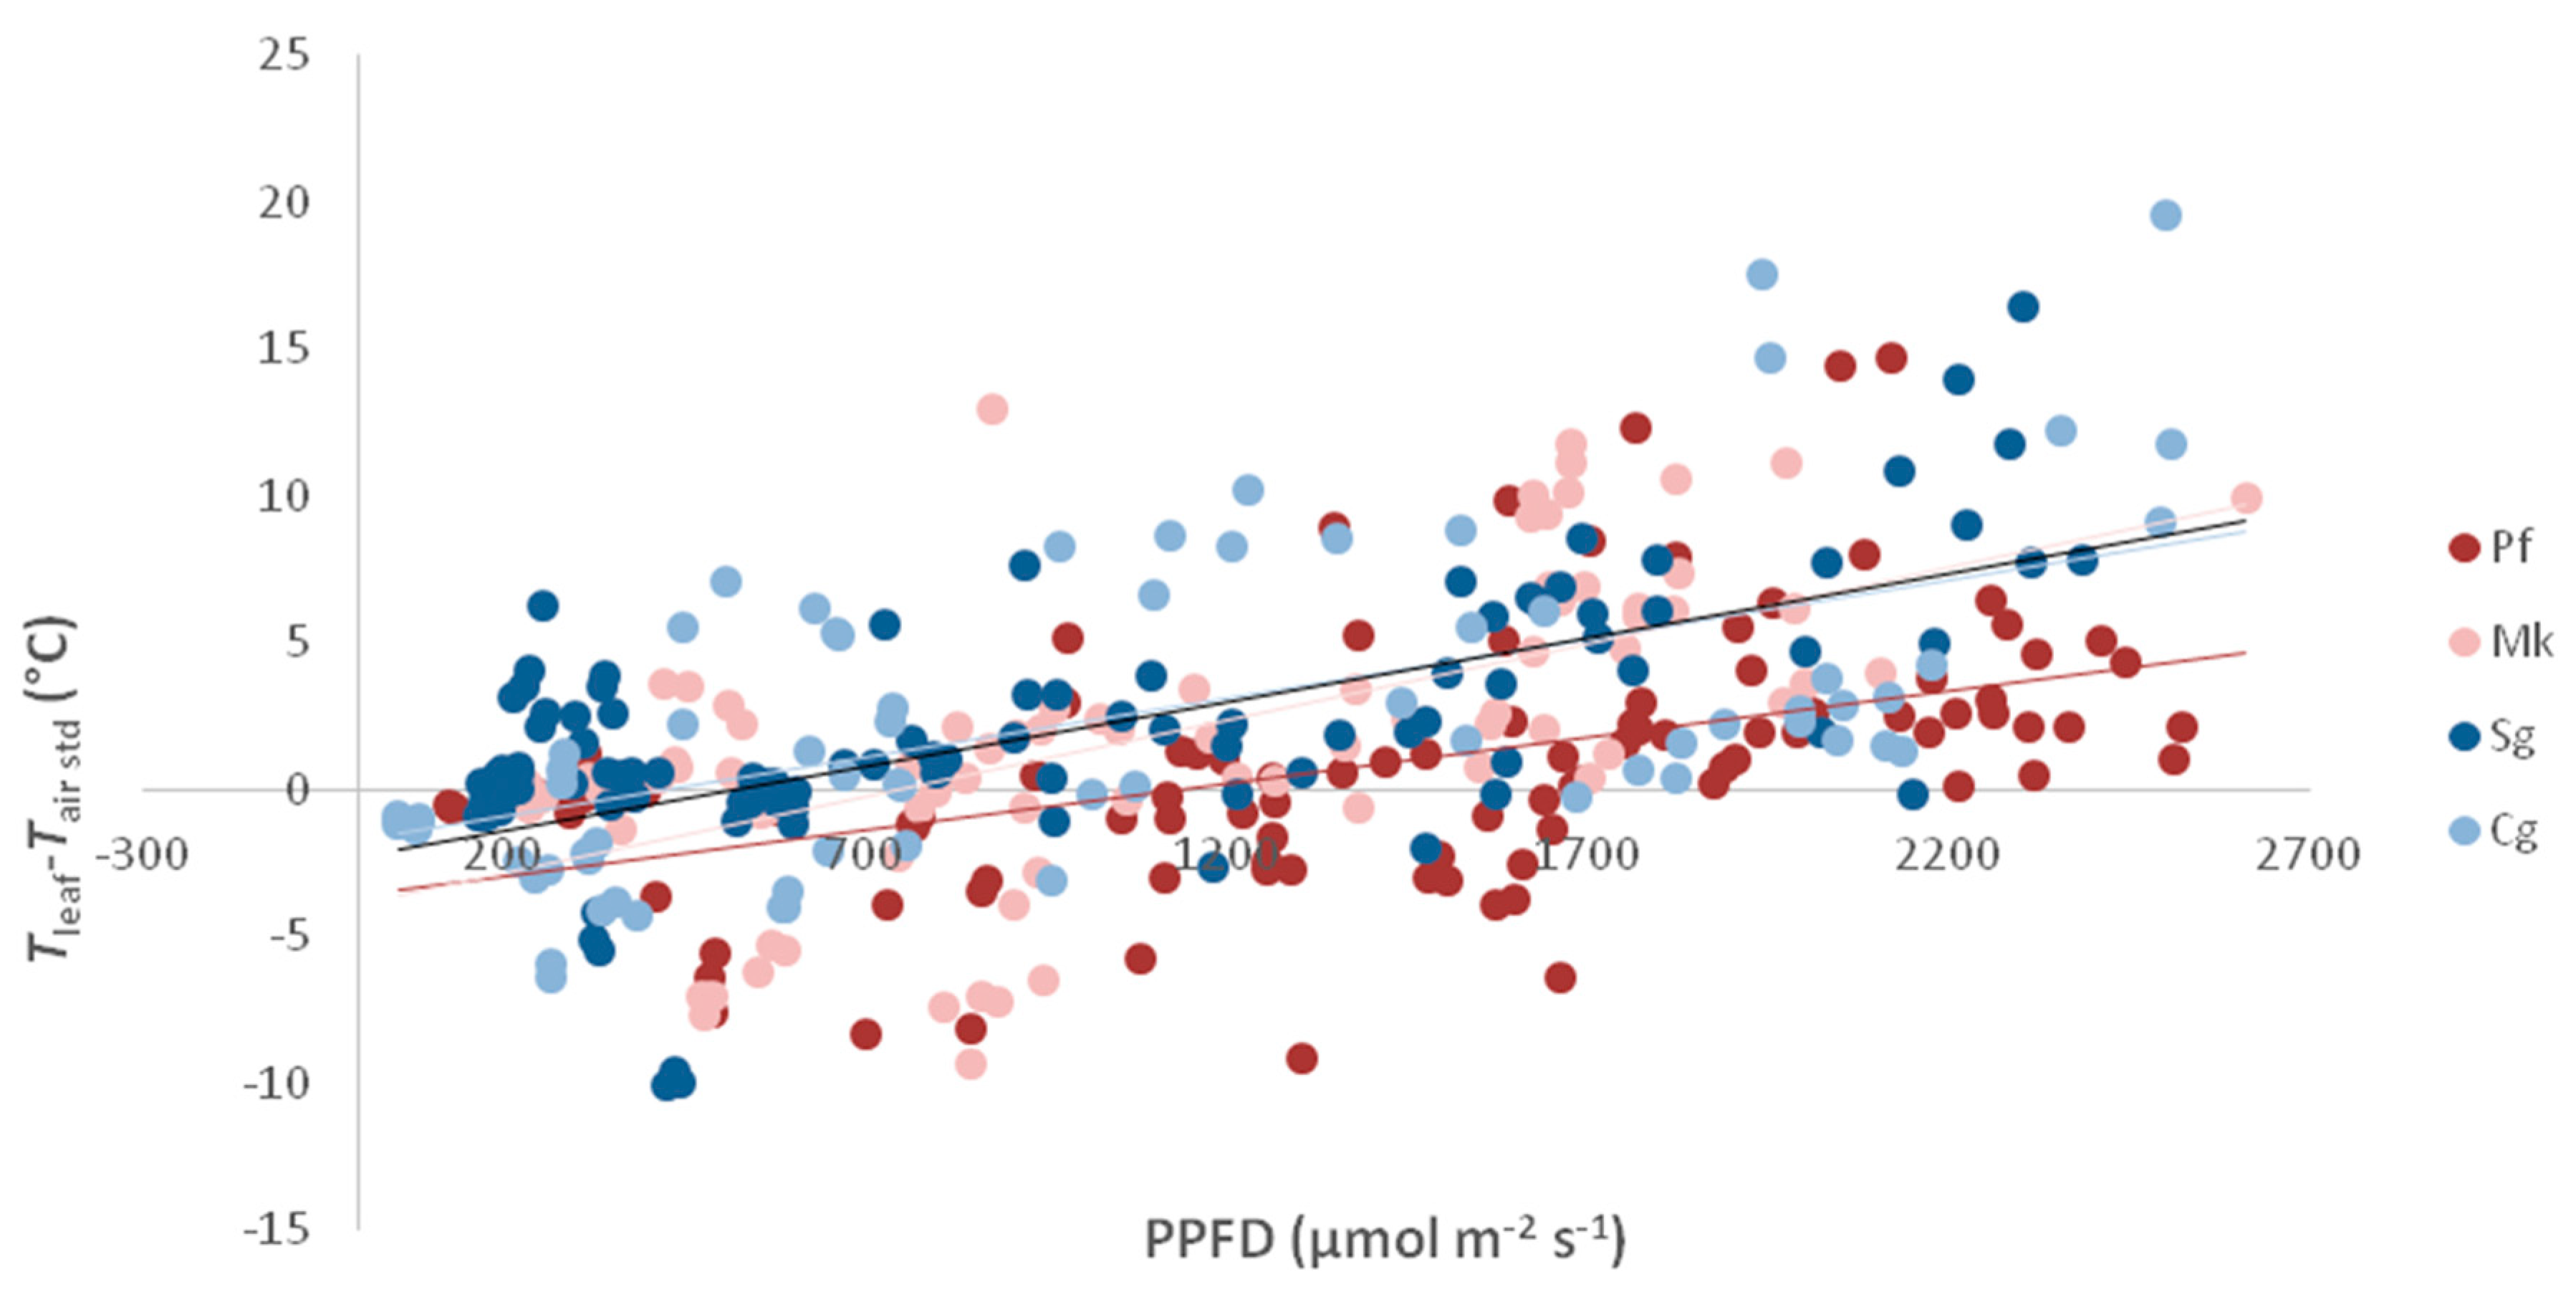
3.1.3. Leaf Temperature

The difference in leaf temperatures (TleafTair), standardized to a wind speed of 1 m s−1, increased with radiation (Figure 4). The slopes of the relationships between PPFD and TleafTair were markedly different among species according to the ANCOVA test (p < 0.001). At high PPFD, TleafTair was lower in the ES species P. fulva than in the other species. At PPFD > 2000 µmol m−2 s−1, Tleaf, on average, exceeded Tair by 3–5 °C in P. fulva compared to 7–10 °C in the other three species. This result agrees well with the higher gs and E of this species, promoting leaf cooling. Observed Tleaf values at sunny conditions were frequently around 35 °C and sometimes up to 40 °C, with lower values observed at higher elevation sites and in P. fulva (Figure S2).

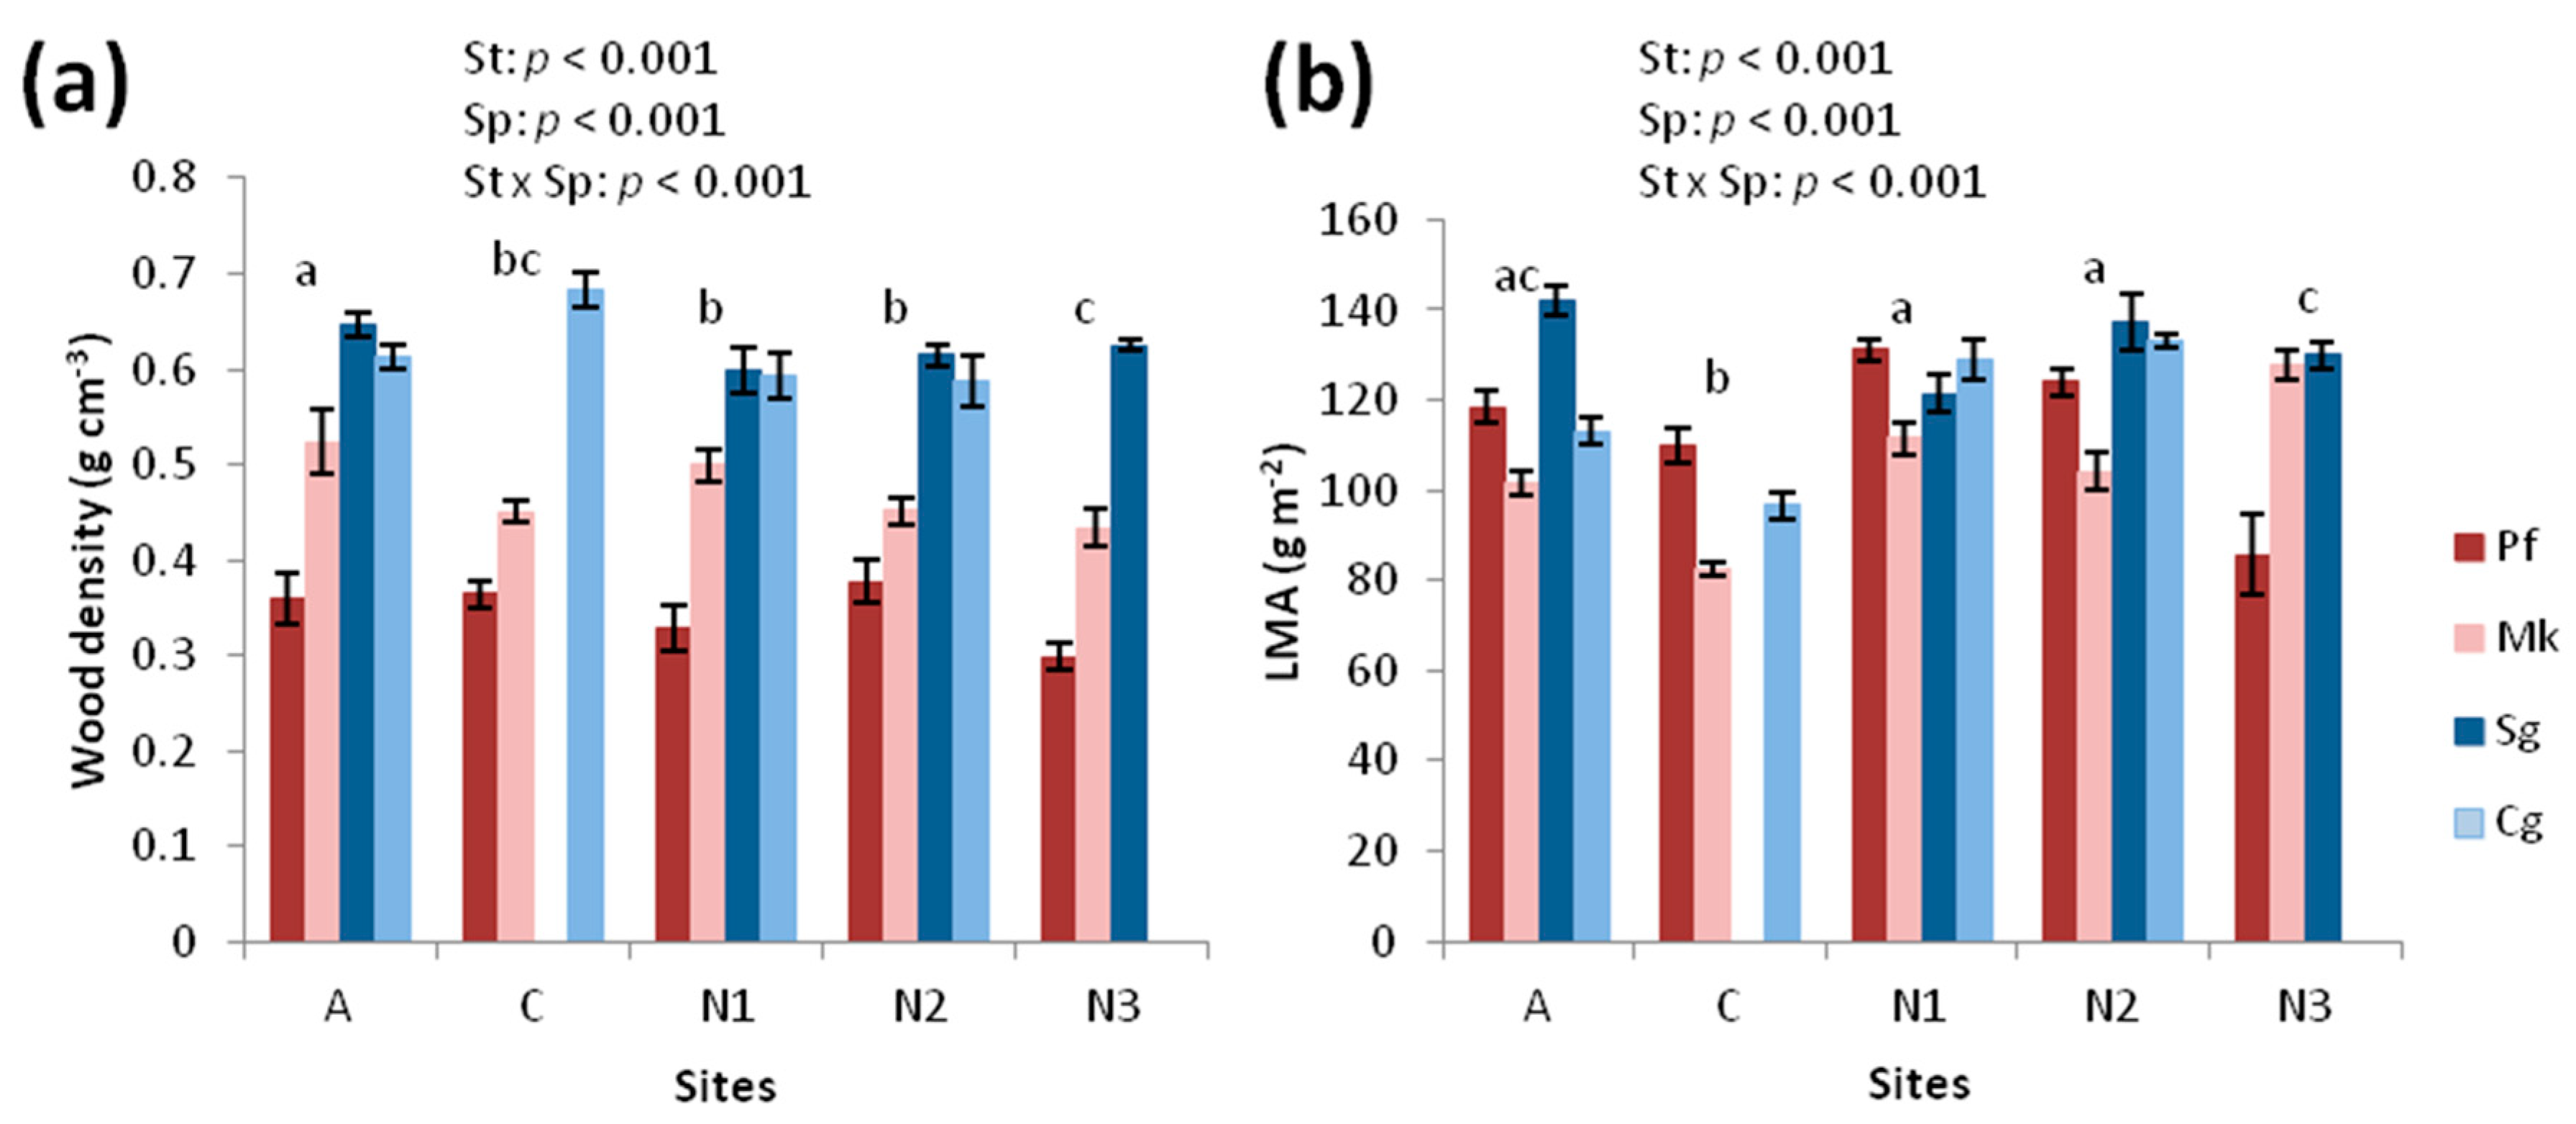
3.2. Structural Traits

Wood density slightly declined with elevation, while LMA did not exhibit any consistent elevation trend (Figure 5). Across all sites, LMA did not vary among species, while wood density was highest in the two LS species and intermediate and lowest in the ES species M. kilimandscharica and P. fulva, respectively (Table S2).

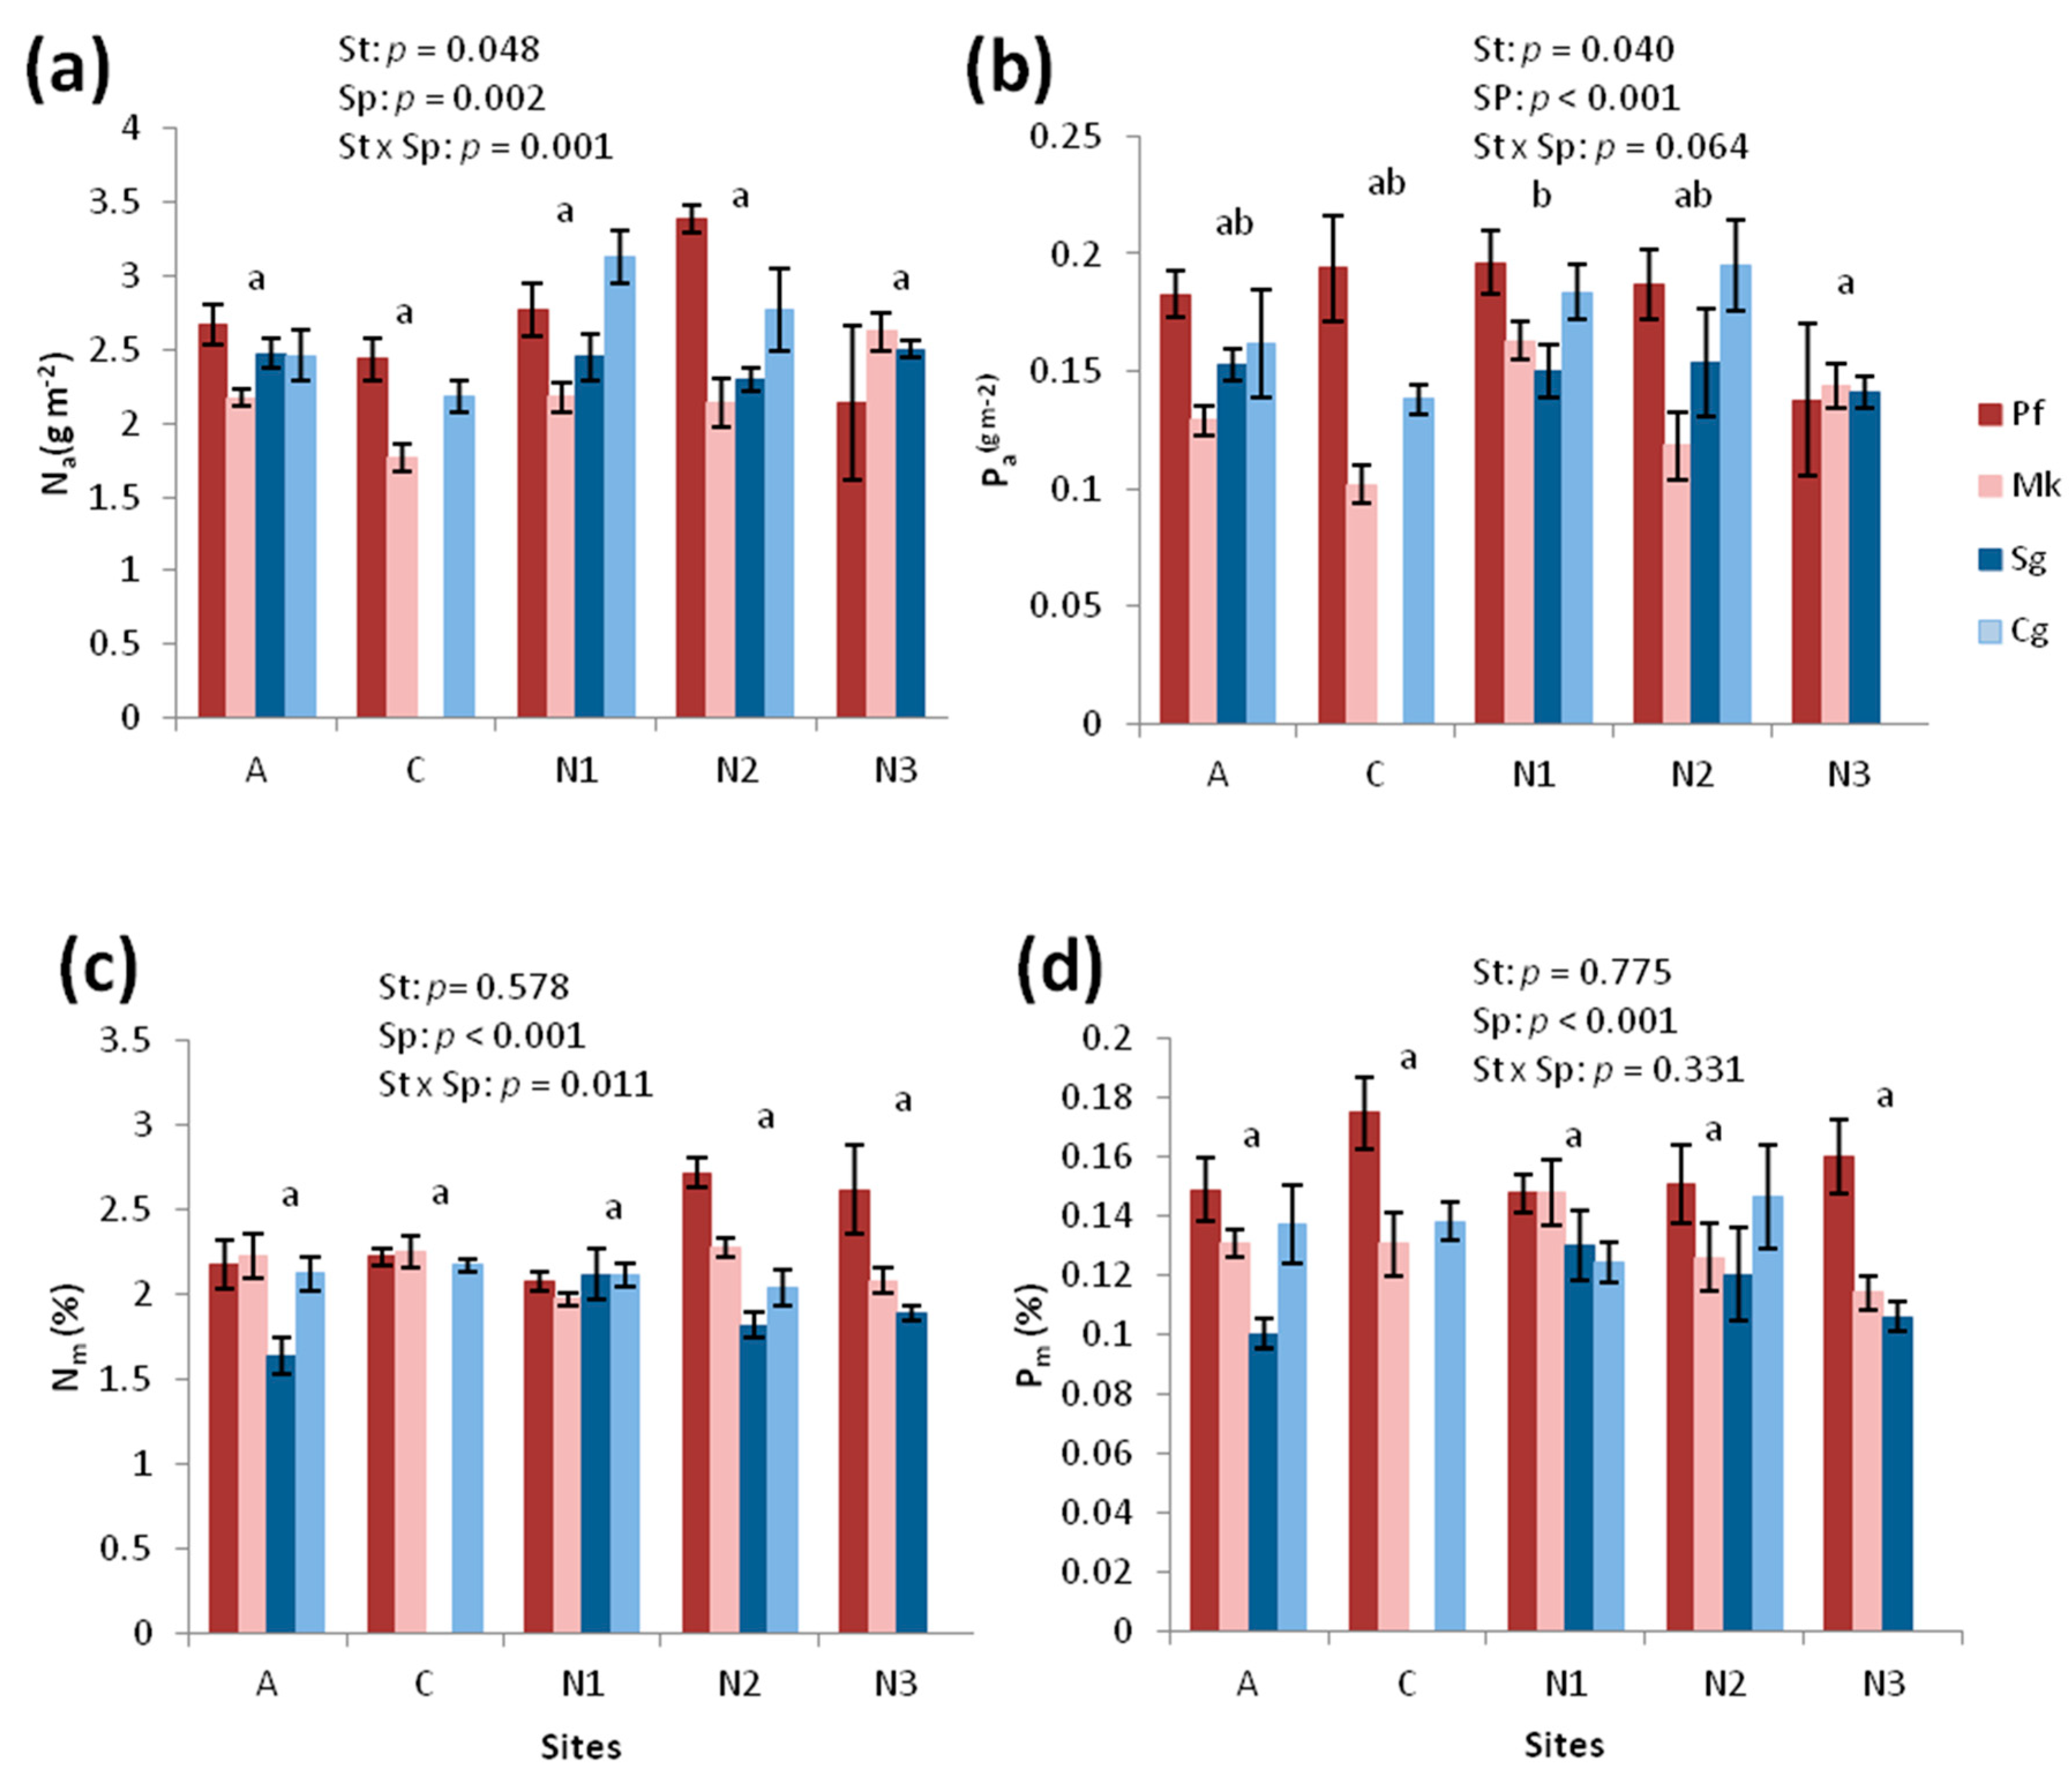
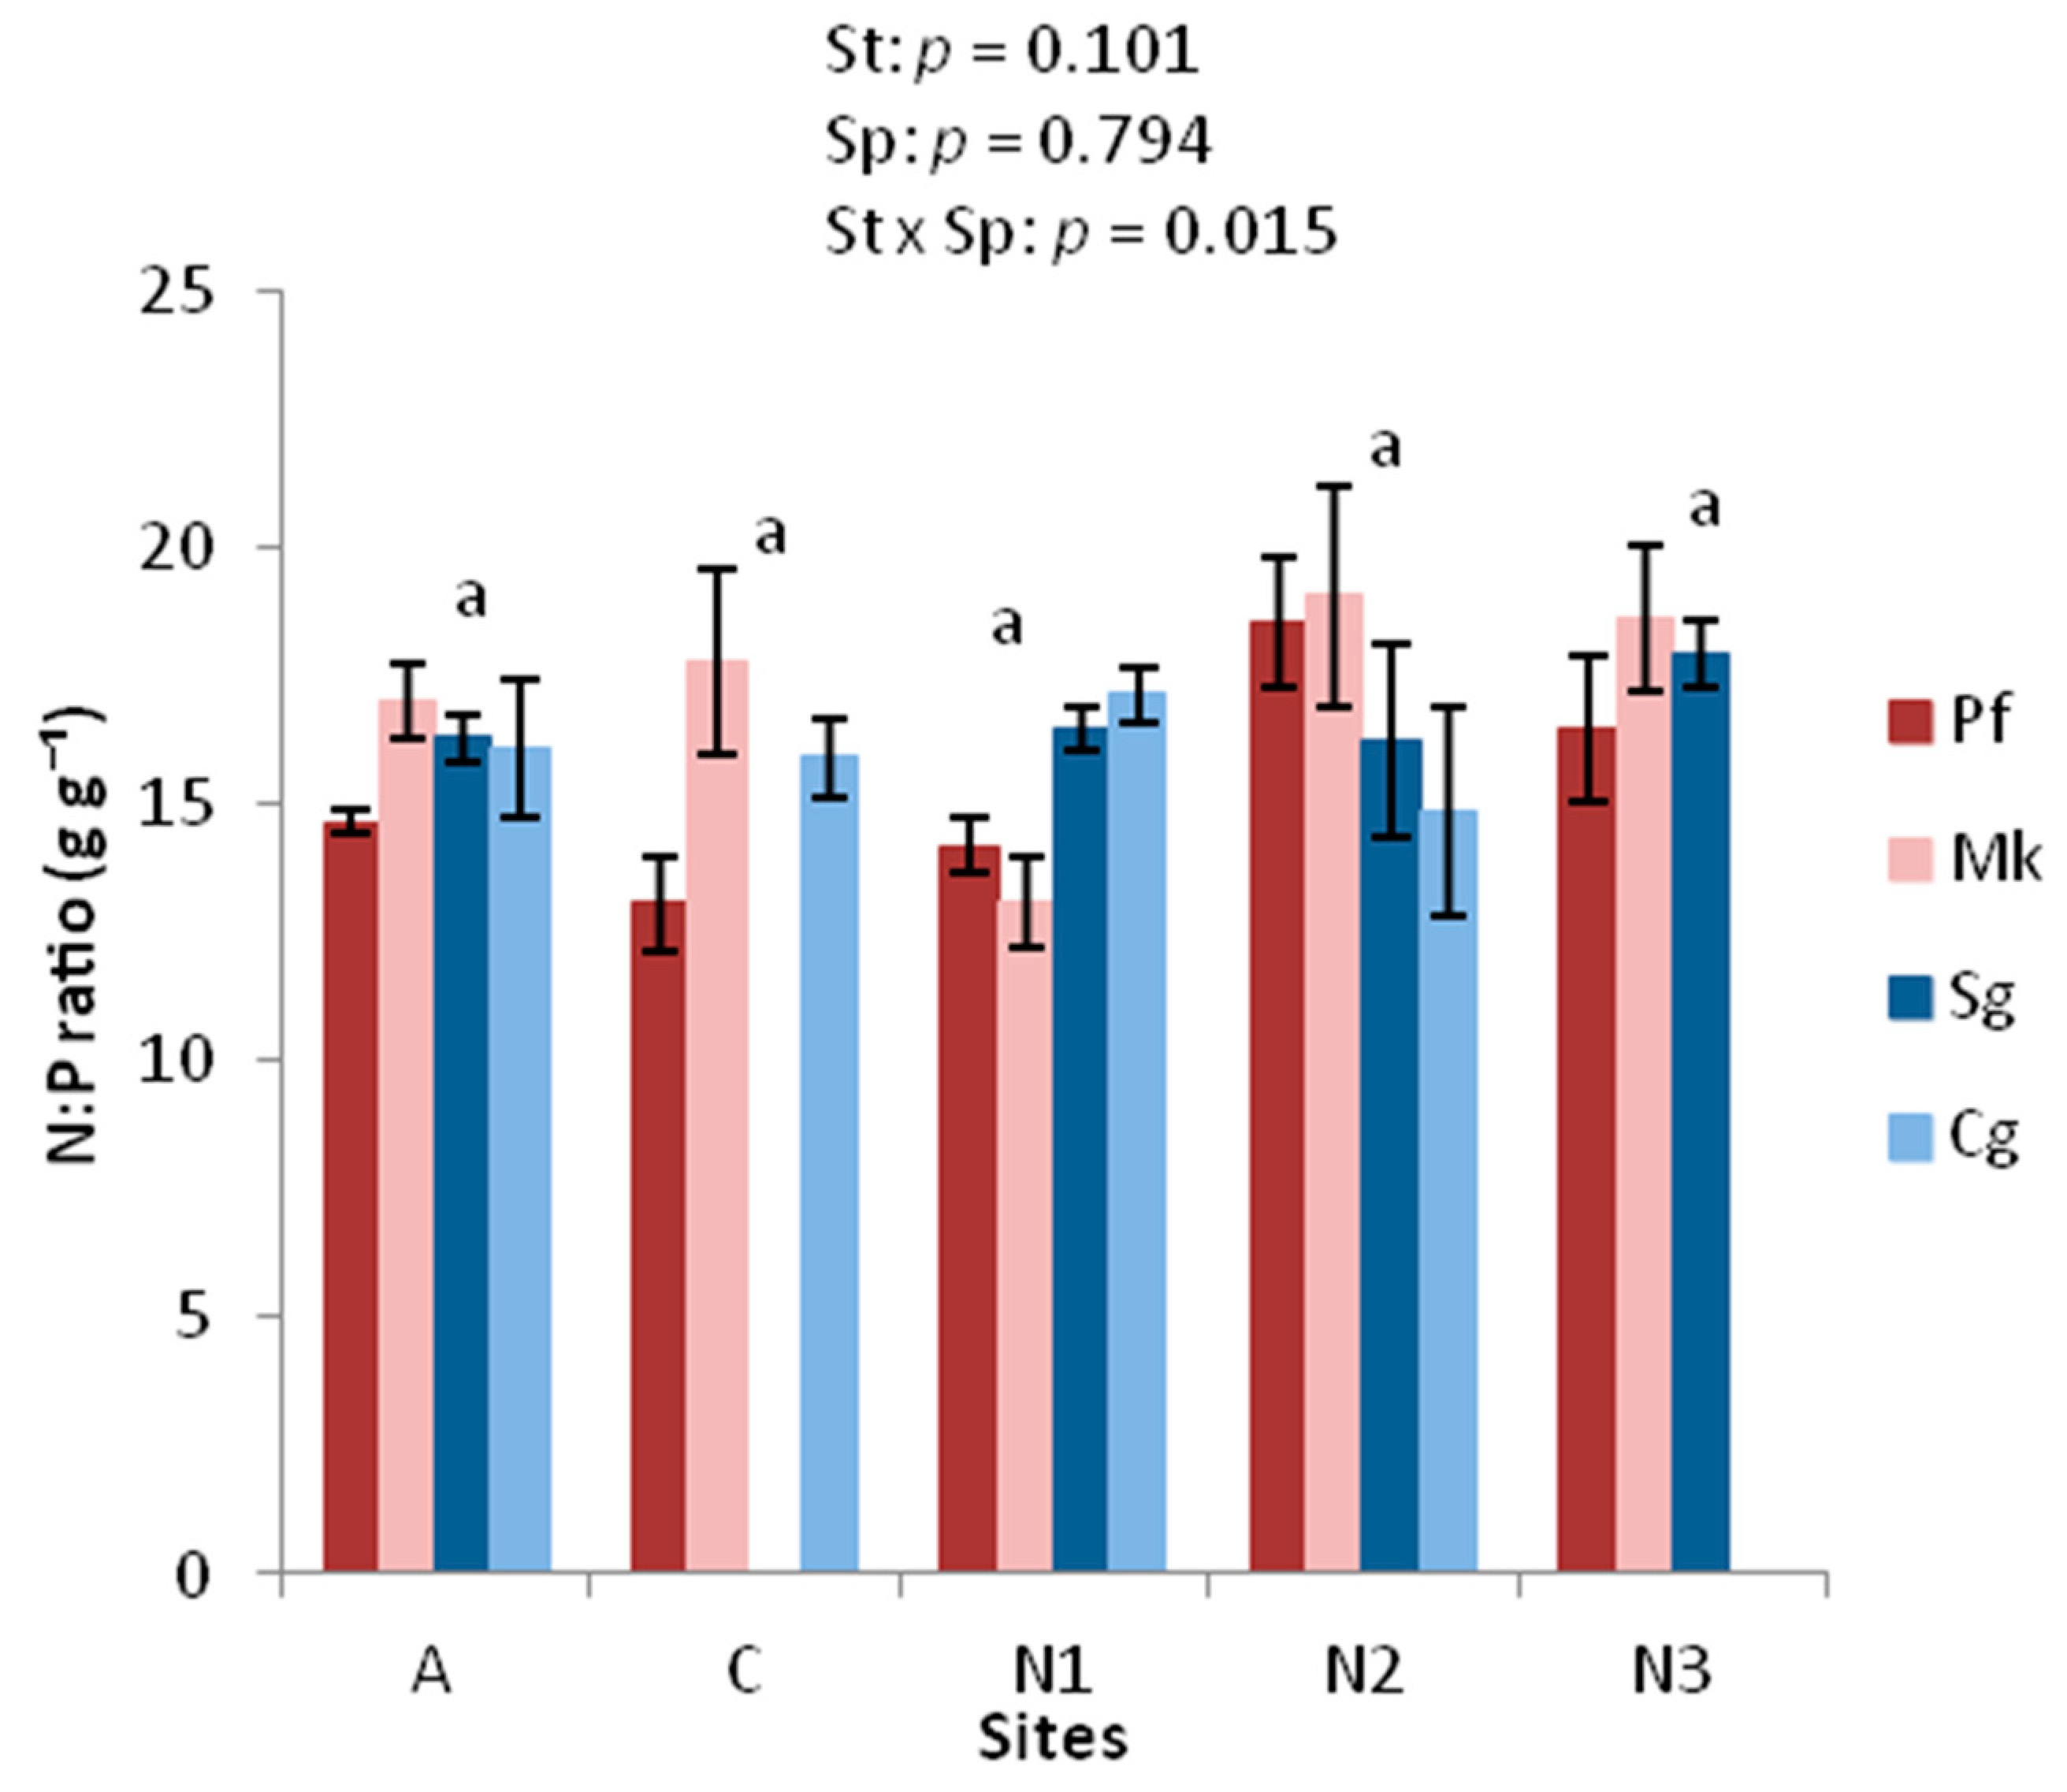
3.3. Chemical Traits

There were no clear trends with elevation for neither mass- nor area-based leaf N or P (Figure 6). Mass-based leaf N and P concentrations were overall higher in the ES species P. fulva than in all the other species, while area-based leaf N and P values were lower in M. kilimandscharica than in P. fulva and C. grandiflora.
The N:P ratio did not differ significantly among either sites (p = 0.101) or species (p = 0.794; Figure 7; Table S2). It ranged between 13–19 for all site by species combinations (Figure 7) and although site differences were not statistically significant, the average values were higher at the two highest sites (17.2 and 17.7) than at the other three sites (15.2–16.0; Table 1). The data thus clearly show that N limitation did not increase with elevation in our forests.
Among all other leaf nutrients, P was the only one exhibiting values below optimal ratios to N reported in the literature (Table 2). In addition, K had slightly lower mean values than the optimal ratios at the lowest and highest elevation sites. This indicates P (co-)limitation in our forests, while there seems to be no limitations by K, S, Cu, Zn, Mn, Fe, Ca, B, and Mg.
The proxy of leaf chlorophyll content (SPAD) was lowest at the highest site, but otherwise did not show any clear trend with elevation (Table 2). Species-specific SPAD values decreased in the order C. grandiflora (71), S.guineense (52), P. fulva (50), and M. kilimandscharica (47). It was thus higher in LS species compared to ES species and there was a significant difference among all species, except between S. guineense and P. fulva (Table S2).

4. Discussion

This study investigated the climate change sensitivity of tropical montane trees by exploring spatial and temporal patterns in tree resource acquisition (carbon, water, nutrients) along an elevation gradient. While most previous tropical elevation gradient studies have measured different tree species at different elevations, we focused on the same set of species along the entire gradient. Altitudinal patterns observed here therefore reflect responses of tree species to varying climatic conditions, not changes in species composition with elevation. The advantage of our approach is that it has high relevance for ongoing climate change, where trees present today will experience substantial changes in temperature, and in some areas also in rainfall, during their lifetime.

4.1. Elevation Patterns in Gas Exchange

We observed several elevation trends in gas exchange. These were not related to leaf nutrients (Figure 6 and Figure 7; Table 2) or structural traits (Figure 5), which did not vary with elevation. Temporal and spatial patterns in gas exchange thus reflect dynamic responses to varying climatic conditions rather than the acclimation of structural or chemical leaf and tree traits.
It turned out that our first hypothesis—predicting decreasing leaf E, constant Asat, and increasing WUE with increasing elevation—was too simplistic. While it was correct for the wet season, patterns were very different in the dry season, when gs, E, and An all increased with elevation (Figure 1 and Figure 2). These results reflect that the atmospheric evaporative demand (i.e., VPD; Table 1) controls E during wet periods, while stomatal control over E dominates under drier conditions (i.e., at lower sites during the dry period). This is consistent with earlier studies in tropical lowland forests in Borneo [62], Panama [63], and central Amazonia [64].
At the three highest sites, values of An were quite similar in wet and dry seasons, indicating that drought stress is minor or non-existent throughout the year in these montane rainforests (Figure 1e,f). The lack of elevation trend in An in the wet season is consistent with earlier studies reporting no change in An along tropical elevation gradients in Ecuador, Hawaii, and Peru [28,29,65]. At the two lowest elevation sites, however, An was markedly suppressed during the dry season, as a result of large drops in gs (Figure 1b,f). Altitudinal variation in An thus seem small or non-existent if soil moisture is high at both high and low elevation, while An is suppressed where the dry season is more pronounced at lower elevation.
Patterns in WUE and iWUE measured by gas exchange reflect those of gs, E, and Asat (Figure 2). WUE increased with elevation in the wet season (as An did not change but E decreased), but not in the dry season (similar increases in both An and E). Intrinsic WUE (iWUE) did not change with elevation in the wet season, but declined with elevation in the dry season (as An increased less than gs). The results on iWUE based on stable C isotopes (Figure 3) were similar to those based on gas exchange during the wet season (Figure 2c), indicating that leaf isotopic composition is mostly determined by wet season photosynthesis. This suggests that leaf formation occurs in the wet season in our species and forests, at least at lower elevations. Taken together, the results on WUE and iWUE indicate that the photosynthetic capacity varies little with elevation, while the control over elevation patterns in E is dominated by VPD in the wet season and by gs during the dry season.
Although there were numerous site by species interactions (Table S2), the overall trends in gas exchange were generally similar in the four species of this study (Figure 1 and Figure 2). However, species differed greatly with respect to the magnitude of gas exchange variables. Not surprisingly, values of gs, E, and An were generally higher in ES compared to LS species, consistent with earlier studies on tropical trees (e.g., [34,66]).
Our results indicate that transpiration and CO2 uptake of tropical montane forests may decline in a climate with more pronounced dry periods. Climate change projections for tropical forests generally indicate future warming, as well as more pronounced rainfall seasonality and increased frequency and severity of droughts [17]. In southern and eastern regions of Rwanda, both temperature and precipitation have increased from 1964 to 2010 [67]. A temperature increase has also been observed in Nyungwe, where our own measurements show a significant increase of 0.4 °C over the last 11 years (p = 0.016). These trends are projected to continue during coming decades [67]. If this will lead to an increased or decreased frequency and severity of droughts will critically depend on the balance between changes in precipitation and potential evapotranspiration (PET). In most of Rwanda, PET exceed precipitation during the main dry season. If the increase in temperature and PET is larger than the possible but uncertain increase in precipitation during this period, dry periods will become more pronounced in the future. This is the current expectation for Rwanda [67].

4.2. Leaf Temperature

The leaf-to-air temperature difference (TleafTair) was smallest in the ES species P. fulva (Figure 4), which also had the highest gs and E in the wet season when Tleaf was measured (Figure 1a,c). This result provided partial support for our second hypothesis, stating that Tleaf greatly exceeds Tair in LS species, but less so in ES species with higher transpiration. It is unclear why the other ES species, M. kilimandscharica, did not have lower TleafTair values than the LS species C. grandiflora, although the former species had higher E values (Table S2). It should be noted, however, that the scatter in TleafTair data (although standardized to a common wind speed of 1 m s−1) was rather large, making it difficult to detect possible small species differences.
Our results on Tleaf are in line with earlier reports of TleafTair in tropical tree species. In a common garden experiment with tropical tree seedlings in Rwanda, Tleaf exceed Tair by around 10 °C in LS tropical montane tree species, while exceedances were smaller (3–6 °C) in other species with higher gs and smaller leaves (ES tropical montane species and exotic plantation species; [23]). Similarly, TleafTair values of up to 10 °C were also observed in a semi-deciduous tropical forest canopy in Panama [68]. Such large values of TleafTair may have large implications for tropical tree photosynthesis. At the leaf-level, the optimum temperature for An may be greatly exceeded by Tleaf, but not by Tair [23]. At the canopy-level, a recent study based on Eddy Covariance data from seven tropical forests demonstrated that the declines in canopy CO2 uptake at high temperatures were caused primarily by VPD-driven declines in gs [69]. Such declines are likely larger when TleafTair, and thus also leaf-to-air VPD, is high.
Earlier controlled warming experiments [21,22], as well as the seedling common garden experiment in Rwanda [23], have indicated that LS species may be more sensitive to high Tair than ES species, at least at the seedling stage. The present study corroborates this for mature trees by showing that species with lower gs and E values (which is typical in LS species) have higher Tleaf values than ES species with higher gs and E values. Declines in An on hot days are thus likely to be larger in LS compared to ES species, regardless of whether they have lower optimum temperatures of photosynthetic biochemistry [22] or not [23]. Such negative heat effects are likely more pronounced at a low elevation, where Tleaf was higher (Figure S2) and perhaps also local genotypes had a higher heat sensitivity of PSII, as observed in a study comparing provenances of European beech with different altitudes of origin [70].

4.3. Nutrient Limitations

Judging from leaf nutrient ratios, N limitation did not increase with elevation in our forests. There were no significant trends in leaf N or P, expressed on neither mass- nor area-basis (Figure 6). The N/P ratio did not change significantly either (Figure 7) and it indicated P limitation rather than N limitation at all sites (Table 2). For non-P nutrients, their ratios to N were higher than the optimal values reported in the literature (Table 2), similar to the results of [45]. These results thus supported our third hypothesis that N limitation does not increase with elevation.
Previous studies in Nyungwe montane rainforest have shown that it has higher net primary productivity and trees with a higher leaf N concentration and photosynthetic capacity compared to many other tropical montane forests [34,51]. Furthermore, a study on soil N dynamics in Nyungwe reported an open and leaky N cycle [71]. These studies together demonstrate high N availability in Nyungwe. We additionally show here that there is not the slightest indication of increasing N limitations with elevation. Actually, there was an indication that the N:P ratio increased at high elevation, but this was not statistically significant (p = 0.101; Figure 7, Table S2).
Our results contrast with observations of increasing N limitation at high elevation along Neotropical elevation gradients [35,41,43], but are similar to results from a study on Borneo [44]. The general view that tropical montane forests are N rather than P limited [36,38,39,40] should therefore be treated with caution. Nutrient limitations of tropical montane forests vary greatly among regions and likely strongly depend on geological history.

5. Conclusions and Implications

We explored the climate sensitivity of resource use in tropical montane trees by measuring structural, physiological, and chemical traits in four tree species present along a tropical elevation gradient ranging from 1700 to 2700 m in Rwanda. Our findings highlighted a strong seasonality in altitudinal patterns. In the dry season, gs, E, and An were higher at a high elevation, where drought was less pronounced, while patterns were absent or the opposite (for E) in the wet season. The leaf-to-air temperature difference was smallest in the ES species P. fulva, which also had the highest gs and E values. With respect to leaf nutrient status, there was no change in leaf N, P, or N/P ratio with elevation. Moreover, nutrient ratios relative to N were higher than previously reported optimal values, except for P, indicating that tree growth is mostly P limited in Rwandan tropical forests. In summary, our results demonstrate pronounced seasonality in altitudinal patterns of tropical tree water use and CO2 uptake, indicating decreasing transpiration and primary production in a climate with more pronounced dry periods. Furthermore, they show that N limitations do not increase with elevation, as otherwise most commonly reported for tropical montane forests.

Supplementary Materials

The following are available online at https://www.mdpi.com/1999-4907/9/10/647/s1, Figure S1: Relationship between gs measured by LI6400 and SC-1 instruments, Figure S2: Relationship between leaf temperature (Tleaf) and photosynthetic photon flux density (PFD) for all species at five sites along an elevation gradient in the wet season 2017. Species abbreviations are based on first letters in genus and species: Pf = Polyscias fulva; Mk = Macaranga kilimandscharica; Sg = Syzygium guineense; Cg = Carapa grandiflora. Explanations of site abbreviations are provided in Table 1, Table S1: Structural traits (Mean ± SD) of four species at five sites along an elevation gradient (n = 6). Explanations of site abbreviations are provided in Table 1; the order follows increasing elevation from left to right. Species abbreviations represent first letters in genus and species, Table S2: Statistical analyses for all leaf traits; physiological, structural and chemical traits as well as post hoc comparisons among sites.

Author Contributions

M.M., G.W. and J.U. planned and designed the experiment with important contributions from D.N., and B.N. (Brigitte Nyirambangutse); A.M., B.N. (Bonaventure Ntirugulirwa), M.M., E.Z., D.G., and E.N.B. conducted field measurements and data compilations; M.M. and J.U. analysed the data and wrote the paper, with G.W. providing important editorial advice. All authors read and approved the final manuscript.

Funding

This study was funded by the Swedish research council (VR; grant 2015-03338); the Swedish Research Council for Environment, Agricultural Sciences and Spatial Planning (Formas; grant 2015-1458); and Académie de Recherche et d’Enseignement Supérieur (ARES). The last two authors were also supported by the Swedish strategic research area ‘Biodiversity and Ecosystem services in a Changing Climate’ (BECC; http://www.becc.lu.se/).

Acknowledgments

We are further grateful to the Rwanda Development Board (RDB) for providing access permits to our study sites, and to Innocent Rusizana and Pierre Niyontegereje for their assistance during field data collection.

Conflicts of Interest

The authors declare that they have no conflict of interest.

References

  1. Pan, Y.; Birdsey, R.A.; Fang, J.; Houghton, R.; Kauppi, P.E.; Kurz, W.A.; Phillips, O.L.; Shvidenko, A.; Lewis, S.L.; Canadell, J.G.; et al. A Large and Persistent Carbon Sink in the World’s Forests. Science 2011, 333, 988–993. [Google Scholar] [CrossRef] [PubMed]
  2. Bonan, G.B. Forests and climate change: Forcings, feedbacks, and the climate benefits of forests. Science 2008, 320, 1444–1449. [Google Scholar] [CrossRef] [PubMed]
  3. Medlyn, B.E.; Dreyer, E.; Ellsworth, D.; Forstreuter, M.; Harley, P.C.; Kirschbaum, M.U.F.; Le Roux, X.; Montpied, P.; Strassemeyer, J.; Walcroft, A.; et al. Temperature response of parameters of a biochemically based model of photosynthesis. Plant Cell Environ. 2002, 25, 1167–1179. [Google Scholar] [CrossRef]
  4. Kattge, J.; Knorr, W.; Farquhar, T. Temperature acclimation in a biochemical model of photosynthesis: A reanalysis of data from 36 species. Plant Cell Environ. 2007, 30, 1176–1190. [Google Scholar] [CrossRef] [PubMed]
  5. Gunderson, C.A.; Hara, K.H.O.; Campion, C.M. Thermal plasticity of photosynthesis: The role of acclimation in forest responses to a warming climate. Glob. Chang. Biol. 2010, 16, 2272–2286. [Google Scholar] [CrossRef]
  6. Lewis, S.L. Tropical forests and the changing earth system. Philos. Trans. R. Soc. B 2006, 361, 195–210. [Google Scholar] [CrossRef] [PubMed] [Green Version]
  7. Malhi, Y.; Silman, M.; Salinas, N.; Bush, M.; Meir, P.; Saatchi, S. Introduction: Elevation gradients in the tropics: Laboratories for ecosystem ecology and global change research. Glob. Chang. Biol. 2010, 16, 3171–3175. [Google Scholar] [CrossRef]
  8. Corlett, R.T. Impacts of warming on tropical lowland rainforests. Trends Ecol. Evol. 2011, 26, 606–613. [Google Scholar] [CrossRef] [PubMed]
  9. Feeley, K.E.J.; Davies, S.T.J.; Perez, R.; Hubbell, S.P.; Foster, R.B. Directional changes in the species composition of a tropical forest. Ecology 2011, 92, 871–882. [Google Scholar] [CrossRef] [PubMed] [Green Version]
  10. Janzen, D.H. Why mountain passes are higher in the tropics. Am. Nat. 1967, 101, 233–249. [Google Scholar] [CrossRef]
  11. Wright, S.J.; Muller-Landau, H.C.; Schipper, J. The future of tropical species on a warmer planet. Conserv. Biol. 2009, 23, 1418–1426. [Google Scholar] [CrossRef] [PubMed]
  12. Doughty, C.E.; Goulden, M.L. Are tropical forests near a high temperature threshold? J. Geophys. Res. 2008, 113, 1–12. [Google Scholar] [CrossRef]
  13. Way, D.A.; Oren, R.A.M. Differential responses to changes in growth temperature between trees from different functional groups and biomes: A review and synthesis of data. Tree Physiol. 2010, 30, 669–688. [Google Scholar] [CrossRef] [PubMed]
  14. Slot, M.; Winter, K. The Effects of Rising Temperature on the Ecophysiology of Tropical Forest Trees. In Tropical Tree Physiology; Springer: Cham, Switzerland, 2016; pp. 385–412. [Google Scholar]
  15. Corlett, R.T.; Westcott, D.A. Will plant movements keep up with climate change? Trends Ecol. Evol. 2013, 28, 482–488. [Google Scholar] [CrossRef] [PubMed]
  16. Duque, A.; Stevenson, P.R.; Feeley, K.J. Thermophilization of adult and juvenile tree communities in the northern tropical Andes. Proc. Natl. Acad. Sci. USA 2015, 112, 10744–10749. [Google Scholar] [CrossRef] [PubMed]
  17. Intergovernmental Panel on Climate Change (IPCC). Climate Change 2013: The Physical Science Basis. In Contribution of Working Group I to the Fifth Assessment Report of the Intergovernmental Panel on Climate Change; Cambridge University Press: Cambridge, UK, 2013. [Google Scholar]
  18. Bonal, D.; Barigah, T.S.; Granier, A.; Guehl, J.M. Late-stage canopy tree species with extremely low d 13 C and high stomatal sensitivity to seasonal soil drought in the tropical rainforest of French Guiana. Plant Physiol. 2000, 23, 445–459. [Google Scholar]
  19. Doughty, C.E. An In Situ Leaf and Branch Warming Experiment in the Amazon. Biotropica 2011, 43, 658–665. [Google Scholar] [CrossRef]
  20. Zhao, J.; Hartmann, H.; Trumbore, S.; Ziegler, W.; Zhang, Y. High temperature causes negative whole-plant carbon balance under mild drought. New Phytol. 2013, 200, 330–339. [Google Scholar] [CrossRef] [PubMed] [Green Version]
  21. Cheesman, A.W.; Winter, K. Growth response and acclimation of CO2 exchange characteristics to elevated temperatures in tropical tree seedlings. J. Exp. Bot. 2013, 64, 3817–3828. [Google Scholar] [CrossRef] [PubMed]
  22. Slot, M.; Garcia, M.N.; Winter, K. Temperature response of CO2 exchange in three tropical tree species. Funct. Plant Biol. 2016, 43, 468–478. [Google Scholar] [CrossRef]
  23. Vårhammar, A.; Wallin, G.; McLean, C.M.; Dusenge, M.E.; Medlyn, B.E.; Hasper, T.B.; Nsabimana, D.; Uddling, J.A. Photosynthetic temperature responses of tree species in Rwanda: Evidence of pronounced negative effects of high temperature in montane rainforest climax species. New Phytol. 2015, 206, 1000–1012. [Google Scholar] [CrossRef] [PubMed] [Green Version]
  24. Christian, K. The use of ‘altitude’ in ecological research. Trends Ecol. Evol. 2007, 22, 569–574. [Google Scholar]
  25. Motzer, T.; Munz, N.; Küppers, M.; Schmitt, D.; Anhuf, D. Stomatal conductance, transpiration and sap flow of tropical montane rain forest trees in the southern Ecuadorian Andes. Tree Physiol. 2017, 25, 1283–1293. [Google Scholar] [CrossRef]
  26. Gotsch, S.G.; Crausbay, S.D.; Giambelluca, T.W.; Weintraub, A.E.; Longman, R.J.; Asbjornsen, H.; Hotchkiss, S.C.; Dawson, T.E. Water relations and microclimate around the upper limit of a cloud forest in Maui, Hawai. Tree Physiol. 2014, 34, 766–777. [Google Scholar] [CrossRef] [PubMed]
  27. Gotsch, S.G.; Asbjornsen, H.; Holwerda, F.; Goldsmith, G.R.; Weintraub, A.E.; Dawson, T.E. Foggy days and dry nights determine crown-level water balance in a seasonal tropical montane cloud forest. Plant Cell Environ. 2014, 37, 261–272. [Google Scholar] [CrossRef] [PubMed]
  28. Cordell, S.; Goldstein, G.; Meinzer, F.C.; Handley, L.L. Allocation of nitrogen and carbon in leaves of Metrosideros polymorpha regulates carboxylation capacity and δ13C along an altitudinal gradient. Funct. Ecol. 1999, 13, 811–818. [Google Scholar] [CrossRef]
  29. Wittich, B.; Horna, V.; Homeier, J.; Leuschner, C. Altitudinal Change in the Photosynthetic Capacity of Tropical Trees: A Case Study from Ecuador and a Pantropical Literature Analysis. Ecosystems 2012, 15, 958–973. [Google Scholar] [CrossRef] [Green Version]
  30. Zhang, S.; Zhou, Z.; Hu, H.; Xu, K.; Yan, N.; Li, S. Photosynthetic performances of Quercus pannosa vary with altitude in the Hengduan Mountains, southwest China. For. Ecol. Manag. 2005, 212, 291–301. [Google Scholar] [CrossRef]
  31. Kao, W.-Y.; Chang, K.-W. Altitudinal trends in photosynthetic rate and leaf characteristics of Miscanthus populations from central Taiwan. Aust. J. Bot. 2001, 49, 509–514. [Google Scholar] [CrossRef]
  32. Friend, A.A.D.; Woodward, F.I.; Switsur, V.R. Field Measurements of Photosynthesis, Stomatal Conductance, Leaf Nitrogen and δ13C Along Altitudinal Gradients in Scotland. Funct. Ecol. 1989, 3, 117–122. [Google Scholar] [CrossRef]
  33. Premoli, A.C.; Brewer, C.A. Environmental v. genetically driven variation in ecophysiological traits of Nothofagus pumilio from contrasting elevations. Aust. J. Bot. 2007, 55, 585–591. [Google Scholar] [CrossRef]
  34. Dusenge, M.E.; Wallin, G.; Gårdesten, J.; Niyonzima, F.; Adolfsson, L.; Nsabimana, D.; Uddling, J. Photosynthetic capacity of tropical montane tree species in relation to leaf nutrients, successional strategy and growth temperature. Oecologia 2015, 177, 1183–1194. [Google Scholar] [CrossRef] [PubMed]
  35. Asner, G.P.; Martin, R.E.; Tupayachi, R.; Anderson, C.B.; Sinca, F.; Carranza-Jiménez, L.; Martinez, P. Amazonian functional diversity from forest canopy chemical assembly. Proc. Natl. Acad. Sci. USA 2014, 111, 5604–5609. [Google Scholar] [CrossRef] [PubMed] [Green Version]
  36. Vitousek, P.M.; Matson, P.A.; Turner, D.R. Elevational and age gradients in hawaiian montane rainforest: Foliar and soil nutrients. Oecologia 1988, 77, 565–570. [Google Scholar] [CrossRef] [PubMed]
  37. Korner, C.H.; Farquar, G.D.; Roksandic, Z. A global survey of carbon isotope discrimination in plants from high altitude. Oecologia 1988, 74, 623–632. [Google Scholar] [CrossRef] [PubMed]
  38. Vitousek, P.M. Litterfall, Nutrient Cycling, and Nutrient Limitation in Tropical Forests. Ecology 1984, 65, 285–298. [Google Scholar] [CrossRef]
  39. Tanner, E.V.J.; Vitousek, P.M.; Cuevas, E. Experimental Investigation of Nutrient Limitation of Forest Growth on Wet Tropical Mountains. Ecology 1998, 79, 10–22. [Google Scholar] [CrossRef]
  40. Dalling, J.W.; Heineman, K.; Lopez, O.R.; Wright, S.J.; Turner, B.L. Nutrient availability in tropical rain forests: The paradigm of phosphorus limitation. In Tropical Tree Physiology; Springer International Publishing: Berlin, Germany, 2016; pp. 261–273. [Google Scholar]
  41. Fisher, J.B.; Malhi, Y.; Daniel, T. Nutrient limitation in rainforests and cloud forests along a 3000-m elevation gradient in the Peruvian Andes. Oecologia 2013, 172, 889–902. [Google Scholar] [CrossRef] [PubMed]
  42. Soethe, N.; Lehmann, J.; Engels, C. Nutrient availability at different altitudes in a tropical montane forest in Ecuador. J. Trop. Ecol. 2008, 24, 397–406. [Google Scholar] [CrossRef]
  43. Van de Weg, M.J.; Meira, P.; Gracea, J.; Atkinb, O.K. Altitudinal variation in leaf mass per unit area, leaf tissue density and foliar nitrogen and phosphorus content along an Amazon-Andes gradient in Peru. Plant Ecol. Divers. 2009, 2, 243–254. [Google Scholar] [CrossRef]
  44. Kitayama, K.; Aiba, S. Ecosystem structure and productivity of tropical rain forests along altitudinal gradients with contrasting soil phosphorus on Mount Kinabalu, Borneo. J. Ecol. 2002, 90, 37–51. [Google Scholar] [CrossRef]
  45. Nyirambangutse, B.; Zibera, E.; Dusenge, M.E.; Nsabimana, D.; Pleijel, H.; Uddling, J.; Wallin, G. Canopy nutrient cycling in Afromontane tropical forests at different successional stages. Tree Physiol. 2017. submitted for publication. [Google Scholar]
  46. Nsabimana, D.; Klemedtson, L.; Kaplin, B.A.; Wallin, G. Soil CO2 flux in six monospecific forest plantations in Southern Rwanda. Soil Biol. Biochem. 2009, 41, 396–402. [Google Scholar] [CrossRef]
  47. Gross-Camp, N.D.; Martin, A.; Mcguire, S.; Bereket Kebe, D.E.; Munyarukaza, J. Payments for ecosystem services in an African protected area: Exploring issues of legitimacy, fairness, equity and effectiveness. Fauna Flora Int. Oryx 2012, 46, 24–33. [Google Scholar] [CrossRef]
  48. Plumptre, A.J.; Davenport, T.R.B.; Behangana, M.; Kityo, R.; Eilu, G.; Ssegawa, P.; Ewango, C.; Meirte, D.; Kahindo, C.; Herremans, M.; et al. The biodiversity of the Albertine Rift. Biol. Conserv. 2007, 134, 178–194. [Google Scholar] [CrossRef]
  49. Plumptre, A.J.; Masozera, M.; Fashing, P.J.; McNeilage, A.; Ewango, C.; Kaplin, B.A.; Liengola, I. Biodiversity Surveys of the Nyungwe Forest Reserve in S.W.; Working Paper; Wildlife Conservation Society: New York, NY, USA, 2002. [Google Scholar]
  50. Kindt, R.; van Breugel, P.; Lillesø, J.-P.B.; Minani, V.; Ruffo, C.K.; Gapusi, J.; Jamnadass, R.; Graudal, L. Atlas and tree species composition for Rwanda. In Potential Natural Vegetation of Eastern Africa 2014; Department of Geosciences and Natural Resource Management, University of Copenhagen: Copenhagen, Denmark, 2014. [Google Scholar]
  51. Nyirambangutse, B.; Zibera, E.; Uwizeye, F.K.; Nsabimana, D.; Bizuru, E.; Pleijel, H.; Uddling, J.; Wallin, G. Carbon stocks and dynamics at different successional stages in an Afromontane tropical forest. Biogeosciences 2017, 14, 1285–1303. [Google Scholar] [CrossRef]
  52. Bloesch, U.; Troupin, G.; Derungs, N. Les Plantes Ligneuses du Rwanda: Flore, Écologie et Usages; Shaker Verlag: Aachen, Germany, 2009. [Google Scholar]
  53. Farquhar, G.D.; Ehleringer, J.R.; Hubick, K.T. Carbon Isotope Discrimination and Photosynthesis. Annu. Rev. Plant Physiol. Plant Mol. Biol. 1989, 40, 503–537. [Google Scholar] [CrossRef]
  54. Ericsson, T.; Kähr, M. Growth and nutrition of birch seedlings in relation to potassium supply rate. Trees 1993, 7, 78–85. [Google Scholar] [CrossRef]
  55. Ericsson, T.; Kähr, M. Growth and nutrition of birch seedlings at varied relative addition rates of magnesium. Tree Physiol. 1995, 15, 85–93. [Google Scholar] [CrossRef] [PubMed]
  56. Göransson, A. Growth and nutrition of small Betula pendula plants at different relative addition rates of iron. Trees 1993, 8, 31–38. [Google Scholar] [CrossRef]
  57. Göransson, A. Growth and nutrition of small Betula pendula plants at different relative addition rates of manganese. Tree Physiol. 1994, 14, 375–381. [Google Scholar] [CrossRef] [PubMed]
  58. Göransson, A. Steady-state nutrition and growth responses of Betula pendula plants at different relative supply rates of copper. Plant Cell Environ. 1998, 21, 937–944. [Google Scholar] [CrossRef]
  59. Göransson, A. Growth and nutrition of Betula pendula at different relative supply rates of zinc. Tree physiol. 1999, 19, 111–116. [Google Scholar] [CrossRef] [PubMed]
  60. Knecht, M.F.; Göransson, A. Terrestrial plants require nutrients in similar proportions. Tree Physiol. 2004, 24, 447–460. [Google Scholar] [CrossRef] [PubMed] [Green Version]
  61. Linder, S. Foliar Analysis for Detecting and Correcting Nutrient Imbalances in Norway Spruce. Ecol. Bull. 1995, 44, 178–190. [Google Scholar]
  62. Kumagai, T.; Saitoh, T.M.; Sato, Y.; Takahashi, H. Annual water balance and seasonality of evapotranspiration in a Bornean tropical rainforest. Agric. For. Meteorol. 2005, 128, 81–92. [Google Scholar] [CrossRef]
  63. Meinzer, F.C.; Goldstein, G.; Jackson, P.; Holbrook, N.M.; Gutiérrez, M.V.; Cavelier, J. International Association for Ecology Environmental and Physiological Regulation of Transpiration in Tropical Forest Gap Species: The Influence of Boundary Layer and Hydraulic Properties. Oecologia 1995, 101, 514–522. [Google Scholar] [CrossRef] [PubMed]
  64. Malhi, Y.; Pegoraro, E.; Nobre, A.D.; Pereira, M.G.P.; Grace, J.; Culf, A.D.; Clement, R. Energy and water dynamics of a central Amazonian rain forest. J. Geophys. Res. 2002, 107, 8061. [Google Scholar] [CrossRef]
  65. Malhi, Y.; Girardin, C.A.J.; Goldsmith, G.R.; Doughty, C.E.; Salinas, N.; Metcalfe, D.B.; Huasco, W.H.; Silva-Espejo, J.E.; Aguilla-Pasquell, J.D.; Amézquita, F.F.; et al. The variation of productivity and its allocation along a tropical elevation gradient: A whole carbon budget perspective. New Phytol. 2017, 214, 1019–1032. [Google Scholar] [CrossRef] [PubMed]
  66. Nogueira, A.; Martinez, C.A.; Ferreira, L.L.; Prado, C. Photosynthesis and water use efficiency in twenty tropical tree species of differing succession status in a Brazilian reforestation. Photosynthetica 2004, 42, 351–356. [Google Scholar] [CrossRef]
  67. Haggag, M.; Kalisa, J.C.; Abdeldayem, A.W. Projections of precipitation, air temperature and potential evapotranspiration in Rwanda under changing climate conditions. Afr. J. Environ. Sci. Technol. 2016, 10, 18–33. [Google Scholar]
  68. Rey-sánchez, A.C.; Slot, M.; Posada, J.M.; Kitajima, K. Spatial and seasonal variation in leaf temperature within the canopy of a tropical forest. Clim. Res. 2016, 71, 75–89. [Google Scholar] [CrossRef]
  69. Tan, Z.; Zeng, J.; Zhang, Y.; Slot, M.; Gamo, M.; Hirano, T. Optimum air temperature for tropical forest photosynthesis: Mechanisms involved and implications for climate warming. Environ. Res. Lett. 2017, 12, 1–12. [Google Scholar] [CrossRef]
  70. Pšidová, E.; Živčák, M.; Stojnić, S.; Orlović, S.; Gömöry, D.; Kučerová, J.; Ditmarová, L.; Střelcová, K.; Brestič, M.; Kalaji, H.M. Altitude of origin influences the responses of PSII photochemistry to heat waves in European beech (Fagus sylvatica L.). Environ. Exp. Bot. 2018, 152, 97–106. [Google Scholar] [CrossRef]
  71. Rütting, T.; Ntaboba, L.C.; Roobroeck, D.; Bauters, M.; Huygens, D.; Boeckx, P. Leaky nitrogen cycle in pristine African montane rainforest soil. Glob. Biogeochem. Cycles 2015, 29, 1754–1762. [Google Scholar] [CrossRef] [Green Version]
Figure 1. Leaf stomatal conductance (gs; (a,b)), transpiration (E; (c,d)), and light saturated net photosynthesis (Asat; (e,f)) of four species (Sp) at five sites (St) along an elevation gradient, measured during wet (a,c,e) and dry (b,d,f) seasons. Error bars show variation (SE) among trees within each species at each site (n = 6). P values for the effects of site (St), species (Sp), and their interaction (St × Sp) are shown in each graph. Significant overall differences among sites are indicated by different letters above the bars of each site. Explanations of site abbreviations are provided in Table 1; the order follows increasing elevation from left to right. Species abbreviations are based on first letters in genus and species: Pf = Polyscias fulva; Mk = Macaranga kilimandscharica; Sg = Syzygium guineense; Cg = Carapa grandiflora.
Forests 09 00647 g001
Figure 2. Water use efficiency (WUE = An/E; (a,b)) and intrinsic water use efficiency (iWUE = An/gs; (c,d)) determined by gas exchange measurements. Data are for four species (Sp) at five sites (St) along an elevation gradient, measured during wet (a,c) and dry (b,d) seasons. Significant overall differences among sites are indicated by different letters above the bars of each site. Explanations of site abbreviations and species names are provided in Table 1 and Figure 1, respectively; the site order follows increasing elevation from left to right.
Forests 09 00647 g002
Figure 3. Intrinsic water use efficiency (iWUE = An/gs) from stable carbon isotope analysis of four species (Sp) at five sites (St) along an elevation gradient. Significant overall differences among sites are indicated by different letters above the bars of each site. Explanations of site abbreviations and species names are provided in Table 1 and Figure 1, respectively; the site order follows increasing elevation from left to right.
Forests 09 00647 g003
Figure 4. Relationship between leaf to-air temperature difference (TleafTair) and photosynthetic photon flux density (PFD) for all species in the wet season of 2017, with data pooled across sites. The slopes of the relationships were markedly different among species according to the ANCOVA test (p < 0.001). Values of TleafTair were standardized to a wind speed of 1 m s−1 (see Materials and methods). Species abbreviations are explained in Figure 1.
Forests 09 00647 g004
Figure 5. Leaf structural traits, wood density (a), and leaf mass per area (LMA; (b)) of four species (Sp) at five sites (St) along an elevation gradient. Significant overall differences among sites are indicated by different letters above the bars of each site. Explanations of site abbreviations and species names are provided in Table 1 and Figure 1, respectively; the site order follows increasing elevation from left to right.
Forests 09 00647 g005
Figure 6. Leaf nitrogen per unit leaf area (Na; (a)), phosphorus per unit leaf area (Pa; (b)), N per unit leaf mass (Nm; (c)), and P per unit leaf mass (Pm; (d)) in four species (Sp) at five sites (St) along an elevation gradient. Error bars represent standard error. Significant overall differences among sites are indicated by different letters above the bars of each site. Explanations of site abbreviations and species names are provided in Table 1 and Figure 1, respectively; the site order follows increasing elevation from left to right.
Forests 09 00647 g006
Figure 7. Nitrogen to phosphorus ratio (N:P ratio) of four species (Sp) at five sites (St) along an elevation gradient. Error bars represent standard error. Significant overall differences among sites are indicated by different letters above the bars of each site. Explanations of site abbreviations and species names are provided in Table 1 and Figure 1, respectively; the site order follows increasing elevation from left to right.
Forests 09 00647 g007
Table 1. Elevation, annual weather, and weather before and during experimental periods at the sites along the elevation gradient. MAT, mean annual air temperature; T day, mean annual daytime temperature; T 1%ile, T 99%ile, the warmest and coldest temperature percentile, respectively; VPD day, mean annual daytime vapor pressure deficit; MAP, mean annual precipitation; PPFD day, annual mean daytime photosynthetic photon flux density; T 10–16 and VPD 10–16, the average T and VPD between 10–16 h during the experimental periods, respectively; P 3 month, the total three-month precipitation before and during the experimental periods; Dry experiment period, 2–30 September 2017; wet periods, 15 February to 21 March 2017 and 24 January to 4 March 2018. Daytime is when PPFD > 2 μmol m−2 s−1. Variation is given as standard deviation between years.
ParameterArboretum (A)Cyamudongo (C)Nyungwe West (N1)Nyungwe East (N2)Bigugu Mountain (N3)
Elevation (m a.s.l.)1700 1850 1950 2500 2700
MAT (°C)19.5±0.217.9 16.2±0.414.3±0.213.3
T day (°C)21.1±0.119.2 18.2±0.515.6±0.214.7
T 1%ile (°C)16.0±0.5 13.3±0.411.7±0.3
T 99%ile (°C)24.1±0.2 20.4±0.318.1±0.2
MAP (mm)979±206 3016±631657±163
VPD-day (kPa)1.02±0.04 0.44±0.060.39±0.09
PPFD day (μmol m−2 s−1)733±25 572±17633±32
Experiment-dry
T 10–16 (°C)23.3 18.6 17.0
VPD 10–16 (kPa)1.48 0.27 0.40
P 3 month (mm)135 309
Experiment-wet
T 10–16 (°C)22.6±0.8 17.8±0.416.9±0.3
VPD 10–16 (kPa)1.27±0.09 0.11±0.010.27±0.01
P 3 month (mm)360±185 499±125
MAT and MAP at A, N1 and N2 are based on 4 years measurement (June 2013–May 2017), except MAP at N2 which was based on 2 years measurement (June 2013–May 2015). MAT at C and N3 are scaled from 6 weeks measurements based on long term studies at neighboring sites.
Table 2. Chemical leaf traits at all sites (mean ± SE).
TraitACN1N2N3Optimal Ratios a
Pa (g m−2)0.156 ± 0.0110.144 ± 0.0260.173 ± 0.0100.163 ± 0.0170.140 ± 0.002
Na (g m−2)2.45 ± 0.1022.13 ± 0.1962.64 ± 0.2032.65 ± 0.2802.42 ± 0.146
Pm (%)0.129 ± 0.0100.142 ± 0.0110.137 ± 0.0060.135 ± 0.0070.126 ± 0.016
Nm (%)2.04 ± 0.1352.09 ± 0.1282.07 ± 0.0332.21 ± 0.1932.19 ± 0.218
N/P (g g−1)16.0 ± 0.49315.6 ± 1.3715.2 ± 0.94817.2 ± 0.98917.7 ± 0.619
P/N (%)6.34 ± 0.1986.72 ± 0.6226.72 ± 0.4476.29 ± 0.4495.83 ± 0.2438–10
K/N (%)29.6 ± 5.2147.8 ± 10.031.6 ± 4.71 39.2 ± 3.2627.8 ± 3.3130–35
S/N (%)12.6 ± 1.508.53 ± 1.9210.7 ± 1.847.88 ± 1.576.99 ± 0.9384
Cu/N (%)0.033 ± 0.0030.035 ± 0.0030.053 ± 0.0050.039 ± 0.0050.034 ± 0.0030.01–0.03
Zn/N (%)0.094 ± 0.0260.123 ± 0.0290.128 ± 0.0470.080 ± 0.0130.060 ± 0.0080.04–0.05
Mn/N (%)3.47 ± 1.482.50 ± 0.8072.82 ± 1.270.926 ± 0.1672.02 ± 0.6960.03–0.05
Fe/N (%)2.99 ± 0.5912.71 ± 0.4992.52 ± 0.3762.92 ± 0.8953.42 ± 0.5530.13–0.2
Ca/N (%)47.8 ± 4.6937.4 ± 3.8435.6 ± 4.4320.1 ± 2.5628.8 ± 7.412–2.5
B/N (%)0.190 ± 0.0630.117 ± 0.0040.090 ± 0.0150.083 ± 0.0140.082 ± 0.0060.05
Mg/N (%)22.0 ± 2.6111.8 ± 1.0314.9 ± 1.3610.3 ± 0.94512.8 ± 3.623.3–5
SPAD55.0 ± 3.6052.9 ± 5.1857.7 ± 5.8356.2 ± 6.9247.9 ± 0.745
a The optimal nutrient ratios are referred to here as those nutrients when all nutrients limit growth simultaneously. The values are given for nutrient to N ratios in leaves and are taken from literature [54,55,56,57,58,59,60,61].

