Article

The Impact of Climate Change and Strong Anthropopressure on the Annual Growth of Scots Pine (Pinus sylvestris L.) Wood Growing in Eastern Poland

by
Robert Kalbarczyk
1,*,
Monika Ziemiańska
1,
Anna Nieróbca
2 and
Joanna Dobrzańska
1
1
Institute of Landscape Architecture, Wrocław University of Environmental and Life Sciences, Grunwaldzka 55, 50-357 Wrocław, Poland
2
Institute of Soil Science and Plant Cultivation, State Research Institute, Czartoryskich 8, 24-100 Puławy, Poland
*
Author to whom correspondence should be addressed.
Forests 2018, 9(11), 661; https://doi.org/10.3390/f9110661
Submission received: 26 September 2018 / Accepted: 16 October 2018 / Published: 23 October 2018

Abstract

:
Changes in annual tree ring width (TRW) and its size depends not only on the changing climate and natural stress factors such as extreme air temperatures, shortages in rainfall and excess rainfall during the growing season, but also on anthropogenic stress, including chemical compounds emitted to the atmosphere or lowering of the groundwater table caused by the operations of plants with high environmental impact. The purpose of this article is to assess the impact of meteorological conditions and anthropogenic factors on the size of annual growth of Scots pine tree-stands in the conditions of the climate of central-eastern Poland. On the basis of five created site chronologies in the vicinity of Zakłady Azotowe Puławy (nitrogen factories in Puławy) and using the moving correlation analysis and multiple regression analysis, a significant influence of temperature and precipitation conditions on the TRW size is proved. A significant, positive influence of air temperature on TRW was proved for the majority of chronologies created in the period of January–March, as well as in June, while it remained negative in May. The wide rings of Scots pines were formed when the precipitation of October and January (prior to the resumption of cambium activity) was lower than the average, and higher in April and in June–August. After including the anthropopressure factors in the regression equations, the description of the variability of the annual tree ring width was corrected. The coefficient of determination ranged from approx. 29% to even above 45% and was higher, on average by 10%, for all studied chronologies of Scots pine compared to the one calculated for constructed equations considering only meteorological conditions. The strength and direction of the impact of the independent variables (SO2, NH3, NOx) analysed on TRW mainly depended on the distance from the plants, as well as on the direction of inflow of industrial pollution to the stands examined. In light of the proven climate changes in central and eastern Poland, the growth conditions of pine stands will most likely deteriorate.

1. Introduction

Growth and development of trees in forest complexes is conditioned by many factors—biotic and abiotic, including, among others: soil and habitat conditions, climate, weather or indirectly dependent on it, gradation of insects and disease occurrence, and the presence of semi-parasites or other species of woody plants [1,2,3,4]. Characterised by high year-to-year and month-to-month variability [5], meteorological conditions determine the secondary growth of trees on average to approx. 30%–40%, and in the years in which extreme weather phenomena occur—even more than twice this percentage [6,7,8,9,10].
Hence, the weather of the present and the previous growing season has a significant influence on the growth and development of coniferous tree species [11]. Thermal and precipitation conditions, which are the most frequently studied, affect the annual ring width of Scots pine wood in an ambiguous, slightly different way in each vegetation year analysed [12,13,14,15,16]. The natural incremental rhythm of tree stands can be disturbed, not only by the observed climate changes, but also by the emission of pollutants, especially from plants, causing a particular nuisance to the environment or changes in the groundwater level [11,17,18,19,20].
The effects of climate change visible in the growth trends of individual tree species translate directly into the production capacity of forest ecosystems [21,22]. Disturbances in changes in solar conditions affect the competition of trees in a given stand, as well as the availability of nutrients consumed by plants [23,24]. In turn, changes occurring in the environment, mainly as a result of anthropopressure, affect short-term incremental wood response to thickness and interfere with the assessment of the impact of meteorological conditions [25]. The width of the secondary annual increments of forest tree species is then one of the indicators used for assessment of the condition of forests exposed to environmental pollution, among others; this involves pollution acidifying the atmosphere, water and soil [24,26]. In secondary annual tree increments, after proper assignment to the calendar, the content of environmental pollution around plants of high nuisance is determined, e.g., by heavy metals or polycyclic aromatic hydrocarbons [27,28,29,30].
Environmental pollution usually increases with the start-up of plants and then uncontrolled breakdowns. It decreases as a result of the introduction of new production technologies, the use of better quality of raw material, the use of modern methods limiting the emission of pollutants into the environment or closure of a given production line, and even the entire plant [28,31]. The course of changes in the annual Scots pine tree ring width, forming near industrial pollution, is characterised by different growth periods: stimulation, inhibition and regeneration [17,19]. Periods of tree growth in thickness depend not only on the amount of industrial emissions, but also on the distance of the emitter, the course of meteorological conditions or the resistance of individual plant species to emission. Annual wood growth of Scots pine stands is also examined in areas covered by the emission of gaseous pollutants, most often within the reach of the influence of nitrogen dioxide, sulfur dioxide, carbon dioxide and carbon monoxide [18,19,20,32]. The aim of the article is to assess the impact of variability of climatic conditions determined by the air temperature and the sum of atmospheric precipitation and the anthropopressure on the secondary growth width of Scots pine wood in the vicinity of the existing Zakłady Azotowe Puławy (nitrogen factories in Puławy), located in central-eastern Poland.
The direct reason for undertaking the research is still little knowledge of the relationship between weather and growth of forest stands under the influence of strong anthropopressure. This is certainly due to the complexity of anthropopressure (including the type of industrial emissions, the type of stand, its sensitivity or the distance of the emission source). Undoubtedly, the difficulty is the incompleteness or accuracy of data, documenting the volume of emissions of chemical compounds introduced into the atmosphere. In the opinion of the authors, any attempt to supplement the knowledge on this subject is needed especially for effective forest management in industrial areas.
Annual growth of Scots pine is conditioned by the course of meteorological conditions in the year preceding the growth and in the current year. Extremely wide and particularly narrow tree rings may be the effect of, among others, the joint influence of meteorological elements and anthropogenic stress affecting trees in the place of their growth.

2. Materials and Methods

2.1. Research Location

The material for dendroecological research was collected from five study plots marked with the following symbols: 85a, 109a, 142d, 116c, 176f. They were located in central-eastern Poland, and according to forest subregion classification, in the Puławy Forest District (Hs ≈ 115 m above sea level) (Figure 1a, Table 1). Scots pine stands were located at a distance of approx. 2.7 km in the N direction to 12.2 km in the E direction, counting from the highest chimney of the heat and power station (demolished in autumn 2016) of Zakłady Azotowe Puławy. Due to the grubbing up of devastated Scots pine stands in the immediate vicinity of the plant, no samples could be taken (Figure 2a).
The study plot, described with 176f symbol and located SW of the plant, was considered as the reference. Scots pine trees growing on this plot were without any signs of trunk curvature and crown deformation. During the analysis of the distribution of study plots, not only the distance from the plants was considered, but the type of forest habitat, the age of the analysed species and a wind rose among others (Figure 1b, Table 1).

2.2. Increment Core Samples

Increment core samples taken at the breast height of Scots pine (Pinus sylvestris L.) were used for the research. In total, 122 Scots pine wood cores were taken from the western sector in June 2016, one per tree, using the Pressler increment borer (Table 1). Scots pines from which the samples were taken grew in the coniferous tree stands on Brunic Arenosol and Albic Brunic Arenosol soils or the ones covered by mosses and berries. In the considered fresh coniferous forests, the level of ground water was within the reach of tree root systems. Each specimen on a given study plot was separately qualified for the study based on the ECO strategy [33], which was not an easy task in the conditions of strong anthropopressure. Therefore, the study also used Scots pine stands with curve trunks and partially deformed tree crowns, with the exception of the reference plot—176f (reference), which was caused by the negative impact of Zakłady Azotowe Puławy (Figure 2b).
The assessment of annual increments of the individual tree rings dated to the calendar years was based on approx. 10,000 data sets (Table 1). After preparation of samples according to the principles used in dendrochronology [34,35], the width of the annual rings was measured with an accuracy of 0.01 mm using the LINTAB™ 6 device and the TSAP-Win software.

2.3. Meteorological Conditions

The monthly average air temperature and the monthly sum of precipitation in the years 1930–2015 were calculated on the basis of data collected from the meteorological station in Puławy (Figure 1a). In turn, the 8-direction wind rose was plotted using data from three stations: Puławy, Grabów and Osinów. The wind rose was used to assess the impact of the spread of pollutants from nitrogen production plants on the surrounding coniferous forest ecosystems, as well as to determine the location of study plots. The climatic conditions of the studied area are shown in the climograph (Figure S1).
The average annual air temperature in Puławy was 8.1 °C and ranged from −3.1 °C in January to 18.9 °C in August. In the years 1930–2015, a significant positive increase in air temperature in five months was proved—namely, in January, March, April, July and August—while the highest was observed in January by 0.34 °C/10 years. The average annual rainfall was only approx. 573 mm, while the largest amount, approx. 81 mm, was found in July. Year-to-year increase in rainfall, as in the case of air temperature, was recorded in January by 1.5 mm/10 years, and in March by 1.7 mm/10 years.

2.4. Aerosanitary Conditions

The study also uses available data on air pollution emissions SO2 (sulfur dioxide), NH3 (ammonia) and NOx (nitrogen oxides) in the years 1970–2015 generated during the production of mineral fertilisers (urea, ammonium nitrate) and chemical compounds (malamina, liquid caprolactam) of Zakłady Azotowe Puławy. SO2 emission in the years of analysis was, on average, 10.9 million t and fluctuated from 24 million t in 1971 to 1.7 million t in 2015 (Figure 3). A high ammonia emission was found in the first half of the multi-year period analysed, in which it fluctuated from 18.5 million t in 1970 to 5.7 million t in 1994, and in the second half from approx. 0.4 million t in 1995 up to 1.2 million t in 2015. This was influenced by the modernisation of almost all production lines and greater environmental care enforced by new regulatory policies. Another temporal distribution characterised NOx emissions compared to SO2 and NH3. The highest emission of this gaseous pollutant was recorded in the years 1980–1996.

2.5. Surface and Underground Water

Data on the amount of surface and groundwater taken from company intakes in 1985–2015 were made available by Zakłady Azotowe Puławy (Figure 4). The amount of surface and underground water used for production in the subsequent years of the 1985–2015 multi-year period was on average approx. 94 and 65 million m3 respectively. In the case of surface water, the variability of the intake was lower than in the case of groundwater, since the intake ranged from approx. 123 million m3 in 1986, up to approx. 66 million m3 in 1998. Underground water in the years 1999–2015 was collected from plant intakes in a 2–3 times smaller quantity, on average it was only approx. 34 million m3, as compared to the years 1985–1998 (approx. 101 million m3).

2.6. Assessment of the Correctness of Dating of Samples Taken and Chronologies Created

The quality of tree-rings was assessed by means of several indicators: overlap ratio (OVL), convergence coefficient (GLK, %), t value (TVBP, TVH) [34,36,37] and cross-data index (CDI), calculated using the TSAP-Win software. Site chronologies (PSO85a, PSO109a, PSO142d, PSO116c, PSO176f) created in ARSTAN software—raw, standard and residual data was described on the basis of several statistical indicators: arithmetic mean ( x ¯ , mm), standard deviation (SD, mm), expressed population signal (EPS), mean sensitivity (MS), as well as autocorrelation Io (AC1) and the correlation coefficient describing the linear trend (r). With the use of ARSTAN software we determined (EPS), a measure of the similarity between a given tree-ring chronology and a hypothetical chronology that has been infinitely replicated from the individual radii included for a specific common time interval [38]. Mean sensitivity is an indicator of the mean relative change between consecutive ring widths and is calculated as the absolute difference between consecutive indices divided by their mean value [34]. The similarity between raw and residual site chronologies was assessed using the Gleichlaeufigkeitswert coefficient (GLK) which is generally accepted to be “percentage of agreement” and the t value at α ≤ 0.05.

2.7. Influence of Meteorological Conditions and Anthropopressure Factors on Annual Wood Increments

The relationship between weather and secondary growth of wood in the period from October of the preceding year to September of the year of formation of annual increments of Scots pine wood in the years common to five site chronologies was calculated, i.e., in the years 1930–2015. The impact of anthropopressure factors on wood radial growth was determined on a yearly basis, in the multi-year periods of 1970–2015 and 1985–2015. The dependent variable was each time a residual chronology (TRW), and the independent variables were meteorological elements, as well as gaseous air pollutants—SO2, NH3 and NOx and the amount of surface and underground water taken from company intakes used in technological processes in the production of fertilisers and chemical compounds. In order to capture year-to-year changes more accurately in the impact of mean air temperature and precipitation sums on the changes in TRW, but only with two chronologies formed from the reference plot (PSO176f) and located SE of Zakłady Azotowe Puławy (PSO142d)—i.e., in the transect with a high, >20% inflow rate of polluted air—A moving correlation was determined with a 30-year time window and a one-year shift.
The moving correlation analysis was also used to determine the year-to-year relationship between all the TRWs analysed and the emission of gaseous air pollutants from the emitters of Zakłady Azotowe Puławy. The total impact of meteorological conditions and anthropopressure factors on TRW was determined using multiple regression, taking advantage of the ridge regression method. The statistical evaluation of regression equations was evaluated using the corrected coefficient of determination (R2 adj., %) and F-Snedecor test.

3. Results

3.1. Annual Increments of Individual Sequences—Quality Assessment and Biometry

Out of 122 cores collected from five study plots, based on statistical indicators (Table 2), 109 samples were positively verified, considering the area of strong anthropopressure. All the statistical indicators confirmed very good adjustment of annual wood increments in all study plots to individual years of the multi-year series analysed. The correctness of the measurements made of annual growth in thickness was first evaluated using graphical compatibility of dendrograms during the measurement. The overlap ratio ranged from approx. 75 for plot 109a to almost 136 for plot 142d.
The convergence coefficient (GLK, %) was high describing the percentage of fragments of incremental curves characterised by the same changes in the total number of common ranges, since it ranged from approx. 72% to almost 78%. The highest value was calculated for plot 116c, farthest from Zakłady Azotowe Puławy. All TVBP and TVH values were at least equal to 6, with the highest value of about 13, was determined for reference plot 176f. Coefficients—cross-correlation and cross-date index—namely a combination of TVBP, TVH and GLK values were from 76 to almost 87 and from 52 to slightly over 79, with the highest values in both ratios of 142d. The specimens (trees) from the study plots were quite varied, as the coefficient of variation calculated for the annual tree ring width of the particular individual sequences (TR, mm) ranged from approx. 42% to almost 63% in the case of sequences with the lowest secondary growth of wood and approx. 63% to almost 100% in the case of sequences with the largest increment (Table 3).
The average TR ranged from 1.05 mm for plot 85a to 2.93 mm for plot 109a, while the standard deviation was from 0.44 to 2.92 mm, respectively. The largest, a 11.89 mm TR, was found on reference plot 176f, and then for 116c (11.62 mm), which is the farthest from the nitrogen production plants. Since it was approx. 46%, annual increments of Scots pine wood found most often were in the range below 1 mm in individual sequences from plot 142d, and the least often were only about 10%—from reference plot 176f.TR—in the range of 1–2 mm observed in approx. 46% (plot 85a) to less than 33% (plot 109a), and in the range of 2–3 mm—from almost 31% (reference plot 176f) to approx. 8% (plot 142d). Compared to the range of 2–3 mm, slightly different distribution of TR frequency was in the range over 3 mm.
Most frequently, large increments of secondary xylem developed in Scots pines growing on the following study plots—109a (approx. 20%) and reference plot 176f (approx. 18%)—least often, even about four times—on plot 142d (only less than 5%). Diameter at 1.3 m height above the ground ranged from 115–150 cm for individual sequences from plot 85a and from 138 to 190 cm—from plot 116c.

3.2. Characteristics of Site Chronologies

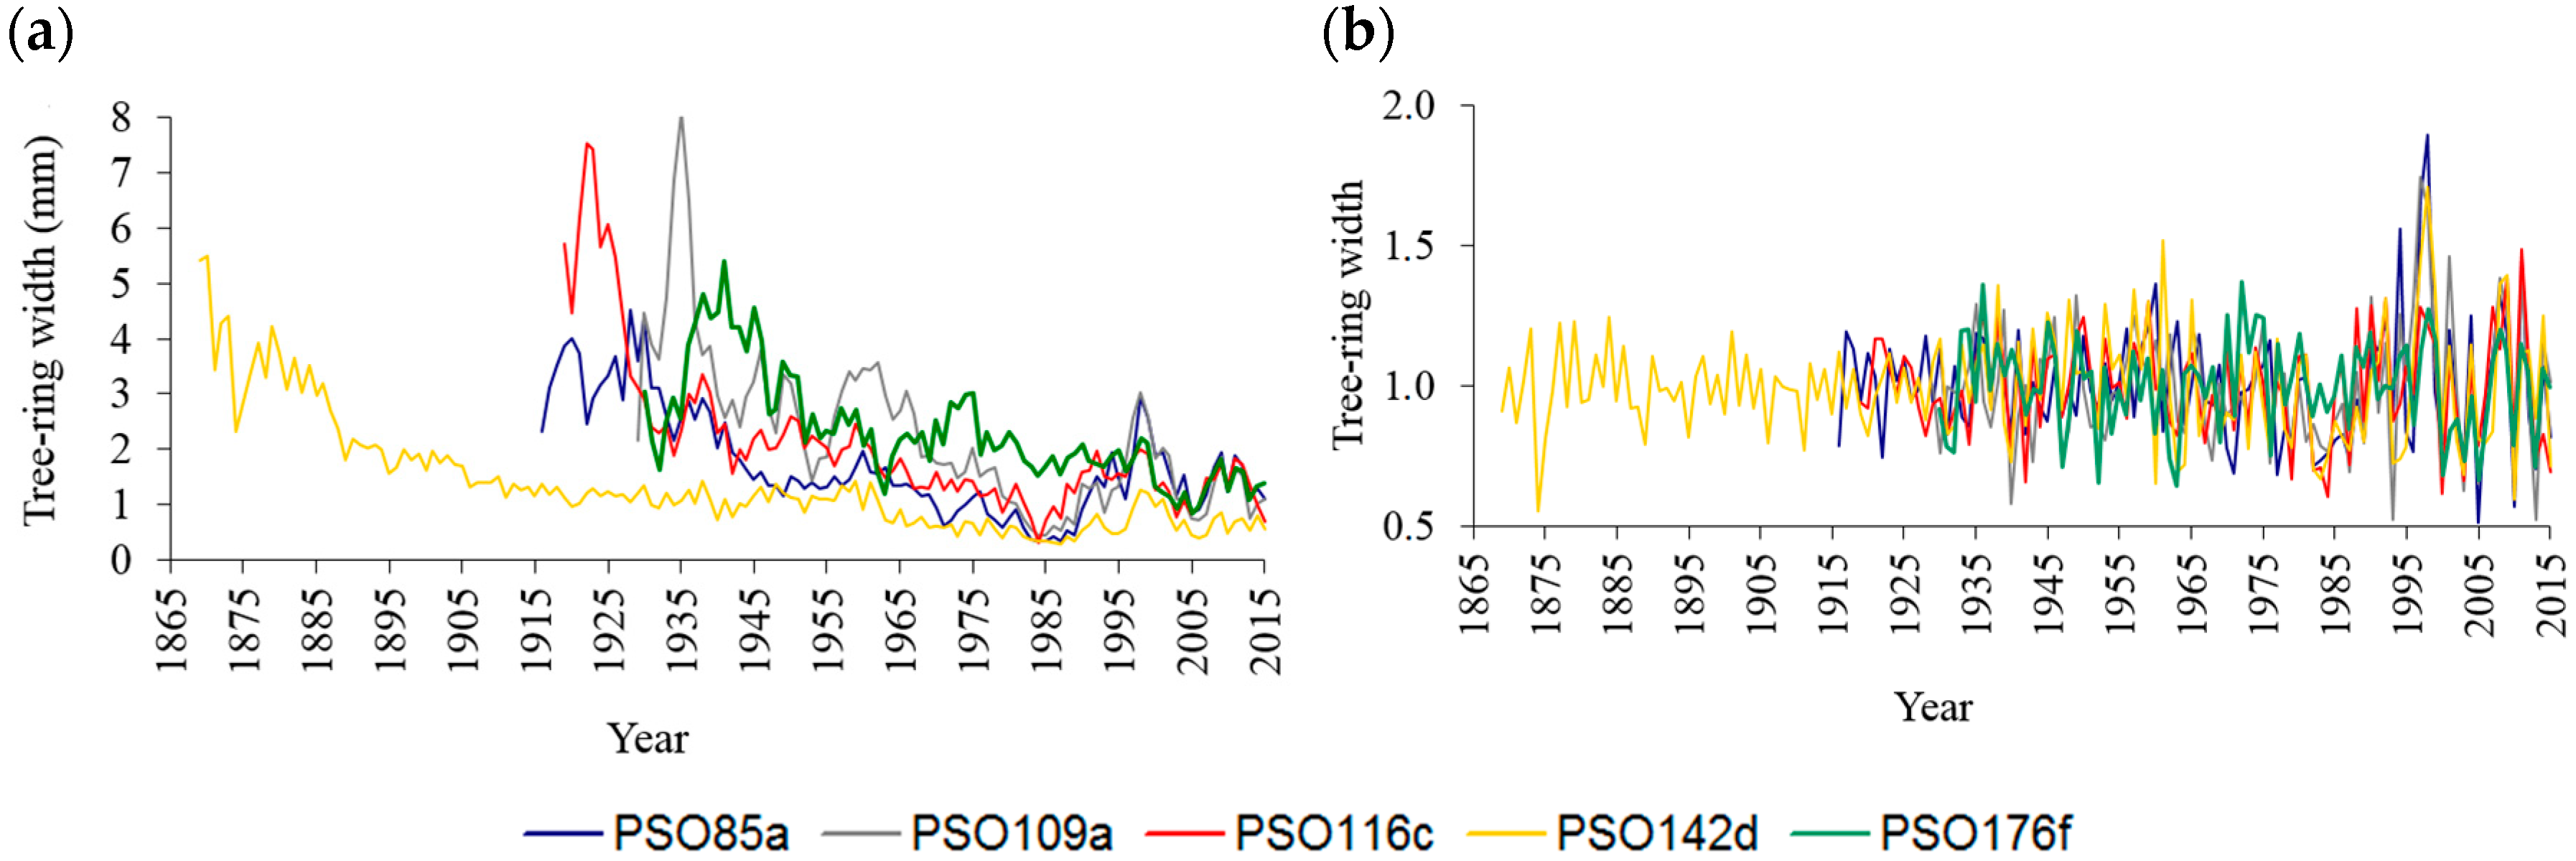
The chronologies created of Scots pine in the form of subsequent annual increments (TRW, mm) on five study plots ranged from 87 to 147 years and lasted from 1869 to 2015 (Table 4, Figure 5). The average annual growth of the formed TRWs ranged from 1.38 to 2.32 mm. The smallest, as expected, was found in the longest chronology with PSO145d code, located southeast of Zakłady Azotowe Puławy.
The largest timber increment was 8.10 mm in PSO109a chronology, and then 7.52 mm in PSO116c chronology; in the other three chronologies, it ranged from 4.51 to 5.49 mm. The smallest variability of annual wood increments was shown by two site chronologies—PSO85a and PSO176f—which were located on the plots, the closest to the plant and the reference one, respectively. The expressed population signal (EPS), used to estimate to what extent the sample represented a hypothetical chronology, was large and little-differentiated, since it ranged from 0.92 to 0.97 in the case of raw chronologies and from 0.84 to 0.92 in residual chronologies.
The mean sensitivity (MS), describing the sensitivity of trees to all factors affecting their growth, was over 1.82% for raw chronologies, over 1.78% for standard ones and over 2.16% for residual chronologies. Of all the chronology types created, the largest MS was calculated for PSO109a site chronology—from 2.11% (standard chronology) to 2.55% (residual chronology).
The autocorrelation analysis showed that the annual wood increments developed in a given year depend significantly on the increments developed in previous years. The first-degree AC was significant, at α ≤ 0.01, for all five site chronologies but only raw and standard ones. Only the residual chronologies allowed one to abandon this dependence. All site chronologies—raw and residual ones—were significantly dependent on each other, at least at α ≤ 0.05 (Table S1).
The GLK index determined for site chronologies ranged from 63% to 77% in the case of raw and from 61% to 86% for residual ones. The t-value index also confirmed the high similarity of the studied chronologies, since it ranged from 3.1 to as much as 12.2; higher values were then determined for raw chronologies. The worst synchronised were PSO85a and PSO176f chronologies, respectively located closest, north of the nitrogen production plants and in the reference plot—south-west of the nitrogen production plants.

3.3. The Dependence of Chronology on the Changes in Meteorological Conditions

In the period from October of the year preceding the formation of annual wood increments in September of the year of annual growth of wood, both air temperature (T, °C), as well as atmospheric precipitation (Rf, mm) affected the size of radial increments of Scots pine ambiguously (Figure 6). In the years 1930–2015, the wide tree ring was promoted by the above-average T in October–March and June, and below the average T in May and in July–September, with the closest relationships proven in January–March and May. The significant T-TRW relationship in February and March was closer for PSO176f reference chronology than for the other four analysed chronologies (PSO85a, PSO109a, PSO116c, PSO142d), located within the reach of strong anthropopressure. Below average precipitation in October–January, March, May and September, as well as above average in February, April and June–August favoured the formation of wide tree rings of Scots pine. The highest values of the correlation coefficient were calculated for the summer, especially the June–July period.
For two chronologies, with the largest and smallest average annual wood increment (Table 4) the dependence of meteorological conditions—TRW in the thirty-year periods was determined (Figure 7).
In the case of reference chronology (PSO176f), air temperature (T, °C) those had a significant, at least at α ≤ 0.1, impact on TRW in February–March in all the years analysed of the surveyed multi-year period, except for years—1978–2007 and 1983–2015. TRW of the reference chronology depended significantly on the air temperature in January, i.e., as for the entire period analysed, but only in the following years: 1961–1992, 1971–2004, 1981–2015. After detailed statistical analysis, it turned out that the size of the annual increments of PSO142d wood chronology was significantly dependent, at least at α ≤ 0.1, on T in February–March—in 1930–1990 (with small breaks), in February—in 1969–2001, 1974–2010, and in December–January—in 1934–1977, in December and in the years 1949–1990. In PSO142d chronology, located south-east of the nitrogen plants, TRW depended significantly and negatively on T in May, but not in the whole analysed multi-year period, as indicated by the correlation analysis presented in Figure 7, but only in the years 1949–1996. Rainfall conditions (Rf, mm), just like air temperature, influenced TRW of the described chronologies differently: PSO176f and PSO142d. Rf in January significantly negatively affected TRW of PSO176f reference chronology only in the years 1971–2005. On the other hand, the significant negative impact of rainfall on the annual tree ring width of the Scots pine wood of PSO142d chronology was proved in the December–January period, whereas in the case of December of the year preceding the formation of tree rings—1968–2015—and in January over the years 1962–2013. Wide annual rings of PSO176f chronology was mainly due to April precipitation in 1941–1972, 1948–2000 and 1975–2008, June precipitation occurred in 1952–2015, July precipitation in 1930–1962, 1961–2000 and August precipitation in 1959–2000 while of PSO142dchronology was mainly due to June precipitation, but only in the years 1931–1961, 1934–1966, 1955–1997 and 1974–2015 (Figure 8).

3.4. Influence of Anthropopressure Factors on the Annual Ring Width of the Chronologies

In the years 1970–2015, a significant relationship was confirmed between TRW and ammonia emission for only two of the five analysed chronologies—PSO109a and PSO176f—reference (Table 5). Here, NH3 emissions affected TRW ambiguously because it had a negative impact on PSO109a chronology and a positive one on PSO176f chronology, which was probably influenced by the distance from the nitrogen production plants’ emitter, as well as the direction of the inflow of gas pollution to the study plots. No significant impact of SO2 and NOx on TRW for any position chronology. The results of the moving analysis of the NH3 emission-TRW relation only partially confirmed the significant dependence determined for the whole surveyed period (Figure 9). NH3 emission significantly and negatively determined the width of the annual secondary increments of PSO85a chronology wood—in the years 1970–2001, PSO109a chronology—in the years 1970–2012, PSO142a chronology—in the years: 1970–2002, 1975–2005, 1979–2009, 1982–2012.
Hence, a significant negative effect of NOx on TRW was proved for PSO85a and PSO109a chronologies in the years 1972–2002, and for PSO142d chronology in the years 1970–2006, 1979–2009 and 1982–2012. We can then observe that SO2 emission had a significant effect, at least at the level of 
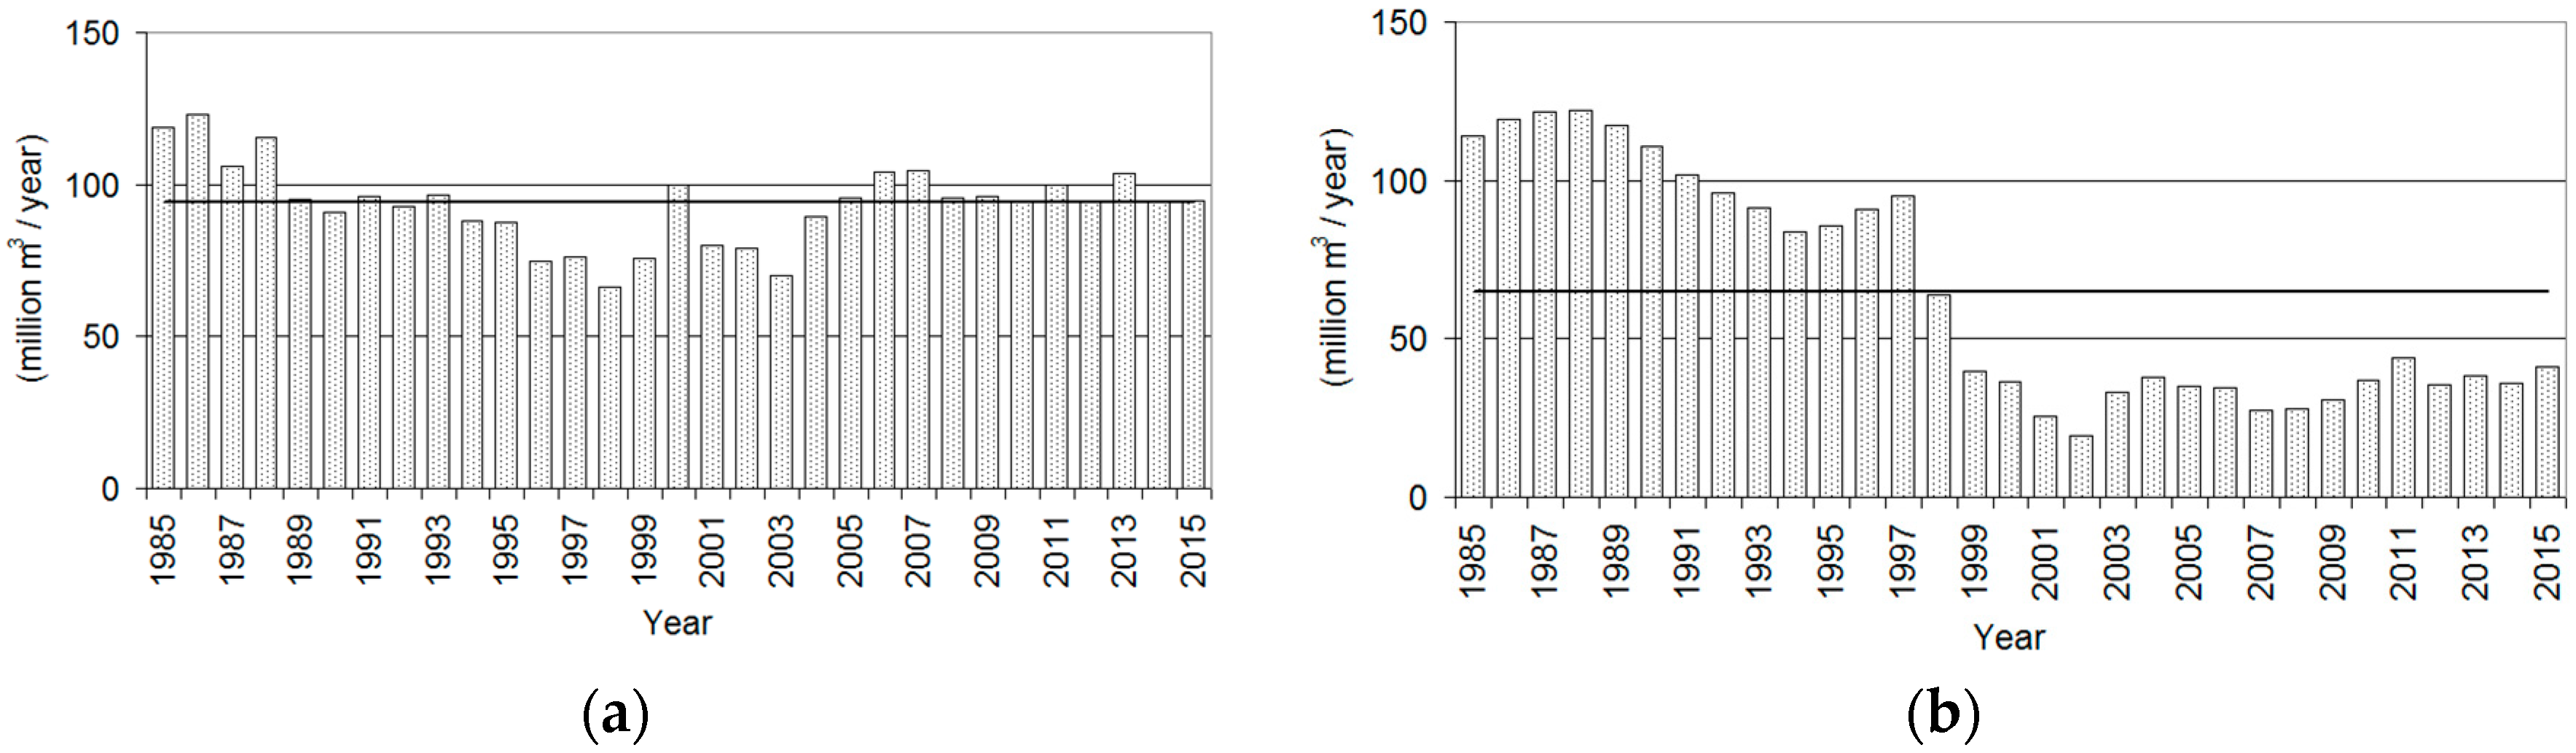
α ≤ 0.1, on the reference chronology in the years 1976–2008 and for PSO116c chronology in the years 1973–2005. In the years 1985–2015, a significant dependence between TRW of Scots pine site chronologies and the annual amount of surface water collected for the production of fertilisers and chemical compounds by Zakłady Azotowe Puławy was proven for the three chronologies located closest to the plants: PSO85a (r = −0.36, α ≤ 0.05), PSO109a (r = −0.41, α ≤ 0.05) and PSO142d (r = −0.40, α ≤ 0.05) (Table 5). However, the correlation between TRW and the annual amount of groundwater used to produce fertilisers and chemical compounds was not confirmed.

3.5. The Combined Effect of Thermal and Rainfall Conditions, as Well as Anthropogenic Factors on Annual Secondary Wood Increments

Meteorological conditions explain the changes in annual wood increments from about 5% to slightly above 32%, with the greatest effect of weather proved for PSO142d and PSO176f (control) chronologies, located south of the nitrogen production plants (Table 6). The weakest reaction to the variability of meteorological conditions was shown by the Scots pine stands forming a PSO85a chronology, as there were only slightly more than 5% of those. The meteorological elements that significantly determined TRW included air temperature in January–March and May when its influence was the opposite, positive and negative, as well as atmospheric precipitation in December–January and June–August. Winter precipitation contributed to decreasing the annual tree ring width of the described tree species (negative impact) and summer precipitation, to increasing this width (positive effect).
Precipitation in June–August significantly affected TRW in all chronologies registered for air temperature in January–March. Four chronologies (except PSO85a) revealed precipitation at the turn of January, three chronologies (except: PSO85a and PSO176f—reference) and air temperature in May—two chronologies (except: PSO85a, PSO109a and PSO116c). All the meteorological elements included in the multiple regression equations were significant at the level of at least α ≤ 0.05, while their direction of impact on the changes in TRW of the chronology studied was consistent with that obtained in the correlation analysis over the entire multi-year period of 1930–2015 (Figure 8).
After inclusion in the multiple regression equations, apart from meteorological conditions, of anthropogenic factors associated with the activity of Zakłady Azotowe Puławy: SO2, NH3, NOx emissions and the amount of surface and groundwater collected for the production of fertilisers and chemical compounds. The description of the variability of residual site chronologies of Scots pine was improved (Table 7). The adjusted coefficient of determination ranged from approx. 29%–30% in the case of PSO85a and PSO116c chronologies to even over 45% for PSO109a.
The trees stand in the reference plot were described by meteorological conditions and NH3 in about 36%, while NH3 emissions had a positive effect on the chronology created. However, it should be noted that the above models were built on the basis of a shorter period because in the long-term period 1985–2015 a lack of data characterised the anthropopressure factors. The growth in the thickness of the forest stands was significant and positively influenced by summer precipitation (Rf6-8) and air temperature in January–March, while the negative influence was associated with air temperature in May.
In the case of PSO116c chronology, the influence of temperature regime was not confirmed. In three site chronologies (PSO85a, PSO109a, PSO142d), the surface water intake had a significant negative effect, and in two chronologies, the farthest from the plants, SO2 and NH3 emissions had a significant positive influence (PSO116c, PSO176f—control).

4. Discussion

The dendrochronological methods used in the study of the reaction of annual tree increments, allow us to determine the impact of variability of meteorological conditions and environmental pollution on tree growth. The changes in growth and development of forest tree species can be assessed, among others, based on the annual tree ring width (TRW), the share of specimens of the same species showing weakening of the incremental potential and the degree of homogeneity of their incremental reactions [12,18,39,40]. The TRW of Scots pine chronology is usually determined by a set of many factors and therefore it is difficult to compare them with the results obtained by other scientists, especially when the created chronologies differ significantly in age and are additionally exposed to strong anthropopressure. The research shows that the emission of air pollutants does not always affect the TRW of a given tree species always in an unfavourable way, which was also demonstrated in the work by the authors of [41]. Low emissions of e.g., nitrogen dioxide and sulfur dioxide, can favourably affect the annual radial increments in moderately and even in intensively contaminated zones [19]. However, the impact of industrial emissions on TRW may vary and depend on, among others, the stage of the life cycle of the described species or the distance and direction of the location of the onerous plant relative to the forest areas studied [27,29]. The most serious damage to the relict Scots pine forests located in the north-eastern part of the Czech Republic can be attributed to chemical synergism (SO2, NOx and O3) and meteorological stress, especially in combination with the long-term occurrence of the drought period [25].
From the research of Wilczyński [18], it follows that the long-term reduction of the radial increment of Scots pine wood in southern Poland occurred in the years 1960–1990 and was most probably caused by industrial pollution. After 1990, when production was limited and plants were shut down as a result of the economic crisis in Poland, the trees began to re-form the wide rings and only then was it possible to distinguish the pointer years. Similar results were obtained by Malik et al. [42] in the Upper Silesian Industrial District (southern Poland).
Furthermore, in the Scots pine stands growing in the vicinity of Zakłady Azotowe Puławy, there were significant reductions since the start of production—that is, from 1966 to 1990—when new legislative provisions aimed at environmental protection were introduced. Over these years, the emission of air pollutants and very large water withdrawal from surface and underground intakes (Figure 4) used in technological processes in the manufacture of, among others, mineral fertilisers and, in addition, the unfavorable weather conditions in some years, were the main reasons limiting the growth of Scots pine wood in thickness. In urban parks, the condition of Scots pine stands is not much different from the state of forests growing outside the city, with a decrease in radial increments of wood observed in the city, which is due to, among other factors, poorer sanitary condition of trees caused by environmental pollution, as is the case with the area of industrial plants [14].
In comparison to other abiotic components of the environment, the climate is characterised by high variability not only in time but also in space [43] and hence significantly affects the pace of life processes in woody plants and chemical reactions in their environment [44,45]. Air temperature and atmospheric precipitation, occurring outside the optimum requirements for Scots pine, often limit the physiological processes of plants, including photosynthesis, respiration and transpiration, which translates into the productivity of stands. Similar to the authors of this article, many scientists have proved a significant influence of meteorological conditions on the changes in annual increments of Scots pine wood in Poland [46,47,48] and other parts of Europe or even the world [7,13,22,49,50]. The dependence between the annual increments of Scots pine wood and meteorological conditions under conditions of strong anthropopression was also proved in this article.
Among the thermal conditions, the strongest, positive influence on the TRW width of the Scots pine growing in Poland has the air temperature in February–March—according to Koprowski et al. [12] and in addition also in December—according to Szychowska-Krąpiec [47]. On the other hand, according to Cedro [46] wide annual radial increments of Scots pine stands are being formed in years in which above-average air temperatures are recorded in January–March and lower than the long-term averages in May; that is, in the thermal conditions that were found in this article. The reasons for the observed dependence of the radial growth of the studied coniferous species on the winter air temperature should be looked for in plant physiology [48].
A frosty winter weakens the pace of physiological processes and especially affects the balance between assimilation and transpiration processes. Soil freezing, which is very likely especially in the absence of snow cover, can lead to the appearance of a physiological drought, which in turn may result in damage to plant tissues [51]. Low winter temperatures inhibit the activity of buds and needles in the production of phytohormones, reducing the efficiency of metabolic processes and xylogenesis [52]. For this reason, the cambium activity not only starts later, but is also less intense and efficient and therefore, the trees produce narrower annual rings.
In Lithuania, it was noticed that the annual growth in thickness of the examined trees increased after 1980 [24]. Faster growth was primarily caused by higher air temperatures in the winter and in the period from May to August, but definitely to a lesser extent, which was also partially proven in central and eastern Poland. In Estonia, in the reclaimed area after open-cast shale mining, it was shown that spring air temperatures contributed to the radial growth of Scots pine, while above average air temperatures occurred in the summer months to the inhibition of wood production [53].
According to the research of Bauwe et al. [13], Scots pine is a species that is resistant to climate change. In the polar and alpine ecotone in Finnish Lapland, the TRW of Scots pine did not respond with wider increments to ever warmer and more humid conditions in the winter period, most likely due to the ubiquitous occurrence of snow cover and strong wind [4]. The influence of low temperatures in the absence of an insulating snow cover on the size of TRW of the characteristic tree species in Finland was also studied by Suvanto et al. [10]. However, researchers from Finland failed to find significant reductions in secondary wood growth associated with the variables studied, including: minimum air temperature and total air temperature < 0 °C in the absence of snow cover. Precipitation is of less significance in the case of the analysed species. According to Cedro [46] and Bijak [48] precipitation had the strongest, positive impact on the radial growth of Scots pine in the summer months, especially in June and July. Furthermore, our results confirmed the significant effect of summer precipitation on TRW was.
From Pärn’s research [17], it follows that precipitation has an increased significance for radial Scots pine growth in dust-contaminated sites. The interaction between location factors, the provenance of stands and climatic conditions often has a significant impact on future results obtained in the weather-TRW analysis and durability of the Scots pine population [2,4,7]. Scots pine’s radial growth, under the conditions of the Mediterranean climate of Spain, depends most on the cold winters and dry summer seasons, as well as on the location and height above sea level [7]. Unusually warm January’s nights determined the formation of wider tree rings in high-lying places and negative water balance, accompanied by high air temperatures in June (low-lying places, ~1400 m above sea level) and in July (high-lying places, ~1900 m above sea level)—formation of narrower tree rings. According to Taeger et al. [2], the TRW of Scots pine stands in Germany depends on the availability of water in the period from May to July, while annual increasements in height occurs in May of the same year.
The reaction of growth and development of the described tree species to drought depends on the time of its occurrence, duration and intensity of drought, as well as on provenance; that is, the ecotypic variation of stands. Scots pine originating from Bosnia and Herzegovina and from Germany was the most resistant to drought in comparison with other provenances. The effect of drought on the annual wood increments of the tree species analysed was also studied by Merlin et al. [23] and Demina et al. [16]. Merlin et al. [23], who drew attention to the growing, negative impact of drought on TRW of Scots pine stands, will occur in the coming decades, due to the increase in the frequency and intensity of drought in several regions of the world, as well as in Poland. The reduction of radial wood growth caused by drought can be partially compensated by the “fertiliser” effect, e.g., by increasing the concentration of CO2 in the atmosphere [41].

5. Conclusions

The established chronologies of Scots pine in five study plots ranged from 87–147 years and lasted from 1869–2015. The average annual secondary growth of trees (TRW) of the created site chronologies ranged from 1.38–2.32 mm. The smallest TRW, as we would expect, was found in the chronology of PSO145d code, located southeast of Zakłady Azotowe Puławy; that is, in the transect of the dominant winds blowing from NW to SE and transferring polluted masses of air (including: SO2, NOx and NH3). The largest TRW, 2.32 mm, was found for PSO176f reference chronology, which confirms the correct selection of the study plot. In PSO176f chronology, the smallest (<1 mm) radial increments developed least frequently because they were only about 10%.
A significant, positive influence of air temperature on TRW was proved for the majority of chronologies created in the period of January–March, as well as in June, while it was negative in May. The Scots pine’s wide rings were formed when the precipitation of October and January (prior to the resumption of cambium activity) was lower than average, and higher in April and in June–August. The thermal and precipitation conditions determined TRW in the shared multi-year period of 1930–2015 from approx. 5% to slightly over 32%; the weakest relationship was then proven in the case of PSO85a chronology, located closest to Zakłady Azotowe Puławy. In the set of meteorological conditions, the strongest, positive impact was visible in the case of rainfall in June–August, which significantly determined all created chronologies, followed by air temperature in January–March, but it only determined four chronologies created.
Negative impact was also confirmed between the residual site chronologies of Scots pine and the annual NH3 emission (only with PSO109a), as well as the annual amount of surface water used to produce fertilizers and chemical compounds by Zakłady Azotowe Puławy (only with PSO85a, PSO109a and PSO142d). In the set of meteorological conditions and anthropogenic factors, a significant positive impact of SO2 and NH3 emissions was proven, but only for one chronology for each type of emission, while a significant negative impact of surface water intake occurred for the three chronologies closest to the Zakłady Azotowe Puławy. In the light of the changing climate in central and eastern Poland, the confirmed air temperature increased in January, in March–April and in July–August, as well as the increase in precipitation sums in January and March, with significant relationships between annual radial increments and meteorological conditions.
Hence, it can be assumed that in the coming years of the growth of Scots pine stands, the thermal conditions in the period prior to the resumption of cambium activity will be conducive to the formation of wide tree rings, and the rainfall conditions would be limiting it. In turn, through the summer season, growth conditions will most likely deteriorate due to the higher air temperatures recorded in July–August and unchanged precipitation volumes occurring at the same time.

Supplementary Materials

The following are available online at https://www.mdpi.com/1999-4907/9/11/661/s1, Figure S1: Climograph (a), as well as the significant, at least α ≤ 0.05, trend (b) of the average air temperature (T) and total precipitation (Rf) for the Puławy station 1930–2015, Table S1: Similarity assessment matrix of raw and residual site chronologies of Scots pine (PSO) by means of indicators—GLK (%) and t-value (given in brackets) 1930–2015.

Author Contributions

R.K. and M.Z. conceived of the presented idea and verified the methods. R.K. wrote this paper. All authors discussed the results and contributed to the manuscript. The study has been performed in collaboration between all the authors.

Conflicts of Interest

The authors declare no conflict of interest.

References

  1. Sangüesa-Barreda, G.; Linares, J.C.; Julio, C. Drought and mistletoe reduce growth and water-use efficiency of Scots pine. For. Ecol. Manag. 2013, 296, 64–73. [Google Scholar] [CrossRef] [Green Version]
  2. Taeger, S.; Zang, C.; Liesebach, M.; Schneck, V.; Menzel, A. Impact of climate and drought events on the growth of Scots pine (Pinus sylvestris L.) provenances. For. Ecol. Manag. 2013, 307, 30–42. [Google Scholar] [CrossRef]
  3. Zeller, L.; Ammer, C.; Annighöfer, P.; Biber, P.; Marshall, J.; Schütze, G.; del Río Gaztelurrutia, M.; Pretzsch, H. Tree ring wood density of Scots pine and European beech lower in mixed-species stands compared with monocultures. For. Ecol. Manag. 2017, 400, 363–374. [Google Scholar] [CrossRef]
  4. Franke, A.K.; Bräuning, A.; Timonen, M.; Rautio, P. Growth response of Scots pines in polar-alpine tree-line to a warming climate. For. Ecol. Manag. 2017, 399, 94–107. [Google Scholar] [CrossRef]
  5. Kalbarczyk, R. Risk of field cultivation of pickling cucumber caused by unfavorable sunshine duration conditions. Sci. Agric. 2011, 68, 326–335. [Google Scholar] [CrossRef] [Green Version]
  6. Schweingruber, F.H. Wood Structure and Environment; Springer: Berlin, Germany, 2007; ISBN 978-3-540-48548-3. [Google Scholar]
  7. Sánchez-Salguero, R.; Camarero, J.J.; Hevia, A.; Madrigal-González, J.; Linares, J.C.; Ballesteros-Canovas, J.A.; Sánchez-Miranda, A.; Alfaro-Sánchez, R.; Sangüesa-Barreda, G.; Galván, J.D.; et al. What drives growth of Scots pine in continental Mediterranean climates: Drought, low temperatures or both? Agric. For. Meteorol. 2015, 206, 151–162. [Google Scholar] [CrossRef] [Green Version]
  8. Misi, D.V.; Náfrádi, K. Growth response of Scots pine to changing climatic conditions over the last 100 years: A case study from Western Hungary. Trees 2017, 31, 919–928. [Google Scholar] [CrossRef]
  9. Nojd, P.; Makinen, H.; Korpela, M.; Hari, P.; Rannik, U.; Sulkava, M.; Hollmen, J. Effects of precipitation and temperature on the growth variation of Scots pine—A case study at two extreme sites in Finland. Dendrochronologia 2017, 46, 35–45. [Google Scholar] [CrossRef]
  10. Suvanto, S.; Henttonen, H.M.; Nöjd, P.; Helama, S.; Repo, T.; Timonen, M.; Mäkinen, H. Connecting potential frost damage events identified from meteorological records to radial growth variation in Norway spruce and Scots pine. Trees 2017, 31, 2023–2034. [Google Scholar] [CrossRef]
  11. Hökkä, H.; Salminen, H.; Ahti, E. Effect of temperature and precipitation on the annual diameter growth of Scots pine on drained peatlands and adjacent mineral soil sites in Finland. Dendrochronologia 2012, 30, 157–165. [Google Scholar] [CrossRef]
  12. Koprowski, M.; Przybylak, R.; Zielski, A.; Pospieszyńska, A. Tree rings of Scots pine (Pinus sylvestris L.) as a source of information about past climate in northern Poland. Int. J. Biometeorol. 2012, 56, 1–10. [Google Scholar] [CrossRef] [PubMed]
  13. Bauwe, A.; Jurasinski, G.; Scharnweber, T.; Schröder, C.; Lennartz, B. Impact of climate change on tree-ring growth of scots pine, common beech and pedunculate Oak in northeastern Germany. IForest Biogeosci. For. 2016, 9, 1–11. [Google Scholar] [CrossRef]
  14. Veselkin, D.V.; Galako, V.A.; Vlasenko, V.E.; Shavnin, S.A.; Vorobeichik, E.L. Relationship between the characteristics of the state of Scots pine trees and tree stands in a large industrial city. Contemp. Probl. Ecol. 2015, 8, 243–249. [Google Scholar] [CrossRef]
  15. Kucherov, S.E.; Vasil’ev, D.Y.; Muldashev, A.A. Reconstruction of May–June precipitation in the territory of Bashkiria based on Scots pine tree-ring data from the Bugulma-Belebey Upland. Russ. J. Ecol. 2016, 47, 115–124. [Google Scholar] [CrossRef]
  16. Demina, A.V.; Belokopytova, L.V.; Andreev, S.G.; Kostyakova, T.V.; Babushkina, E.A. Radial increment dynamics of Scots pine (Pinus sylvestris L.) as an indicator of hydrothermal regime of the Western Transbaikalia forest steppe. Contemp. Probl. Ecol. 2017, 10, 476–487. [Google Scholar] [CrossRef]
  17. Pärn, H. Radial growth response of Scots pine to climate under dust pollution in Northeast Estonia. Water Air Soil Pollut. 2003, 144, 343–361. [Google Scholar] [CrossRef]
  18. Wilczyński, S. The variation of tree-ring widths of Scots pine (Pinus sylvestris L.) affected by air pollution. Eur. J. For. Res. 2006, 125, 213–219. [Google Scholar] [CrossRef]
  19. Stravinskiene, V.; Bartkevicius, E.; Plausinyte, E. Dendrochronological research of Scots pine (Pinus sylvestris L.) radial growth in vicinity of industrial pollution. Dendrochronologia 2013, 31, 179–186. [Google Scholar] [CrossRef]
  20. Sensuła, B.; Opała, M.; Wilczyński, S.; Pawełczyk, S. Long- and short-term incremental response of Pinus sylvestris L. from industrial area nearby steelworks in Silesian Upland, Poland. Dendrochronologia 2015, 36, 1–12. [Google Scholar] [CrossRef]
  21. Spiecker, H.; Mielikäinen, K.; Köhl, M.; Skovsgaard, J.P. Growth Trends in European Forests: Studies from 12 Countries; Springer: Berlin/Heidelberg, Germany, 1996; ISBN 978-3-642-61178-0. [Google Scholar]
  22. Seidling, W.; Ziche, D.; Beck, W. Climate responses and interrelations of stem increment and crown transparency in Norway spruce, Scots pine, and common beech. For. Ecol. Manag. 2012, 284, 196–204. [Google Scholar] [CrossRef]
  23. Merlin, M.; Perot, T.; Perret, S.; Korboulewsky, N.; Vallet, P. Effects of stand composition and tree size on resistance and resilience to drought in sessile oak and Scots pine. For. Ecol. Manag. 2015, 339, 22–33. [Google Scholar] [CrossRef]
  24. Augustaitis, A.; Augustaitienė, I.; Baugarten, M.; Bičenkienė, S.; Girgždienė, R.; Kulbokas, G.; Linkevičius, E.; Marozas, V.; Mikalajūnas, M.; Mordas, G.; et al. Tree-ring formation as an indicator of forest capacity to adapt to the main threats of environmental changes in Lithuania. Sci. Total Environ. 2018, 615, 1247–1261. [Google Scholar] [CrossRef] [PubMed]
  25. Vacek, S.; Vacek, Z.; Remeš, J.; Bílek, L.; Hůnová, I.; Bulušek, D.; Putalová, T.; Král, J.; Simon, J. Sensitivity of unmanaged relict pine forest in the Czech Republic to climate change and air pollution. Trees 2017, 31, 1599–1617. [Google Scholar] [CrossRef]
  26. Feichtinger, L.M.; Eilmann, B.; Buchmann, N.; Rigling, A. Trait-specific responses of Scots pine to irrigation on a short vs long time scale. Tree Physiol. 2015, 35, 160–171. [Google Scholar] [CrossRef] [PubMed] [Green Version]
  27. Ots, K.; Reisner, V. The radial increment and stemwood element concentrations of Scots pine in the area influenced by the Narva power plants in northeast Estonia. Environ. Monit. Assess. 2007, 130, 465–474. [Google Scholar] [CrossRef] [PubMed]
  28. Navrátil, T.; Šimeček, M.; Shanley, J.B.; Rohovec, J.; Hojdová, M.; Houška, J. The history of mercury pollution near the Spolana chlor-alkali plant (Neratovice, Czech Republic) as recorded by Scots pine tree rings and other bioindicators. Sci. Total Environ. 2017, 586, 1182–1192. [Google Scholar] [CrossRef] [PubMed]
  29. Kalugina, O.V.; Mikhailova, T.A.; Shergina, O.V. Biochemical Adaptation of Scots Pine (Pinus sylvestris L.) to Technogenic Pollution. Contemp. Probl. Ecol. 2018, 11, 79–88. [Google Scholar] [CrossRef]
  30. Klink, A.; Polechońska, L.; Dambiec, M.; Białas, K. A comparative study on macro- and microelement bioaccumulation properties of leaves and bark of Quercus petraea and Pinus sylvestris. Arch. Environ. Contam. Toxicol. 2018, 74, 71–79. [Google Scholar] [CrossRef] [PubMed]
  31. Barniak, J.; Krąpiec, M. The influence of industry on Scots pine stands in the Tarnobrzeg area on the basis of dendrochronological analysis. Sylwan 2009, 153, 825–835. [Google Scholar]
  32. Sensuła, B.M.; Wilczyński, S.; Piotrowska, N. Application of dendrochronology and mass spectrometry in bio-monitoring of Scots pine stands in industrial areas. Sylwan 2016, 160, 730–740. [Google Scholar]
  33. Zielski, A.; Krąpiec, M. Dendrochronologia; Wydawnictwo Naukowe PWN: Warszawa, Poland, 2009; ISBN 978-83-01-14226-1. [Google Scholar]
  34. Speer, J.H. Fundamentals of Tree-Ring Research; University of Arizona Press: Tucson, AZ, USA, 2010; ISBN B00GA42F4O. [Google Scholar]
  35. Stokes, M.A.; Smiley, T.L. An Introduction to Tree-ring Dating; University of Arizona Press: Tucson, AZ, USA, 1996; ISBN 978-0-8165-1680-3. [Google Scholar]
  36. Baillie, M.G.L.; Pilcher, J.R. A simple cross-dating program for tree-ring research. Tree-Ring Bull. 1973, 33, 7–14. [Google Scholar]
  37. Hollstein, E. Mitteleuropäische Eichenchronologie; Verlag Philipp von Zabern: Mainz, Germany, 1980. [Google Scholar]
  38. Wigley, T.M.L.; Briffa, K.R.; Jones, P.D. On the average value of correlated time series, with applications in dendroclimatology and hydrometeorology. J. Clim. Appl. Meteorol. 1984, 23, 201–213. [Google Scholar] [CrossRef]
  39. Barniak, J.; Krąpiec, M. The tree-ring method of estimation of the effect of industrial pollution on pine (Pinus sylvestris L.) tree stands in the northern part of the Sandomierz Basin (SE Poland). Water Air Soil Pollut. 2016, 227, 166. [Google Scholar] [CrossRef]
  40. Kalbarczyk, R.; Ziemiańska, M. Identification of meteorological conditions in the growth of Robinia pseudoacacia on the basis of pointer years in urban conditions. Dendrobiology 2017, 77, 33–43. [Google Scholar] [CrossRef]
  41. Martínez-Sancho, E.; Dorado-Liñán, I.; Gutiérrez, M.; Matiu, M.; Helle, G.; Heinrich, I.; Menzel, A. Increased water-use efficiency translates into contrasting growth patterns of Scots pine and sessile oak at their southern distribution limits. Glob. Chang. Biol. 2018, 24, 1012–1028. [Google Scholar] [CrossRef] [PubMed]
  42. Malik, I.; Danek, M.; Marchwińska-Wyrwał, E.; Danek, T.; Wistuba, M.; Krąpiec, M. Scots pine (Pinus sylvestris L.) growth suppression and adverse effects on human health due to air pollution in the Upper Silesian Industrial District (USID), Southern Poland. Water Air Soil Pollut. 2012, 223, 3345–3364. [Google Scholar] [CrossRef] [PubMed]
  43. Kalbarczyk, R.; Kalbarczyk, E.; Ziemiańska, M.; Raszka, B. Assessment of air thermal conditions in the lowland part of South-Western Poland for agriculture development purposes. Atmosphere 2018, 9, 215. [Google Scholar] [CrossRef]
  44. Korpela, M.; Nöjd, P.; Hollmén, J.; Mäkinen, H.; Sulkava, M.; Hari, P. Photosynthesis, temperature and radial growth of Scots pine in northern Finland: Identifying the influential time intervals. Trees 2011, 25, 323–332. [Google Scholar] [CrossRef]
  45. Liang, W.; Heinrich, I.; Simard, S.; Helle, G.; Liñán, I.D.; Heinken, T. Climate signals derived from cell anatomy of scots pine in NE Germany. Tree Physiol. 2013, 33, 833–844. [Google Scholar] [CrossRef] [PubMed]
  46. Cedro, A. Dependence of radial growth of Pinus sylvestris L. from western Pomerania on the rainfall and temperature conditions. Geochronometria 2001, 69–74. [Google Scholar]
  47. Szychowska-Krąpiec, E. Long-Term Chronologies of Pine (Pinus sylvestris L.) and Fir (Abies alba Mill.) from the Małopolska Region and Their Palaeoclimatic Interpretation; Polska Akademia Umiejętności: Kraków, Poland, 2010; ISBN 0015-573X. [Google Scholar]
  48. Bijak, S. Sygnał klimatyczny w przyroście radialnym wybranych iglastych gatunków drzew w Leśnym Zakładzie Doświadczalnym Rogów. Leśn. Pr. Badaw. 2013, 74, 101–110. [Google Scholar]
  49. Hordo, M.; Metslaid, S.; Kiviste, A. Response of Scots pine (Pinus sylvestris L.) radial growth to climate factors in Estonia. Balt. For. 2009, 15, 195–205. [Google Scholar]
  50. Matías, L.; Linares, J.C.; Sánchez-Miranda, Á.; Jump, A.S. Contrasting growth forecasts across the geographical range of Scots pine due to altitudinal and latitudinal differences in climatic sensitivity. Glob. Chang. Biol. 2017, 23, 4106–4116. [Google Scholar] [CrossRef] [PubMed] [Green Version]
  51. Szymański, S. Ekologiczne Podstawy Hodowli Lasu: Poradnik Leśniczego; Państwowe Wydawnictwo Rolnicze i Leśne: Warszawa, Poland, 2001; ISBN 978-83-09-01728-8. [Google Scholar]
  52. Kopcewicz, J.; Kannenberg, K.; Szmidt-Jaworska, A. Zarys Struktury i Fizjologii Drzew Leśnych; Wydawnictwo Wyższej Szkoły Zarządzania Środowiskiem w Tucholi oraz Wydawnictwo Naukowe Uniwersytetu Mikołaja Kopernika: Tuchola/Toruń, Poland, 2012; ISBN 978-83-924457-8-4. [Google Scholar]
  53. Metslaid, S.; Stanturf, J.A.; Hordo, M.; Korjus, H.; Laarmann, D.; Kiviste, A. Growth responses of Scots pine to climatic factors on reclaimed oil shale mined land. Environ. Sci. Pollut. Res. 2016, 23, 13637–13652. [Google Scholar] [CrossRef] [PubMed]
Figure 1. Location of dendroclimatological research (85a, 109a, 142d, 116c, 176f) in the area of Zakłady Azotowe Puławy, located in the Puławy Forest District (central and eastern Poland) (a), wind rose constructed on the basis of data from meteorological stations (METEO): Puławy, Osiny and Grabów for the years 1951–2013 (b).
Forests 09 00661 g001
Figure 2. Landscape after the cleared Scots pine stand which has been devastated (a) and its crooked trunks and deformed crowns (b) formed as a result of the impact of Zakłady Azotowe Puławy.
Forests 09 00661 g002
Figure 3. Emission of gaseous pollutants SO2 (a), NH3 (b), NOx (c) from emitters of Zakłady Azotowe Puławy 1970–2015.
Forests 09 00661 g003
Figure 4. The amount of surface (a) and underground water (b) taken from the intakes of Zakłady Azotowe Puławy used in the production of fertilisers 1985–2015.
Forests 09 00661 g004
Figure 5. Raw (a) and residual (b) site chronologies of Scots pine (PSO) 1869–2015.
Forests 09 00661 g005
Figure 6. Pearson’s correlation coefficient for the relation of Scots pine site chronologies with meteorological elements—mean air temperature (a) and atmospheric precipitation total (b) 1930–2015; P—previous year.
Forests 09 00661 g006
Figure 7. Analysis of the moving correlation for the relation of Scots pine site chronologies—PSO176f (control) (a) and PSO142d (b) with the mean air temperature 1930–2015. Notes: P—previous year. The Pearson’s correlation coefficient at α ≤ 0.1 and for N = 30 is ±0.296, where N is the number of degrees of freedom.
Forests 09 00661 g007
Figure 8. Analysis of the moving correlation for the relation of Scots pine site chronologies—PSO176f (control) (a) and PSO142d (b) with the precipitation total 1930–2015. Notes: P—previous year. The Pearson’s correlation coefficient at α ≤ 0.1 and for N = 30 is ±0.296, where N is the number of degrees of freedom.
Forests 09 00661 g008
Figure 9. The moving correlation analysis for the relation of Scots pine residual chronologies and the emission of gaseous air pollutants SO2 (a), NH3 (b), NOx (c) from the emitters of Zakłady Azotowe Puławy 1970–2015. Notes: The Pearson’s correlation coefficient at α ≤ 0.1 and for N = 30 is ±0.296, where N is the number of degrees of freedom.
Forests 09 00661 g009
Table 1. Taxation description of forest in Puławy Forest District, in which research material in the form of increment core samples was collected and the number of samples taken.
No.Forest Subdistrict/Study Plot No.GPS Coordinates of the Study PlotNumber of Samples/Number of Tree Ring Widths (Items)Distance from the Highest Emitter of Zakłady Azotowe PuławyShare of the Tested Species in the Study Plot (%)Habitat Conditions
Before Cross-DateAfter Cross-Date(km)DirectionForest Habitat TypeType of SoilType of Vegetation Cover
1.Skoki/85a21.980831 E27/228824/19512.7N100BŚW 1Albic Brunic Arenosolcovered by grass
51.482188 N
2.Wronów/109a22.022490 E25/189620/14913.7NE100BMŚW 2Brunic Arenosolcovered with moss-bilberry
51.472847 N
3.Wola Osińska/116c22.147932 E22/204322/204312.2E100BMŚW 2Brunic Arenosolfully covered by grass
51.473380 N
4.Wronów/142d22.028203 E23/313118/24274.1SE100BMŚW 2Brunic Arenosolcovered by grass
51.443829 N
5.Skoki/176f (reference)21.921351 E25/185625/18565.8SW100BMŚW 2Brunic Arenosolcovered by grass
51.419045 N
122/11,214109/9768
Notes: 1 fresh forest, 2 mixed fresh forest.
Table 2. Assessment of the quality of the analysed individual sequences based on the characteristics.
Study Plot No. Characteristics85a109a116c142d176f Control
OVL86.074.692.9135.875.5
GLK (%)76.071.677.975.874.2
CC (%)81.576.078.686.577.6
TVBP7.36.07.79.512.7
TVH7.46.98.89.98.9
CDI60.552.069.079.267.4
Notes: OVL—overlap ratio, GLK—convergence coefficient (%), CC—cross correlation (%), TVBP—t value according to Baillie and Pilcher, TVH—t value according to Hollstein, CDI—cross-dating index.
Table 3. Characteristics of tree rings included in the construction of site chronologies.
Study Plot No.Characteristics (After Verification)TC (cm) *
TR
x ¯ SDMaxVF (%)
(mm) *(%) *<11–22–3>3
(mm)
85a1.05; 2.090.44; 1.702.10; 7.2241.9; 81.329.945.815.78.6115; 150
109a1.07; 2.930.67; 2.923.18; 10.5762.6; 99.729.332.717.720.3120; 169
116c1.48; 2.530.87; 1.804.65; 11.6258.8; 71.120.839.823.116.3138; 190
142d1.06; 1.410.60; 1.293.15; 8.1156.6; 91.546.340.58.44.8135; 166
176f control1.45; 2.750.68; 1.743.25; 11.8946.9; 63.310.240.730.918.1129; 172
Notes: * the smallest and largest values of all individual sequences (trees) from a particular study plot were given. TR—annual tree ring width of individual sequences, x ¯ —arithmetic mean (mm), SD—standard deviation (mm), Max—highest value in the time series (mm), V—coefficient of variation (%), F—frequency (%), TC—trunk circumference at height of 1.3 m above the ground.
Table 4. Statistical characteristics determined for the site chronologies of Scots pine (PSO).
Type of ChronologyThe Period of the Entire Chronology (Number of Years)Characteristics
x ¯ ± SD (mm)Max (mm)EPSMSAC (1)r for the Linear Trend
PSO85a site
raw1916–2015 (100)1.75 ± 0.974.510.972.010.89 3−0.66 3
standard0.99 ± 0.342.350.961.970.73 30.041 ns
residual1.00 ± 0.221.900.922.25−0.0071 ns−0.022 ns
PSO109a site
raw1929–2015 (87)2.25 ± 1.408.100.962.170.89 3−0.71 3
standard0.99 ± 0.352.270.952.110.71 3−0.091 ns
residual1.00 ± 0.241.750.902.55−0.0011 ns0.031 ns
PSO116c site
raw1919–2015 (97)2.11 ± 1.397.520.931.920.901 3−0.71 3
standard0.99 ± 0.241.590.911.890.64 3−0.0077 ns
residual0.99 ± 0.181.490.912.26−0.031 ns−0.029 ns
PSO142d site
raw1869–2015 (147)1.38 ± 1.025.490.921.980.87 3−0.80 3
standard0.98 ± 0.271.900.891.980.61 3−0.055 ns
residual1.00 ± 0.191.710.872.38−0.036 ns−0.0098 ns
PSO176f site/reference
raw1930–2015 (86)2.32 ± 0.985.380.941.820.81 3−0.77 3
standard0.99 ± 0.201.470.941.780.502 30.036 ns
residual1.00 ± 0.171.370.842.16−0.0011 ns−0.046 ns
Notes: EPS—expressed population signal, MS—mean sensitivity, AC (1)—autocorrelation Io, r—Pearson’s correlation coefficient, 3 significant at α ≤ 0.01, ns—insignificant at α ≤ 0.1, other explanations as with Table 2.
Table 5. Significant dependence between residual site chronologies of Scots pine and the annual emission of gaseous air pollutants, as well as the annual amount of surface and groundwater collected for the production of fertilisers by Zakłady Azotowe Puławy.
ChronologyPollutants (1970–2015)Water (1985–2015)
SO2NH3NOxSurfaceUnderground
(mln t/Year)(mln m3/Year)
PSO85a −0.36 2
PSO109a −0.25 1 −0.41 2
PSO116c
PSO142d −0.40 2
PSO176f control 0.28 1
Notes: 1 significant at α ≤ 0.1, 2 significant at α ≤ 0.05.
Table 6. Total influence of meteorological elements on residual site chronologies of Scots pine 1930–2015.
ChronologyRegression EquationStatistical Evaluation
InterceptCoefficients
T1-3T5Rf12-1Rf6-8R2 adj.F
(°C)(mm)
PSO85a0.78 1 0.00097 15.35.8
PSO109a0.87 10.00909 1 −0.0021 10.0013 127.611.8
PSO116c0.86 10.00702 1 −0.0012 20.00107 125.59.2
PSO142d1.32 10.0088 1−0.031 1−0.00209 10.0012 132.311.2
PSO176f control1.061 10.0086 1−0.016 1 0.00086 229.212.7
Notes: 1 significant at α ≤ 0.01, 2 significant at α ≤ 0.05; T1-3—air temperature in January–March (°C), T5—air temperature in May (°C), Rf—total precipitation at the turn of January (mm), Rf—total precipitation in June–August (mm), adjusted coefficient of determination (R2 adj., %), the F-Snedocor test.
Table 7. Total influence of meteorological elements and anthropogenic factors related to the activity of Zakłady Azotowe Puławy for residual site chronologies of Scots pine 1985–2015.
ChronologyRegression EquationStatistical Evaluation
InterceptCoefficients
T1-3T5Rf12-1Rf6-8SO2NH3NOxSWGWR2 adj.F
(°C)(mm)(Million t/Year)(Million m3/Year)
PSO85a2.091 30.012 2−0.059 1 0.0019 2 −0.0066 2 29.54.2
PSO109a1.95 30.0107 2−0.054 1 0.0027 2 −0.0077 2 45.27.2
PSO116c0.41 2 0.0016 20.000025 2 28.95.7
PSO142d2.209 3 −0.062 2 0.0021 3 −0.0082 3 38.07.1
PSO176f control0.69 30.0107 3 0.0011 3 0.000015 2 36.36.7
Notes: 1 significant at α ≤ 0.1, 2 significant at α ≤ 0.05, 3 significant at α ≤ 0.01, SW—surface water, GW—groundwater. Other explanations: see Table 6.

