Article

Tree-Ring Growth of Larch (Larix decidua Mill.) in the Polish Sudetes—The Influence of Altitude and Site-Related Factors on the Climate–Growth Relationship

Faculty of Geology, Geophysics and Environmental Protection, AGH University of Science and Technology, al. Mickiewicza 30, 30-059 Krakow, Poland
*
Author to whom correspondence should be addressed.
Forests 2018, 9(11), 663; https://doi.org/10.3390/f9110663
Submission received: 13 August 2018 / Revised: 14 October 2018 / Accepted: 22 October 2018 / Published: 24 October 2018
(This article belongs to the Section Forest Ecology and Management)

Abstract

:
In this paper, the first study of a regional character on the influence of climatic factors on the tree-ring growth of European larch (Larix decidua Mill.) growing in the Polish Sudetes is presented. The obtained results indicate the relatively high diversity of the climatic signal observed in the tree rings of larches growing in the Sudetes. The most significant differentiating factor is altitude. The results suggest that the possible influence of local conditions (e.g., summit proximity, soil and bedrock characteristics, and exposure to strong winds) could also be of importance. A positive relationship between tree-ring growth and May temperatures was noted throughout the area; this indicates the principal importance of thermal conditions during the initial stage of cambial activity and tree-ring formation in larches from the Sudetes. The negative effect of the temperatures in the previous summer upon the tree-ring growth of larch in the subsequent year was also observed. The studies also indicate the negative influence of the water stress in summer (particularly in July of the previous year) upon the growth of trees. The negative relationship between tree-ring growth and the previous November temperature could be explained by the need for a late-autumn cooling, which affects the development of assimilation apparatus in spring of the subsequent year, which indirectly affects the tree-ring growth in the same year.

1. Introduction

Climatic changes are very well-documented in Europe ([1] for review). The changes are reflected in forest ecosystems where a number of processes positively or negatively affecting growth, mortality, and forest species distribution have already been observed [2,3,4,5]. Mountainous areas, including their forest ecosystems, are particularly exposed to the recent changes in climate [6,7]. Therefore, studying the relationships between climatic factors and the growth of forests is critical for forecasting the future changes they could undergo. Scenarios based on such studies can be then used as a basis for long-term management strategies and for applying suitable forestry practices [5,8,9,10].
Climate can be a principal factor that limits the growth of trees. Tree-ring analysis makes it possible to study the impact of climatic factors upon the growth of trees. Analysis of the climate–growth relationship permits identification of the factors that most limit annual growth. The tree growth response to climatic factors reflected in the variable width of annual growth rings depends on a great number of factors. Apart from the specificity of a given species, the local conditions in which a tree grows are of importance [11] as they can greatly enhance or weaken the response of trees to climatic factors. A remarkable variability in site conditions occurs in mountainous regions. These conditions are a mixture of effects with variable scales, including those of a more local nature (e.g., altitude, slope aspect, slope inclination, land form), and those of a more regional character (e.g., the types and directions of incoming air masses). The great variability of land forms also affects the dynamics of particular climatic factors in mountainous areas. In order to better understand the tree growth response to climatic factors in such changeable and dynamic environments, regional studies (analysis in large scale networks) are needed to identify and research factors of both a regional and local nature.
Studies on the relationship between climatic factors and tree-ring growth in the European larch pertain chiefly to the region of the Alps, as this is the principal place of its occurrence. Most of these studies concern trees growing at high altitudes because this is the common habitat of this species in the Alps. The studies investigate diverse subjects associated with the climate–growth relationship, including factors that modify the response of trees to climatic factors [12,13,14,15,16,17,18,19,20], with some of them being of the regional type, i.e., [14,15,18,19,20]. The results provide information on the effect of site and altitude on the response of trees, which is very valuable for forecasting and assessing the effect of climatic changes on the forest ecosystems in these mountains.
Studies on larch growing at lower altitudes or in other mountain regions are less common. In the mountains situated north of the Alps (the Sudetes and the Carpathians), larch usually grows at relatively low elevations in the forests of the foothills and in the lower montane zone. In more elevated sites, it is only found in the Tatra Mountains—the highest part of the Carpathians. For the Carpathians, a regional study on the tree-ring growth of larch was recently performed [21]. There is a lack of studies of this type in the Sudetes (the mountain chain situated west of the Carpathians), even though the proportion of larch in the composition of this forest area is much higher than in the Carpathians (approx. 10% of the area, [22]). Although this species occurs chiefly in a mixture with other species (e.g., spruce, beech, pine, fir), it is a valuable component in forests there, having a great importance to the forest economy of the area because of its fast growth, the high quality of its wood, and its resistance to air pollution [23,24,25,26]. Because of its vulnerability to drought, larch can be greatly affected by the adverse impact of the recently observed temperature increases [16,17]. For this reason, identification of the most important climatic factors that limit the growth of larch in the Polish Sudetes, as well as the determination of how local site conditions modify the climate–growth relationship, seem to be enormously important with respect to forest management activity.
This paper presents the results of studies concerning the influence of climatic factors on the tree-ring growth of European larch growing in the Polish Sudetes. The climatic factors of particular importance to the growth of larch in the area were determined. It is the first study of a regional character on this species in the Sudetes. The aim of the study was to assess the spatial diversity of the climatic signal present in the tree rings of larch in the study area and to investigate its relation with altitude, morphology, and other local factors (e.g., summit proximity, soil, and bedrock characteristics).

2. Materials and Methods

2.1. Study Area Characteristics and Site Locations

The study area was situated in the Polish part of the Sudetes. This mountain range is one of the medium-elevation mountain ranges of Europe and extends for approx. 300 km. The highest part of the Sudetes is the range of Karkonosze (at 1602 m a.s.l., Śnieżka is its highest summit). The geological structure of the Sudetes is of a mosaic nature, both in terms of lithology and structure [27]. These are old mountains that have folded and upthrusted several times; as a consequence, the Sudetes have the form of a complicated horst-and-graben structure, elongated from NW to SE [27,28]. The geological structure is reflected in the highly diverse land relief. There are prominent massifs (e.g., Karkonosze); long, narrow ranges; solitary cupolas; inselbergs; table mountains; and monadnocks. A lithological feature of the Sudetes is the rare and area-limited occurrence of carbonate rocks (igneous and metamorphic rocks predominate). This results in highly acidic soils and rapid leaching [28].
The climate of the Sudetes is characterized by typical mountain climate features: spatial diversity related to altitude and topography. With increased altitude, precipitation, snow cover duration, insolation intensity, and wind speed all increase. At the same time, temperatures and temperature amplitudes decrease, and the growing season shortens. Higher temperatures and often lower precipitation are observed in mountain basins, along with temperature inversions and the rain shadow effect. The highest temperatures and precipitation occur in the month of July (the average temperature is 16.5 °C in Jelenia Góra, 15.6 °C in Karpacz and 8.7 °C at Śnieżka summit; the average precipitation totals are 107, 144 and 146 mm respectively, Figure 1). The coolest month is January (the average temperature is −2.1 °C in Jelenia Góra, −1.9 °C in Karpacz and −6.7 °C at Śnieżka summit, Figure 1). The minimum precipitation is observed in February, but generally, the whole winter season (December–March) has low precipitation. The greatest amounts of precipitation are found in the highest parts of the Karkonosze, the Izerskie Mountains, and the Orlickie Mountains (more than 1400 mm per year); the lowest (700–800 mm) are recorded in the foothills and in intermountain basins (600–700 mm). The eastern part of the Sudetes receives less precipitation than the western part due to the influx of more humid air masses from the western and north-western directions [28]. In the highest parts of the Sudetes (Karkonosze, Izerskie Mountains), the balance of precipitation is also significantly affected by fog [29]. The duration of the growing season ranges from 100 days in the upper parts of the mountains to 200–220 days in the foreland [30]. The prevailing winds blow from the southwest. A characteristic feature of the Sudetes is foehns, which are predominantly dry and warm winds that blow from the southwest, most often between August and April (particularly in autumn and early spring; [28]).
In the Sudetes, sites where European larch (Larix decidua Mill.) grows naturally are only known from the lower montane forests of the Eastern Sudetes; it represents the Sudetes variety (Larix decidua subsp. decidua var. sudetica (Domin) Svoboda) [31]. The present, fairly wide occurrence of the species in the Sudetes is chiefly a result of planting, which has been carried out there since the mid-17th century. Initially, the seeds of the aforementioned Sudetian variety, adapted to the local conditions, were used. Since the mid-19th century, increased amounts of cheaper European larch seeds from the Central Alps have been used that were unchecked with respect to origin. As a result, forests where seeds from high mountain Alpine locations were used suffered enormous losses: 90% of forest stands aged 20–50 years were attacked and destroyed by wood cancer. A sanction was introduced on the use of seeds of Alpine origin in Poland due to concerns regarding their inability to adapt to local conditions [32]. Forest tree stands with larch occur in the Sudetes within the foothills and in the lower montane forest zone, which reaches up to 1000 m a.s.l. It grows principally in mixed stands with beech, fir, and spruce.
The study sites were situated in the western, central, and eastern parts of the Sudetes. The largest number of locations were placed in the Karkonosze, which is the greatest and highest solid massif within the Sudetes (Figure 1). The sites were situated at elevations ranging from 325–930 m a.s.l., which corresponds to the foothills (up to 400/500 m a.s.l.) and the lower montane forest zone which, in the Sudetes, reaches up to 1000 m a.s.l. In the Sudetes, as mentioned above, larch does not occur in the upper montane forest zone.

2.2. Construction and Characteristics of Site Chronologies

In each of the 21 locations, samples were taken from 14 to 21 trees of a similar age (Table 1). From each tree, two cores were taken at breast height (approx. 1.3 m above the ground level) using a Pressler borer. The cores were taken in the direction parallel to the slope. Exceptions included locations zd1, sn1, and ls1, where single cores were taken from some trees (these locations were situated on flat or nearly flat ground (Table 1)). In all, 739 samples were taken. Suitably prepared samples were cut with a preparatory knife to reveal the anatomical structure of the tree rings. The measurements of tree-ring widths were made with the use of the LINTAB™ 6 tree-ring measurement system with TSAP-Win™ Professional software (4.69k, RINNTECH, Heidelberg, Germany). Some of the measurements were done on scans using CooRecorder software (Cybis Elektronik & Data AB, Saltsjöbaden, Sweden). The tree-ring growth series obtained were compared visually, correlated, and dated with the use of Quercus software (06.01, AGH-UST, Krakow, Poland; [34]) and COFECHA software (6.06, Tree-Ring Lab (TRL) and Columbia University, New York, NY, USA). Next, the site chronologies were constructed, including the best-correlated tree-ring series within a given location (Table 2). The chronologies were based on the biweight robust mean. Prior to standardization, in order to stabilize variance and decrease the difference in variation between particular parts of a given tree-ring series, each tree-ring series was subjected to data-adaptive power transformation. This operation stabilizes variance and mitigates differences in variability between parts of the tree-ring series [35]. In the standardization process of the tree-ring series, double detrending was used. In the first stage, an exponent or regression line was fitted to each tree-ring series. In the second stage, a cubic smoothing spline with a 50% frequency response cut-off equal to two-thirds of the series length was applied [36]. The last of the applied methods eliminates the long systematic disturbances sometimes seen in tree-ring series after the first stage of detrending; these are caused by disturbances that change the environment in which trees grow (e.g., fires, windstorms, disease and insect infestations [37,38]). The further analyses used the residual versions of the constructed chronologies, i.e., in which the autocorrelation was removed in order to highlight the high-frequency variability. Residual versions are most often used in analyses of the climate–growth relationship [39] as they usually show higher correlations with climatic factors than the standardized versions; this is particularly important for chronologies from lower elevations due to the increasing influence of non-climatic factors (cf. [40]). Table 2 presents the descriptive statistics for the 21 site chronologies constructed. The mean sensitivity (MS) and the first-order autocorrelation (AC) pertain to the year-by-year variability. The mean sensitivity is the relative difference between the subsequent ring-width indices, which is an indicator of the occurrence of high-frequency variance in chronology. The first order autocorrelation determines the relationship between the index value in a given year and that in the previous year (cf. [41]). Two more parameters, i.e., the mean inter-series correlation (mean Rbar) and Expressed Population Signal (EPS), help to determine the common variance (mean Rbar) and signal strength (EPS) of the chronology [42].

2.3. Climate Data

The study used climatic data from the Climate Research Unit. Average monthly temperatures and monthly precipitation totals derived from the CRU TS 4.01 dataset, for the years 1901–2016 in a 0.5° grid [43], were used. The advantage of this dataset is the relatively long period (1901–2016) it covers. The applicability of gridded data for the study area was additionally checked by comparing them with data available from meteorological stations situated within the study area. The analyses were based on temperature data from five stations and precipitation data from 14 stations. The comparison was made for the common period, i.e., 1951–2014 (in two instances that period was shorter, covering the years 1956–2014 and 1957–2014). The similarities of the time series were analyzed with the use of Pearson’s correlation coefficient and the L1-norm dissimilarity measure. The linear correlation indicates the agreement between the directions of the analyzed time series. The obtained correlation values show good similarity between the gridded data and the weather station data. The mean value of Pearson’s correlation coefficient for the monthly mean temperature was 0.98, and for the monthly precipitation total it was 0.82. The values of the calculated L1-norms indicated fairly small differences between the gridded data and those obtained from the weather stations. The lowest correlation values and relatively high L1-norm values were obtained for the Śnieżka station, which is situated much higher (1602 m a.s.l.) than any of the other weather stations and also much higher than the analyzed larch sites (Table 1). The results of the conducted analysis, as described in more detail in [44], demonstrated the major similarity of gridded and weather station data with respect to the observed trends and values; therefore, their applicability within the study area was confirmed.

2.4. Regional Patterns of Common Variation among Site Chronologies

In order to study the climatic signal variation in the tree rings of larches in the study area, the constructed residual chronologies were subjected to Principal Component Analysis (PCA, [45]) with a matrix of covariance. PCA is a statistical procedure that uses an orthogonal transformation to convert a large set of observations of correlated variables into a set of values of linearly uncorrelated variables called principal components (PCs). The aim of the analysis is to reduce the dimensions, and to present the observation in a dimension-reduced variables set that still contains most of the information [45]. In order to have greater readability, and, by the same token, improved interpretation value, PCs obtained in the PCA analysis were subjected to Varimax rotation [46]. The rotation was performed using only components whose proportion in the observed variation was at least 5% (cf. [47,48]). The analyses were carried out for the common period of the chronologies (1925–2010). The year in which the replication of each chronology reached the level of five trees was adopted as the start of the analyzed period (cf. [15,49]). The results of the PCA analysis also served to separate groups of chronologies characterized by the greatest similarity. The grouping was conducted on the basis of the first three components (PCs), using k-mean clustering with cross-validation.

2.5. Climate Influence on Tree-Ring Growth

In order to study the relationship between climatic factors and the tree-ring growth of larches within the study area, the residual site chronologies were correlated with the climatic data (average monthly temperatures and monthly precipitation totals) in DENDROCLIM 2002 software [51]. The analysis was conducted for the period from May of the year preceding the tree-ring growth to September of the year of tree-ring formation. Taking into account the markedly longer time period covered by the gridded data (1901–2016) compared with the data available from stations (1951/56–2014/17) and the fairly good correlations between them in trends and values (see Section 2.3), the CRU TS 4.01 gridded data [43] were used to study the climate–growth relationship. The analysis was done for the 1925–2010 period.
Of the correlations obtained for particular months, those that met the spatial replication criterion [52] were selected. The replication criterion was calculated with the use of binomial distribution with n = 21 (number of sites) and a cut-off probability of 0.997. The probability was determined using Bonferroni adjustment (0.003), calculated from the ratio of the level of significance (p = 0.05) to the number of climatic variables (17 months for each climatic factor). The application of spatial replication criterion allowed identification of the climatic factors that are most likely to be associated with the tree-ring growth of larch within the study area. A given climatic factor met the aforementioned criterion of replication when statistically significant correlations with the same sign (plus or minus) were obtained for at least four sites.
The results of the climate–growth relationship analysis suggested that the possible effect of drought in the summer season upon the tree-ring growth of larch should be checked. As a drought indicator, SPEI (Standardized Precipitation–Evapotranspiration Index) was used. SPEI is a simple index of multi-scale drought which combines precipitation and temperature [53]. One-month SPEI values calculated for subsequent months were correlated with the site chronologies in DENDROCLIM 2002 [51]. The analysis was done for the same common period as used in the climate–growth relationship analysis.

3. Results

3.1. Characteristics of the Chronologies

The age of almost all constructed site chronologies exceeds 100 years—only three are slightly younger (sw2—92 years, sp1—98 years, and ba2—99 years, Table 2). The chronology of zd2 is the oldest at 177 years. The average growth rate (AGR) ranges from 2.547 to 1.009 mm. The differences in the average growth rate among the analyzed sites seem to be chiefly related to the age of larch stands and the impact of the age-related trend. The highest values were obtained for the youngest tree stands (sites sw2, sp1, and ba2). An additional effect of altitude is also possible because low values of AGR were obtained for the tree stands in higher locations, while for tree stands of a similar age or even older but situated significantly lower (sites ls1, zd1, and zd2), these values were clearly higher (Table 2). The lowest AGR was found in site sn1, which was situated in an exposed place (near the summit), i.e., very exposed to wind. The values of the first order autocorrelation coefficient (AC) obtained for the constructed chronologies, ranging from 0.61 to 0.77, indicate the importance of biological memory. This part of the signal was mostly eliminated in the standardization process. For the majority of the indexed versions of the constructed chronologies, the value of mean sensitivity (MS) stays within the range 0.2 to 0.3 (the value was 0.19 only for two chronologies, Table 2). In terms of the usefulness of these chronologies in dendroclimatological studies, these are mean values (high and low mean sensitivity are denoted by values of more than 0.3 and less than 0.2, respectively; cf. [54]). The majority of correlation values between the series (mean Rbar) obtained for chronologies are relatively high (cf. Table 2, range of values: 0.39–0.61), similar to the EPS values (0.93–0.98, Table 2), which indicates good signal strength in the constructed chronologies.

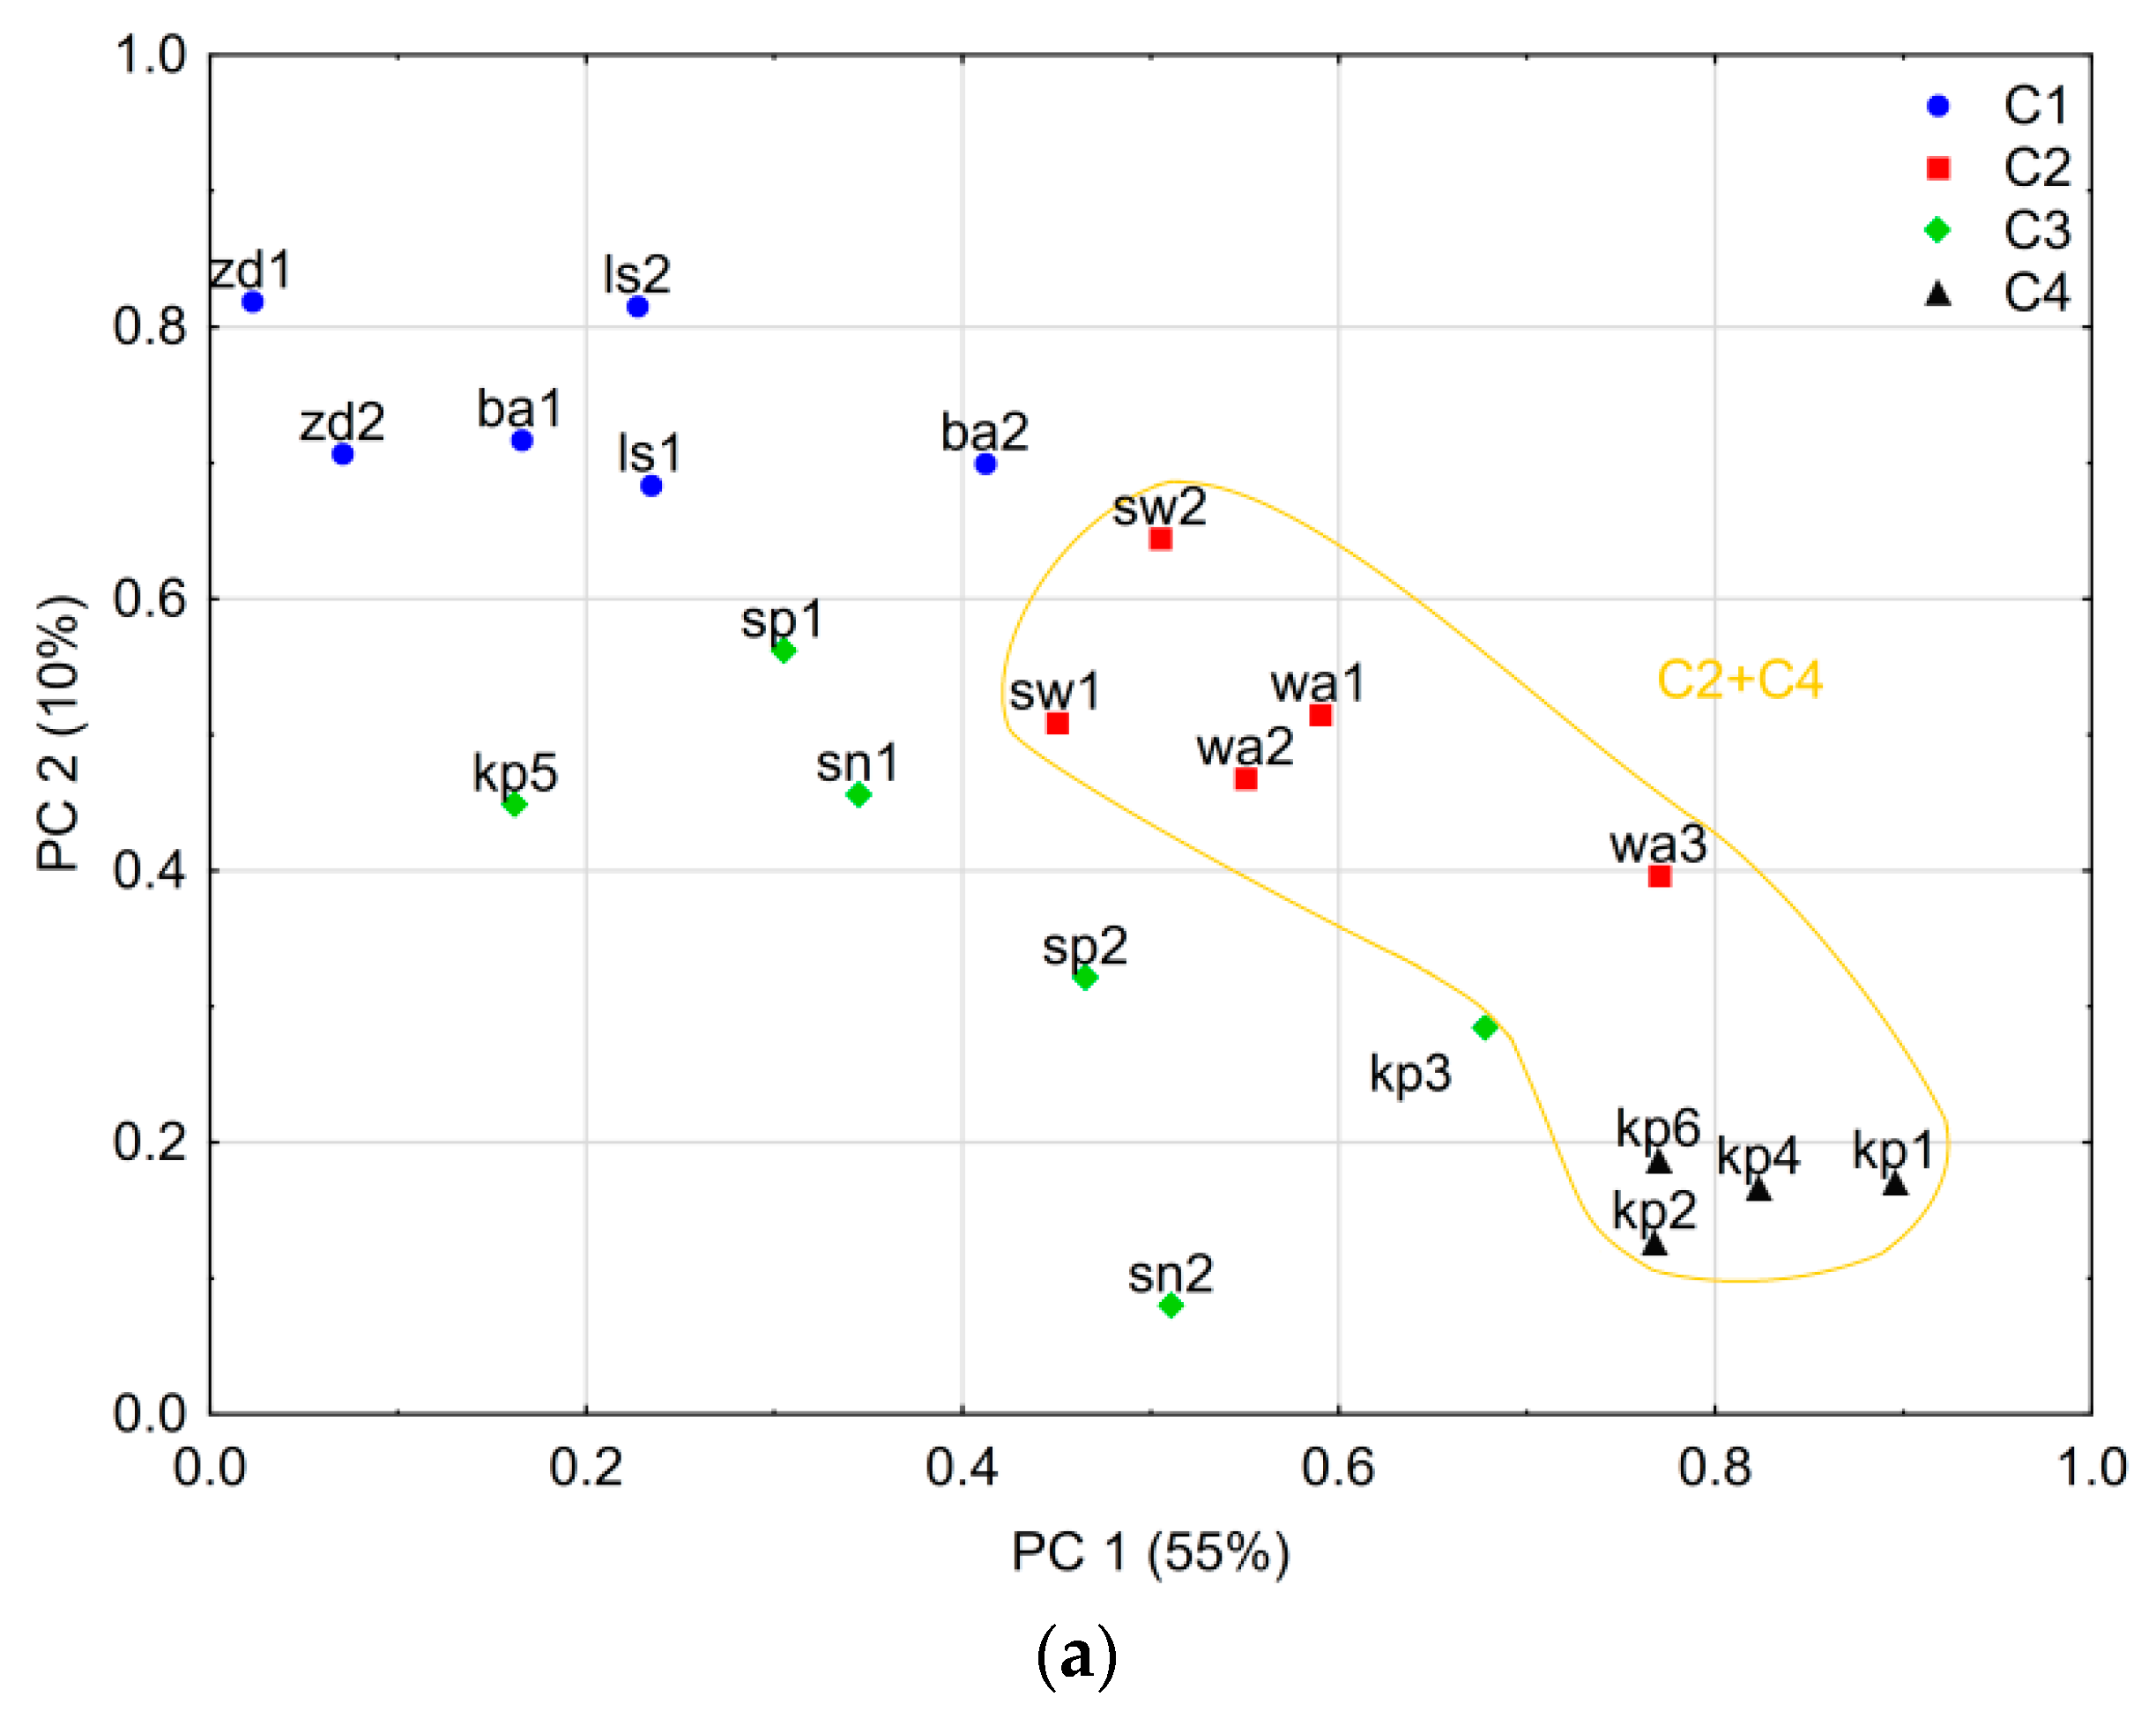
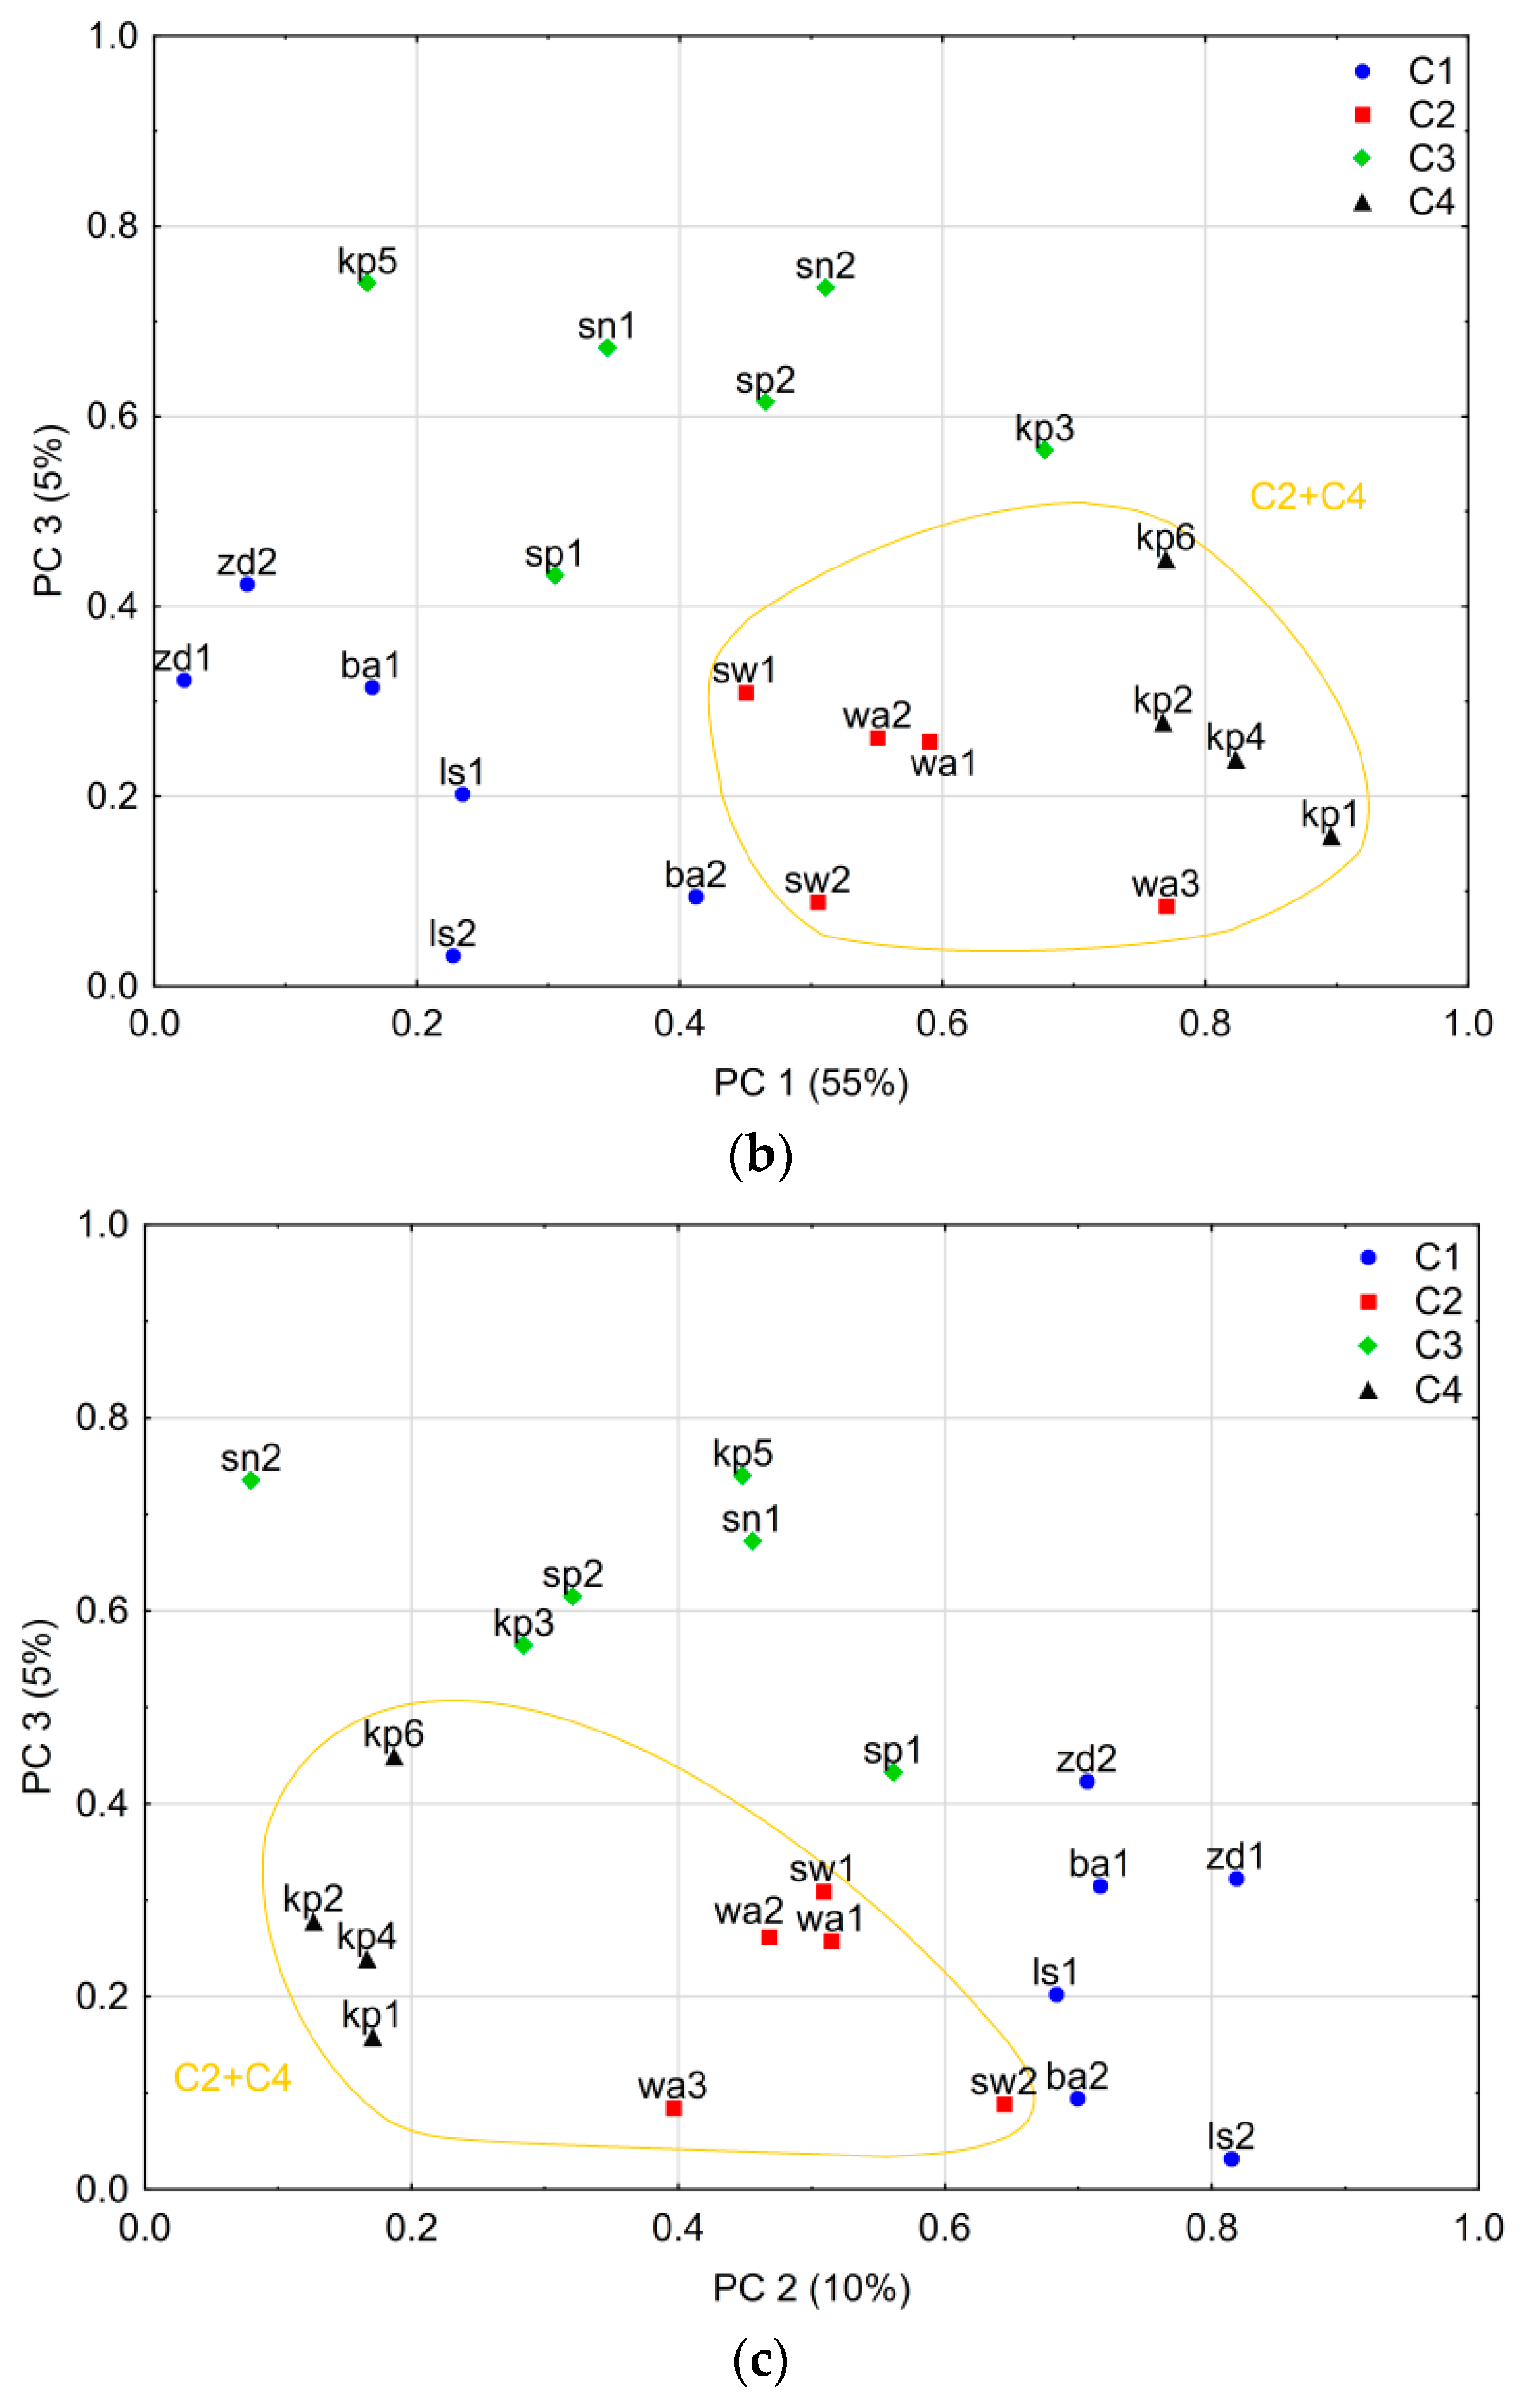
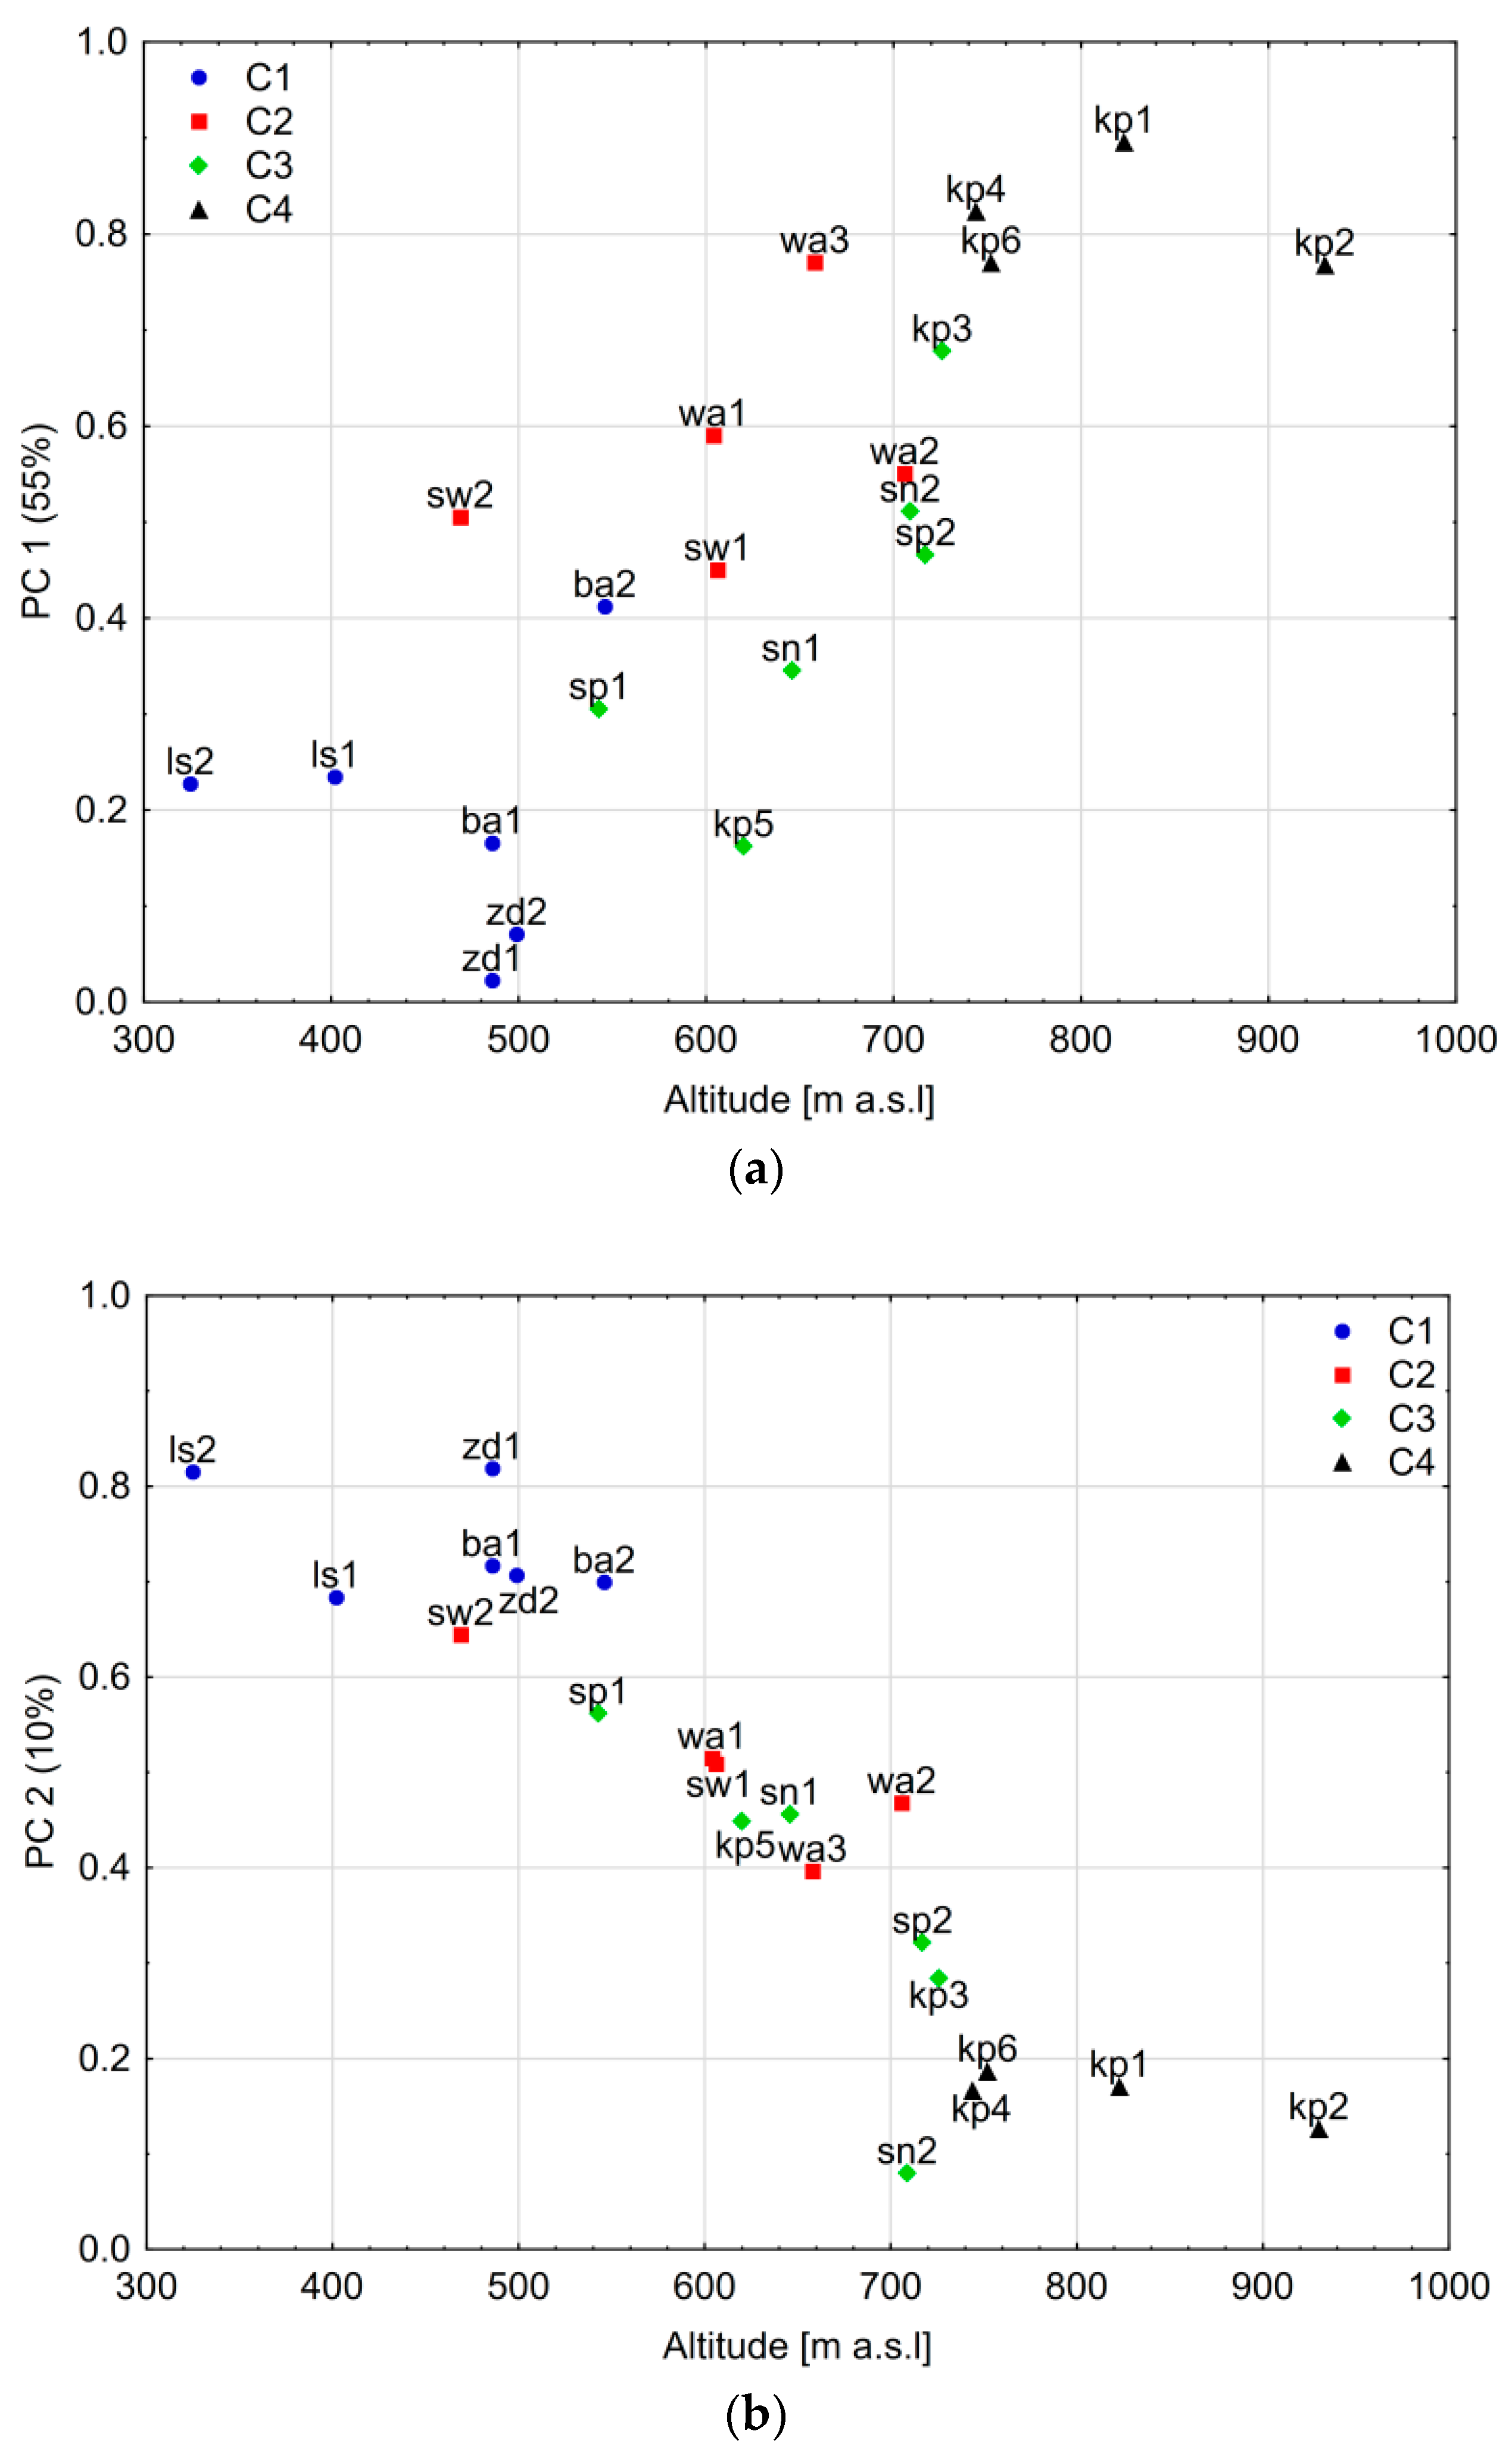
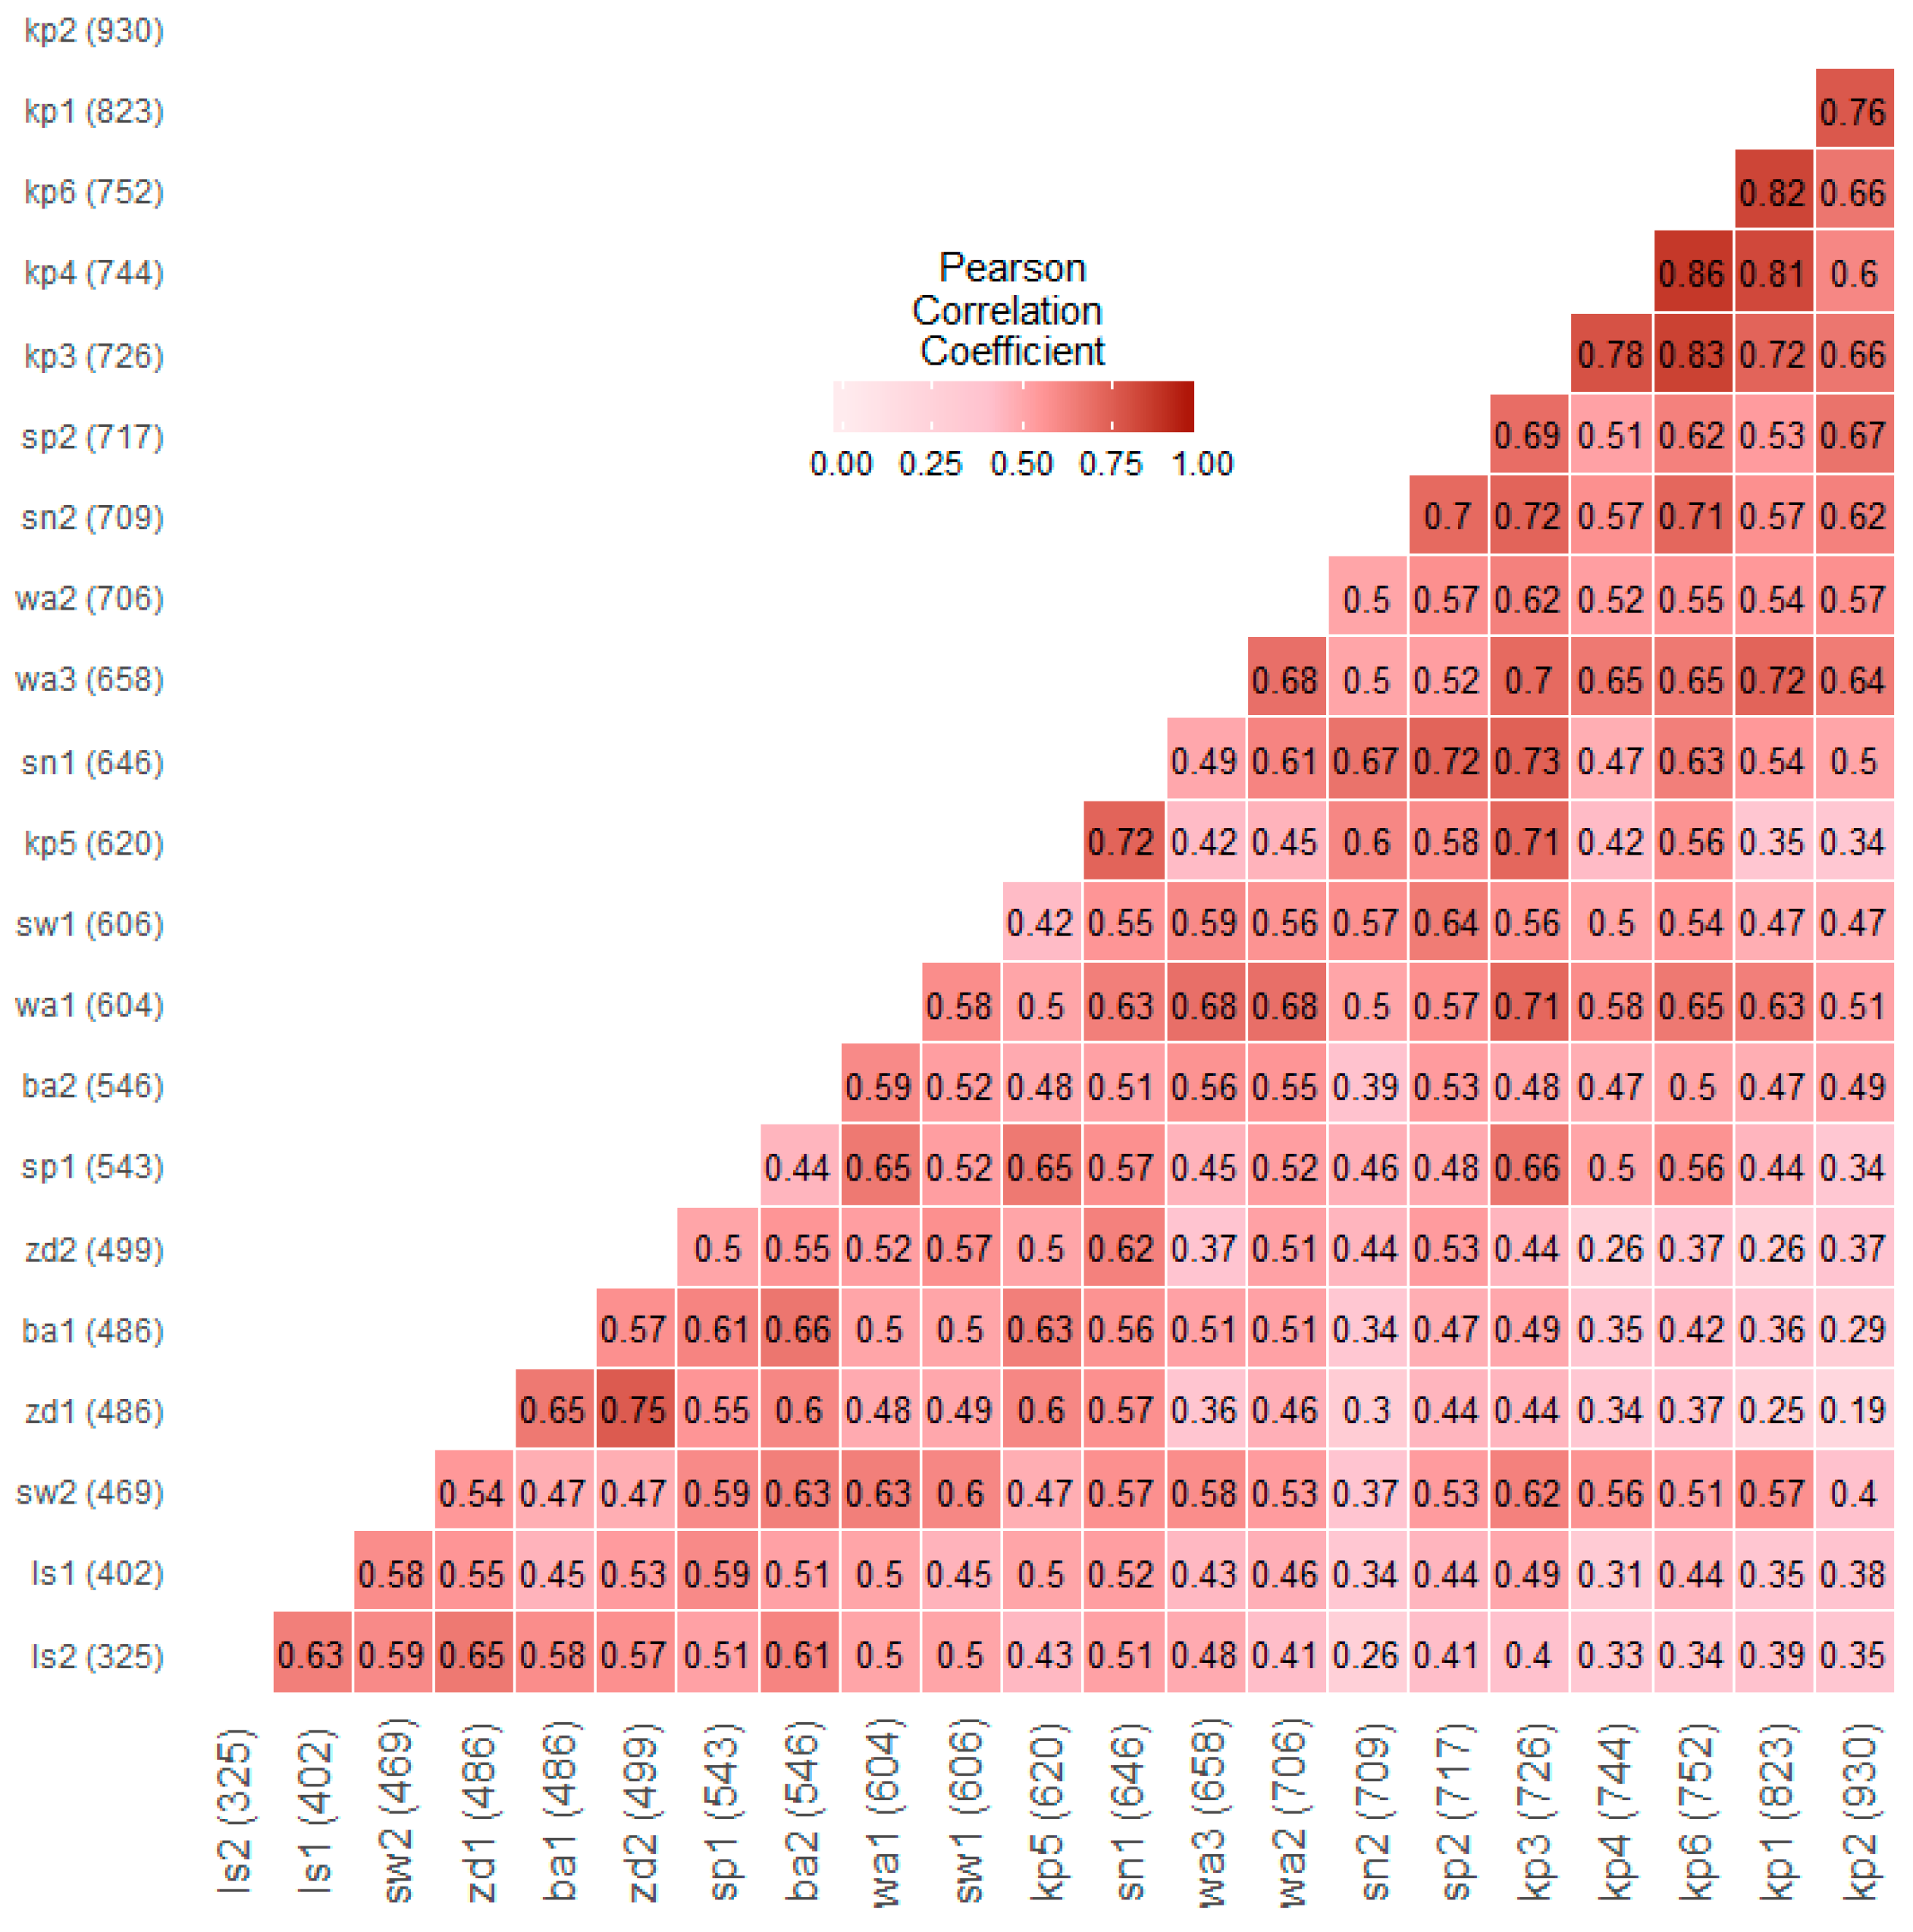
3.2. Spatial Variability of Larch Tree-Ring Growth

The result of the principal component analysis demonstrated that the first PC explains more than half of the variance observed in the analyzed set (55.4%). The proportion of subsequent principal components is markedly lower. The level of 5% is only exceeded by two subsequent PCs (PC2—10.4% and PC3—5.4%). Therefore, in the subsequent analysis, only the first three PCs were used. The relationships among the first three principal components for particular sites are presented in Figure 2. Moreover, the division of chronologies into groups according to their greatest similarity with respect to the obtained PC values is shown (Figure 2). K-means clustering with cross-validation resulted in separation into three groups (C1, C2 + C4, and C3). Additionally, based on a visual assessment of the relations observed in Figure 2a,c, one group was divided into two groups (C4 + C2). In Figure 2a, two of the separated clusters are the most distinguished: cluster C1 (on the left side, for which PC2 is maximized), and C4 (on the right side, for which PC1 is maximized). Cluster C1 contains almost all of the lowest locations (i.e., four out of six sites located below 550 m a.s.l.), while C4 has the four sites with the highest elevations (from 744 to 930 m a.s.l.). This observation contributed to conjecture about the link between the PCA analysis results and altitude, which is clearly visible in Figure 3. In general, the contribution of PC1 increases with elevation, while PC2 decreases (Figure 3). The relation between the observed signal and altitude can also be seen in the correlation coefficient matrix (Figure 4). It is clearly visible that there is a relation between the obtained correlation values and altitude differences of sites. Generally, the site chronologies for which these differences are smaller correlate better (low elevation with low elevation, and high elevation with high elevation). The highest correlation values were obtained between sites situated at the greatest altitudes (Figure 4). No evident associations were found between the results of the obtained analyses and the geographical latitude or longitude of the locations.

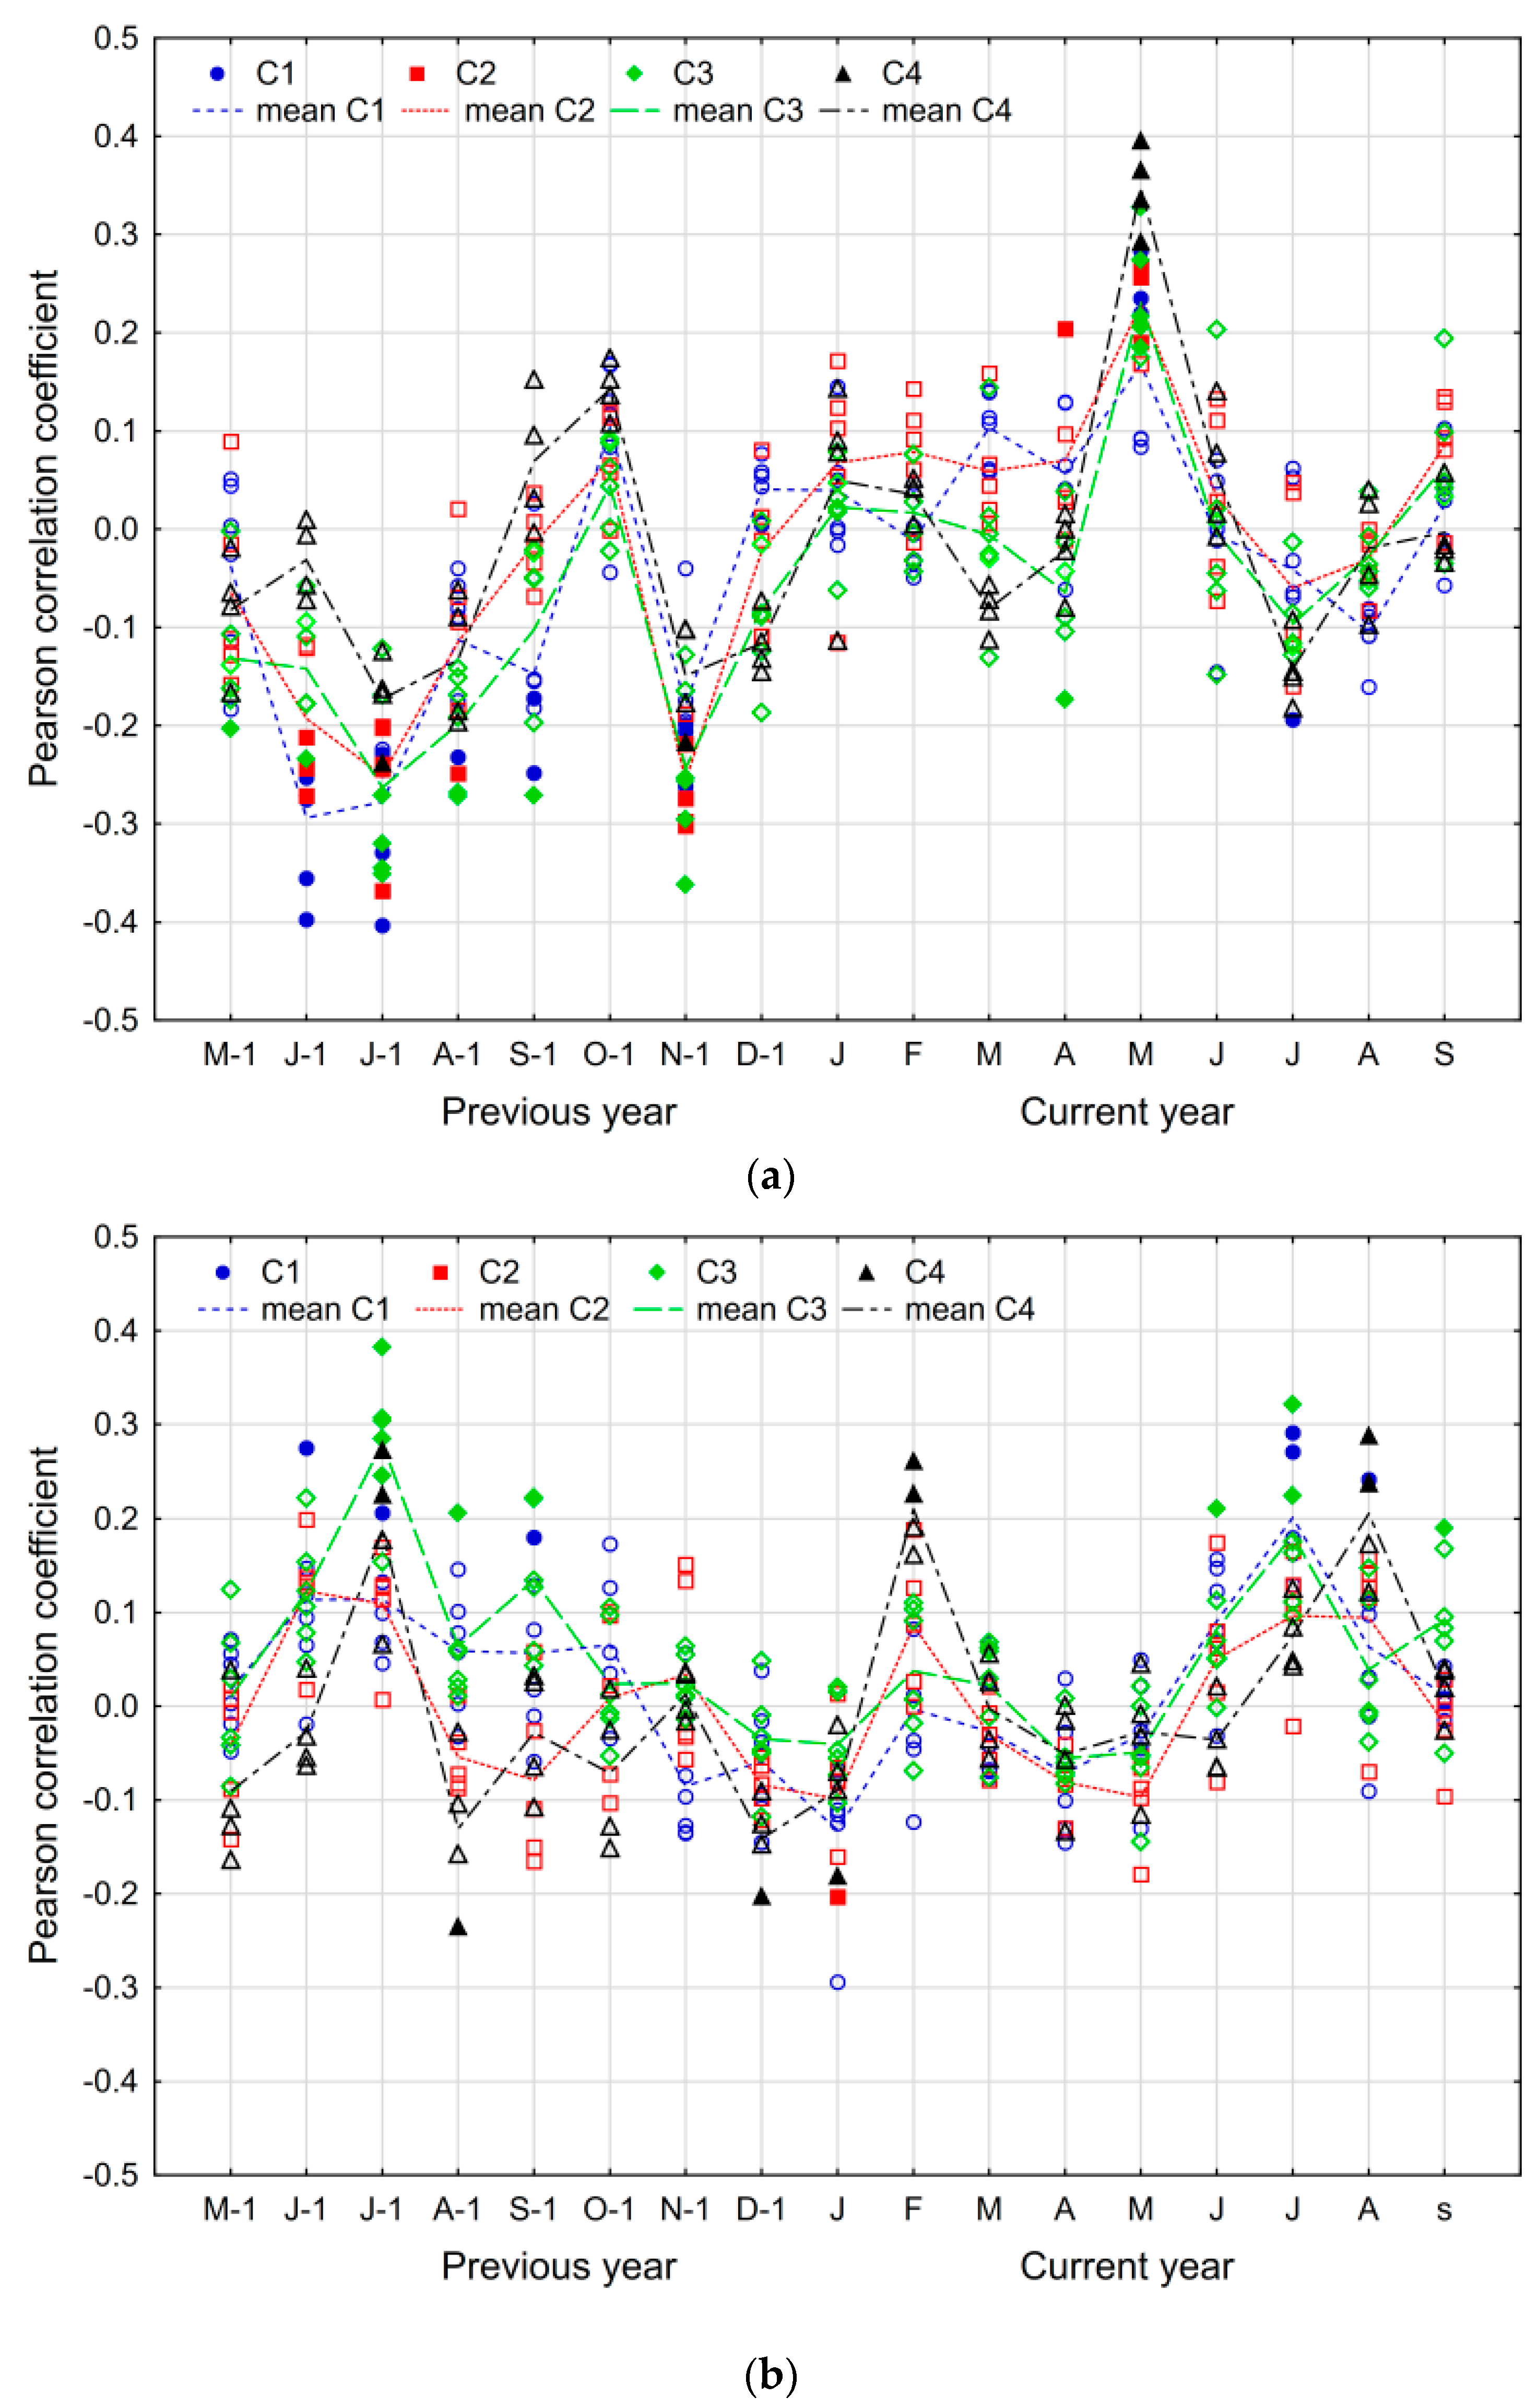
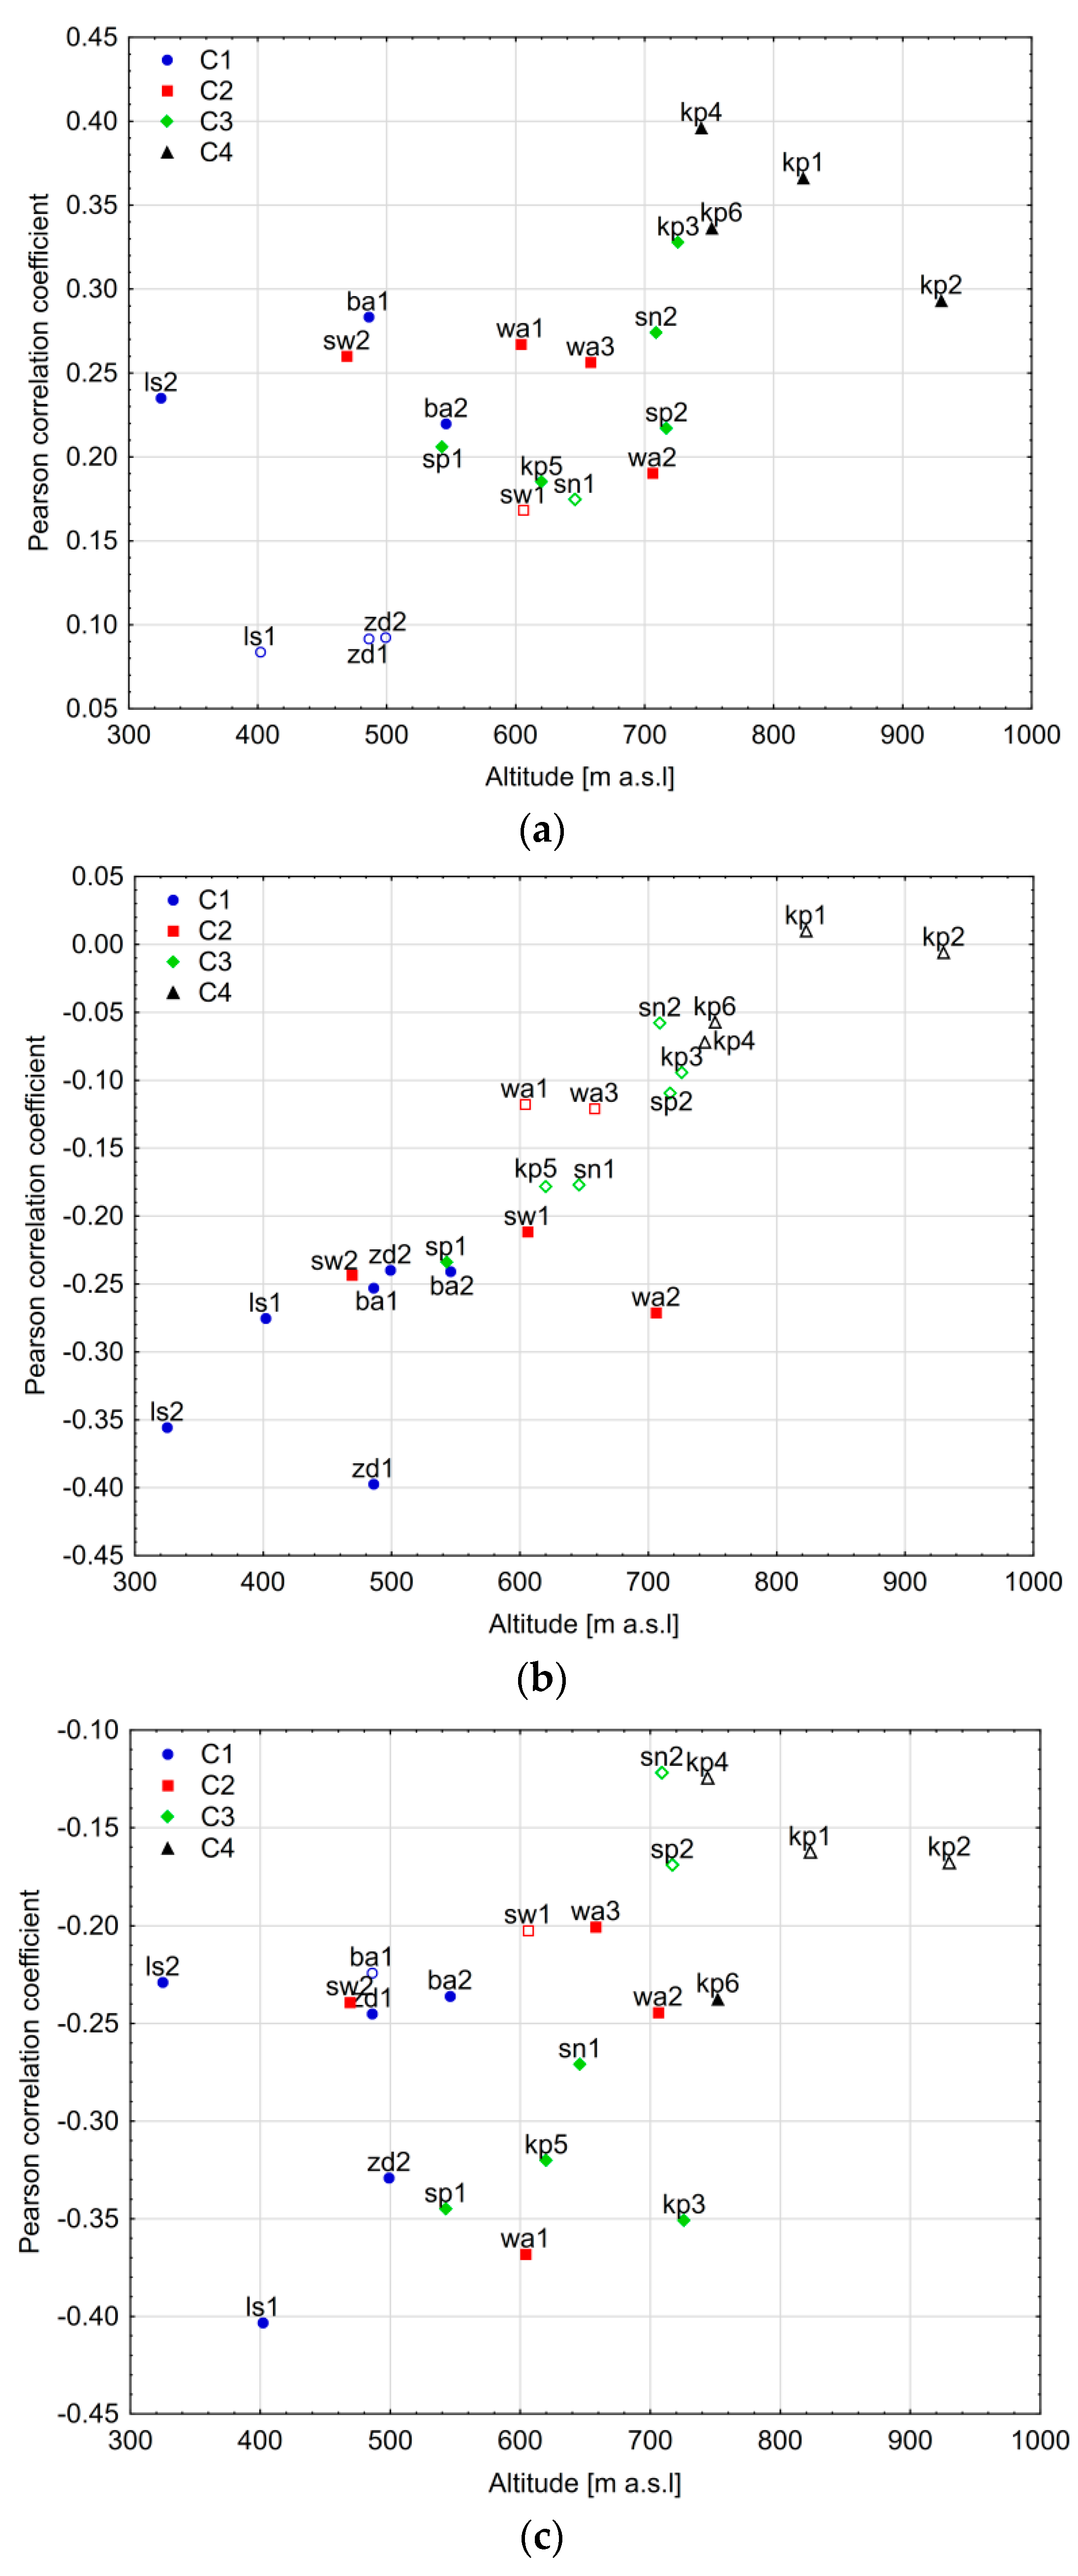
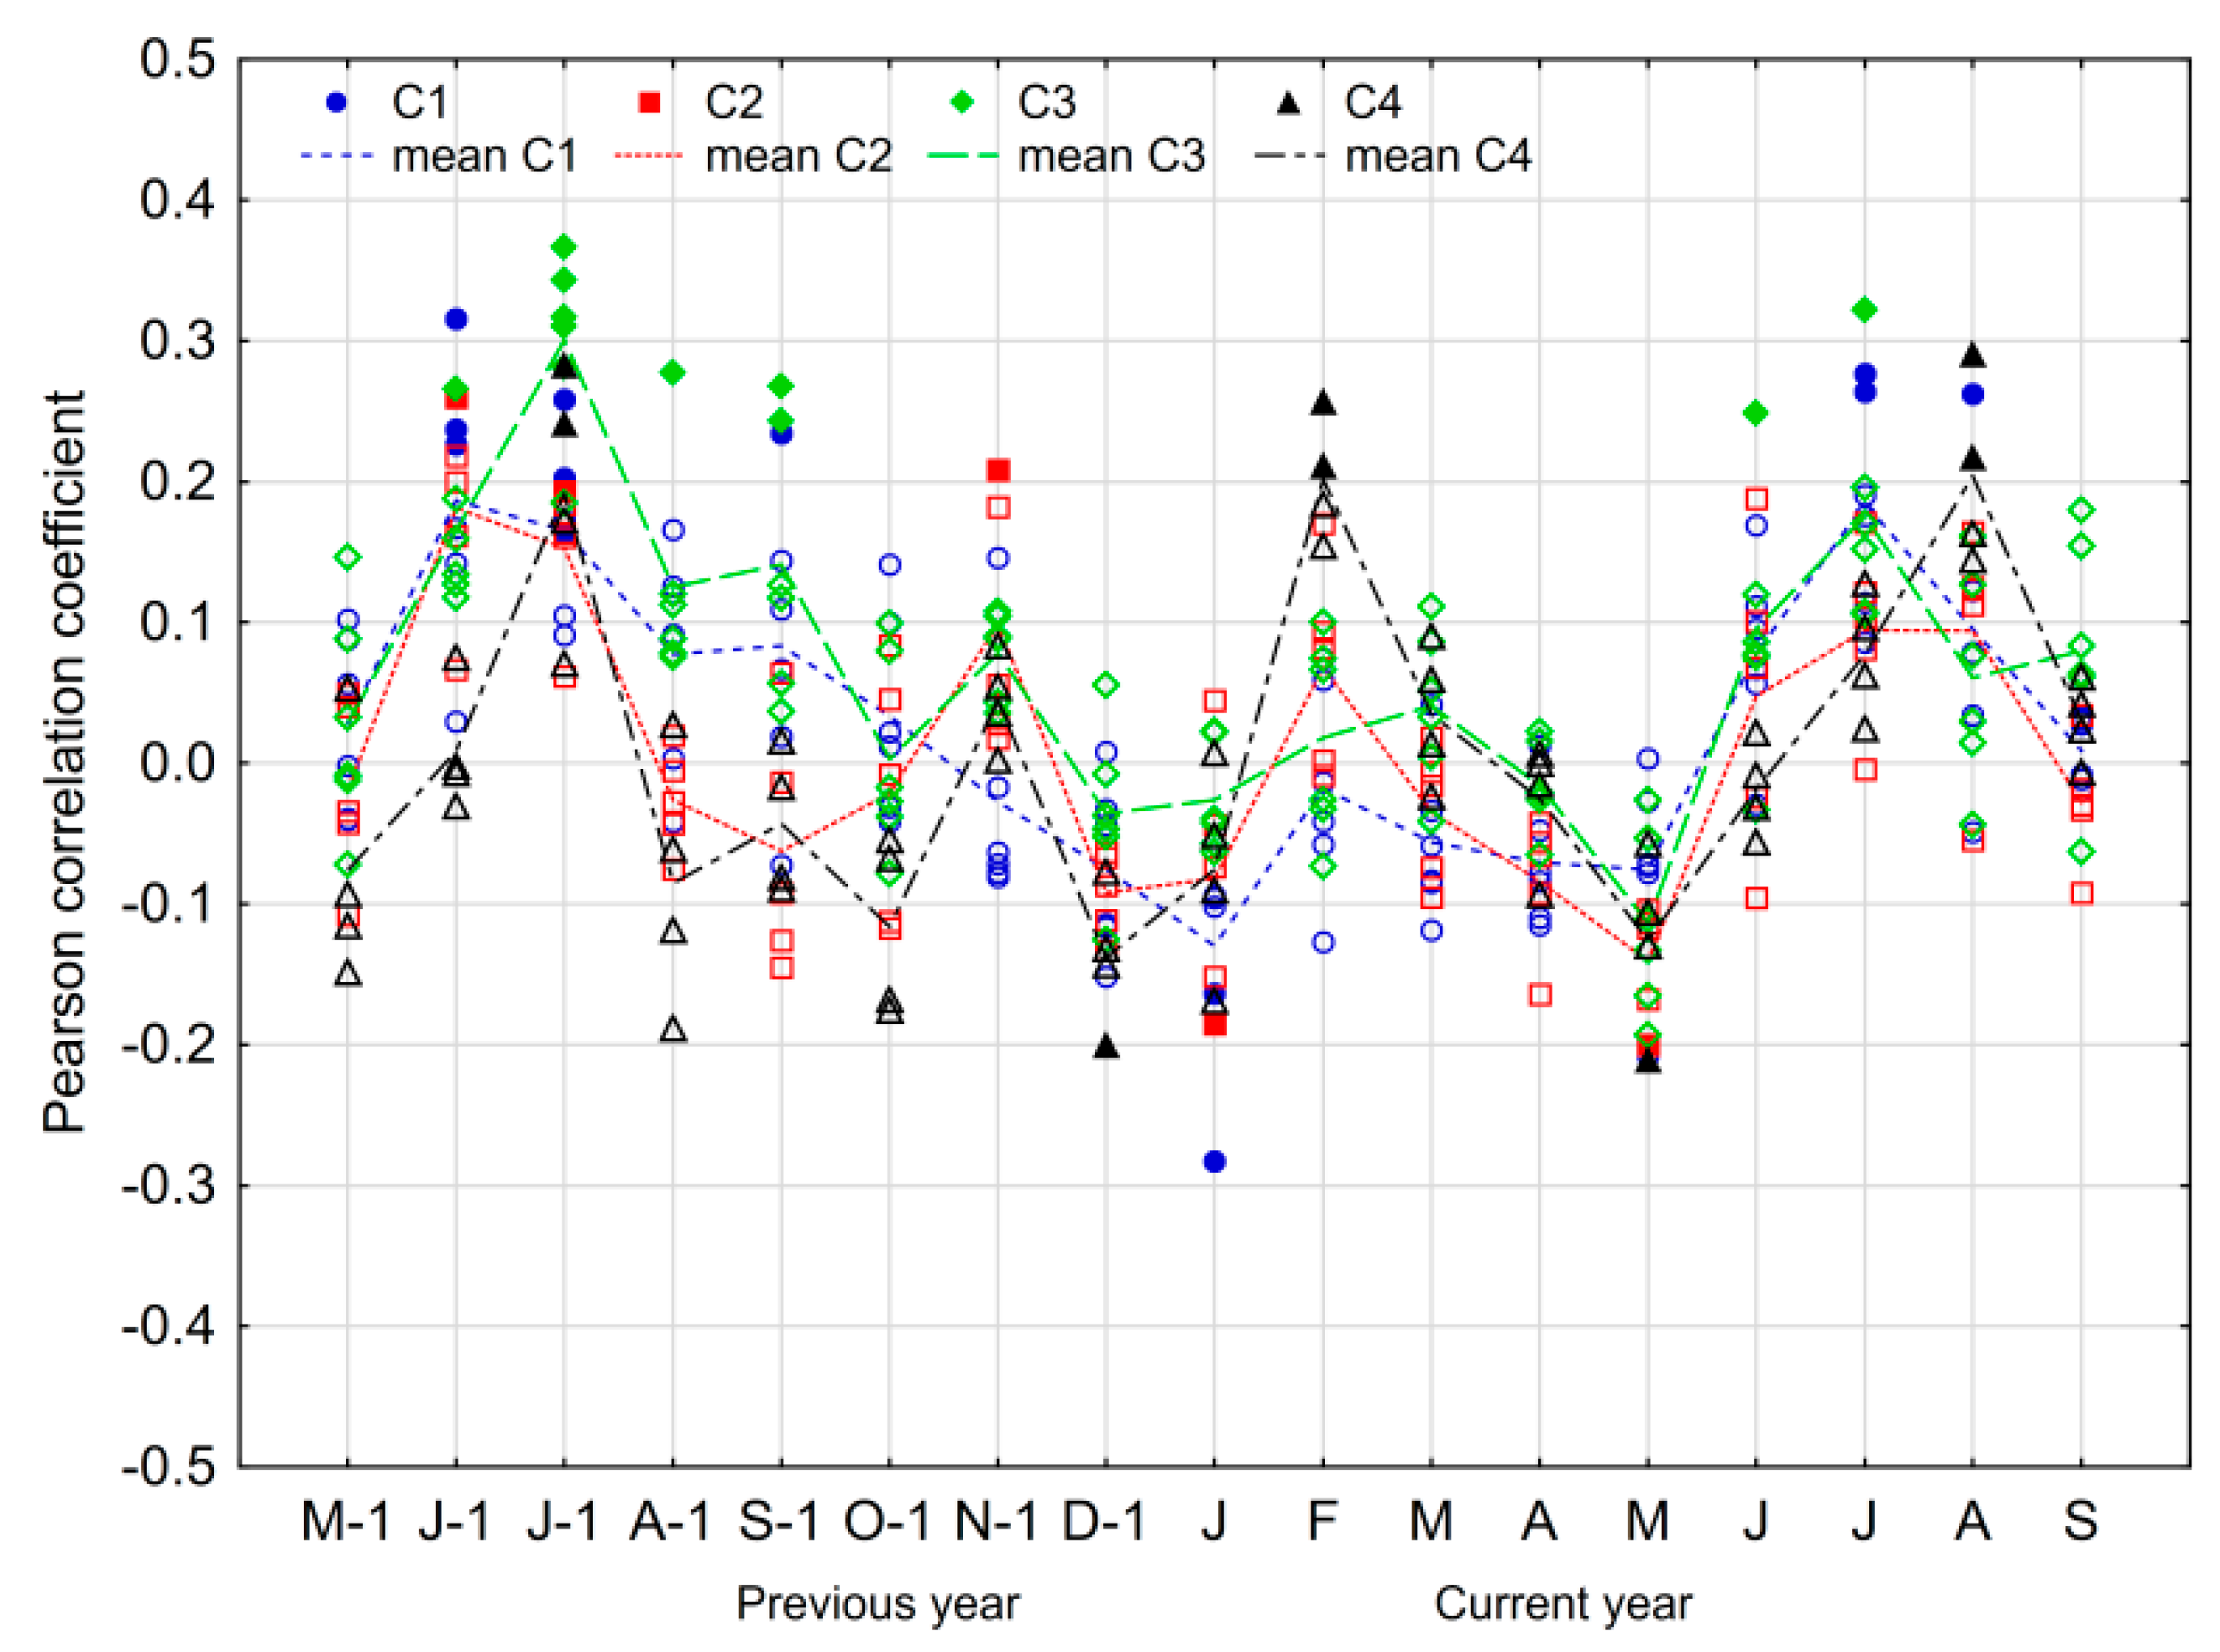
3.3. The Climate–Growth Relationship

The results of the climate–growth relationship analysis for all site chronologies are presented in Figure 5. The replication criterion was met for the temperatures of June, July, August, and November of the year preceding the tree-ring formation, and of May of the current year. Among the results obtained for precipitation, the criterion was met by precipitation in July of both the previous and current year. These factors were considered in the subsequent analysis and interpretation.
The results of the analysis demonstrate the negative correlation between the tree-ring growth and the temperature in the previous summer. Statistically significant negative correlation values were obtained for 10 (June), 14 (July), and 4 (August) among the analyzed site chronologies, respectively. In the same period, there is a positive correlation between tree-ring growth and precipitation that pertains particularly to July, for which statistically significant values were obtained for eight sites. The temperature of the previous November correlates negatively with the tree-ring growth of larch, and more than half of correlations obtained for this month are statistically significant (12 locations, Figure 5a). Among the months of tree-ring formation, the most outstanding is May, for which positive statistically significant correlation values were obtained for the prevailing number of sites (16). However, also noteworthy are generally positive correlations with precipitation in July, although the number of sites where statistically significant correlation values were found is relatively low (4 locations, Figure 5b).
The results selected with respect to the replication criterion were analyzed with respect to their possible relation to the positions of sites, particularly elevation, whose effect on the differentiation of the signal was demonstrated by PCA analysis. Selected results are presented in Figure 6. A clear association was only observed between results pertaining to temperatures of the previous June and elevation (Figure 6b).
The results obtained for the previous and the current summer indicated a possible negative effect of drought in the summer season upon tree-ring growth. In the results of the correlation of site chronologies with the SPEI drought index, it can be seen that the number of statistically significant correlation values for the previous June is relatively low. However, for July, significant values were achieved for almost half of the study sites; this confirms the possible association between drought and larch tree-ring growth in this month (Figure 7).

4. Discussion

4.1. Spatial Variability of the Tree-Ring Signal

The results obtained in PCA analysis indicate fairly large variations of the signal present in the tree rings of larch within the Sudetes area. The main differentiating factor is altitude (Figure 3). A relationship between the observed signal and altitude is also seen in the results of the correlation matrix and the obtained cluster separation (Figure 4 and Figure 5). The direct interpretation of PCs is a complex subject, but the uniformity of the climatic signal with altitude is clearly visible. The results of the climate–growth relationship analysis might suggest that as altitude increases, the impact of factors other than temperature on tree-ring growth is more and more limited (for details, see Section 4.2).
The sites included in cluster C1 are located at the NE and SW edges of the analyzed area (see Figure 1). The high similarity observed in the signal between these fairly distant areas could signify a low spatial diversity in the climatic conditions of the lower parts of the Sudetes Mountains or a major similarity between these two areas in terms of the climatic conditions that affect the tree-ring growth of larch. The similarity of both regions is confirmed by the distribution of mean temperatures and precipitation in the area of the Sudetes [28,55]. Despite the fact that the area where sites ba1, ba2, and zd1 and zd2 are situated has a more mountainous character (Figure 1), the temperatures here are relatively high because of the neighboring Kłodzko Basin, into which warmer air flows from the north [28,55].
The sites of cluster C2 are also separated by relatively large distances. However, this cluster represents higher sites of massifs located on both sides of the main culmination of the Sudetes, i.e., the Karkonosze range (Izerskie, Kamienne, and Sowie mountains, Figure 1). In the initial division, the cluster C2 sites formed one group with cluster C4 (locations representing the highest elevations of the Karkonosze, cf. Section 3.2 and Figure 2b,c). The sites from lower elevations of the Karkonosze, although they have similar altitudes as those in cluster C2 (except for location sw2, which is situated much lower), qualified for a separate cluster (C3). The similarity observed between clusters C2 and C4 (as is demonstrated by the initial cluster division) could be the result of site location relative to the summits and the resultant similarities in site conditions; this might indicate the importance of summit proximity.

4.2. The Climate–Growth Relationship

The climate–growth relationship analysis indicates that a climatic factor with a highly significant effect on the tree-ring growth of larch in the Sudetes is the temperature of May of the year in which the tree ring was formed. A positive effect of May temperature is commonly observed in the whole area, and only in three cases did that connection not occur (Figure 5a). The beginning of cambial activity in larch occurs in May (cf. [56,57,58]) or even as early as April (cf. [58,59]), and high temperature can even accelerate it (cf. [56]). The precise timing of the beginning of tree-ring formation depends, among other factors, on altitude [57] and slope aspect [56]. The obtained results might constitute a confirmation that high temperatures stimulate cambium in the initial period of its activity [57,60,61,62]. In May, the large part of the tree ring is formed (cf. [58,59]), which could additionally explain the clear relation observed between the width of the tree ring and the temperature of that month.
The observed positive connection between tree-ring growth and the temperature of the initial period of the growing season seems to be typical for the European larch. Similar results have been obtained for locations situated in both lower and moderate mountain locations in the Polish Carpathians [21], as well as in the Tatra Mountains, which are the highest parts of these mountains [21,49,63]. This positive impact was also found in the lowlands situated more to the north [64,65]. Apart from May, in higher locations, the positive impact of temperatures also extends to June [19,21], and, in the Alps, it may also extend to July [14,19]. In lower locations in the Carpathians, and in lowland locations in Lithuania, a positive effect of April temperatures has been observed [21,65]. In the Sudetes, this effect is only observed for May, which is the same as in central and north-eastern Poland [64]. The strength of the correlation between temperature and the tree-ring growth seems to have a certain relation to altitude: the highest correlation values (more than 0.3) were found for four of the five highest locations (in the most elevated location (kp2) the correlation was slightly lower—0.29; Figure 6a). This could indicate the increasing role of temperature in limiting tree-ring growth at higher mountain altitudes (see also [21]) as temperature is a predominant factor that limits the growth of trees in higher elevations in the Alps (cf. [19,20]) and exerts much control over the production and divisions of cells in wood [56].
The results of the analysis also indicate a clear effect of the climatic conditions in the preceding year upon the width of tree rings formed in the subsequent year. This chiefly pertains to temperature, although the effect of precipitation is also seen (Figure 5). For the previous June, the negative relationship between tree-ring growth and temperature clearly disappears linearly as altitude increases (Figure 6b). For July, the negative impact of temperature is stronger: more sites join those in which the significant negative effect was seen in the previous month, and the obvious relation with altitude is no longer visible (Figure 6c). In the study area, the mean temperatures of July are higher than those of June (from 1.6 to 1.8 °C; Figure 1). Moreover, an inverse relationship between temperature and elevation, as is characteristic of mountains, is also notable. These factors are probably responsible for the observed variability in results. In June, the temperatures at higher altitudes are still relatively low (the mean for Śnieżka summit is 6.8 °C, while for Karpacz it is 13.9 °C; Figure 1); however, in the foothills, and generally in lower locations, temperatures are higher (the mean for Jelenia Góra is 14.9 °C, for Kłodzko it is 15.2 °C; Figure 1). In this context, these relationships would indicate the existence of a certain temperature threshold which, when exceeded, translates negatively into the growth of larch in the subsequent year.
A negative effect of the previous summer’s temperatures has been observed in the lowlands in Poland and Lithuania [64,65,66], as well as in the Polish Carpathians (here, it chiefly pertained to July, [21]). Oleksyn and Fritts [66] indicated the possibility of a relation between their results and the effect of temperature upon respiration, the initiation of buds, and fruit set; by decreasing carbohydrate reserves, this could indirectly influence tree-ring growth in the next year. The additional possibility of the water stress effect upon the observed negative relationship was described [66]. Within the study area, for the period of the previous summer, a positive relation with precipitation was found in many locations. Nevertheless, the number of statistically significant correlations was markedly lower than in the case of temperature, and the majority of them pertain to July (Figure 5b). The negative relationship with temperature and the positive relationship with precipitation could indicate the effect of water stress. The climate of Poland is characterized by the fact that cooler years are usually associated with greater precipitation [67]; therefore, high temperatures can, to some extent, reflect droughts. The possibility of the negative effect of drought on larch growing in the study area was confirmed by the correlation of site chronologies with the SPEI drought index. This effect is most distinct for the previous July (Figure 7). Our results could be related to the relatively high water requirements of this species due to its high transpiration (cf. [68,69]). A characteristic feature of larch is that it maintains relatively high transpiration even during moderate water deficits; this is related to its high water uptake capacity [70]. This feature can make it vulnerable to droughts [16]. High drought sensitivity of larch has been found in the Alps at moderate elevations [16,17]. Thus, to a certain extent, the results of the climate–growth relationship analysis obtained in the study area, particularly for the preceding July, could indicate the impact of drought.
Similarly, as for the previous July, positive correlations with precipitation were obtained for the July of the year in which the tree ring was formed. However, significant values were only found for four sites. The relationship with the temperature of this month was negative; however, the strength of the relation was again markedly weaker than that observed for the July of the previous year (Figure 5a). The results of correlations with the SPEI index gave similar results to those for precipitation (Figure 5b and Figure 7a). Additionally, positive significant correlations with precipitation and SPEI were also obtained for the sites with the highest elevations, but for August. It seems that the water deficit also affects these sites, but it appears there later. The positive effect of precipitation in the growing season has been observed in the Polish Carpathians [21,71,72] and in the lowlands situated north of the study area [64,65,66]. A negative effect of drought in the growing season has been noted in the Alps [16,17]. The relation between the observed relationships and the aforementioned relatively high water requirements of larch, as indicated by the authors referenced above, seems to be confirmed in the presented study. However, the low number of sites with significant correlations could indicate that drought in the summer of the preceding year has more significance for the tree-ring formation of larch in the study area than a drought in the year when the tree ring is formed.
The obtained results also indicate a significant effect of the thermal conditions in the previous autumn upon the tree-ring growth in the next year. The positive effect of a warm late summer and early autumn is often observed for trees growing at high elevations (e.g., [19,49]), and at high geographical latitudes [73]. In the neighboring Carpathians, it has been observed for October [21]. The response to temperature in this month is less pronounced in the Sudetes (Figure 6a). Here, the thermal conditions of November definitively have more importance, but this relationship is negative and observed throughout the area (Figure 5a). The temperature in the period after the cessation of growth is of paramount importance to bud growth and the induction of dormancy (see [74] for review). Higher temperatures during shorter days positively affect the process of bud formation and enable proper bud maturation. On the other hand, it causes effective bud dormancy, which results in delaying the time of bud bursting and makes this process irregular [75,76]. In turn, the timing of bud bursting affects the biomass production in the subsequent year [77]. The observed negative association between tree-ring growth and the temperature of the previous November could be the effect of thermal conditions (the need for late-autumn chilling) on the development of the assimilation apparatus in the spring of the subsequent year (and in particular the time of bud burst), which indirectly affects tree-ring growth.
In the Sudetes, the negative relationship with previous November temperatures is more common than in the Carpathians [21,49,72]. This relationship was not observed in the lowlands situated more to the north [64,65,66] or in the Alps [13,15]; therefore, this seems to be one of the distinct features of the region. Compared with the Carpathians, the average November temperature does not vary much, although the variability of this parameter is definitively greater in the Carpathians than in the Sudetes [78]. In this period, foehn winds are a possible additional factor that is related to temperature fluctuations. These winds also occur in the Carpathians (chiefly in the Tatra Mountains), but the frequency of their occurrence is slightly lower than in the Sudetes [79]. These dry, warm, and gusty winds blow from the summits of the Sudetes towards the foothills and bring about periodical temperature increases (however, only for short periods [79]). The greatest temperature increase caused by a foehn has been observed in the months of the cold season. Additionally, the foehns rapidly reduce the relative humidity and result in an increase of insolation [80]. However, confirmation of the possible effects of foehns upon the obtained results will require further, more detailed studies.
The results of the climate–growth relationship analysis generally indicate strong similarities between the Polish Sudetes and the neighboring Polish Carpathians, but some differences can be highlighted which mostly pertain to the strength of the observed associations with climatic factors (Figure 5, cf. Figure 6 in [21]). The most similar relationship is the one for May temperature. Therefore, it seems that the thermal conditions of this month are one of the principal factors determining larch tree-ring growth at lower and medium-elevations in the mountains of this part of Europe. The relationship between tree-ring growth and thermal–pluvial conditions during the previous summer is definitively stronger in the Sudetes. The described differences seem to be linked to the moisture conditions prevailing in these two areas. No principal differences in June and July average temperatures can be seen between the two regions; however, the differences in the precipitation totals are notable [81]. In general, the Sudetes receive less precipitation than the Carpathians [82,83]. These conditions can make this region more drought prone. Taking into account the water requirements of larch and its vulnerability to drought, one can state that, in this respect, the climatic conditions in the Sudetes are less favorable to this species. This could translate into a stronger reaction to unfavorable climatic conditions in the previous summer. In the Sudetes, the previously mentioned respective weaker and stronger relations with October and November temperatures could be caused by the differences in climate between the two regions: despite its typical mountain features, the Sudetes is characterized by a greater effect of the Atlantic Ocean [84], which generally moderates it.

4.3. The Influence of Other Site-Related Factors on the Climate–Growth Relationship

The detailed analysis of the obtained results indicates the possible additional influence of local conditions on the diversity of the observed signal. One example is site kp5: it has a relatively low PC1 value compared to other sites at a similar elevation (close to the values obtained for sites at much lower elevations), and a high PC3 value (Figure 3). This is confirmed by the low values of the correlations between site kp5 and the other site chronologies (Figure 4). A very strong positive correlation with precipitation and SPEI, both in the preceding July–September, as well as in the current growing season (June, July and September), was not observed in any other location. The reasons for this could be associated with the shallow granite bedrock (many granite blocks can be observed on the ground at this site), which is characterized by many cracks. This could result in a rapid outflow of water and relatively low water content in the slopes [28].
Site sn2 is another example. It is situated close to the summit and is exposed to strong winds. The larches growing here are characterized by very narrow rings (Table 1). The PC2 for this site is very low, comparable with the values obtained for sites in the highest locations. Additionally, PC3 has a relatively high value. The negative effect of temperatures in the previous summer that is commonly observed in this area is not so clearly pronounced here; this is similar to the case of the highest sites. The similarity with the higher sites could be related to the aforementioned effect of the proximity of the summit. On the other hand, site sn2 distinguishes itself from all other locations by the highest correlations with precipitation and the SPEI for the July of the previous year (0.38 and 0.37, respectively). The Sudetes are among the windiest mountains in the continental part of Europe [85]. Wind increases the intensity of transpiration in larch which, as already mentioned, is already relatively high in this species [68]. Additionally, high wind velocities negatively affect photosynthesis (even though larch distinguishes itself by a relatively low sensitivity of photosynthesis to wind; cf. [68]). These processes probably determine the different reaction of trees in this location.
Site sw2 is also noteworthy: its chronology correlates much better with higher-situated sites than other chronologies from the foothills and at similar altitudes (Figure 4). The value of PC1 for the chronology of site sw2 is much higher than for other locations at similar altitudes. The greater similarity to the sites at higher elevations could be related to the specificity of this part of the Izerskie Foothills, which is relatively cold and humid (cf. characteristics of the climatic regions acc. to Schmuck [28]). Another factor that could be responsible for the observed distinctness of the signal is the soil type: site sw2 is situated in a flat area on planosols, a type of soil that is characterized by a permanent or periodical saturation of the upper profile with precipitation water. This increased quantity of water could additionally modify the reaction of trees at this site.

5. Conclusions

The obtained results indicate the relatively high diversity of the climatic signal observed in the tree-ring growth of larch in the Sudetes, which is visible in the results of the PCA analysis. The most significant differentiating factor is altitude. The results suggest that the possible influence of the local conditions (e.g., summit proximity, soil and bedrock, and exposure to strong winds) could also be of importance. A positive relationship between tree-ring growth and May temperature was noted throughout the area. The similar results obtained for the area of the Carpathians indicate the principal importance of thermal conditions in the initial stage of cambial activity and tree-ring formation in larches in the mountains of this part of Europe. Moreover, the climatic conditions in the previous summer are of particular significance to the tree-ring growth of larch within the Sudetes. In the initial period of summer, an inverse relationship between temperature and altitude can be observed. The studies also indicate the negative influence of water stress in summer (particularly in July of the previous year) upon the growth of trees. The obtained results seem to be related to the relatively high water requirements of larch, while the diversity of the results obtained could indicate the significant role of site conditions as factors that modify the responses of trees. A negative relationship between tree-ring growth and the previous November’s temperature was observed throughout the study area. This could be explained by the need for a late-autumn cooling, which affects the development of assimilation apparatus in the spring of the subsequent year (in particular the time of bud burst), which indirectly affects tree-ring growth.
Studies pertaining to changes in the climatic factors in Poland, including those in the study area, have indicated general temperature increases in recent decades, particularly in May and the summer months, but also, to a lesser extent, autumn [78,86,87]. Furthermore, an increase in maximum temperatures in summer has also been observed (0.4 °C per decade from 1951 to 2015), and, since the 1990s, positive anomalies have predominated [88]. Taking into account the relationships observed in the presented study, temperatures may have a twofold effect on the growth of larch in Sudetes in the future: positive with respect to the effect of May temperature, and negative with respect to the effects of temperatures of the summer months of the preceding year. Nevertheless, the positive effect of temperature could have a threshold value which, if exceeded, causes this effect to become insignificant or even negative (e.g., [10,89]). It is also worth adding that warmer temperatures in the spring may also increase the probability of frost damage [90]. An increase in summer temperature, even with the lack of a decrease in precipitation (summer precipitation over the last half century has been fairly stable [83]), will increase the possibility of the occurrence of water stress (cf. [53]). In light of the observed relationships and the relatively high drought vulnerability of larch [16,17], this effect could significantly limit the future prospects for its growth within the study area. Our results suggest that more detailed studies on the effect of drought on larch growth in the study area are required.

Author Contributions

M.D. conceived the ideas, collected and processed the data, contributed to data analysis, and wrote the paper. M.C. contributed to data collection and performed the data analysis. A.W. provided statistical expertise.

Funding

The study was supported by the National Science Centre, Poland (project No. 2014/13/B/ST10/02529) and AGH University of Science and Technology as a part of statutory project No. 11.11.140.626 and 11.11.140.613.

Acknowledgments

The authors would like to thank numerous persons from Regional Forest Management in Wrocław (RDLP Wrocław), local forestry districts, and Karkonosze National Park, without whom this research would have been impossible. The authors would also like to thank Jerzy Zasadni and Joanna Świąder for technical support.

Conflicts of Interest

The authors declare no conflict of interest.

References

  1. IPCC. Climate Change 2013: The Physical Science Basis. Contribution of Working Group I to the Fifth Assessment Report of the Intergovernmental Panel on Climate Change; Stocker, T.F., Qin, D., Plattner, G.-K., Tignor, M., Allen, S.K., Boschung, J., Nauels, A., Xia, Y., Bex, V., Midgley, P.M., Eds.; Cambridge University Press: Cambridge, UK, 2013. [Google Scholar]
  2. Spiecker, H. Overview of recent growth trends in European forests. Water Air Soil Pollut. 1999, 116, 33–46. [Google Scholar] [CrossRef]
  3. Dale, V.H.; Joyce, L.A.; McNulty, S.; Neilson, R.P.; Ayres, M.P.; Flannigan, M.D.; Hanson, P.J.; Irland, L.C.; Lugo, A.E.; Peterson, C.J.; et al. Climate change and forest disturbances. BioScience 2001, 51, 723–734. [Google Scholar] [CrossRef]
  4. Lindner, M.; Maroschek, M.; Netherer, S.; Kremer, A.; Barbati, A.; Garcia-Gonzalo, J.; Seidl, R.; Delzon, S.; Corona, P.; Kolström, M.; et al. Climate change impacts, adaptive capacity, and vulnerability of European forest ecosystems. For. Ecol. Manag. 2010, 259, 698–709. [Google Scholar] [CrossRef]
  5. Lindner, M.; Fitzgerald, J.B.; Zimmermann, N.E.; Reyer, C.; Delzon, S.; van der Maaten, E.; Schelhaas, M.-J.; Lasch, P.; Eggers, J.; van der Maaten-Theunissen, M.; et al. Climate change and European forests: What do we know, what are the uncertainties, and what are the implications for forest management? J. Environ. Manag. 2014, 146, 69–83. [Google Scholar] [CrossRef] [PubMed]
  6. Thuiller, W.; Lavorel, S.; Araújo, M.B.; Sykes, M.T.; Prentice, I.C. Climate change threats to plant diversity in Europe. Proc. Natl. Acad. Sci. USA 2005, 102, 8245–8250. [Google Scholar] [CrossRef] [PubMed] [Green Version]
  7. Kienast, F.; Wildi, O.; Brzeziecki, B. Potential impacts of climate change on species richness in mountain forests—An ecological risk assessment. Biol. Conserv. 1998, 83, 291–305. [Google Scholar] [CrossRef]
  8. Beniston, M. Climatic change in mountain regions: A review of possible impacts. Clim. Chang. 2003, 59, 5–31. [Google Scholar] [CrossRef]
  9. Hanewinkel, M.; Cullmann, D.A.; Schelhaas, M.-J.; Nabuurs, G.-J.; Zimmermann, N.E. Climate change may cause severe loss in the economic value of European forest land. Nat. Clim. Chang. 2013, 3, 203–207. [Google Scholar] [CrossRef]
  10. Sidor, C.G.; Popa, I.; Vlad, R.; Cherubini, P. Different tree-ring responses of Norway spruce to air temperature across an altitudinal gradient in the Eastern Carpathians (Romania). Trees 2015, 29, 985–997. [Google Scholar] [CrossRef]
  11. Babst, F.; Poulter, B.; Trouet, V.; Tan, K.; Neuwirth, B.; Wilson, R.; Carrer, M.; Grabner, M.; Tegel, W.; Levanic, T.; et al. Site- and species-specific responses of forest growth to climate across the European continent. Glob. Ecol. Biogeogr. 2013, 22, 706–717. [Google Scholar] [CrossRef]
  12. Carrer, M.; Urbinati, C. Age-dependent tree-ring growth responses to climate in Larix decidua and Pinus cembra. Ecology 2004, 85, 730–740. [Google Scholar] [CrossRef]
  13. Carrer, M.; Urbinati, C. Long-term change in the sensitivity of tree-ring growth to climate forcing in Larix decidua. New Phytol. 2006, 170, 861–872. [Google Scholar] [CrossRef] [PubMed]
  14. Büntgen, U.; Frank, D.; Wilson, R.; Carrer, M.; Urbinati, C.; Esper, J. Testing for tree-ring divergence in the European Alps. Glob. Chang. Biol. 2008, 14, 2443–2453. [Google Scholar] [CrossRef] [Green Version]
  15. Büntgen, U.; Frank, D.; Neuenschwander, T.; Esper, J. Fading temperature sensitivity of Alpine tree growth at its Mediterranean margin and associated effects on large-scale climate reconstructions. Clim. Chang. 2012, 114, 651–666. [Google Scholar] [CrossRef]
  16. Eilmann, B.; Rigling, A. Tree-growth analyses to estimate tree species’ drought tolerance. Tree Physiol. 2012, 32, 178–187. [Google Scholar] [CrossRef] [PubMed]
  17. Lévesque, M.; Saurer, M.; Siegwolf, R.; Eilmann, B.; Brang, P.; Bugmann, H.; Rigling, A. Drought response of five conifer species under contrasting water availability suggests high vulnerability of Norway spruce and European larch. Glob. Chang. Biol. 2013, 19, 3184–3199. [Google Scholar] [CrossRef] [PubMed]
  18. Rolland, C. Decreasing teleconnections with inter-site distance in monthly climatic data and tree-ring width networks in a mountainous Alpine area. Theor. Appl. Clim. 2002, 71, 63–75. [Google Scholar] [CrossRef]
  19. Frank, D.; Esper, J. Characterization and climate response patterns of a high-elevation, multi-species tree-ring network in the European Alps. Dendrochronologia 2005, 22, 107–121. [Google Scholar] [CrossRef]
  20. Leal, S.; Melvin, T.M.; Grabner, M.; Wimmer, R.; Briffa, K.R. Tree ring-growth variability in the Austrian Alps: The influence of site, altitude, tree species and climate. Boreas 2007, 36, 426–440. [Google Scholar] [CrossRef]
  21. Danek, M.; Chuchro, M.; Walanus, A. Variability in larch (Larix decidua Mill.) tree-ring growth response to climate in the Polish Carpathian Mountains. Forests 2017, 8, 354. [Google Scholar] [CrossRef]
  22. Korzybski, D.; Mionskowski, M.; Dmyterko, E.; Bruchwald, A. Stopień uszkodzenia świerka, jodły i modrzewia w Sudetach Zachodnich. Sylwan 2013, 157, 104–112. [Google Scholar]
  23. Krzysik, F. Nauka o Drewnie; Wyd. Naukowe PWN: Warszawa, Poland, 1978. [Google Scholar]
  24. Einspahr, D.W.; Wyckoff, G.W.; Fiscus, M.H. Larch—A fast-growing fiber source for the Lake States and Northeast. J. For. 1984, 82, 104–106. [Google Scholar]
  25. Karolewski, P.; Białobok, S. Wpływ dwutlenku siarki, ozonu, mieszaniny tych gazów i fluorowodoru na uszkodzenie igieł modrzewia europejskiego. Arbor. Kórn. 1979, 24, 297–305. [Google Scholar]
  26. Feliksik, E. Studies on sensitivity of the more important forest trees to industrial pollution. Zesz. Naukowe AKad. Rol. Kraków Leśni. 1991, 254, 353–391. [Google Scholar]
  27. Migoń, P.; Placek, A. Litologiczno-strukturalne uwarunkowania rzeźby Sudetów. Prz. Geol. 2014, 64, 36–43. [Google Scholar]
  28. Walczak, W. Dolny Śląsk. Cz. I—Sudety; Wyd. Naukowe PWN: Warszawa, Poland, 1968. [Google Scholar]
  29. Błaś, M.; Sobik, M. Mgła w Karkonoszach i wybranych masywach górskich Europy. Opera Corcon. 2000, 37, 35–46. [Google Scholar]
  30. Sarosiek, J.; Sembrat, K.; Wiktor, A. Sudety; Wiedza Powszechna: Warszawa, Poland, 1967. [Google Scholar]
  31. Boratyński, A. Systematyka i geograficzne rozmieszczenie. In Modrzewie Larix Mill.; Białobok, S., Ed.; PWN: Warszawa/Poznań, Poland, 1986; pp. 63–108. [Google Scholar]
  32. Maciejowski, K. Modrzew w lasach polskich. Sylwan 1956, 100, 6–57. [Google Scholar]
  33. Jarvis, A.; Reuter, H.I.; Nelson, A.; Guevara, E. Hole-Filled SRTM for the Globe; Version 4. Available online: http://srtm.csi.cgiar.org (accessed on 13 August 2018).
  34. Walanus, A. Program Quercus, Instrukcja Obsługi; AGH-UST: Kraków, Poland, 2005. [Google Scholar]
  35. Cook, E.R.; Peters, K. Calculating unbiased tree-ring indices for the study of climatic and environmental change. Holocene 1997, 361–370. [Google Scholar] [CrossRef]
  36. Cook, E.R.; Peters, K. The smoothing spline: A new approach to standardizing forest interior tree-ring width series for dendroclimatic studies. Tree-Ring Bull. 1981, 41, 45–53. [Google Scholar]
  37. Cook, E.R. A Time Series Analysis Approach to Tree-Ring Standardization. Ph.D. Thesis, University of Arizona, Tucson, AZ, USA, 1985; p. 171. [Google Scholar]
  38. Holmes, R.L.; Adams, R.K.; Fritts, H.C. Tree-Ring Chronologies of Western North America: California, Eastern Oregon and Northern Great Basin with Procedures Used in the Chronology Development Work Including Users Manuals for the COFECHA and ARSTAN Computer Programs; Chronology Series VI; Laboratory of Tree-Ring Research, University of Arizona: Tucson, AZ, USA, 1986; p. 182. [Google Scholar]
  39. Fritts, H. Tree Rings and Climate; Academic Press: London, UK, 1976; p. 567. ISBN 978-0-12-268450-0. [Google Scholar]
  40. Savva, Y.; Oleksyn, J.; Reich, P.B.; Tjoelker, M.G.; Vaganov, E.A.; Modrzynski, J. Interannual growth response of Norway spruce to climate along an altitudinal gradient in the Tatra Mountains, Poland. Trees 2006, 20, 735–746. [Google Scholar] [CrossRef]
  41. Cook, E.R.; Kariukstis, L.A. Methods of Dendrochronology: Applications in the Environmental Sciences; Springer Science + Business Media: New York, NY, USA, 1990; p. 288. ISBN 978-90-481-4060-2. [Google Scholar]
  42. Wigley, T.M.L.; Briffa, K.R.; Jones, P.D. On the average value of correlated time series, with applications in dendroclimatology and hydrometeorology. J. Clim. Appl. Meteorol. 1984, 23, 201–213. [Google Scholar] [CrossRef]
  43. Harris, I.; Jones, P.; Osborn, T.; Lister, D. Updated high-resolution grids of monthly climatic observations—The CRU TS3.10 Dataset. Int. J. Climatol. 2014, 623–642. [Google Scholar] [CrossRef] [Green Version]
  44. Chuchro, M.; Danek, M. Selection of optimal gridded dataset for application in Polish Sudetes Mountains. In Proceedings of the World Multidisciplinary Earth Sciences Symposium, Prague, Czech Republic, 3–7 September 2018. in press. [Google Scholar]
  45. Jolliffe, I.T. Principal Component Analysis, 2nd ed.; Springer Series in Statistics; Springer: New York, NY, USA, 2002; ISBN 0-387-95442-2. [Google Scholar]
  46. Richman, M.B. Rotation of principal components. J. Climatol. 1986, 6, 293–335. [Google Scholar] [CrossRef]
  47. Peterson, D.W.; Peterson, D.L.; Ettl, G.J. Growth responses of subalpine fir to climatic variability in the Pacific Northwest. Can. J. For. Res. 2002, 32, 1503–1517. [Google Scholar] [CrossRef]
  48. Carrer, M.; Nola, P.; Eduard, J.L.; Motta, R.; Urbinati, C. Regional variability of climate–growth relationships in Pinus cembra high elevation forests in the Alps. J. Ecol. 2007, 95, 1072–1083. [Google Scholar] [CrossRef]
  49. Büntgen, U.; Frank, D.C.; Kaczka, R.J.; Verstege, A.; Zwijacz-Kozica, T.; Esper, J. Growth responses to climate in a multi-species tree-ring network in the Western Carpathian Tatra Mountains, Poland and Slovakia. Tree Physiol. 2007, 27, 689–702. [Google Scholar] [CrossRef] [PubMed] [Green Version]
  50. Matuszkiewicz, W. Fitosocjologiczne podstawy typologii lasów Polski. Pr. Inst. Badaw. Leśn. 1978, 558, 3–39. [Google Scholar]
  51. Biondi, F.; Waikul, K. DENDROCLIM 2002: A C++ program for statistical calibration of climate signals in tree-ring chronologies. Comput. Geosci. 2004, 30, 303–311. [Google Scholar] [CrossRef]
  52. LeBlanc, D.C.; Stahle, D.W. Radial growth responses of four oak species to climate in eastern and central North America. Can. J. For. Res. 2015, 45, 793–804. [Google Scholar] [CrossRef]
  53. Vicente-Serrano, S.M.; Beguería, S.; López-Moreno, J.I. A multi-scalar drought index sensitive to global warming: The Standardized Precipitation Evapotranspiration Index–SPEI. J. Clim. 2010, 23, 1696–1718. [Google Scholar] [CrossRef]
  54. Grissino-Mayer, H.D. Evaluating crossdating accuracy: A manual and tutorial for the computer program COFECHA. Tree Ring Res. 2001, 57, 205–221. [Google Scholar]
  55. Pawlak, W. Atlas Śląska Dolnego i Opolskiego; Uniwersytet Wrocławski, Pracownia Atlasu Dolnego Śląska: Wrocław, Poland, 1997; p. 125. [Google Scholar]
  56. Rossi, S.; Deslauriers, A.; Anfodillo, T.; Carraro, V. Evidence of threshold temperatures for xylogenesis in conifers at high altitudes. Oecologia 2007, 152, 1–12. [Google Scholar] [CrossRef] [PubMed]
  57. Moser, L.; Fonti, P.; Büntgen, U.; Esper, J.; Luterbacher, J.; Franzen, J.; Frank, D. Timing and duration of European larch growing season along altitudinal gradients in the Swiss Alps. Tree Physiol. 2009, 30, 225–233. [Google Scholar] [CrossRef] [PubMed]
  58. Swidrak, I.; Schuster, R.; Oberhuber, W. Comparing growth phenology of co-occurring deciduous and evergreen conifers exposed to drought. Flora 2013, 208. [Google Scholar] [CrossRef]
  59. Chałupka, W.; Kosiński, G. Fizjologia wzrostu i rozwoju. In Modrzewie Larix Mill.; Białobok, S., Ed.; PWN: Warsaw/Poznan, Poland, 1986; pp. 173–213. [Google Scholar]
  60. Oribe, Y.; Kubo, T. Effect of heat on cambial reactivation during winter dormancy in evergreen and deciduous conifers. Tree Physiol. 1997, 17, 81–87. [Google Scholar] [CrossRef] [PubMed] [Green Version]
  61. Gričar, J.; Zupančič, M.; Čufar, K.; Koch, G.; Schmitt, U.; Oven, P. Effect of local heating and cooling on cambial activity and cell differentiation in the stem of Norway spruce (Picea abies). Ann. Bot. 2006, 97, 943–951. [Google Scholar] [CrossRef] [PubMed]
  62. Begum, S.; Kudo, K.; Rahman, M.H.; Nakaba, S.; Yamagishi, Y.; Nabeshima, E.; Nugroho, W.D.; Oribe, Y.; Kitin, P.; Jin, H.-O.; et al. Climate change and the regulation of wood formation in trees by temperature. Trees 2018, 32, 3–15. [Google Scholar] [CrossRef]
  63. Ermich, K. Zależność przyrostu drzew w Tatrach od wahań klimatycznych. Acta Soc. Bot. Pol. 1955, 24, 245–273. [Google Scholar]
  64. Koprowski, M. Long-term increase of March temperature has no negative impact on tree rings of European larch (Larix decidua) in lowland Poland. Trees 2012, 26, 1895–1903. [Google Scholar] [CrossRef]
  65. Vitas, A. A dendroclimatological analysis of European larch (Larix decidua Mill.) from Lithuania. Balt. For. 2015, 20, 65–72. [Google Scholar]
  66. Oleksyn, J.; Fritts, H. Influence of climatic factors upon tree rings of Larix decidua and L. decidua × L. kaempferi from Puławy, Poland. Trees-Struct. Funct. 1991, 5, 75–82. [Google Scholar] [CrossRef]
  67. Woś, A. Klimat Polski; Wydawn, Naukowe PWN: Warszawa, Poland, 1999; p. 301. [Google Scholar]
  68. Oleksyn, J.; Lorenc-Plucińska, G. Wymiana gazowa i gospodarka wodna. In Modrzewie Larix Mill.; Białobok, S., Ed.; PWN: Warsaw/Poznan, Poland, 1986; pp. 137–171. [Google Scholar]
  69. Olaczek, R. Zarys ekologii i fitocenologii. In Modrzewie Larix Mill.; Białobok, S., Ed.; PWN: Warsaw/Poznan, Poland, 1986; pp. 381–440. [Google Scholar]
  70. Anfodillo, T.; Rento, S.; Carraro, V.; Furlanetto, L.; Urbinati, C.; Carrer, M. Tree water relations and climatic variations at the alpine timberline: Seasonal changes of sap flux and xylem water potential in Larix decidua Miller, Picea abies (L.) Krast and Pinus cembra L. Ann. For. Sci. 1998, 55, 159–172. [Google Scholar] [CrossRef]
  71. Feliksik, E. Wpływ warunków klimatycznych na wielkość przyrostów radialnych modrzewia europejskiego (Larix decidua Mill.) występującego w Karpatach. Sylwan 1992, 136, 61–67. [Google Scholar]
  72. Feliksik, E.; Wilczyński, S. Wpływ warunków termicznych i pluwialnych na przyrost roczny modrzewi (Larix decidua Mill.). Sylwan 1998, 152, 85–90. [Google Scholar]
  73. Grudd, H.; Briffa, K.R.; Karlén, W.; Bartholin, T.S.; Jones, P.D.; Kromer, B. A 7400-year tree-ring chronology in northern Swedish Lapland: Natural climatic variability expressed on annual to millennial timescales. Holocene 2002, 12, 657–665. [Google Scholar] [CrossRef]
  74. Cooke, J.E.K.; Eriksson, M.E.; Junttila, O. The dynamic nature of bud dormancy in trees: Environmental control and molecular mechanisms. Plant Cell Environ. 2012, 35, 1707–1728. [Google Scholar] [CrossRef] [PubMed]
  75. Simak, M. Photo- and thermoperiodic responses of different larch provenances (Larix decidua Mill.). Stud. For. Suec. 1970, 86, 1–31. [Google Scholar]
  76. Heide, O.M. High autumn temperature delays spring bud burst in boreal trees, counterbalancing the effect of climatic warming. Tree Physiol. 2003, 23, 931–936. [Google Scholar] [CrossRef] [PubMed] [Green Version]
  77. Häkkinen, R.; Linkosalo, T.; Hari, P. Effects of dormancy and environmental factors on timing of bud burst in Betula pendula. Tree Physiol. 1998, 18, 707–712. [Google Scholar] [CrossRef] [PubMed] [Green Version]
  78. Wójcik, R.; Miętus, M. Niektóre cechy wieloletniej zmienności temperatury powietrza w Polsce (1951–2010). Prz. Geogr. 2014, 86, 339–364. [Google Scholar] [CrossRef]
  79. Łapińska, M.; Bednorz, E. Występowanie wiatrów fenowych w Karpatach i Sudetach na przykładzie dwóch stacji meteorologicznych—Kasprowego Wierchu i Śnieżki. Badania Fizjogr. Ser. A. Geogr. Fiz. 2013, 64, 121–135. [Google Scholar]
  80. Kwiatkowski, J. Zasięg fenów sudeckich i ich wpływ na mezoklimat regionów południowo-zachodniej i środkowej Polski. Prz. Geofiz. 1975, 20, 15–30. [Google Scholar]
  81. Service of Institute of Meteorology and Water Management, National Research Institute (IMGW-PIB), Poland. Available online: http://klimat.pogodynka.pl/pl/climate-maps (accessed on 14 June 2018).
  82. Blazejczyk, K. Climate and bioclimate of Poland. In Natural and Human Environment of Poland—A Geographical Overview; Degórski, M., Ed.; Polish Academy of Sciences, Institute of Geography and Spatial Organization Polish Geographical Society: Warsaw, Poland, 2006; pp. 31–48. [Google Scholar]
  83. Szwed, M. Variability of precipitation in Poland under climate change. Theor. Appl. Climatol. 2018, 1–13. [Google Scholar] [CrossRef] [Green Version]
  84. Okołowicz, W.; Martyn, D. Regiony klimatyczne. In Atlas Geograficzny Polski; Górski, H., Melnicka, P., Eds.; PPWK: Warszawa, Poland, 1984; p. 11. [Google Scholar]
  85. Błaś, M.; Sobik, M. Osobliwości klimatu Karkonoszy i Gór Izerskich. In Rola Stacji Terenowych w Badaniach Geograficznych; Krzemień, K., Trepińska, J., Bokwa, A., Eds.; Instytut Geografii i Gospodarki Przestrzennej UJ: Kraków, Poland, 2005; pp. 109–122. [Google Scholar]
  86. Degirmendžić, J.; Kożuchowski, K.; Żmudzka, E. Changes of air temperature and precipitation in Poland in the period 1951–2000 and their relationship to atmospheric circulation. Int. J. Climatol. 2004, 24, 291–310. [Google Scholar] [CrossRef] [Green Version]
  87. Michalska, B. Tendencje zmian temperatury powietrza w Polsce. Pr. Stud. Geogr. 2011, 47, 67–75. [Google Scholar]
  88. Wypych, A.; Sulikowska, A.; Ustrnul, Z.; Czekierda, D. Temporal variability of summer temperature extremes in Poland. Atmosphere 2017, 8, 51. [Google Scholar] [CrossRef]
  89. Leonelli, G.; Pelfini, M.; Battipaglia, G.; Cherubini, P. Site-aspect influence on climate sensitivity over time of a high-altitude Pinus cembra tree-ring network. Clim. Chang. 2009, 96, 185–201. [Google Scholar] [CrossRef]
  90. Montwé, D.; Isaac-Renton, M.; Hamann, A.; Spiecker, H. Cold adaptation recorded in tree rings highlights risks associated with climate change and assisted migration. Nat. Commun. 2018, 9, 1574. [Google Scholar] [CrossRef] [PubMed]
Figure 1. The study area and site locations. Climatic diagram based on data provided by IMGW-PIB, for the period 1951–2010. Map based on STM DEM [33].
Forests 09 00663 g001
Figure 2. Results of the PCA analysis (after Varimax rotation). Sites and clusters (C1–C4) are marked. (a) PC1 vs. PC2; (b) PC1 vs. PC3; (c) PC2 vs. PC3.
Forests 09 00663 g002aForests 09 00663 g002b
Figure 3. The relationship between the two first PCs and altitude. Sites and clusters are marked. (a) PC1; (b) PC2.
Forests 09 00663 g003
Figure 4. Matrix of Pearson’s correlation coefficients among the site chronologies calculated for the common period of 1925–2010. The altitudes of the sites are given in brackets.
Forests 09 00663 g004
Figure 5. Results of climate–growth relationship analysis. Correlations were calculated from May of the previous year (M-1) to September of the current year (S). Additionally, the mean values for particular clusters (as lines) are also presented as supplementary information; this shows general information about the clusters and changes of values from month to month. Filled shapes represent significant values with p ≤ 0.05; unfilled shapes denote insignificant values. (a) temperature and (b) precipitation.
Forests 09 00663 g005
Figure 6. Selected results of climate–growth relationship analysis plotted against altitude for selected months (filled shapes represent significant values with p ≤ 0.05, unfilled shapes denote insignificant values). (a) May temperature; (b) previous June temperature; (c) previous July temperature.
Forests 09 00663 g006
Figure 7. Results of the correlation between site chronologies and one-month SPEI. Correlations were calculated from May of the previous year (M-1) to September of the current year (S). Additionally, the mean values for particular clusters (lines) are also presented as supplementary information showing general information about the cluster and changes of values from month to month. Filled shapes represent significant values with p ≤ 0.05, unfilled shapes denote insignificant values.
Forests 09 00663 g007
Table 1. Characteristics of the sampled sites.
No.SiteLongitudeLatitudeAltitude [m a.s.l.]Slope AspectForest TypeSoil TypeNo. of Trees
1ls115°28′40.80″ E51°03′25.88″ N402flatUMFFcambisols16
2ls215°41′02.00″ E51°02′32.00″ N325NUMFFcambisols14
3sn115°41′05.99″ E50°47′36.53″ N646WMCMFFpodzols15
4sn215°40′43.81″ E50°47′24.64″ N709NE, near summitMMFFcambisols17
5zd116°29′23.10″ E50°25′02.00″ N486NE, slope flatteringMFFcambisols15
6zd216°27′53.50″ E50°23′55.00″ N499NWMFFpodzols15
7ba116°43′07.70″ E50°26′39.60″ N486NMFFcambisols15
8ba216°45′59.90″ E50°26′31.60″ N546SMFFcambisols15
9kp115°44′48.90″ E50°45′41.30″ N823E-ENMMFFarenosols20
10kp215°43′34.10″ E50°45′37.20″ N930N-NEMMFFarenosols20
11kp315°36′29.90″ E50°48′25.60″ N726SWMMFFarenosols20
12kp415°35′12.70″ E50°48′32.80″ N744N-NWMMFFarenosols20
13kp515°36′38.80″ E50°48′45.90″ N620NMMFFarenosols20
14kp615°45′40.20″ E50°45′33.70″ N752NEMMFFcambisols20
15wa116°07′57.60″ E50°40′22.70″ N604SE-SEEMMFFcambisols20
16wa216°22′00.60″ E50°38′44.40″ N706S-SSEMCMFFpodzols20
17wa316°27′56.50″ E50°41′49.80″ N658SWMMFFcambisols20
18sp115°37′13.80″ E50°53′43.30″ N543WMFFcambisols20
19sp215°30′54.20″ E50°49′08.50″ N717N-NWMMFFplanosols20
20sw115°21′31.90″ E50°53′30.20″ N606N-NWMMFFcambisols20
21sw215°29′09.20″ E50°57′36.90″ N469flatMMFFplanosols20
UMFF: upland mixed fresh forest; MCMFF: mountain coniferous mixed fresh forest; MFF: mountain fresh forest; MMFF: mountain mixed fresh forest (forest types classification after [50]).
Table 2. Characteristics and descriptive statistics for the constructed chronologies.
No.Site CodeClusterFull Period CoveredNumber of YearsNo. of Trees in ChronologyMSLAGR [mm]ACMSmRbar (30_15)mEPS (30_15)
1ls1C11851–2010160161251.6040.700.290.530.94
2ls2C11884–2010127121101.8110.730.300.570.96
3sn1C31857–2010154151251.2840.660.200.390.93
4sn2C31870–2010141131271.0900.750.190.530.96
5zd1C11850–2010161141481.7830.770.230.490.94
6zd2C11834–2010177121461.8110.760.240.480.94
7ba1C11897–201011414922.1940.630.290.510.96
8ba2C11912–20109914892.5670.700.200.440.95
9kp1C41893–2014122181091.6020.690.230.560.97
10kp2C41871–2014144191291.3630.770.240.550.98
11kp3C31881–2014134191111.5060.700.200.490.97
12kp4C41885–2014130151171.6580.650.220.530.97
13kp5C31866–2014149181331.2640.700.210.500.97
14kp6C41889–2014126201061.7980.610.240.570.98
15wa1C21915–201510119882.0090.660.230.530.97
16wa2C21894–2015122201091.8540.610.270.550.97
17wa3C21898–2015118201051.7420.650.270.610.98
18sp1C31919–20169820882.2830.570.270.530.98
19sp2C31866–2016151191341.3720.730.190.410.96
20sw1C21863–2016154171381.3090.620.200.420.95
21sw2C21925–20169219832.5470.650.230.460.97
Chronology statistics: Mean series length (MSL), average growth rate (AGR), and first-order serial autocorrelation (AC) were computed on the raw tree-ring series; mean sensitivity (MS), mean inter-series correlation (mRbar), and mean EPS (mEPS) were computed for residual versions of the indexed chronologies (30-year EPS window and 15-year lag). Cluster identification is provided.

