Long-Term Assessment of Selective Pruning of Quercus Species for Controlling Populations of Coraebus florentinus (Coleoptera: Buprestidae) in Mediterranean Forests


Abstract
:1. Introduction
2. Materials and Methods
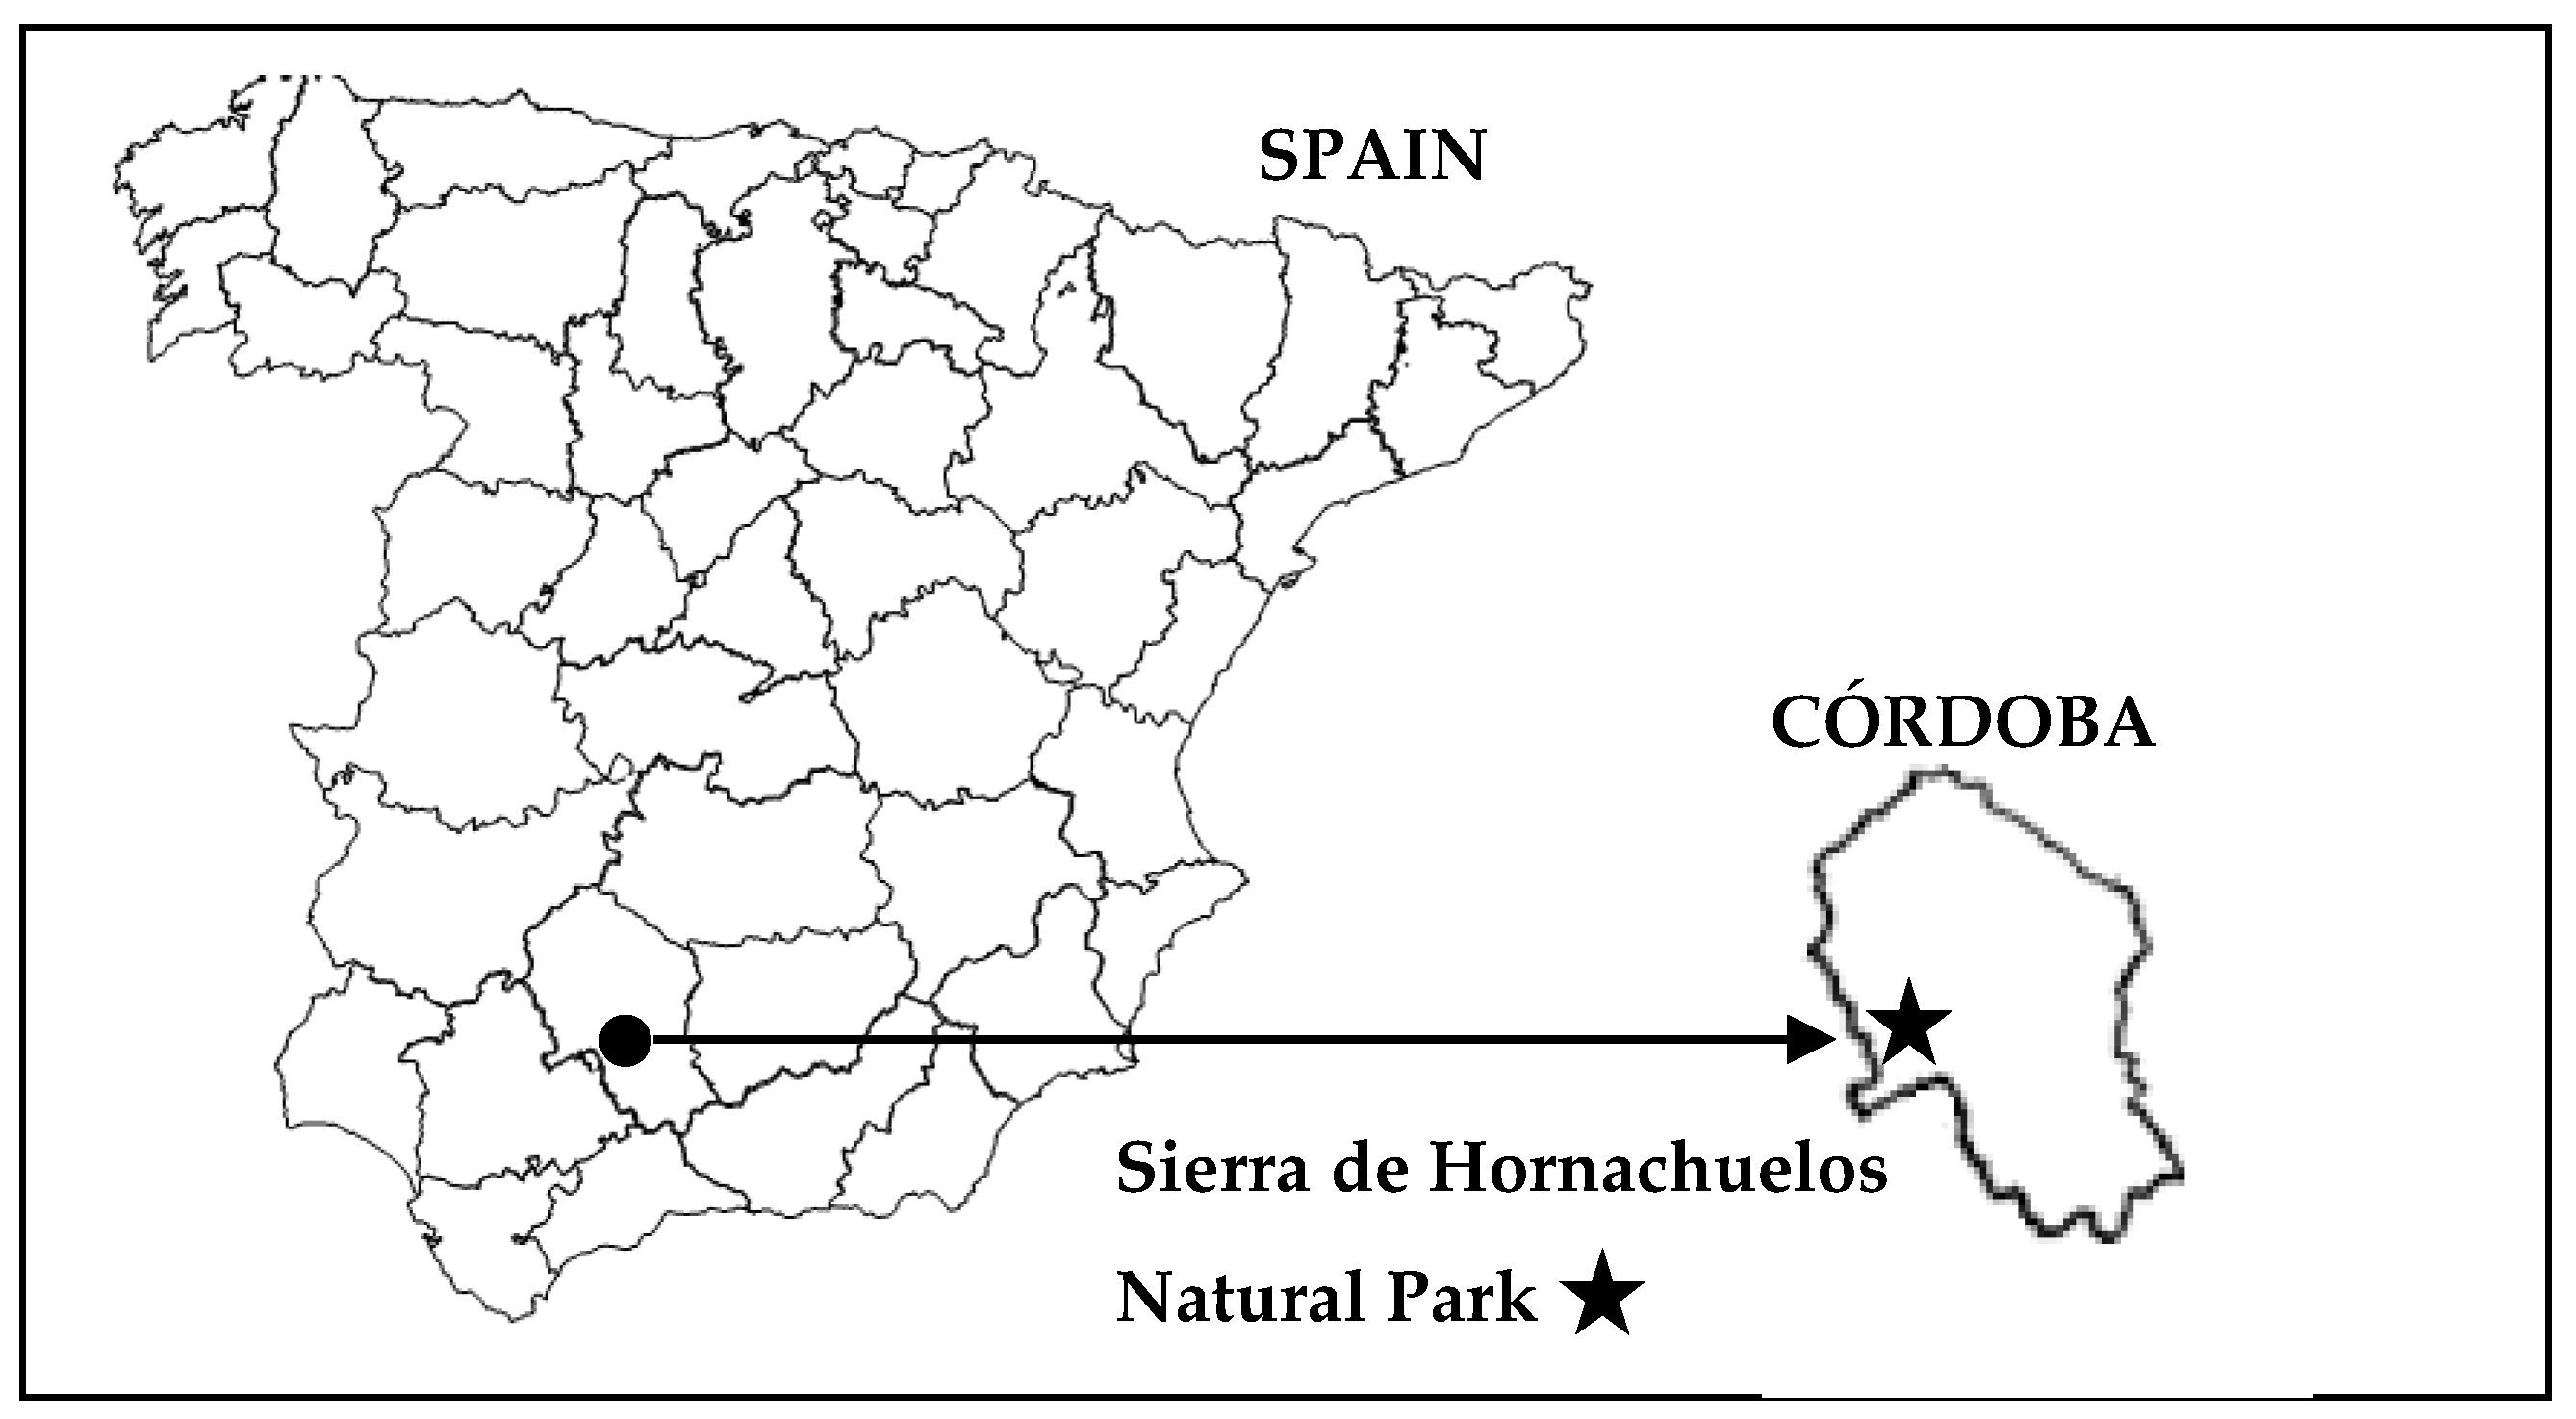
2.1. The Area
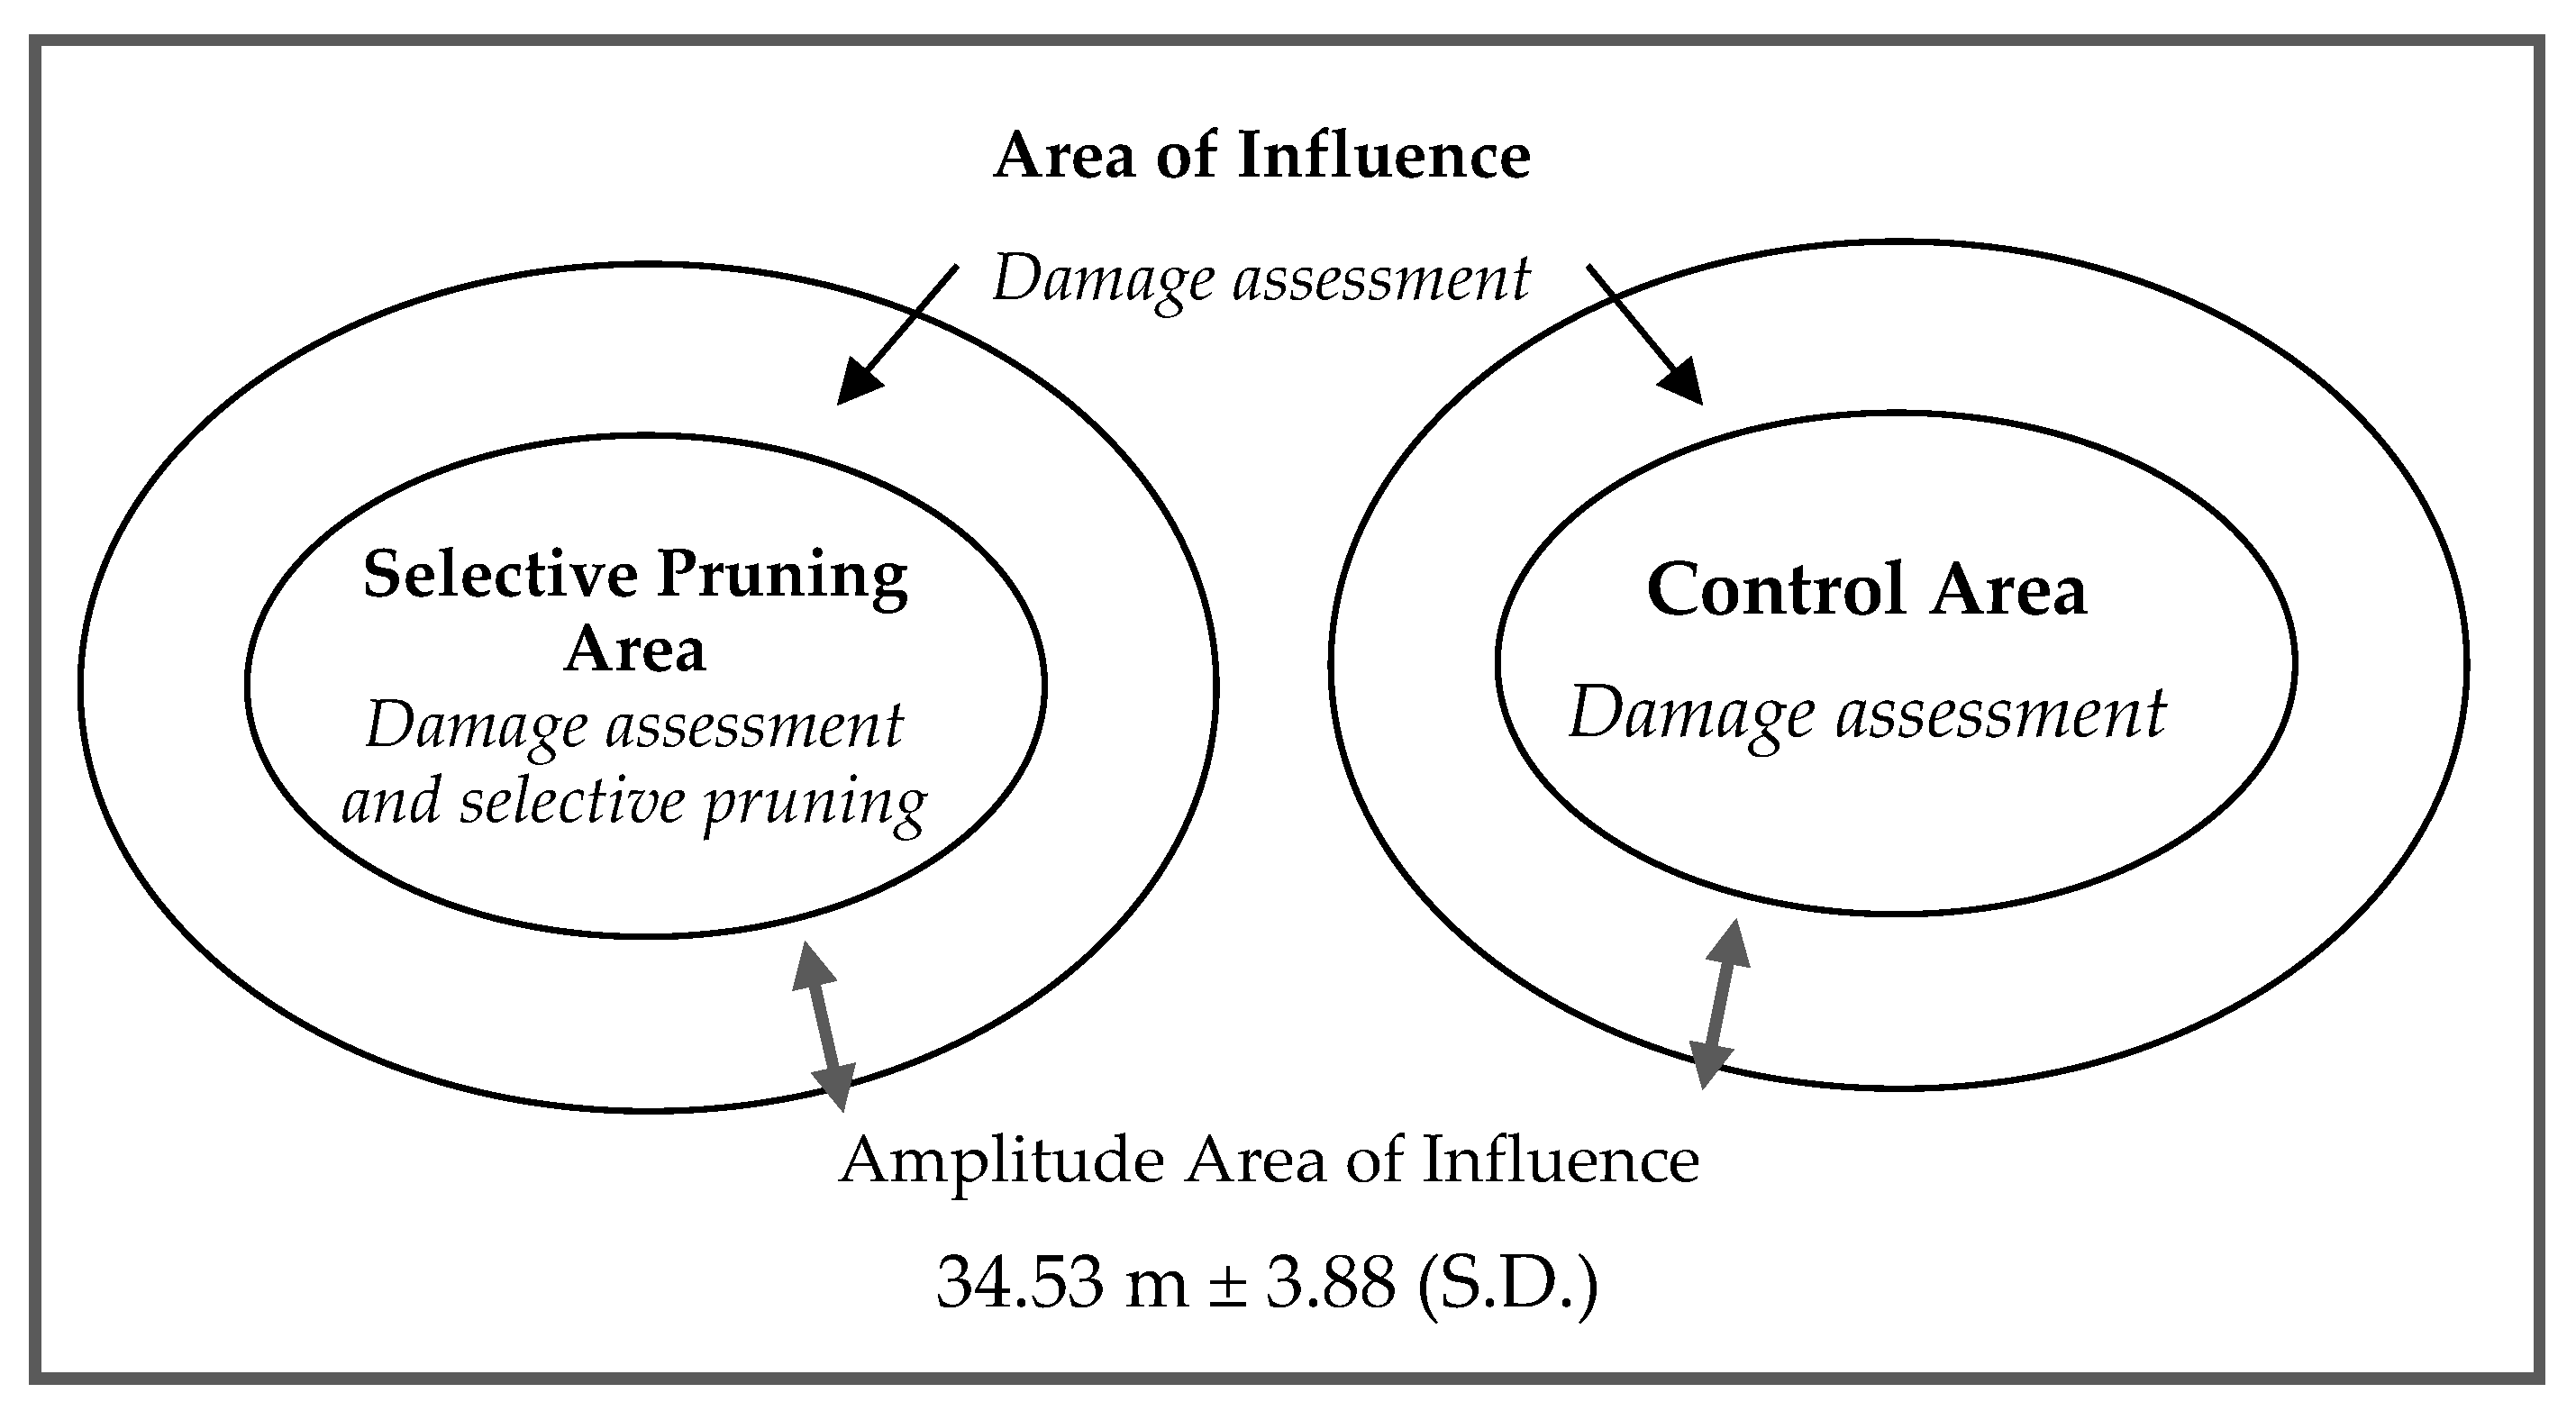
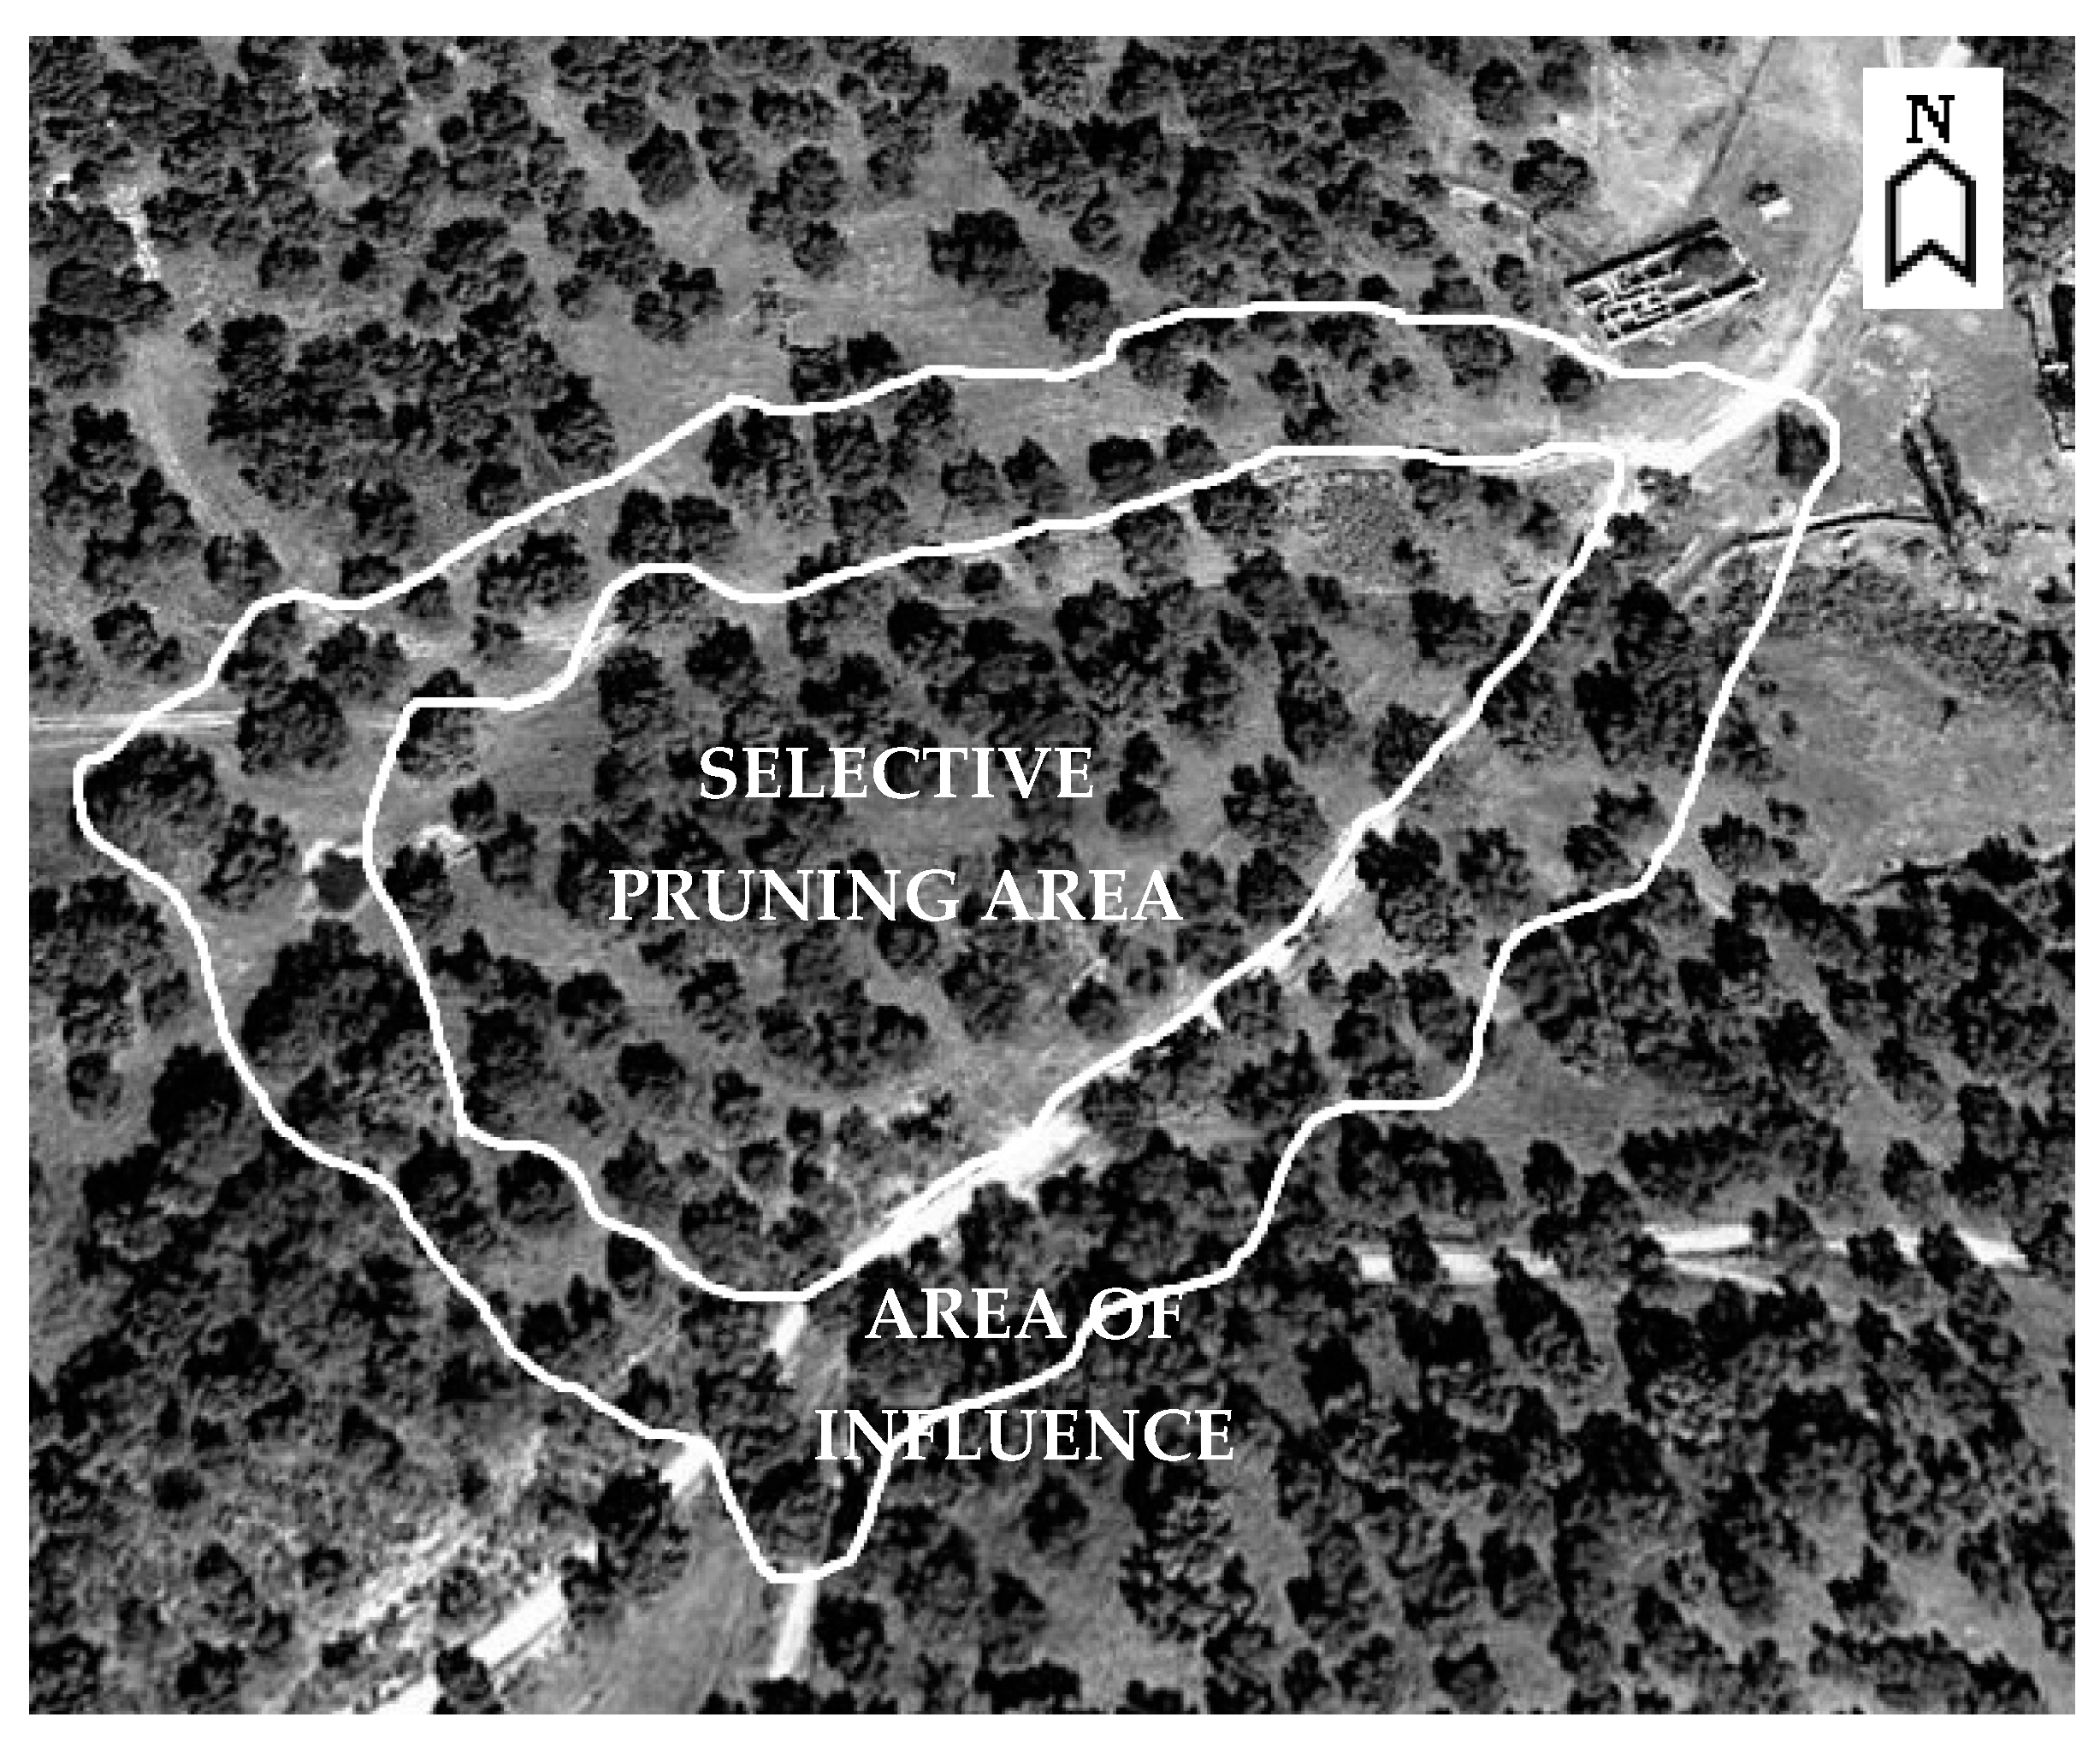
2.2. Field Work
2.3. Data Analysis
3. Results
3.1. Initial Incidence of Coraebus florentinus: Analysis of the Starting Situation
3.2. Incidence of Coraebus florentinus One Year after Selective Pruning: Short-Term Infestation
3.3. Incidence of Coraebus florentinus Five Years after Selective Pruning: Long-Term Infestation
4. Discussion
5. Conclusions
- -
- Selective pruning of branches affected by C. florentinus is an effective method for controlling the populations of this insect, reducing the IL by up to 50%.
- -
- To be most effective, pruning must be scheduled to take place before the emergence of adults, following the predictive models of emergence depending on inter-annual temperature variations.
- -
- This method of mechanical control is effective in both the short and long term, and the population reduction is appreciable not only in the pruned zone but also in the adjacent area.
- -
- The effectiveness of this control measure is independent of the IL by C. florentinus in the managed area.
- -
- The proven effectiveness of selective pruning to control this species warrants its inclusion among the management activities in Mediterranean oak forests as a preventive measure to avoid the foreseeable demographic explosion due to climate change.
Acknowledgments
Author Contributions
Conflicts of Interest
Appendix A

| P1 | ||
|---|---|---|
| Selective Pruning Area | Area of Influence | |
| Land | ||
| Surface | 1.82 ha | 1.54 ha |
| Orography | Hillside with medium slope | Hillside with variable slope |
| Orientation | South | South |
| Altitude | 426 m above sea level | 426 m above sea level |
| Vegetation | ||
| Shrubland composition | Cistus sp. L., Phlomis purpurea L., Lavandula stoechas L., Rubus ulmifolius Schott, Daphne gnidium L. | Cistus sp. L., P. purpurea L., L. stoechas, R. ulmifolius, D. gnidium, Genista hirsuta Vahl., Pistacia lentiscus L. |
| Canopy Cover Fraction | 5–25% | 50–75% |
| Woodland composition | Quercus ilex L. (80%), Q. suber L. (20%) | Q. ilex (87%), Q. suber (13%) |
| Average tree density | 76 trees/ha | 57 trees/ha |
| Average tree age | Mature trees (average ø = 36.1 ± 14.5 cm) | Mature trees (average ø = 36.04 ± 1.52 cm) |
| Average level of damage | 14.6% | 14.6% |
| Control Area | Area of Influence | |
| Land | ||
| Surface | 2.05 ha | 1.96 ha |
| Orography | Valley/hillside with variable slope | Valley/hillside with variable slope |
| Orientation | North/no dominant orientation | South/no dominant orientation |
| Altitude | 451 m above sea level | 451 m above sea level |
| Vegetation | ||
| Shrubland composition | Cistus sp., P. purpurea, R. ulmifolius, D. gnidium, P. lentiscus, Crataegus monogyna Jacq. | Cistus sp., L. stoechas, P. purpurea, R. ulmifolius, G. hirsuta, P. lentiscus, C. monogyna |
| Canopy Cover Fraction | 5–25% | 5–25% |
| Woodland composition | Q. ilex (72%), Q. suber (28%) | Q. ilex (80%), Q. suber (20%) |
| Average tree density | 55 tress/ha | 59 trees/ha |
| Average tree age | Mature trees (average ø = 44.24 ± 20.20 cm) | Mature trees (average ø = 42.46 ± 17.26 cm) |
| Average level of damage | 14.6% | 14.6% |
| P2 | ||
|---|---|---|
| Selective Pruning Area | Area of Influence | |
| Land | ||
| Surface | 1.14 ha | 1.59 ha |
| Orography | Hillside with low/medium slope | Hillside with medium slope |
| Orientation | South | South |
| Altitude | 541 m above sea level | 541 m above sea level |
| Vegetation | ||
| Shrub composition | Cistus sp., P. purpurea, R. ulmifolius, D. gnidium, G. hirsuta, P. lentiscus, Hedera helix L. | Cistus sp., P. purpurea, L. stoechas, R. ulmifolius, D. gnidium, G. hirsuta, P. lentiscus, Smilax aspera L., Rosmarinus officinalis L., Nerium oleander L. |
| Canopy Cover Fraction | 5–25% | 25–50% |
| Woodland composition | Q. ilex (95%), Q. suber (3%), Q. faginea Lam. (2%) | Q. ilex (72%), Q. suber (25%), Q. faginea (3%) |
| Average tree density | 71 trees/ha | 120 trees/ha |
| Average tree age | Young trees (average ø = 25.74 ± 11.30 cm) | Young trees (average ø = 23.89 ± 12.02 cm) |
| Average level of damage | 17.6% | 17.6% |
| Control Area | Area of Influence | |
| Land | ||
| Surface | 1.23 ha | 1.32 ha |
| Orography | Valley with low slope | Hillside with low slope |
| Orientation | No dominant orientation | No dominant orientation |
| Altitude | 511 m above sea level | 511 m above sea level |
| Vegetation | ||
| Shrubland composition | Cistus sp., P. purpurea, L. stoechas, G. hirsuta, Scirpus holoschoenus L. | Cistus sp., L. stoechas, P. purpurea, G. hirsuta, D. gnidium, S. holoschoenus |
| Canopy Cover Fraction | 25–50% | 5–25% |
| Woodland composition | Q. ilex (70%), Q. suber (30%) | Q. ilex (65%), Q. suber (35%) |
| Average tree density | 51 tress/ha | 49 trees/ha |
| Average tree age | Mature trees (average ø = 35.99 ± 14.57 cm) | Mature trees (average ø = 41.84 ± 18.25 cm) |
| Average level of damage | 17.6% | 17.6% |
| P3 | ||
|---|---|---|
| Selective Pruning Area | Area of Influence | |
| Land | ||
| Surface | 1.05 ha | 1.25 ha |
| Orography | Valley | Valley |
| Orientation | No dominant orientation | No dominant orientation |
| Altitude | 206 m above sea level | 206 m above sea level |
| Vegetation | ||
| Shrubland composition | Cistus sp., P. purpurea, D. gnidium, G. hirsuta, G. cinerea Vill., Retama sphaerocarpa L., P. lentiscus, P. terebinthus L., Asparagus sp. L. | Cistus sp., P. purpurea, D. gnidium, G. hirsuta, G. cinerea, R. sphaerocarpa, P. lentiscus, P. terebinthus, Asparagus sp., Phillyrea angustifolia L. |
| Canopy Cover Fraction | 75–100% | 75–100% |
| Woodland composition | Q. ilex (100%) | Q. ilex (100%) |
| Average tree density | 86 trees/ha | 89 trees/ha |
| Average tree age | Mature trees (average ø = 34.74 ± 7.69 cm) | Mature trees (average ø = 31.62 ± 9.15 cm) |
| Average level of damage | 33.5% | 33.5% |
| Control Area | Area of Influence | |
| Land | ||
| Surface | 1.24 ha | 1.36 ha |
| Orography | Valley | Valley |
| Orientation | No dominant orientation | No dominant orientation |
| Altitude | 197 m above sea level | 197 m above sea level |
| Vegetation | ||
| Shrubland composition | Cistus sp., P. purpurea, Asparagus sp., G. hirsuta, P. lentiscus, P. terebinthus, P. angustifolia | Cistus sp., P. purpurea, Asparagus sp., G. hirsuta, D. gnidium, R. sphaerocarpa, P. lentiscus, P. terebinthus, P. angustifolia |
| Canopy Cover Fraction | 75–100% | 75–100% |
| Woodland composition | Q. ilex (100%) | Q. ilex (100%) |
| Average tree density | 79 trees/ha | 82 trees/ha |
| Average tree age | Young trees (average ø = 26.03 ± 8.02 cm) | Young trees (average ø = 25.72 ± 7.86 cm) |
| Average level ofdamage | 33.5% | 33.5% |
| Date (DD-MM-YYYY) | Maximum Temperature | Minimum Temperature | Average Temperature |
|---|---|---|---|
| 01-04-2012 | 21.7 | 10.7 | 15.3 |
| 02-04-2012 | 19.0 | 12.1 | 14.6 |
| 03-04-2012 | 18.9 | 11.8 | 13.9 |
| 04-04-2012 | 16.5 | 11.5 | 13.7 |
| 05-04-2012 | 18.8 | 7.5 | 12.6 |
| 06-04-2012 | 14.7 | 4.9 | 9.3 |
| 07-04-2012 | 18.9 | 6.0 | 12.1 |
| 08-04-2012 | 23.3 | 5.3 | 14.5 |
| 09-04-2012 | 28.7 | 8.4 | 18.6 |
| 10-04-2012 | 21.7 | 10.6 | 16.4 |
| 11-04-2012 | 21.3 | 10.2 | 15.8 |
| 12-04-2012 | 19.3 | 10.4 | 14.1 |
| 13-04-2012 | 19.9 | 9.1 | 14.5 |
| 14-04-2012 | 18.9 | 10.0 | 13.2 |
| 15-04-2012 | 17.8 | 7.5 | 12.0 |
| 16-04-2012 | 19.5 | 7.2 | 13.6 |
| 17-04-2012 | 24.8 | 6.0 | 15.3 |
| 18-04-2012 | 20.3 | 10.6 | 15.0 |
| 19-04-2012 | 20.3 | 11.3 | 15.3 |
| 20-04-2012 | 21.1 | 11.1 | 16.3 |
| 21-04-2012 | 24.3 | 9.7 | 17.1 |
| 22-04-2012 | 24.9 | 12.1 | 18.2 |
| 23-04-2012 | 25.2 | 8.6 | 16.7 |
| 24-04-2012 | 24.3 | 11.0 | 17.1 |
| 25-04-2012 | 22.7 | 7.9 | 15.6 |
| 26-04-2012 | 23.2 | 13.7 | 17.5 |
| 27-04-2012 | 21.6 | 14.0 | 17.4 |
| 28-04-2012 | 17.8 | 9.1 | 12.9 |
| 29-04-2012 | 14.1 | 8.7 | 10.6 |
| 30-04-2012 | 17.7 | 6.7 | 12.1 |
| Years | 2012 | 2013 | 2017 | ||||||
|---|---|---|---|---|---|---|---|---|---|
| Plots | P1 | P2 | P3 | P1 | P2 | P3 | P1 | P2 | P3 |
| Verisimilitude Log | 17.44 | 15.10 | 19.02 | 19.20 | 20.10 | 20.10 | 17.67 | 16.71 | 21.62 |
| AIC | 23.44 | 21.10 | 25.02 | 25.21 | 26.10 | 26.10 | 23.67 | 22.71 | 27.62 |
| BIC | 18.54 | 16.20 | 20.12 | 20.31 | 21.20 | 21.20 | 18.77 | 17.81 | 22.72 |
References
- Cárdenas, A.M.; Gallardo, P. The effect of temperature on the preimaginal development of the Jewel beetle Coraebus florentinus (Coleoptera: Buprestidae). Eur. J. Entomol. 2012, 109, 21–28. [Google Scholar] [CrossRef]
- Cobos, A. Fauna Ibérica de Coleópteros Bupréstidos; Consejo Superior de Investigaciones Científicas: Madrid, Spain, 1986. [Google Scholar]
- Jurc, M.; Bojovic, S.; Komjanc, B.; Krč, J. Xylophagous entomofauna in branches of oaks (Quercus spp.) and its significance for oak health in the Karst region of Slovenia. Biologia 2009, 64, 130–138. [Google Scholar] [CrossRef]
- Fürstenau, B.; Rosell, G.; Guerrero, A.; Quero, C. Electrophysiological and behavioral responses of the black-banded oak borer, Coroebus florentinus, to conspecific and host-plant volatiles. J. Chem. Ecol. 2012, 38, 378–388. [Google Scholar] [CrossRef] [PubMed]
- Fernández de Cordova, J.; Cabezuelo, P. La “seca de ramillas” o “banderas” de la encina (Coroebusflorentinus Herbst). Distribución biológica y lucha mecánica en la provincia de Córdoba. Phytoma Esp. 1995, 71, 31–37. [Google Scholar]
- Kenis, M.; Hilszczanski, J. Natural enemies of Cerambycidae and Buprestidae infesting living trees. In Bark and Wood Boring Insects in Living Trees in Europe, a Synthesis; Lieutier, F., Day, K.R., Battisti, A., Gregoire, J.C., Evans, F.H., Eds.; Kluwer Academic Publishers: Dordrecht, The Netherlands, 2004; pp. 475–498. [Google Scholar]
- Lombardero, M.J.; Fernández de Ana Magán, F.J. Distribución y daños de Coroebus florentinus (Herbst) (Col., Buprestidae) en Galicia (NO de la Península Ibérica). Ecología 1996, 10, 499–508. [Google Scholar]
- Evans, H.F.; Moral, L.G.; Pajares, J.A. Biology, ecology and economic importance of Buprestidae and Cerambycidae. In Bark and Wood Boring Insects in Living Trees in Europe, a Synthesis; Lieutier, F., Day, R.K., Battisti, A., Gregoire, J.C., Evans, F.H., Eds.; Kluwer Academic Publishers: Dordrecht, The Netherlands, 2004; pp. 447–474. [Google Scholar]
- Cárdenas, A.M.; Gallardo, P. The effects of oviposition site on the development of the wood borer Coraebus florentinus (Coleoptera: Buprestidae). Eur. J. Entomol. 2013, 110, 135–144. [Google Scholar] [CrossRef]
- Pinilla, R. Plan de Ordenación de Recursos Naturales. Plan Rector de Uso y Gestión del Parque Natural de la Sierra de Hornachuelos; Consejería de Medio Ambiente, Junta de Andalucía: Sevilla, Spain, 2006. [Google Scholar]
- Gallardo, P.; Cárdenas, A.M.; Gaju, M. Ocurrence of Reticulitermes grassei (Isoptera: Rhinotermitidae) on cork oaks in the southern Iberian Peninsula: Identification, description and incidence of damage. Sociobiology 2010, 56, 675–687. [Google Scholar]
- Gallardo, P. Incidencia de Coleópteros Perforadores en Formaciones de Quercíneas del Suroeste Peninsular: Evaluación de Daños y Propuestas Para la Conservación. Ph.D. Thesis, University of Córdoba, Córdoba, Spain, 2011. [Google Scholar]
- Estaciones Agroclimáticas. Instituto de Investigación Y Formación Agraria Y Pesquera. Consejería de Agricultura Y Pesca. Junta de Andalucía. Available online: www.juntadeandalucia.es/agriculturaypesca/ifapa (accessed on 25 November 2017).
- Rodrigo, R.; Herranz, J.L. Actas de Reunión del Acuerdo de Encomienda de Gestión entre la Administración General del Estado, Ministerio de Medio Ambiente (Dirección General para la Biodiversidad-DGB) y el Consejo Superior de Investigaciones Científicas (CSIC) para el control biorracional de plagas del Género. Coraebus 2006, 85, 15. [Google Scholar]
- Solinas, M. Considerazioni ecologiche sul preoccupante sviluppo di Coroebus florentinus (Herbst) nelle leccete del Gargano. Entomologica 1971, 7, 115–121. [Google Scholar]
- Brechtel, F.; Kostenbader, H. Die Pracht- und Hirschkäfer Baden-Württembergs; Ulmer: Stuttgart, Germany, 2002. [Google Scholar]
- Zar, J.H. Biostatistical Analysis, 5th ed.; Prentice Hall: Upper Saddle River, NJ, USA, 1999; Available online: http://www.usgr.com/soil-sterilization (accessed on 8 November 2017).
- Bolker, B.M.; Brooks, M.E.; Clark, C.J.; Geange, S.W.; Poulsen, J.R.; Stevens, M.H.H.; White, J.S.S. Generalized linear mixed models: A practical guide for ecology and evolution. Trends Ecol. Evol. 2008, 24, 127–135. [Google Scholar] [CrossRef] [PubMed]
- SPSS Inc. SPSS 20.0 for Windows Use Manual (Version 20.0); SPSS Inc.: Chicago, IL, USA, 2011. [Google Scholar]
- Buse, J.; Griebeler, E.M.; Niehuis, M. Rising temperatures explain past immigration of the thermophilic oak-inhabiting beetle Coraebus florentinus (Coleoptera: Buprestidae) in south-west Germany. Biodivers. Conserv. 2013, 22, 1115–1131. [Google Scholar] [CrossRef]
- Verdugo, A. Fauna de Bupréstidos de la Península Ibérica y Baleares; Argania editio: Barcelona, Spain, 2005. [Google Scholar]
- Sallé, A.; Nageleisen, L.M.; Lieutier, F. Bark and wood boring insects involved in oak declives in Europe: Current knowledge and future prospects in a context of climate change. For. Ecol. Manag. 2014, 328, 79–93. [Google Scholar] [CrossRef]
- Hellrigl, K. Faunistik der Prachtkäfer von Südtirol (Coleoptera: Buprestidae). For. Obs. 2010, 5, 153–206. [Google Scholar]
- Reed, K.; Denman, S.; Leather, S.R.; Forster, J.; Inward, J.G. The lifecycle of Agrilus biguttatus: The role of temperature in its development and distribution, and implications for Acute Oak Decline. Agric. For. Entomol. 2017. [Google Scholar] [CrossRef]
- Soria, F.J.; Ocete, M. Estudios poblacionales sobre Coroebus florentinus (Herbst) (Col. Buprestidae). Boletín de Sanidad Vegetal Plagas 1993, 19, 27–35. [Google Scholar]
- Tiberi, R.; Branco, M.; Bracalini, M.; Croci, F.; Panzavolta, T. Cork oak pests: A review of insect damage and management. Ann. For. Sci. 2016, 73, 219–232. [Google Scholar] [CrossRef]
- O´Connor-Marer, P.J. Landscape Maintenance Pest Control (Pesticide Application Compendium); ANR Communication Services, University of California: Oakland, CA, USA, 2006. [Google Scholar]
- Angelo, M.J. The Law and Ecology of Pesticides and Pest Management; University of Florida Levin College of Law, USA; Routledge Taylor & Francis Group: London, UK; New York, NY, USA, 2016. [Google Scholar]
- Recalde, J.I.; San Martín, A.F. Coleópteros asociados a ramas de Quercus muertas por la acción del bupréstido Coraebus florentinus (Herbst, 1801) en la Navarra media. Heteropterus Rev. Entomol. 2003, 3, 43–50. [Google Scholar]
- Niehuis, M. Die Prachtkäfer in Rheinland-Pfalz und im Saarland; GNOR-Eigenverlag: Mainz, Germany, 2004. [Google Scholar]
- Gallardo, P.; Cárdenas, A.M. Long-term monitoring of saproxylic beetles from Mediterranean oak forests: An approach to the larval biology of the most representative species. J. Insect Conserv. 2016, 20, 1–11. [Google Scholar] [CrossRef]
- Schlaghamersky, J. Saproxylic invertebrates of foodplains, a particular endangered component of biodiversity. In Proceedings of the International Symposium Dead Wood: A Key to Biodiversity; Mason, F., Nardi, G., Tisato, M., Eds.; Mantova, Compagnia delle Foreste: Arezzo, Italy, 2003; pp. 15–80. [Google Scholar]
- Davies, Z.G.; Tyler, C.; Stewart, G.B.; Pullin, A.S. Are current management recommendations for saproxylic invertebrates effective? A systematic review. Biodivers. Conserv. 2008, 17, 209–234. [Google Scholar] [CrossRef]
- Dajoz, R. Entomología Forestal: Los Insectos y el Bosque; Mundi-Prensa: Madrid, Spain, 2001. [Google Scholar]
- Bouget, C.; Brustel, H.; Zagatti, P. The French information system on saproxylic beetle ecology (FRISBEE): An ecological and taxonomical database to help with the assessment of forest conservation status. Rev. Ecol. Terre Vie 2008, 10, 33–36. [Google Scholar]
- Quinto, J. Diversidad, Ecología y Conservación de Insectos Saproxílicos (Coleoptera y Diptera: Syrphidae) en Oquedades Arbóreas del Parque Nacional de Cabañeros (España). Ph.D. Thesis, University of Alicante, Alicante, Spain, 2013. [Google Scholar]

| Dates of Sampling | ||||||
|---|---|---|---|---|---|---|
| Years of Sampling | Selective Pruning Area | Area of Influence | ||||
| P1 | P2 | P3 | P1 | P2 | P3 | |
| 2012 | 16 April * | 26 April * | 20 April * | 10 July | 10 July | 10 July |
| 2013 | 27 May | 27 May | 14 May | 11 June | 10 June | 14 May |
| 2017 | 9 June | 15 June | 23 May | 9 June | 15 June | 23 May |
| Years of Sampling | Control Area | Area of Influence | ||||
| P1 | P2 | P3 | P1 | P2 | P3 | |
| 2012 | 12 June | 19 May | 9 May | 10 July | 12 June | 9 May |
| 2013 | 20 June | 28 June | 23 May | 28 June | 12 July | 23 May |
| 2017 | 9 June | 15 June | 30 May | 9 June | 15 June | 30 May |
| Sampling Plots 2012 | P1 | P2 | P3 | |||
|---|---|---|---|---|---|---|
| IL | PI | IL | PI | IL | PI | |
| Pruning Area | 12 | 1.25 | 14 | 1.64 | 34 | 1.26 |
| Area of Influence of Pruning Area | 18 | 1.23 | 10 | 1.20 | 24 | 1.29 |
| Control Area | 17 | 1.41 | 15 | 1.20 | 32 | 1.41 |
| Area of Influence of Control Area | 11 | 1.72 | 11 | 1.36 | 27 | 1.34 |
| Sampling Plots 2013 | P1 | P2 | P3 | |||
|---|---|---|---|---|---|---|
| IL | PI | IL | PI | IL | PI | |
| Pruning Area | 7 | 1.14 | 8 | 1.75 | 18 | 1.45 |
| Area of Influence of Pruning Area | 15 | 1.27 | 11 | 1.36 | 21 | 1.33 |
| Control Area | 15 | 1.14 | 17 | 1.53 | 30 | 1.54 |
| Area of Influence of Control Area | 18 | 1.28 | 20 | 1.20 | 27 | 1.48 |
| Sampling Plots Comparative 2012–2013 | P1 | P2 | P3 | |||
|---|---|---|---|---|---|---|
| P | Z | P | Z | P | Z | |
| Pruning Area | 0.842 | −0.200 | 0.671 | −0.424 | 0.192 | −1.303 |
| Area of Influence of Pruning Area | 0.559 | −0.585 | 0.636 | −0.474 | 0.407 | −0.828 |
| Control Area | 0.239 | −1.179 | 0.163 | −1.395 | 0.386 | −0.867 |
| Area of Influence of Control Area | 0.098 | −1.655 | 0.570 | −0.568 | 0.375 | −0.888 |
| Sampling Plots 2017 | P1 | P2 | P3 | |||
|---|---|---|---|---|---|---|
| IL | PI | IL | PI | IL | PI | |
| Pruning Area | 5 | 1 | 8 | 1 | 15 | 1.07 |
| Area of Influence of Pruning Area | 7 | 1.29 | 10 | 1.40 | 14 | 1.21 |
| Control Area | 11 | 1.09 | 13 | 1.46 | 28 | 1.46 |
| Area of Influence of Control Area | 13 | 1.31 | 15 | 1.07 | 25 | 1.48 |
| Sampling Plots Comparative 2012–2017 | P1 | P2 | P3 | |||
|---|---|---|---|---|---|---|
| P | Z | P | Z | P | Z | |
| Pruning Area | 0.347 | −0.941 | 0.063 | −1.861 | 0.218 | −1.233 |
| Area of Influence of Pruning Area | 0.572 | −0.565 | 0.549 | −0.600 | 0.983 | −0.021 |
| Control Area | 0.189 | −1.314 | 0.411 | −0.822 | 0.375 | −0.887 |
| Area of Influence of Control Area | 0.130 | −1.516 | 0.147 | −1.449 | 0.652 | −0.452 |
© 2018 by the authors. Licensee MDPI, Basel, Switzerland. This article is an open access article distributed under the terms and conditions of the Creative Commons Attribution (CC BY) license (http://creativecommons.org/licenses/by/4.0/).
Share and Cite
Gallardo, P.; Cárdenas, A.M.; Soriano, J.M. Long-Term Assessment of Selective Pruning of Quercus Species for Controlling Populations of Coraebus florentinus (Coleoptera: Buprestidae) in Mediterranean Forests. Forests 2018, 9, 49. https://doi.org/10.3390/f9020049
Gallardo P, Cárdenas AM, Soriano JM. Long-Term Assessment of Selective Pruning of Quercus Species for Controlling Populations of Coraebus florentinus (Coleoptera: Buprestidae) in Mediterranean Forests. Forests. 2018; 9(2):49. https://doi.org/10.3390/f9020049
Chicago/Turabian StyleGallardo, Patricia, Ana M. Cárdenas, and Juan M. Soriano. 2018. "Long-Term Assessment of Selective Pruning of Quercus Species for Controlling Populations of Coraebus florentinus (Coleoptera: Buprestidae) in Mediterranean Forests" Forests 9, no. 2: 49. https://doi.org/10.3390/f9020049
APA StyleGallardo, P., Cárdenas, A. M., & Soriano, J. M. (2018). Long-Term Assessment of Selective Pruning of Quercus Species for Controlling Populations of Coraebus florentinus (Coleoptera: Buprestidae) in Mediterranean Forests. Forests, 9(2), 49. https://doi.org/10.3390/f9020049