Coleopteran Communities Associated with Forests Invaded by Emerald Ash Borer

Abstract
:1. Introduction
2. Materials and Methods
2.1. Study Sites
2.2. Arthropod Monitoring
2.3. Analysis
3. Results
3.1. Study Sites
3.2. Arthropods
4. Discussion
5. Conclusions
Acknowledgments
Author Contributions
Conflicts of Interest
Appendix A

| Coleopteran Families | Trophic Guilds | Abundance | |||||
|---|---|---|---|---|---|---|---|
| Fayette | Spencer | Shelby | Anderson | Henry | Total | ||
| Elateridae | H | 205 | 345 | 678 | 353 | 240 | 1821 |
| Chrysomelidae | H | 127 | 176 | 272 | 56 | 55 | 686 |
| Curculionidae | H | 81 | 127 | 154 | 99 | 113 | 574 |
| Tenebrionidae | H | 94 | 83 | 142 | 54 | 154 | 527 |
| Mordellidae | H | 48 | 103 | 148 | 75 | 59 | 433 |
| Scarabaeidae | H | 20 | 24 | 20 | 23 | 23 | 110 |
| Phalacridae | H | 2 | 5 | 26 | 6 | 12 | 51 |
| Attelabidae | H | 0 | 0 | 2 | 0 | 3 | 5 |
| Latridiidae | F | 141 | 33 | 274 | 230 | 340 | 1018 |
| Corylophidae | F | 21 | 2 | 73 | 41 | 94 | 231 |
| Ptinidae | F | 16 | 47 | 38 | 36 | 13 | 150 |
| Eucnemidae | F | 16 | 50 | 33 | 39 | 8 | 146 |
| Erotylidae | F | 14 | 14 | 8 | 16 | 17 | 69 |
| Mycetophagidae | F | 22 | 5 | 16 | 6 | 10 | 59 |
| Tetratomidae | F | 3 | 12 | 7 | 21 | 15 | 58 |
| Nitidulidae | F | 7 | 13 | 11 | 11 | 13 | 55 |
| Cerylonidae | F | 15 | 4 | 8 | 13 | 7 | 47 |
| Zopheridae | F | 6 | 10 | 5 | 13 | 5 | 39 |
| Silvanidae | F | 1 | 22 | 1 | 6 | 7 | 37 |
| Melandryidae | F | 5 | 11 | 10 | 6 | 4 | 36 |
| Synchroidae | F | 4 | 4 | 6 | 9 | 9 | 32 |
| Endomychidae | F | 7 | 1 | 6 | 4 | 4 | 22 |
| Leiodidae | F | 5 | 2 | 3 | 8 | 4 | 22 |
| Cryptophagidae | F | 0 | 1 | 4 | 3 | 0 | 8 |
| Laemophloeidae | F | 3 | 1 | 1 | 2 | 1 | 8 |
| Anthribidae | F | 4 | 1 | 0 | 1 | 0 | 6 |
| Cucujidae | F | 0 | 0 | 1 | 1 | 0 | 2 |
| Pyrochoidae | F | 0 | 0 | 1 | 0 | 1 | 2 |
| Sphindidae | F | 0 | 0 | 1 | 1 | 0 | 2 |
| Throscidae | F | 0 | 1 | 0 | 0 | 1 | 2 |
| Salpingidae | F | 1 | 0 | 0 | 0 | 0 | 1 |
| Staphylinidae | P | 225 | 224 | 356 | 443 | 192 | 1440 |
| Histeridae | P | 188 | 316 | 141 | 204 | 136 | 985 |
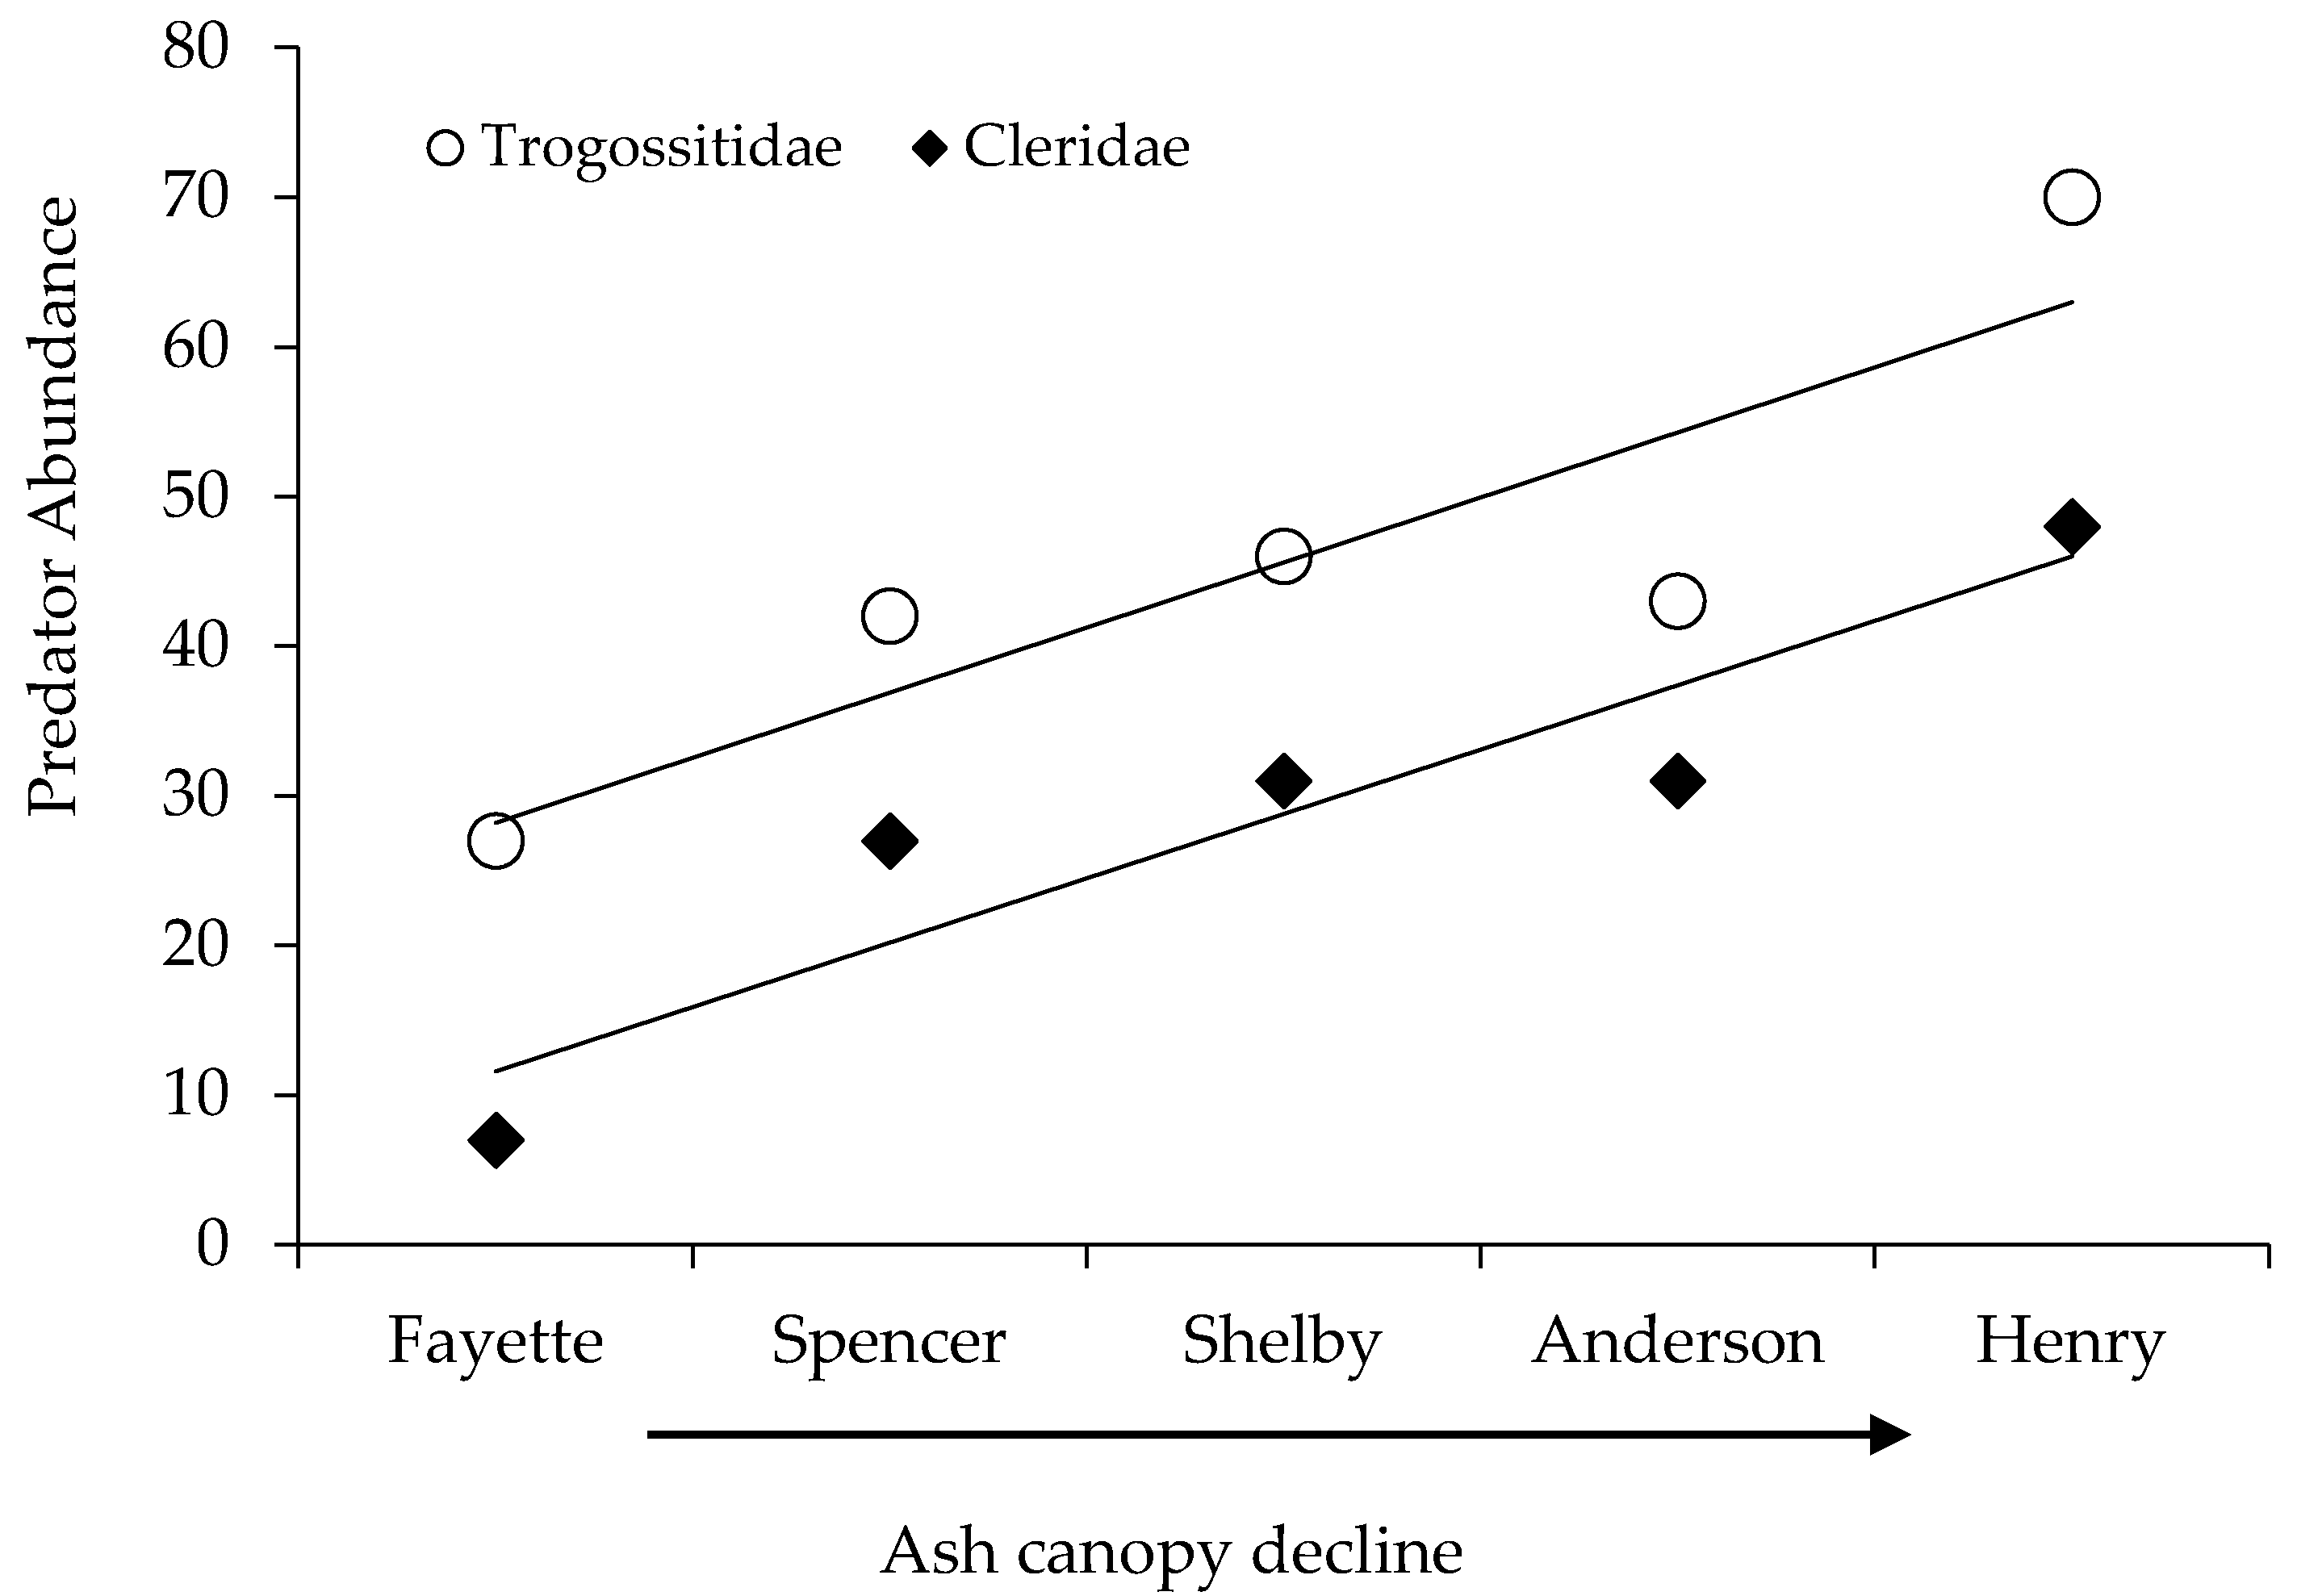
| Trogossitidae | P | 27 | 42 | 46 | 43 | 70 | 228 |
| Carabidae | P | 16 | 20 | 63 | 43 | 34 | 176 |
| Cleridae | P | 7 | 27 | 31 | 31 | 48 | 144 |
| Lampyridae | P | 3 | 14 | 14 | 13 | 4 | 48 |
| Coccinellidae | P | 5 | 7 | 4 | 0 | 2 | 18 |
| Melyridae | P | 1 | 0 | 1 | 0 | 4 | 6 |
| Cantharidae | P | 0 | 2 | 1 | 0 | 0 | 3 |
| Hydrophilidae | P | 0 | 1 | 0 | 0 | 0 | 1 |
| Lycidae | P | 0 | 0 | 0 | 1 | 0 | 1 |
| Ptilodactylidae | S | 139 | 131 | 480 | 266 | 40 | 1056 |
| Dermestidae | S | 7 | 26 | 1 | 6 | 7 | 47 |
| Monotomidae | S | 2 | 6 | 0 | 0 | 0 | 8 |
| Scirtidae | S | 0 | 1 | 0 | 3 | 0 | 4 |
| Hybosoridae | S | 2 | 0 | 0 | 1 | 0 | 3 |
| Silphidae | S | 0 | |||||
| Scolytinae | X | 168 | 465 | 107 | 117 | 134 | 991 |
| Scraptiidae | X | 1 | 1 | 8 | 24 | 53 | 87 |
| Cerambycidae | X | 6 | 13 | 12 | 19 | 24 | 74 |
| Bostrichidae | X | 1 | 5 | 2 | 0 | 3 | 11 |
| Buprestidae | X | 0 | 0 | 2 | 2 | 5 | 9 |
| Lucanidae | X | 0 | 0 | 0 | 1 | 0 | 1 |
| Lymexylidae | X | 0 | 0 | 0 | 1 | 0 | 1 |
| Passandridae | Pa | 21 | 13 | 14 | 16 | 14 | 78 |
| Rhipiceridae | Pa | 1 | 0 | 0 | 1 | 2 | 4 |
| Bothrideridae | Pa | 0 | 3 | 0 | 0 | 0 | 3 |
| Unidentified | -- | 33 | 22 | 9 | 21 | 15 | 100 |
| Total | 1721 | 2436 | 3241 | 2389 | 1999 | 11,786 | |
References
- Ehrenfeld, J.G. Ecosystem consequences of biological invasions. Annu. Rev. Ecol. Syst. 2010, 41, 59–80. [Google Scholar] [CrossRef]
- Wilcove, D.S.; Rothstein, D.; Dubow, J.; Phillips, A.; Losos, E. Quantifying threats to imperiled species in the United States: Assessing the relative importance of habitat destruction, alien species, pollution, overexploitation, and disease. Bioscience 1998, 48, 607–615. [Google Scholar] [CrossRef]
- Byers, J.E.; Reichard, S.; Randall, J.M.; Parker, I.M.; Smith, C.S.; Lonsdale, W.M.; Atkinson, I.A.; Seastedt, T.R.; Williamson, M.; Chornesky, E. Directing research to reduce the impacts of nonindigenous species. Conserv. Biol. 2002, 16, 630–640. [Google Scholar] [CrossRef]
- Pimentel, D.; Zuniga, R.; Morrison, D. Update on the environmental and economic costs associated with alien-invasive species in the United States. Ecol. Econ. 2005, 52, 273–288. [Google Scholar] [CrossRef]
- Aukema, J.E.; Leung, B.; Kovacs, K.; Chivers, C.; Britton, K.O.; Englin, J.; Frankel, S.J.; Haight, R.G.; Holmes, T.P.; Liebhold, A.M. Economic impacts of non-native forest insects in the continental United States. PLoS ONE 2011, 6, e24587. [Google Scholar] [CrossRef] [PubMed]
- Kennedy, H.E., Jr. Fraxinus pennsylvanica Marsh. Green ash. In Silvics of North America: Volume 2, Hardwoods; Burns, R.M., Honkala, B.H., Eds.; Agricultural Handbook 654; USDA Forest Service: Washington, DC, USA, 1990; pp. 348–354. [Google Scholar]
- Schlesinger, R.C. Fraxinus americana L. white ash. In Silvics of North America: Volume 2, Hardwoods; Burns, R.M., Honkala, B.H., Eds.; Agricultural Handbook 654; USDA Forest Service: Washington, DC, USA, 1990; pp. 654–665. [Google Scholar]
- Haack, R.A.; Jendak, E.; Houping, L.; Marchant, K.R.; Petrice, T.R.; Poland, T.M.; Ye, H. The emerald ash borer: A new exotic pest in North America. Newsl. Mich. Entomol. Soc. 2002, 47, 1–5. [Google Scholar]
- USDA APHIS. USDA Animal and Plant Health Inspection Service Cooperative Emerald Ash Borer Project: Initial County EAB Detections in North America. 2017. Available online: http://www.emeraldashborer.info/files/MultiState_EABpos.pdf (accessed on 12 December 2017).
- Cappaert, D.D.; McCullough, D.G.; Poland, T.M.; Siegert, N.W. Emerald ash borer in North America: A research and regulatory challenge. Am. Entomol. 2005, 51, 152–165. [Google Scholar] [CrossRef]
- Flower, C.E.; Knight, K.S.; Rebbeck, J.; Gonzalez-Meler, M.A. The relationship between the emerald ash borer (Agrilus planipennis) and ash (Fraxinus spp.) tree decline: Using visual canopy condition assessments and leaf isotope measurements to assess pest damage. For. Ecol. Manag. 2013, 303, 143–147. [Google Scholar] [CrossRef]
- Poland, T.M.; McCullough, D.G. Emerald ash borer: Invasion of the urban forest and the threat to North America’s ash resource. J. For. 2006, 104, 118–124. [Google Scholar]
- Kashian, D.M.; Witter, J.A. Assessing the potential for ash canopy tree replacement via current regeneration following emerald ash borer-caused mortality on southeastern Michigan landscapes. For. Ecol. Manag. 2011, 261, 480–488. [Google Scholar] [CrossRef]
- Gandhi, K.J.K.; Herms, D.A. Direct and indirect effects of alien insect herbivores on ecological processes and interactions in forests of eastern North America. Biol. Invasions 2010, 12, 389–405. [Google Scholar] [CrossRef]
- Gandhi, K.J.K.; Herms, D.A. North American arthropods at risk due to widespread Fraxinus mortality caused by the alien emerald ash borer. Biol. Invasions 2010, 12, 1839–1846. [Google Scholar] [CrossRef]
- Flower, C.E.; Knight, K.S.; Gonzalez-Meler, M.A. Impacts of the emerald ash borer (Agrilus planipennis Fairmaire) induced ash (Fraxinus spp.) mortality on forest carbon cycling and successional dynamics in the eastern United States. Biol. Invasions 2013, 5, 931–944. [Google Scholar] [CrossRef]
- Levin-Nielsen, A.; Rieske, L.K. Evaluating Short Term Simulations of a Forest Stand Invaded by Emerald Ash Borer. iForest 2014, e1–e6. [Google Scholar] [CrossRef]
- Klooster, W.S.; Herms, D.A.; Knight, K.S.; Herms, C.P.; McCullough, D.G.; Smith, A.; Gandhi, K.J.K.; Cardina, J. Ash (Fraxinus spp.) mortality, regeneration, and seed bank dynamics in mixed hardwood forests following invasion by emerald ash borer (Agrilus planipennis). Biol. Invasions 2014, 16, 859–873. [Google Scholar] [CrossRef]
- Perkins, T.D.; Vogelmann, H.W.; Klein, R.M. Changes in light intensity and soil temperature as a result of forest decline on Camels Hump, Vermont. Can. J. For. Res. 1987, 17, 565–568. [Google Scholar] [CrossRef]
- Zhang, Q.; Liang, Y. Effects of gap size on nutrient release from plant litter decomposition in a natural forest ecosystem. Can. J. For. Res. 1995, 25, 1627–1638. [Google Scholar] [CrossRef]
- Ulyshen, M.D.; Klooster, W.S.; Barrington, W.T.; Herms, D.A. Impacts of emerald ash borer-induced tree mortality on leaf litter arthropods and exotic earthworms. Pedobiologia 2011, 54, 261–265. [Google Scholar] [CrossRef]
- Perry, K.I.; Herms, D.A. Effects of late stages of emerald ash borer (Coleoptera: Buprestidae)-induced ash mortality on forest floor invertebrate communities. J. Insect Sci. 2017, 119, 1–10. [Google Scholar] [CrossRef]
- Rainio, J.; Niemelä, J. Ground beetles (Coleoptera: Carabidae) as bioindicators. Biodivers. Conserv. 2003, 12, 487–506. [Google Scholar] [CrossRef]
- Pearce, J.L.; Venier, L.A. The use of ground beetles (Coleoptera: Carabida) and spiders (Araneae) as biodindicators of sustainable forest management: A review. Ecol. Indic. 2006, 6, 780–793. [Google Scholar] [CrossRef]
- Gandhi, K.J.K.; Smith, A.; Hartzler, D.M.; Herms, D.A. Indirect effects of emerald ash borer-induced ash mortality and canopy gap formation on epigaeic beetles. Environ. Entomol. 2014, 43, 546–555. [Google Scholar] [CrossRef] [PubMed]
- Perry, K.I.; Herms, D.A. Short-term responses of ground beetles to forest changes caused by early stages of emerald ash borer (Coleoptera: Buprestidae)-induced ash mortality. Environ. Entomol. 2016, 45, 616–626. [Google Scholar] [CrossRef] [PubMed]
- Davidson, W.; Rieske, L.K. Native parasitoid response to emerald ash borer (Coleoptera: Buprestidae) and ash decline in recently invaded forests of the central United States. Ann. Entomol. Soc. Am. 2015, 108, 777–784. [Google Scholar] [CrossRef]
- Wharton, M.E.; Barbour, R.W. Trees and Shrubs of Kentucky; University Press of Kentucky: Lexington, KY, USA, 1973. [Google Scholar]
- Campbell, J.J. Historical evidence of forest composition in the Bluegrass Region of Kentucky. In Proceedings of the Seventh Central Hardwood Forest Conference, Carbondale, IL, USA, 5–8 March 1989; Rink, G., Budelsky, C., Eds.; General Technical Report, NC-135. Department of Agriculture, Forest Service, North Central Forest Experiment Station: St. Paul, MN, USA, 1989; pp. 231–246. [Google Scholar]
- Montgomery, M.E.; Wargo, P.M. Ethanol and other host-derived volatiles as attractants to beetles that bore into hardwoods. J. Chem. Ecol. 1983, 9, 181–190. [Google Scholar] [CrossRef] [PubMed]
- Lindelöw, Å.; Risberg, B.; Sjödin, K. Attraction during flight of scolytids and other bark- and wood-dwelling beetles to volatiles from fresh and stored spruce wood. Can. J. For. Res. 1992, 22, 224–228. [Google Scholar] [CrossRef]
- Bouget, C.; Brustel, H.; Brin, A.; Valladares, L. Evaluation of window flight traps for effectiveness at monitoring dead wood-associated beetles: The effect of ethanol lure under contrasting environmental conditions. Agric. For. Entomol. 2009, 11, 143–152. [Google Scholar] [CrossRef]
- Triplehorn, C.A.; Johnson, N.F. Borror and DeLong’s Introduction to the Study of Insects; Brooks/Cole: Belmont, CA, USA, 2005; p. 888. [Google Scholar]
- Marshall, S.A. Insects: Their Natural History and Diversity—With a Photographic Guide to Insects of Eastern North America; Firefly Books: Buffalo, NY, USA, 2006; p. 736. [Google Scholar]
- Evans, A.V. Beetles of Eastern North America; Princeton University Press: Princeton, NJ, USA, 2014; p. 560. [Google Scholar]
- BugGuide. Order Coleoptera: Beetles. Available online: http://bugguide.net/node/view/60/tree (accessed on 1 March 2017).
- Hammond, P.M. Insect abundance and diversity in the Dumoga-Bone National Park, N. Sulawesi, with special reference to the beetle fauna of lowland rain forest in the Toraut region. In Insects and the Rain Forests of South East Asia (Wallacea); Knight, W.J., Holloway, J.D., Eds.; Royal Entomological Society of London: London, UK, 1990; pp. 197–254. [Google Scholar]
- Ellis, D. Taxonomic sufficiency in pollution assessment. Marine Poll. Bull. 1985, 16, 459. [Google Scholar] [CrossRef]
- Birkhofer, K.; Bezemer, T.; Hedlund, K.; Setälä, H. Community composition of soil organisms under different wheat-farming systems. In Microbial Ecology in Sustainable Agroecosystems; Cheeke, T., Coleman, D., Wall, D., Eds.; CRC Press: Boca Raton, FL, USA, 2012; pp. 89–111. [Google Scholar]
- Hoback, W.W.; Svatos, T.M.; Spomer, S.M.; Higley, L.G. Trap color and placement effects estimates of insect family-level abundance and diversity in a Nebraska salt marsh. Entomol. Exp. Appl. 1999, 91, 393–402. [Google Scholar] [CrossRef]
- Riggins, J.J.; Davis, C.A.; Hoback, W.W. Biodiversity of belowground invertebrates as an indicator of wet meadow restoration success (Platte River, Nebraska). Restor. Ecol. 2009, 17, 495–505. [Google Scholar] [CrossRef]
- Rohr, J.R.; Mahan, C.G.; Kim, K.C. Response of arthropod biodiversity to foundation species declines: The case of the eastern hemlock. For. Ecol. Manag. 2009, 258, 1503–1510. [Google Scholar] [CrossRef]
- Adkins, J.K.; Rieske, L.K. Loss of a foundation forest species due to an exotic invader impacts terrestrial arthropod communities. For Ecol. Manag. 2013, 295, 126–135. [Google Scholar] [CrossRef]
- Hammond, P.M. Species Inventory. In Global Biodiversity: Status of the Earth’s Living Resources; Groombridge, B., Ed.; Chapman and Hall: London, UK, 1992; pp. 17–39. [Google Scholar]
- Root, R.B. The niche exploitation pattern of the blue-gray gnatcatcher. Ecol. Monogr. 1967, 37, 317–350. [Google Scholar] [CrossRef]
- Smith, B.; Wilson, J.B. A consumer’s guide to evenness indices. Oikos 1996, 76, 70–82. [Google Scholar] [CrossRef]
- SAS Institute. SAS/IML 9.3 User’s Guide; SAS Institute: Cary, NC, USA, 2011. [Google Scholar]
- Kimmerer, T.W.; Kozlowski, T.T. Ethylene, ethane, acetaldehyde, and ethanol production by plants under stress. Plant Physiol. 1982, 69, 840–847. [Google Scholar] [CrossRef] [PubMed]
- Harmon, M.E.; Franklin, J.F.; Swanson, F.J.; Sollins, P.; Gregory, S.V.; Lattin, J.D.; Anderson, N.H.; Cline, S.P.; Aumen, N.G.; Sedell, J.R. Ecology of coarse woody debris in temperate ecosystems. Adv. Ecol. Res. 1986, 15, 302. [Google Scholar]
- Bauer, L.S.; Liu, H.; Haack, R.A.; Petrice, T.R.; Miller, D.L. Natural enemies of emerald ash borer in southeastern Michigan. In Proceedings of the Emerald Ash Borer Research and Technology Development Meeting, Port Huron, MI, USA, 30 September–1 October 2003; Mastro, V., Reardon, R., Eds.; Comps. USDA Forest Service, Forest Health Technology Enterprise Team: Morgantown, WV, USA, 2004; pp. 33–34. [Google Scholar]
- Williams, P.H.; Gaston, K.J. Measuring more of biodiversity: Can higher-taxon richness predict wholesale species richness? Biol. Conserv. 1994, 67, 211–217. [Google Scholar] [CrossRef]
- Balmford, A.; Jayasuriya, A.H.M.; Green, M.J.B. Using higher-taxon richness as a surrogate for species richness: II. Local applications. Proc. Biol. Sci. 1996, 263, 1571–1575. [Google Scholar] [CrossRef]
- Hilsenhoff, W.L. Rapid field assessment of organic pollution with a family level biotic index. J. N. Am. Benthol. Soc. 1988, 7, 65–68. [Google Scholar] [CrossRef]
- Barbour, M.T.; Gerritsen, J.; Snyder, B.D.; Stribling, J.B. Rapid Bioassessment Protocols for Use in Streams and Wadeable Rivers: Periphyton, Benthic Macroinvertebrates and Fish, 2nd ed.; U.S. Environmental Protection Agency, Office of Water: Washington, DC, USA, 1999.
- Bailey, R.C.; Norris, R.H.; Reynoldson, T.B. Taxonomic resolution of benthic macroinvertebrate communities. J. N. Am. Benthol. Soc. 2001, 20, 280–286. [Google Scholar] [CrossRef]
- Reynoldson, T.B.; Norris, R.H.; Resh, V.H.; Day, K.E.; Rosenberg, D.M. The reference-condition: A comparison of multimetric and multivariate approaches to assess water-quality impairment using benthic macroinvertebrates. J. N. Am. Benthol. Soc. 1997, 16, 833–852. [Google Scholar] [CrossRef]
- Ferraro, S.P.; Cole, F.A. Taxonomic level sufficient for assessing a moderate impact on macrobenthic communities in Puget Sound, Washington, USA. Can. J. Fish. Aquat. Sci. 1992, 49, 1184–1188. [Google Scholar] [CrossRef]
- Resh, V.H.; Unzicker, J.D. Water quality monitoring and aquatic organisms: The importance of species identification. J. Water Pollut. Control Fed. 1975, 47, 9–19. [Google Scholar] [PubMed]
- Hölldobler, B.; Wilson, E.O. The Ants; Harvard University Press: Cambridge, MA, USA, 1990. [Google Scholar]
- Longcore, T. Terrestrial arthropods as indicators of ecological restoration success in coastal sage scrub (California, USA). Restor. Ecol. 2003, 11, 397–409. [Google Scholar] [CrossRef]
- Herms, D.A.; McCullough, D.G. Emerald ash borer invasion of North America: History, biology, ecology, impacts, and management. Annu. Rev. Entomol. 2014, 59, 13–30. [Google Scholar] [CrossRef] [PubMed]
- Duan, J.J.; Bauer, L.S.; Abell, K.J.; Ulyshen, M.D.; Van Driesche, R.G. Population dynamics of an invasive forest insect and associated natural enemies in the aftermath of invasion: Implications for biological control. J. Appl. Ecol. 2015, 52, 1246–1254. [Google Scholar] [CrossRef]

 ) and fungivore (
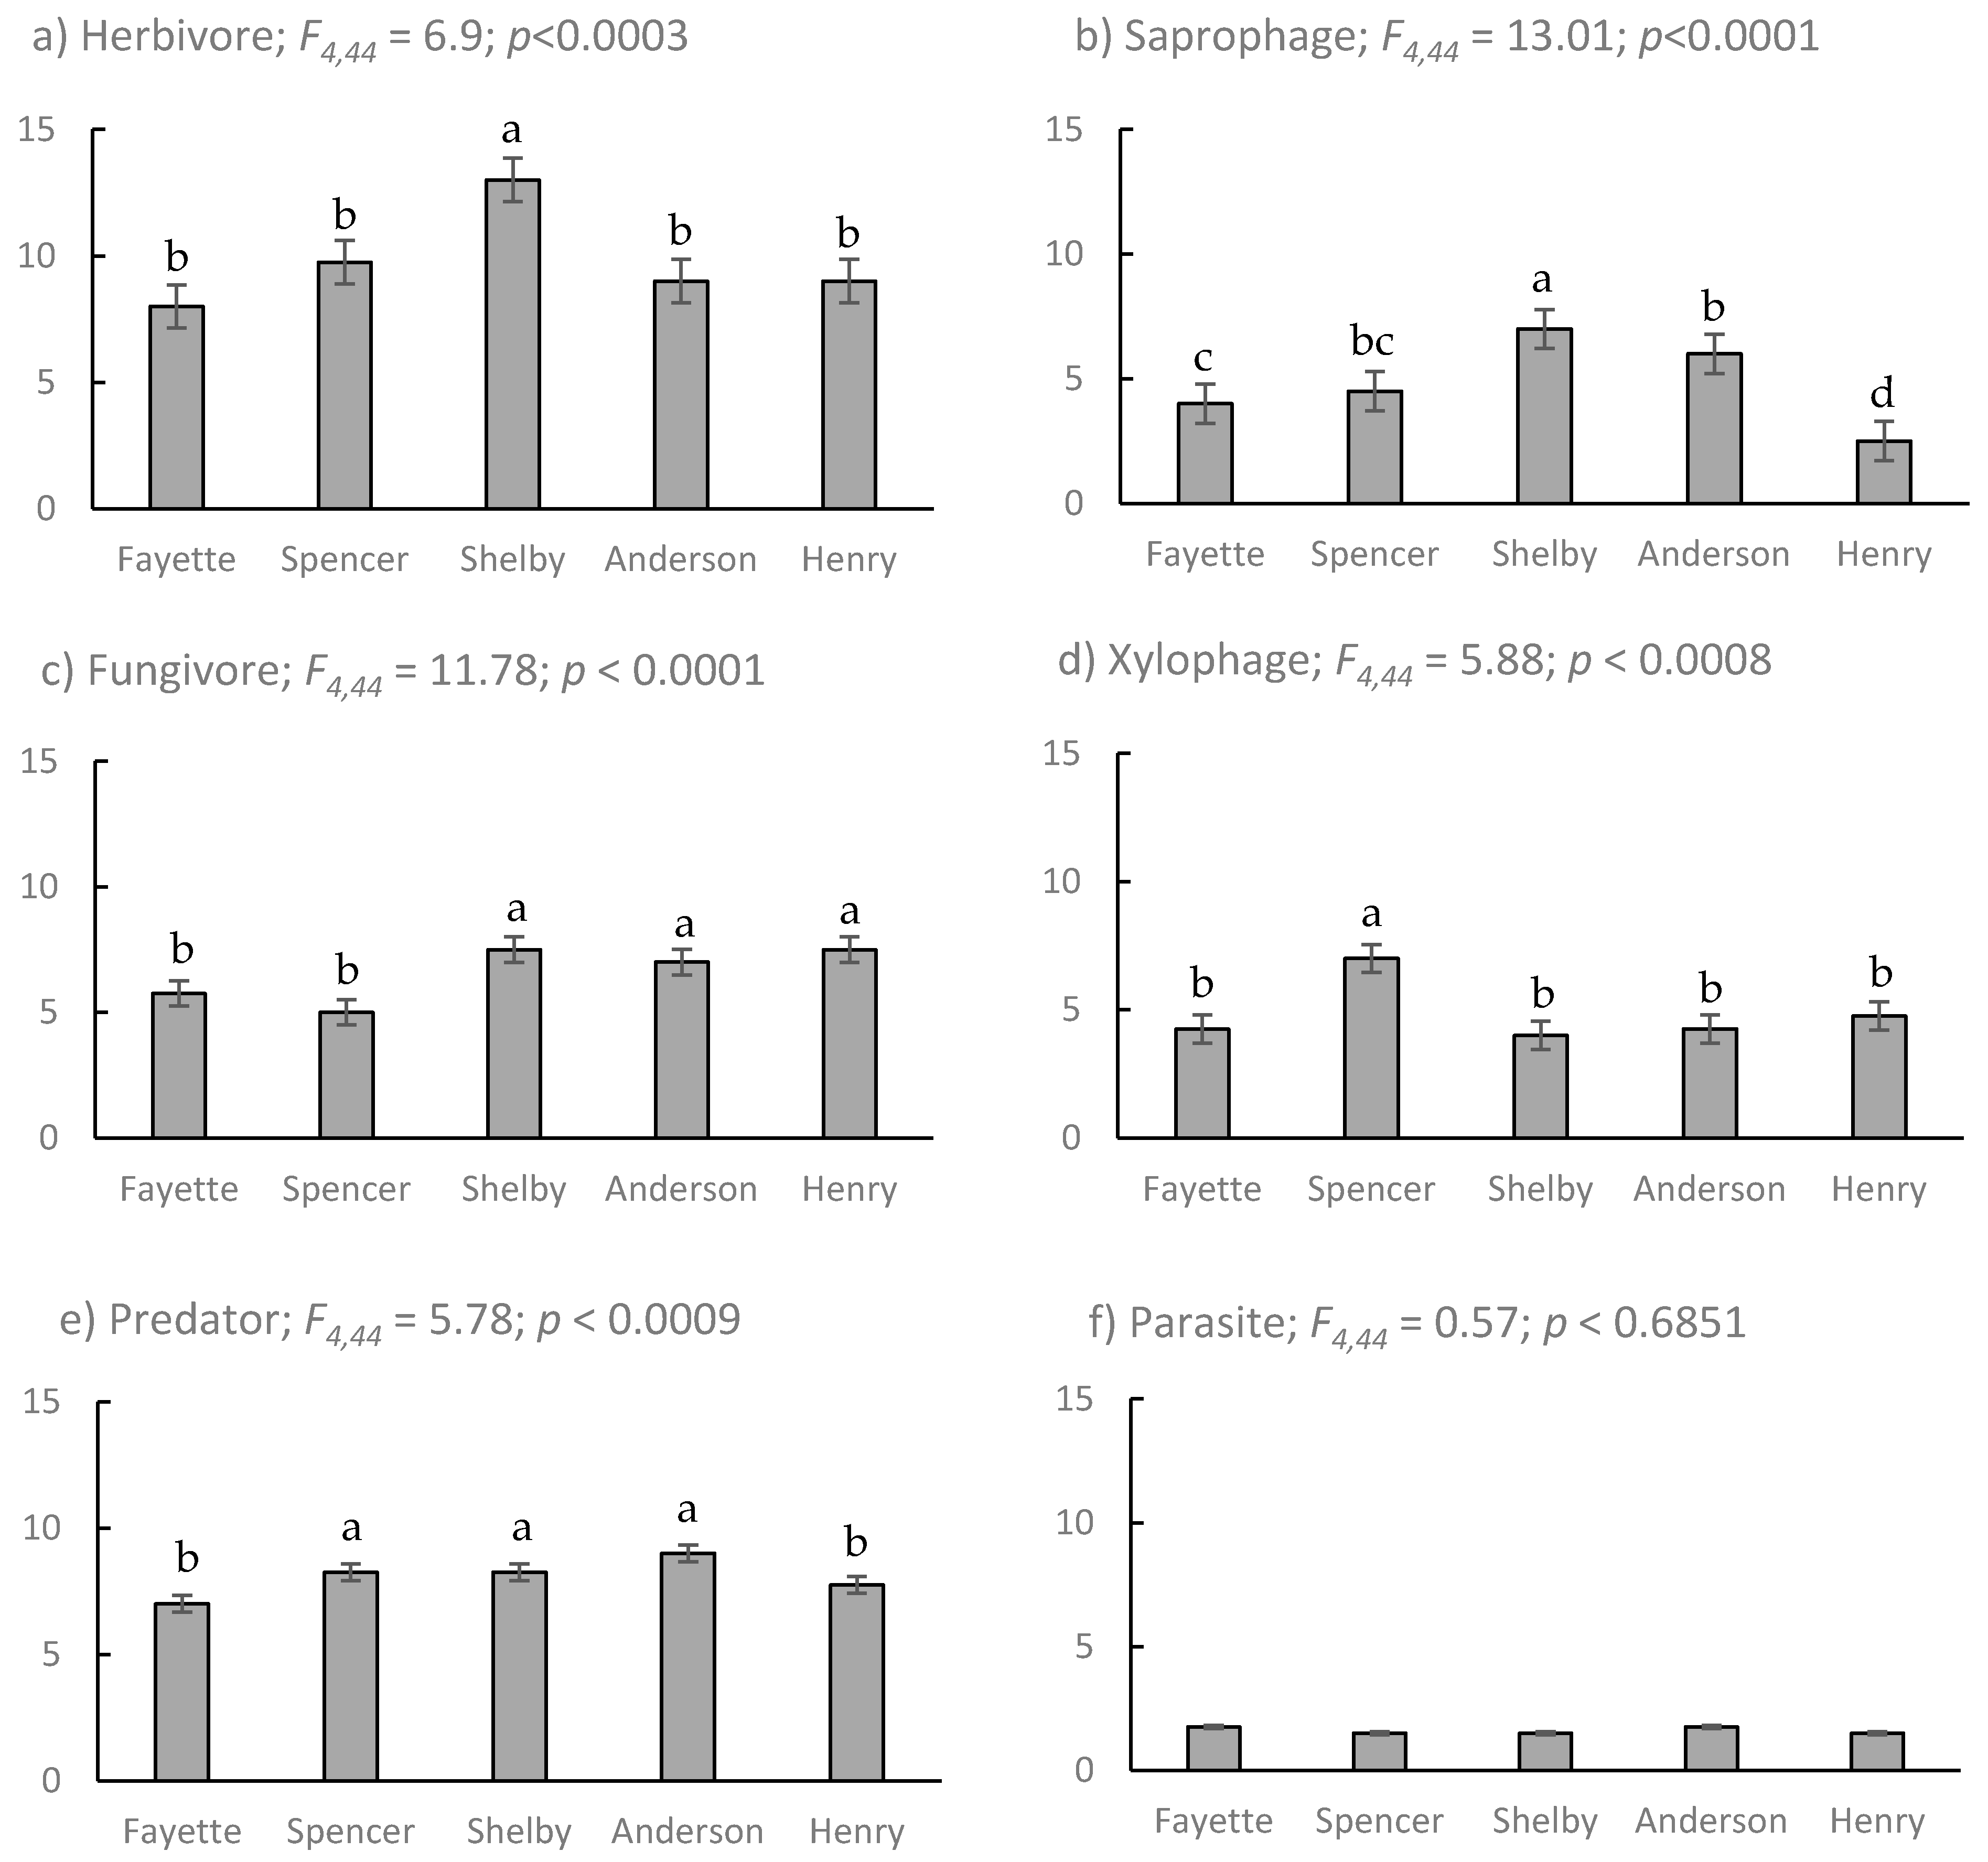
  ) abundance and richness among coleopterans sampled from EAB-impacted (Emerald Ash Borer-impacted) forests.
) and fungivore ( ) abundance and richness among coleopterans sampled from EAB-impacted (Emerald Ash Borer-impacted) forests.
) abundance and richness among coleopterans sampled from EAB-impacted (Emerald Ash Borer-impacted) forests.
) and fungivore ( ) abundance and richness among coleopterans sampled from EAB-impacted (Emerald Ash Borer-impacted) forests.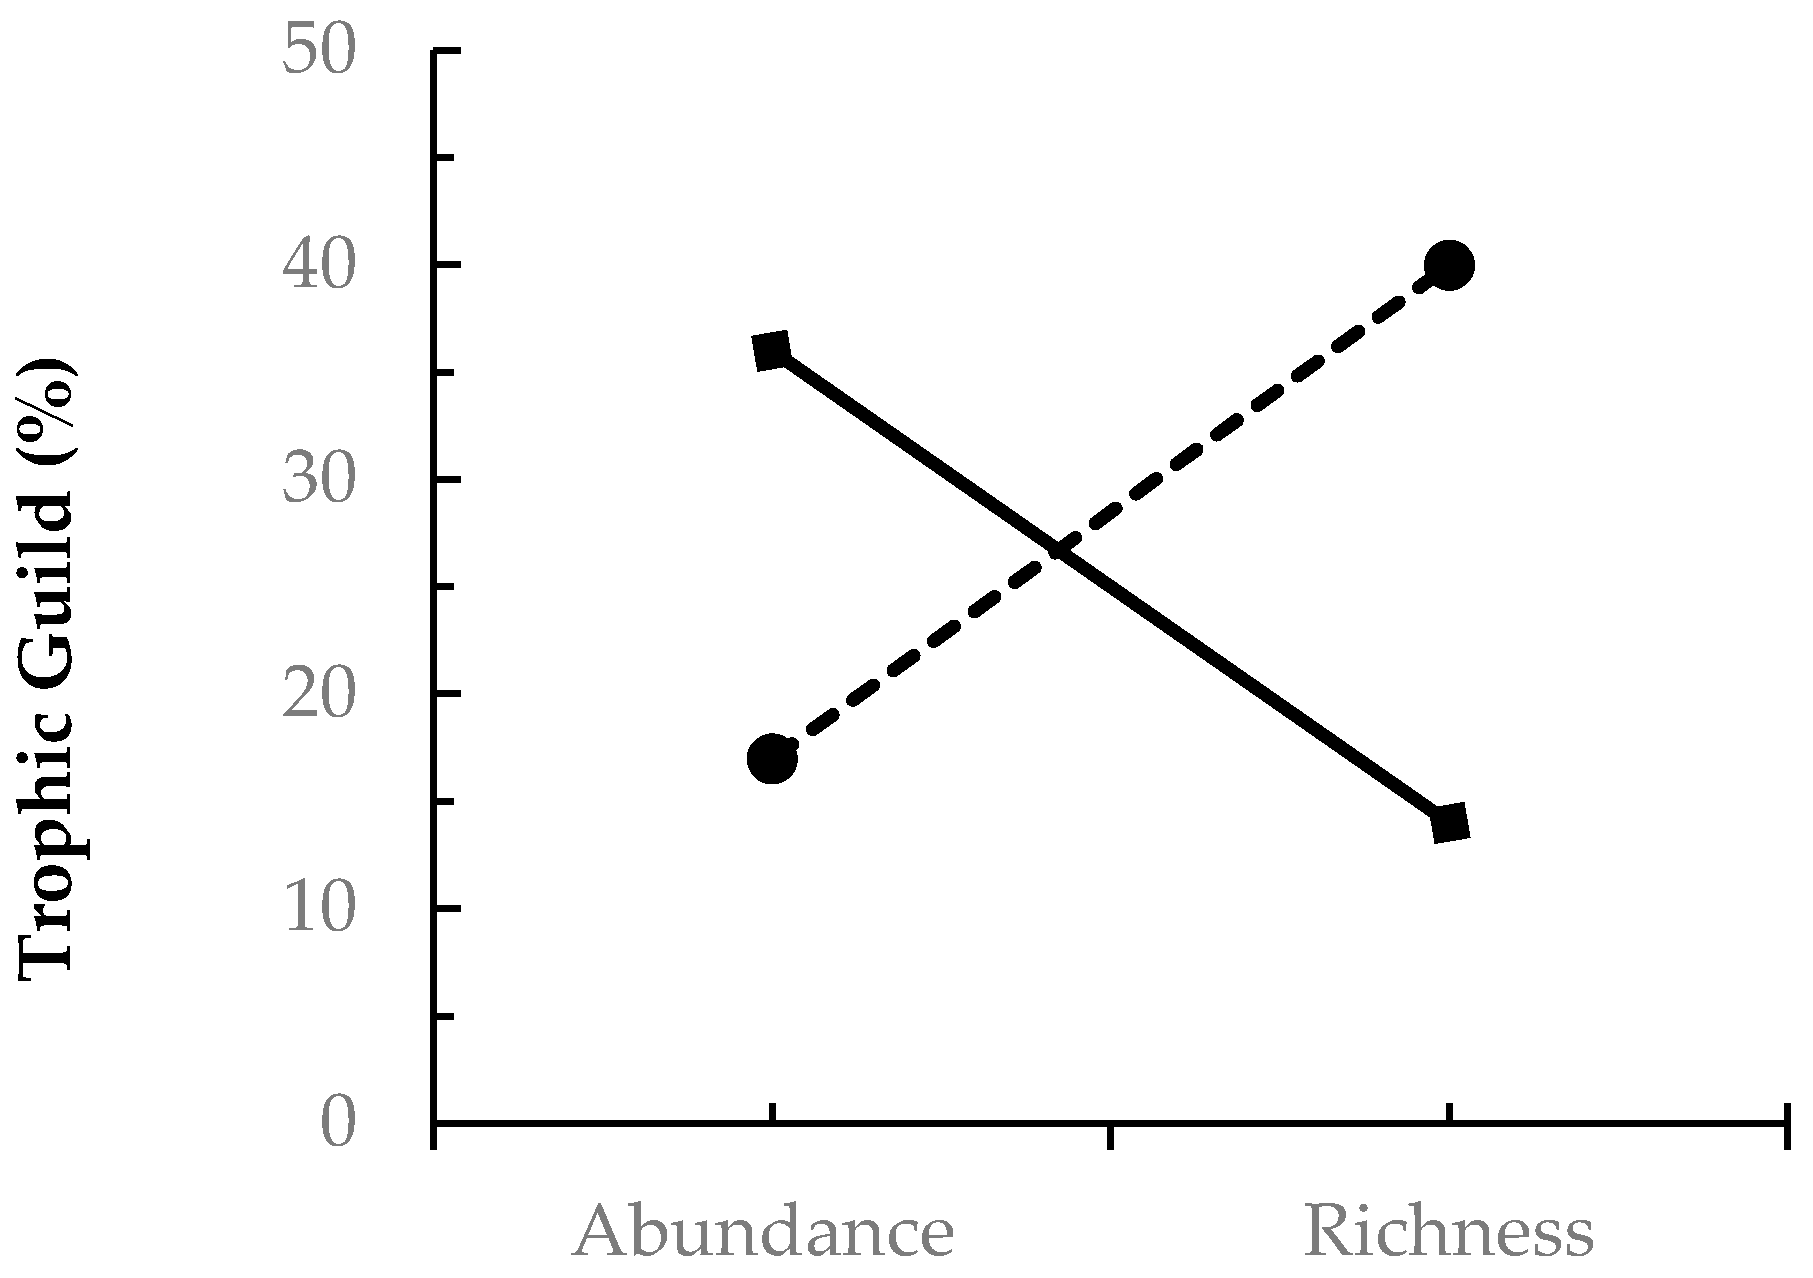

| Site | Location (Lat., Long.) | Sample Intervals (Site Visits) | Fraxinus spp. Canopy Dieback (Mean % (s.e.)) | Coleoptera Abundance 1 | Coleoptera Evenness 2 |
|---|---|---|---|---|---|
| Henry | 38.56572, 85.14665 | 14 | 73.9 (4.6) a | 1.30 (0.07) b | 0.27 (0.01) a |
| Anderson | 32.00857, 84.95980 | 13 | 56.9 (1.9) b | 1.53 (0.07) ab | 0.23 (0.01) a |
| Shelby | 38.27980, 85.36258 | 16 | 27.4 (3.9) c | 1.64 (0.06) a | 0.27 (0.01) a |
| Spencer | 38.02163, 85.27577 | 6 | 16.2 (2.8) cd | 1.49 (0.11) ab | 0.11 (0.01) b |
| Fayette | 37.89653, 84.39270 | 10 | 7.4 (3.0) d | 1.27 (0.08) b | 0.17 (0.02) ab |
| F3,350 = 58.6; p < 0.001 | F4,527 = 2.1; p < 0.02 | F4,14 = 35.0; p < 0.01 |
| Coleopteran Family-Level | ||
|---|---|---|
| Trophic Guild | Abundance (%) | Richness (%) |
| Herbivore | 36 | 14 |
| Fungivore | 17 | 40 |
| Predator | 26 | 19 |
| Xylophage | 10 | 12 |
| Saprophage | 10 | 10 |
| Parasite | <1 | 5 |
| Unidentified | <1 | -- |
| Total | 100 | 100 |
© 2018 by the authors. Licensee MDPI, Basel, Switzerland. This article is an open access article distributed under the terms and conditions of the Creative Commons Attribution (CC BY) license (http://creativecommons.org/licenses/by/4.0/).
Share and Cite
Savage, M.B.; Rieske, L.K. Coleopteran Communities Associated with Forests Invaded by Emerald Ash Borer. Forests 2018, 9, 69. https://doi.org/10.3390/f9020069
Savage MB, Rieske LK. Coleopteran Communities Associated with Forests Invaded by Emerald Ash Borer. Forests. 2018; 9(2):69. https://doi.org/10.3390/f9020069
Chicago/Turabian StyleSavage, Matthew B., and Lynne K. Rieske. 2018. "Coleopteran Communities Associated with Forests Invaded by Emerald Ash Borer" Forests 9, no. 2: 69. https://doi.org/10.3390/f9020069
APA StyleSavage, M. B., & Rieske, L. K. (2018). Coleopteran Communities Associated with Forests Invaded by Emerald Ash Borer. Forests, 9(2), 69. https://doi.org/10.3390/f9020069