Article

Application of GIS to Empirical Windthrow Risk Model in Mountain Forested Landscapes

1
Department of Geoinformatics, Faculty of Science, Palacky University, 17. listopadu 12, 771 46 Olomouc, Czech Republic
2
Department of Geography, Faculty of Education, Masaryk University, 603 00 Brno, Czech Republic
3
Department of Development and Environmental Studies, Faculty of Science, Palacky University, 17. listopadu 12, 771 46 Olomouc, Czech Republic
*
Author to whom correspondence should be addressed.
Forests 2018, 9(2), 96; https://doi.org/10.3390/f9020096
Submission received: 12 December 2017 / Revised: 16 February 2018 / Accepted: 16 February 2018 / Published: 22 February 2018
(This article belongs to the Special Issue Forest Landscape Ecology: Linking Past, Present, and Future Data)

Abstract

:
Norway spruce dominates mountain forests in Europe. Natural variations in the mountainous coniferous forests are strongly influenced by all the main components of forest and landscape dynamics: species diversity, the structure of forest stands, nutrient cycling, carbon storage, and other ecosystem services. This paper deals with an empirical windthrow risk model based on the integration of logistic regression into GIS to assess forest vulnerability to wind-disturbance in the mountain spruce forests of Šumava National Park (Czech Republic). It is an area where forest management has been the focus of international discussions by conservationists, forest managers, and stakeholders. The authors developed the empirical windthrow risk model, which involves designing an optimized data structure containing dependent and independent variables entering logistic regression. The results from the model, visualized in the form of map outputs, outline the probability of risk to forest stands from wind in the examined territory of the national park. Such an application of the empirical windthrow risk model could be used as a decision support tool for the mountain spruce forests in a study area. Future development of these models could be useful for other protected European mountain forests dominated by Norway spruce.

1. Introduction

A forest landscape is a spatial mosaic containing distinct areas that functionally interact [1]. It consists of different forest types and forest development stages distributed geographically. Thus, geographic information systems can support our understanding of forest ecosystems on a landscape scale [2]. Management of forest landscape must integrate the production of multiple values on a sustainable basis without jeopardizing ecosystem integrity, ecosystem services, and biodiversity [3]. Nowadays, sustainable forest management has become a significant challenge for foresters, conservationists, and other stakeholders [4], with a growing public and scientific focus on the multifunctional role of forest landscapes. Two essential components are crucial in the management process: setting management (including conservation) objectives, and the design and management of support tools to achieve goals [5].
The forest landscape is characterized by a hierarchical structure, from individual species to patches, and to landscape [6,7]. At the species level, the main effort is focused on finding the focal species that are ecologically, economically, or socially critical for the maintenance of forest ecosystems. At the patch level, the critical or sensitive areas necessary for the target species are identified based on composition and spatial configuration. At the landscape level, forests are considered to be landscape matrices and intact if they sustain multiple values of forest ecosystems. The spatial arrangement of landscape parsing is necessary in order to describe measurements of landscape patterns. To preserve forest biodiversity at the landscape level, it is crucial to maintain a range of natural disturbance agents, because there is a close functional correlation between the vital processes and the diversity and distribution of organisms [8]. However, the frequency and intensity of these disturbances are system-specific, therefore, experiments and assessments must be carried out in each region in order to arrive at the appropriate and cost-effective level of disturbance needed to maintain the biodiversity of forest ecosystems [9]. Knowledge of natural disturbance regimes is of vital importance when managing forest protected areas and for maintaining species richness in working forests [10]. However, in most European cultural landscapes, the main drivers of forest dynamics are anthropogenic disturbances and land use changes [11,12].
In European forests, where Norway spruce (Picea abies (L.) Karsten) is the dominant tree species, the bark beetle (Ips typographus) is a keystone species [13,14]. The critical role of the bark beetle is usually associated with wind turbulent natural disturbances, which are essential landscape drivers in the natural and semi-natural Norway spruce-dominated mountain forests of Europe [15,16]. Natural wind disturbances in mountain coniferous forests strongly affect all the main components of forest and landscape dynamics: species diversity, the structure of forest stands, nutrient cycling, carbon storage, and other ecosystem services [17]. The higher frequency of windthrow in Norway spruce-dominated forests in Europe over the last several decades [18] has encouraged interest in sustainable forest management, with an emphasis on the conversion of coniferous monoculture to mixed forest [19]. This also stresses the need to improve our understanding of the historical range of windthrow as a natural disturbance and the likely future range of its variability (FRV). The historical consequences of windthrow (including land use changes) are the topic of studies in many European regions [20,21]. In contrast, predictions of FRVs in forested landscapes have rarely been studied up to now [22], and these predictions are based on mechanistic [23] or empirical models [24]. Although some authors found their empirical windthrow risk models to be widely portable [25], the mechanistic and empirical models for assessing the risk of wind damage to forests are usually constrained by unique local conditions [26].
In principle, mechanical and empirical approaches can be used to assess the forest risk in terms of the occurrence of windthrows. Models based on a mechanical approach predict the probability of stand damage based on the critical wind speed that causes trees to break or be uprooted and the probability of the occurrence of these winds in the sites studied [27]. These models are based on information about the mechanical properties of trees and should be calibrated by field surveys [28]. Mechanical models characterize the physical processes involved in trees breaking or being uprooted. The calculation of the probability in mechanical models consists of two phases. In the first stage, the critical wind velocity that causes the breaking or uprooting of trees is calculated. The effective force of the wind depends on numerous factors, especially local wind speed, wind gusts, tree position in a stand, crown properties (size, aerodynamics, mass), and trunk properties (shape, length, mass). In contrast, the resistance forces of a tree depend on other factors, such as the properties of the tree (diameter and strength of wood) and root morphology, etc. In the second phase, the probability of winds that exceed a critical speed is calculated. This information is provided by the meteorological stations closest to the areas in question. If data from meteorological stations are not available, a model for calculating airflow [29,30] is used.
The empirical approach to windthrow risk assessment is based on the relationship between wind damage and the properties of the trees in the stand, and the relationship between the characteristics of the whole stand and the habitat characteristics. To create empirical models, a relatively large amount of information about the studied site is necessary, and this has implications for the high demands on the amount of input data in the model. Empirical models are applied to forest stands with complex and varied arrangements and structures, and to those where there is diverse relief and different types of soils [31,32].
The authors have used an empirical windthrow risk model based on the integration of logistic regression into Geographical Information Systems (GIS) in order to assess forest vulnerability to wind-disturbances in the mountain spruce forests of Šumava National Park [33]. In the past decade, the management of forests in this national park has been the focus of international discussions by conservationists, forest managers, and stakeholders [34]. Windstorms and bark beetle outbreaks could be used to restore the intensely managed forests of Central Europe to their natural composition and structure [35,36]. This article aims to show that the logistic regression method integrated into GIS can make any assessment of the probability of risk to forest stands by wind more objective in the study area and thus the method can be used as a support tool in the design of a management plan for a national park. If specific potential risks to ecosystems in protected areas are identified in particular locations, the necessary information will be obtained for formulating a management plan for those protected areas.
The developed empirical windthrow risk model involved designing an optimized data structure that contains dependent and independent variables entering logistic regression. The results from the model, as visualized in the form of map outputs, outline the probability of the risk of damage to forest stands from wind in the examined territory of the national park. Such an application of the empirical windthrow risk model could, in the opinion of the authors of the article, be used as a decision support tool for all European protected mountain forest areas dominated by Norway spruce.

2. Materials and Methods
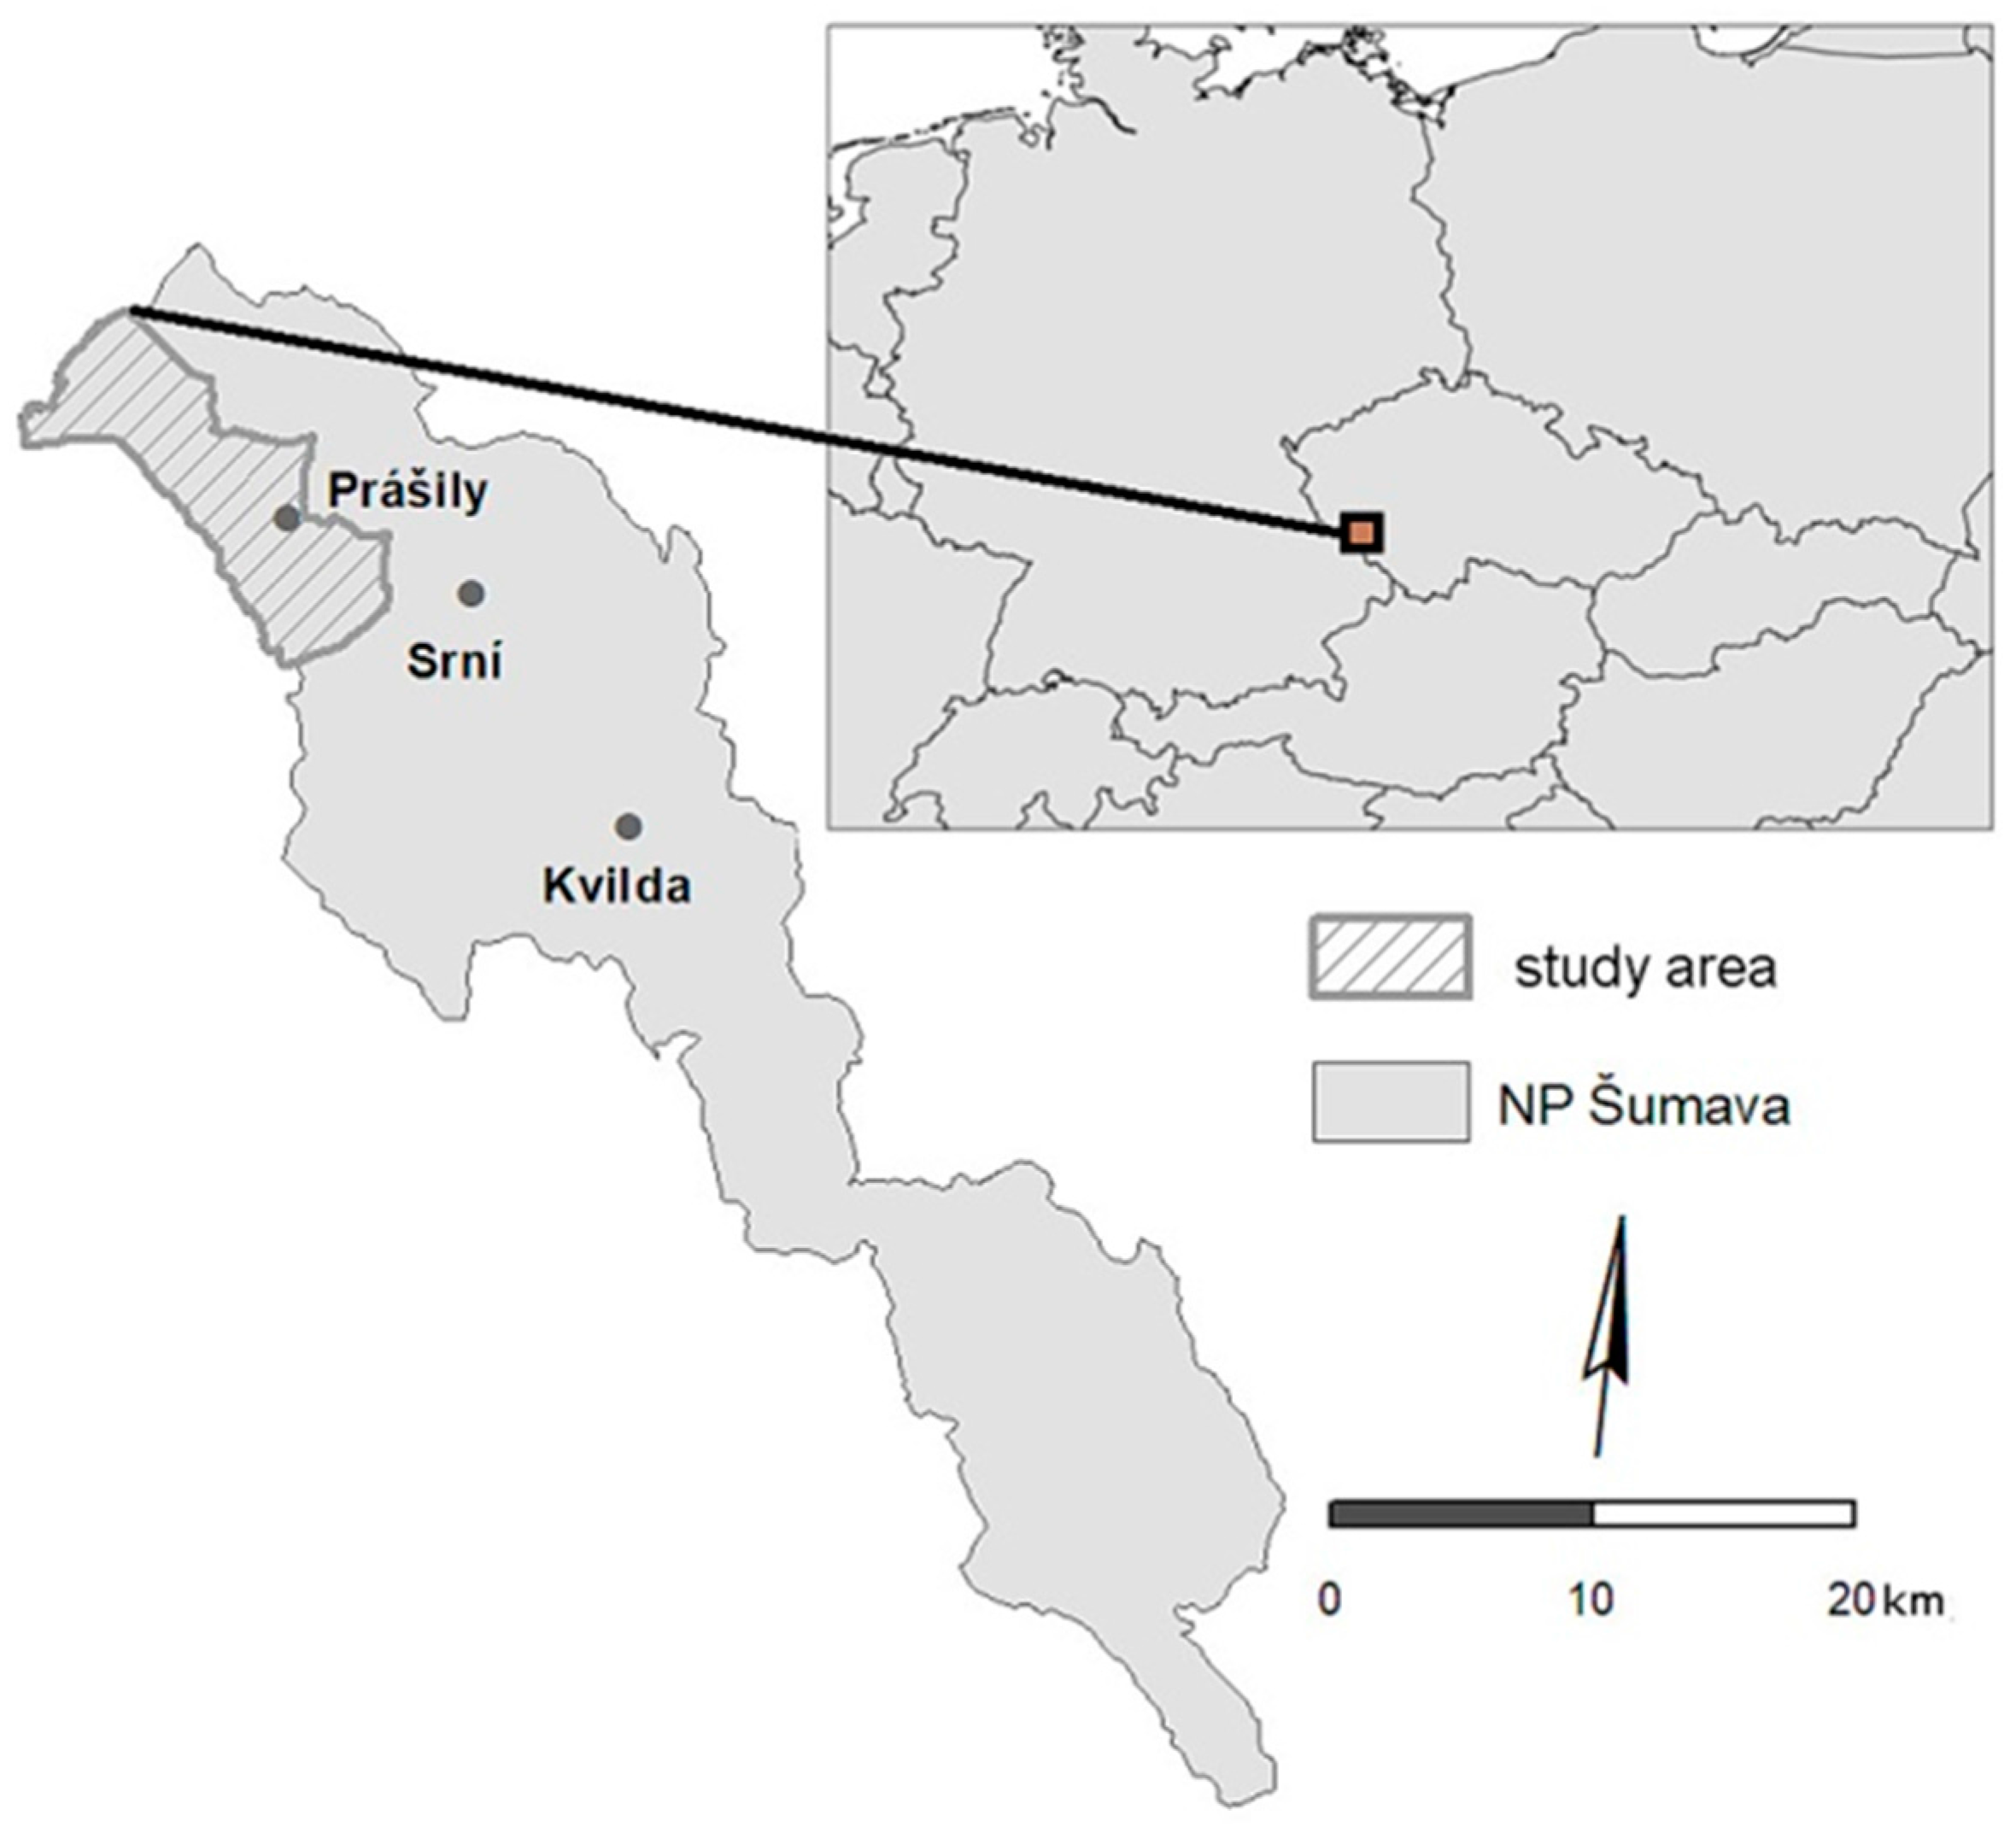
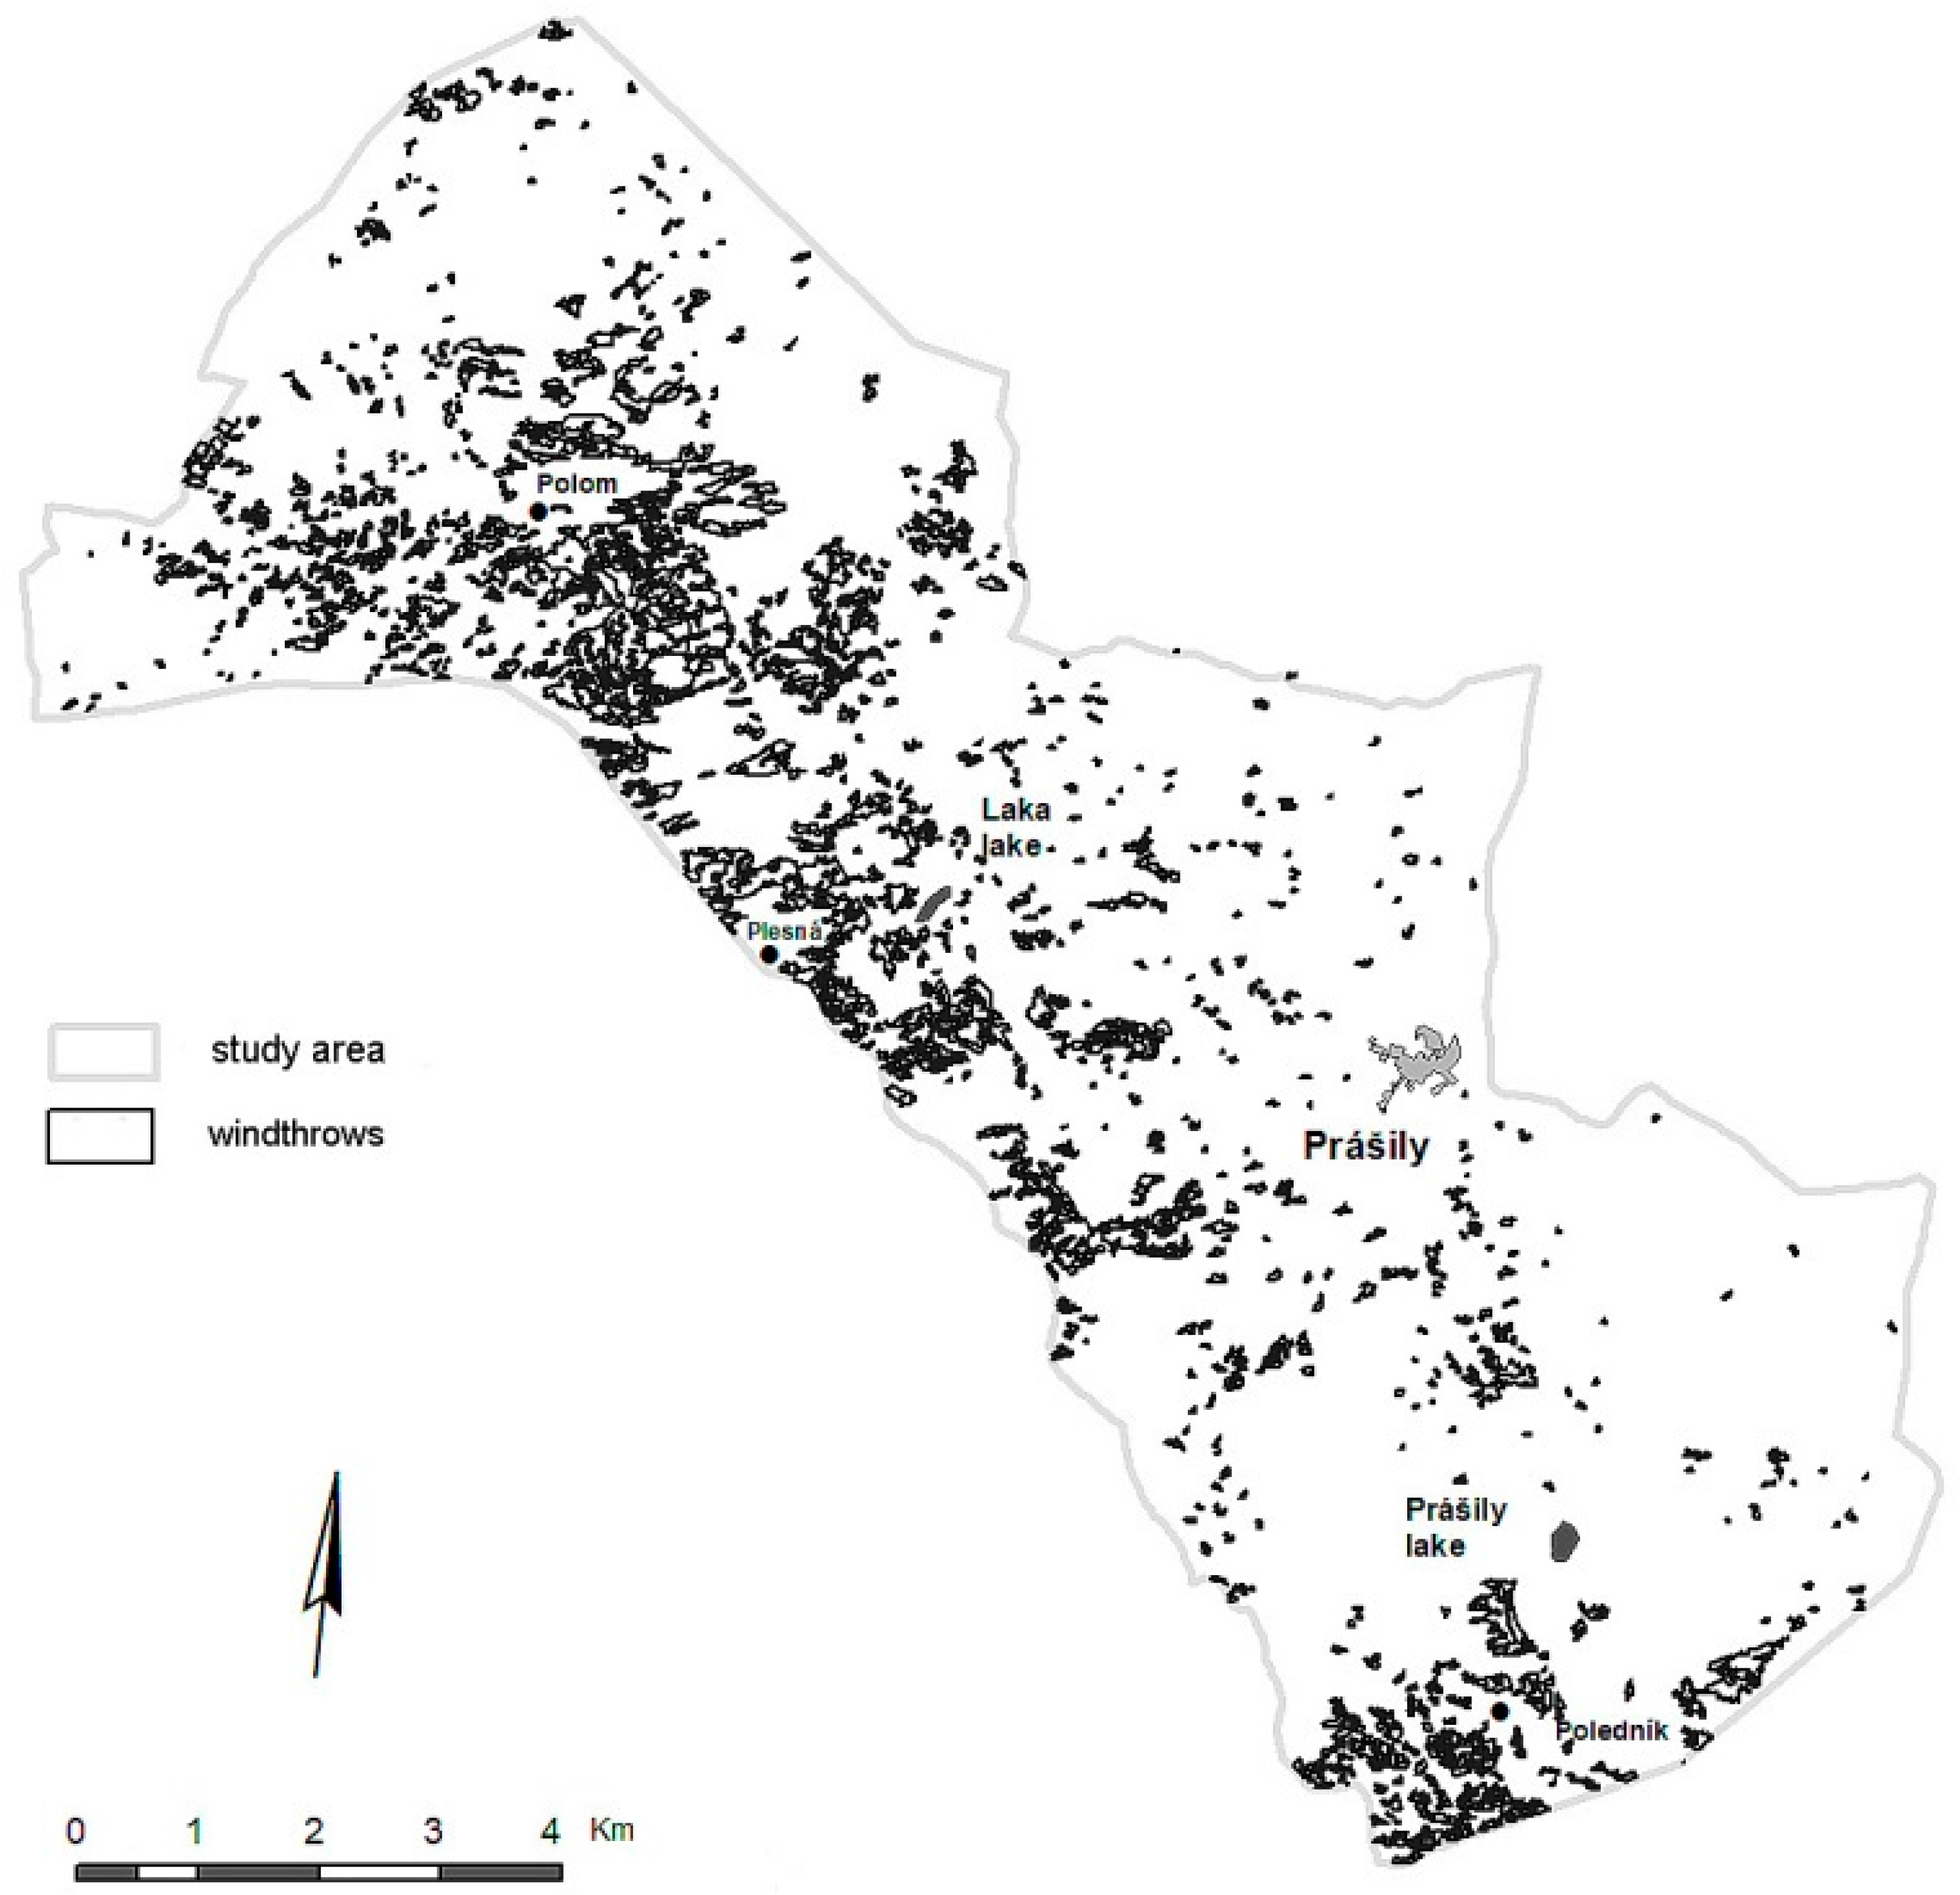
2.1. Study Area

The study was conducted in the southwest part of Šumava National Park (Figure 1), henceforth referred to as “NP Šumava”. The total area under study is 70.12 km2. The top-of-mountain terrain study area ranges from 735 m to 1337 m above sea level. Soil cover includes soil bound by various weathered silicate crystalline rocks, primitive lithosol, rankers, and cambisols, and entic podzols and podzols in the higher, cooler, and wetter altitudes. The most widely represented soil types are typical entic podzols (40% of the study area) and oligotrophic cambisols (31% of the study area). In the valleys, histosols and gleysols are widespread.
From the climatic point of view, and based on the Atlas of the Czech Climate [37], the study area extends into three climatic zones: in the lowest locations (735–970 m a.s.l.) average annual temperatures are between 4.5 and 5.5 °C, and the precipitation is from 900–1050 mm per year. Regarding potential natural vegetation [38] in the Czech Republic [39], this climatic area defines the sixth forest vegetation level [40] containing beech forest (Fagus sylvatica L.) with a significant mixture of Norway spruce and white fir (Abies alba Mill.). At altitudes of 971–1210 m a.s.l., temperatures reach 4.0–4.5 °C and the annual rainfall is 1050–1200 mm, which corresponds to the climatic definition of the seventh forest vegetation stage [41]. Spruce dominates here, while beech and fir trees only grow in the bottom of the valley. The dominance of the spruce is supported at this altitude by climate conditions. At the highest positions (1211–1337 m a.s.l.), average annual temperatures range from 2.5 to 4.0 °C, and annual rainfall is over 1200 mm. These climatic conditions define the eighth forest vegetation stage, where natural forest stands form open climax spruce at the upper climatic boundary of the forest [42].
Today, the forests in the study area are considerably different from the potential natural vegetation. The original natural forests were entirely destroyed during the development of mediaeval glasshouses and the later wood colonization of the Šumava Mountains, which suffered from unregulated mining. The forests were replaced by spruce monocultures. In the study area, spruce monocultures under 100 years old (about 65% of the forest in the study area) and spruce monocultures from age 100 to 140 years (almost 35%) are present. The predominant height of 60% of the forest stand in the study area is between 20 and 30 m. The average diameter at breast height of most of the trees is between 30 and 40 cm (30% of the study area), followed by 25 to 30 cm.

2.2. Input Data for Modelling

The relief factors are derived from the 5 m raster digital terrain model (DTM). The DTM was derived from digital terrain slope, slope orientation, and curvature of the terrain. This data was created using the Topo to Raster method, developed for interpolating the terrain model of the contours.
Site factors were taken from forest data of the regional plan of forest development. Humidity and soil conditions (stagnic fluvisols; histic gleysols; gleyic, haplic, and dystric cambisols; haplic and entic podzols; haplic leptosols; haplic histosols; gleyic and histic stagnosols; haplic rankers) were derived from this plan.
The factors of forest vegetation (age and height of the crop, stocking, average diameter at breast height, and percentage of spruce within the stands) were derived from forest management plans. Other tree species were not tested in the study because Norway spruce is a radically prevailing species in the study area and such data were not available. Nevertheless, the authors believe it would be highly beneficial to include such variables in the future studies.
The velocity and wind direction factors were represented by a digital layer depicting wind speeds and directions during the Kyrill cyclone, which hit a large part of Central Europe during the night of 18–19 January 2007. The Kyrill cyclone was selected for this study as a reference data source because of accurate knowledge of its course and implications, details of which are available from the Šumava National Park Administration. In the Bohemian Forest of Šumava, the Kyrill cyclone caused extensive damage to spruce monocultures and this amounted to 850 thousand m3 of damaged wood. The total damage in 2007 from the Kyrill cyclone affected 12 million m3 of harvested mass in the Czech Republic, and 54 million m3 of wood in Europe.
The airflow factor was calculated using a three-dimensional non-stationary flow model from the Prague Institute of Atmospheric Physics Boundary Layer [43]. The model used to calculate wind speed and direction is called PIAPBML (Prague Institute of Atmospheric Physics Boundary Layer Model) and was developed at the Institute of the Atmospheric Physics Czech Academy of Science. The PIAPBLM is a 3-D non-hydrostatic model that solves a set of equations numerically in terrain-following coordinates: the equation of motion with Boussinesq approximation, the anelastic continuity equation, and the equation for the deviation of the potential temperature from the basic state. The wind speed layer and the direction of the wind during the Kyrill were calculated by Dr. Svoboda from the Institute of Atmospheric Physics Czech Academy of Science and were provided to the authors of this paper as grid layers—one layer represented wind speed (m/s) and second layer represented the direction of the wind (in degrees). The layers were derived exclusively for this project and the results are now published in this paper. We will therefore indicate this in the paper. Wind speed is a maximum 10-min mean speed recorded at Churáňov between 18–19 January2007.
Parameters of the model are as follows: Model area reached 9700 m2; Horizontal—484 × 333 points (100 m steps); Vertical—51 points with various steps (20 cm to 300 m). Properties of the terrain were derived from the digital elevation model. Roughness parameters include: Grass up to 1 cm, surface without trees in 5–10 cm, surface with occasional trees in 10–20 cm, forest in 50–100 cm.
Properties of wind flow/direction for modelling were taken from the meteorological station Kümmersbruck in Germany. Data used for the modelling were captured at the meteorological station on 19 January 2007 at 00:00. The average wind speed was calculated 10 m above idealized terrain. Wind speeds were normalized based on records from the meteorological station Churáňov in NP Šumava.
An essential digital datasheet was the raster map layer of forest stands provided by the Administration of NP Šumava. Immediately after the Kyrill cyclone, aerial photographs were taken of the forests affected by the hurricane in order to accurately detect the locations of the windthrow [44]. This layer is an explanatory variable in the “absence/presence” format.

2.3. Logistic Regression

Logistic regression evaluates dependent variables based on knowledge of independent variables that may affect the occurrence of a phenomenon. In the case of logistic regression, the binary-type variable (i.e., presence or absence) is explained, and one of the partial aims of this method is to analyze the effects of independent, explained variables (e.g., age, thickness):
Y = e g ( x ) 1 + e g ( x )
where:
  • g (x) = β0 + β1x1 + β2x2 + ... + βnxn;
  • β0, ..., βn = regression model parameters;
  • x1, ..., xn = explanatory variable.
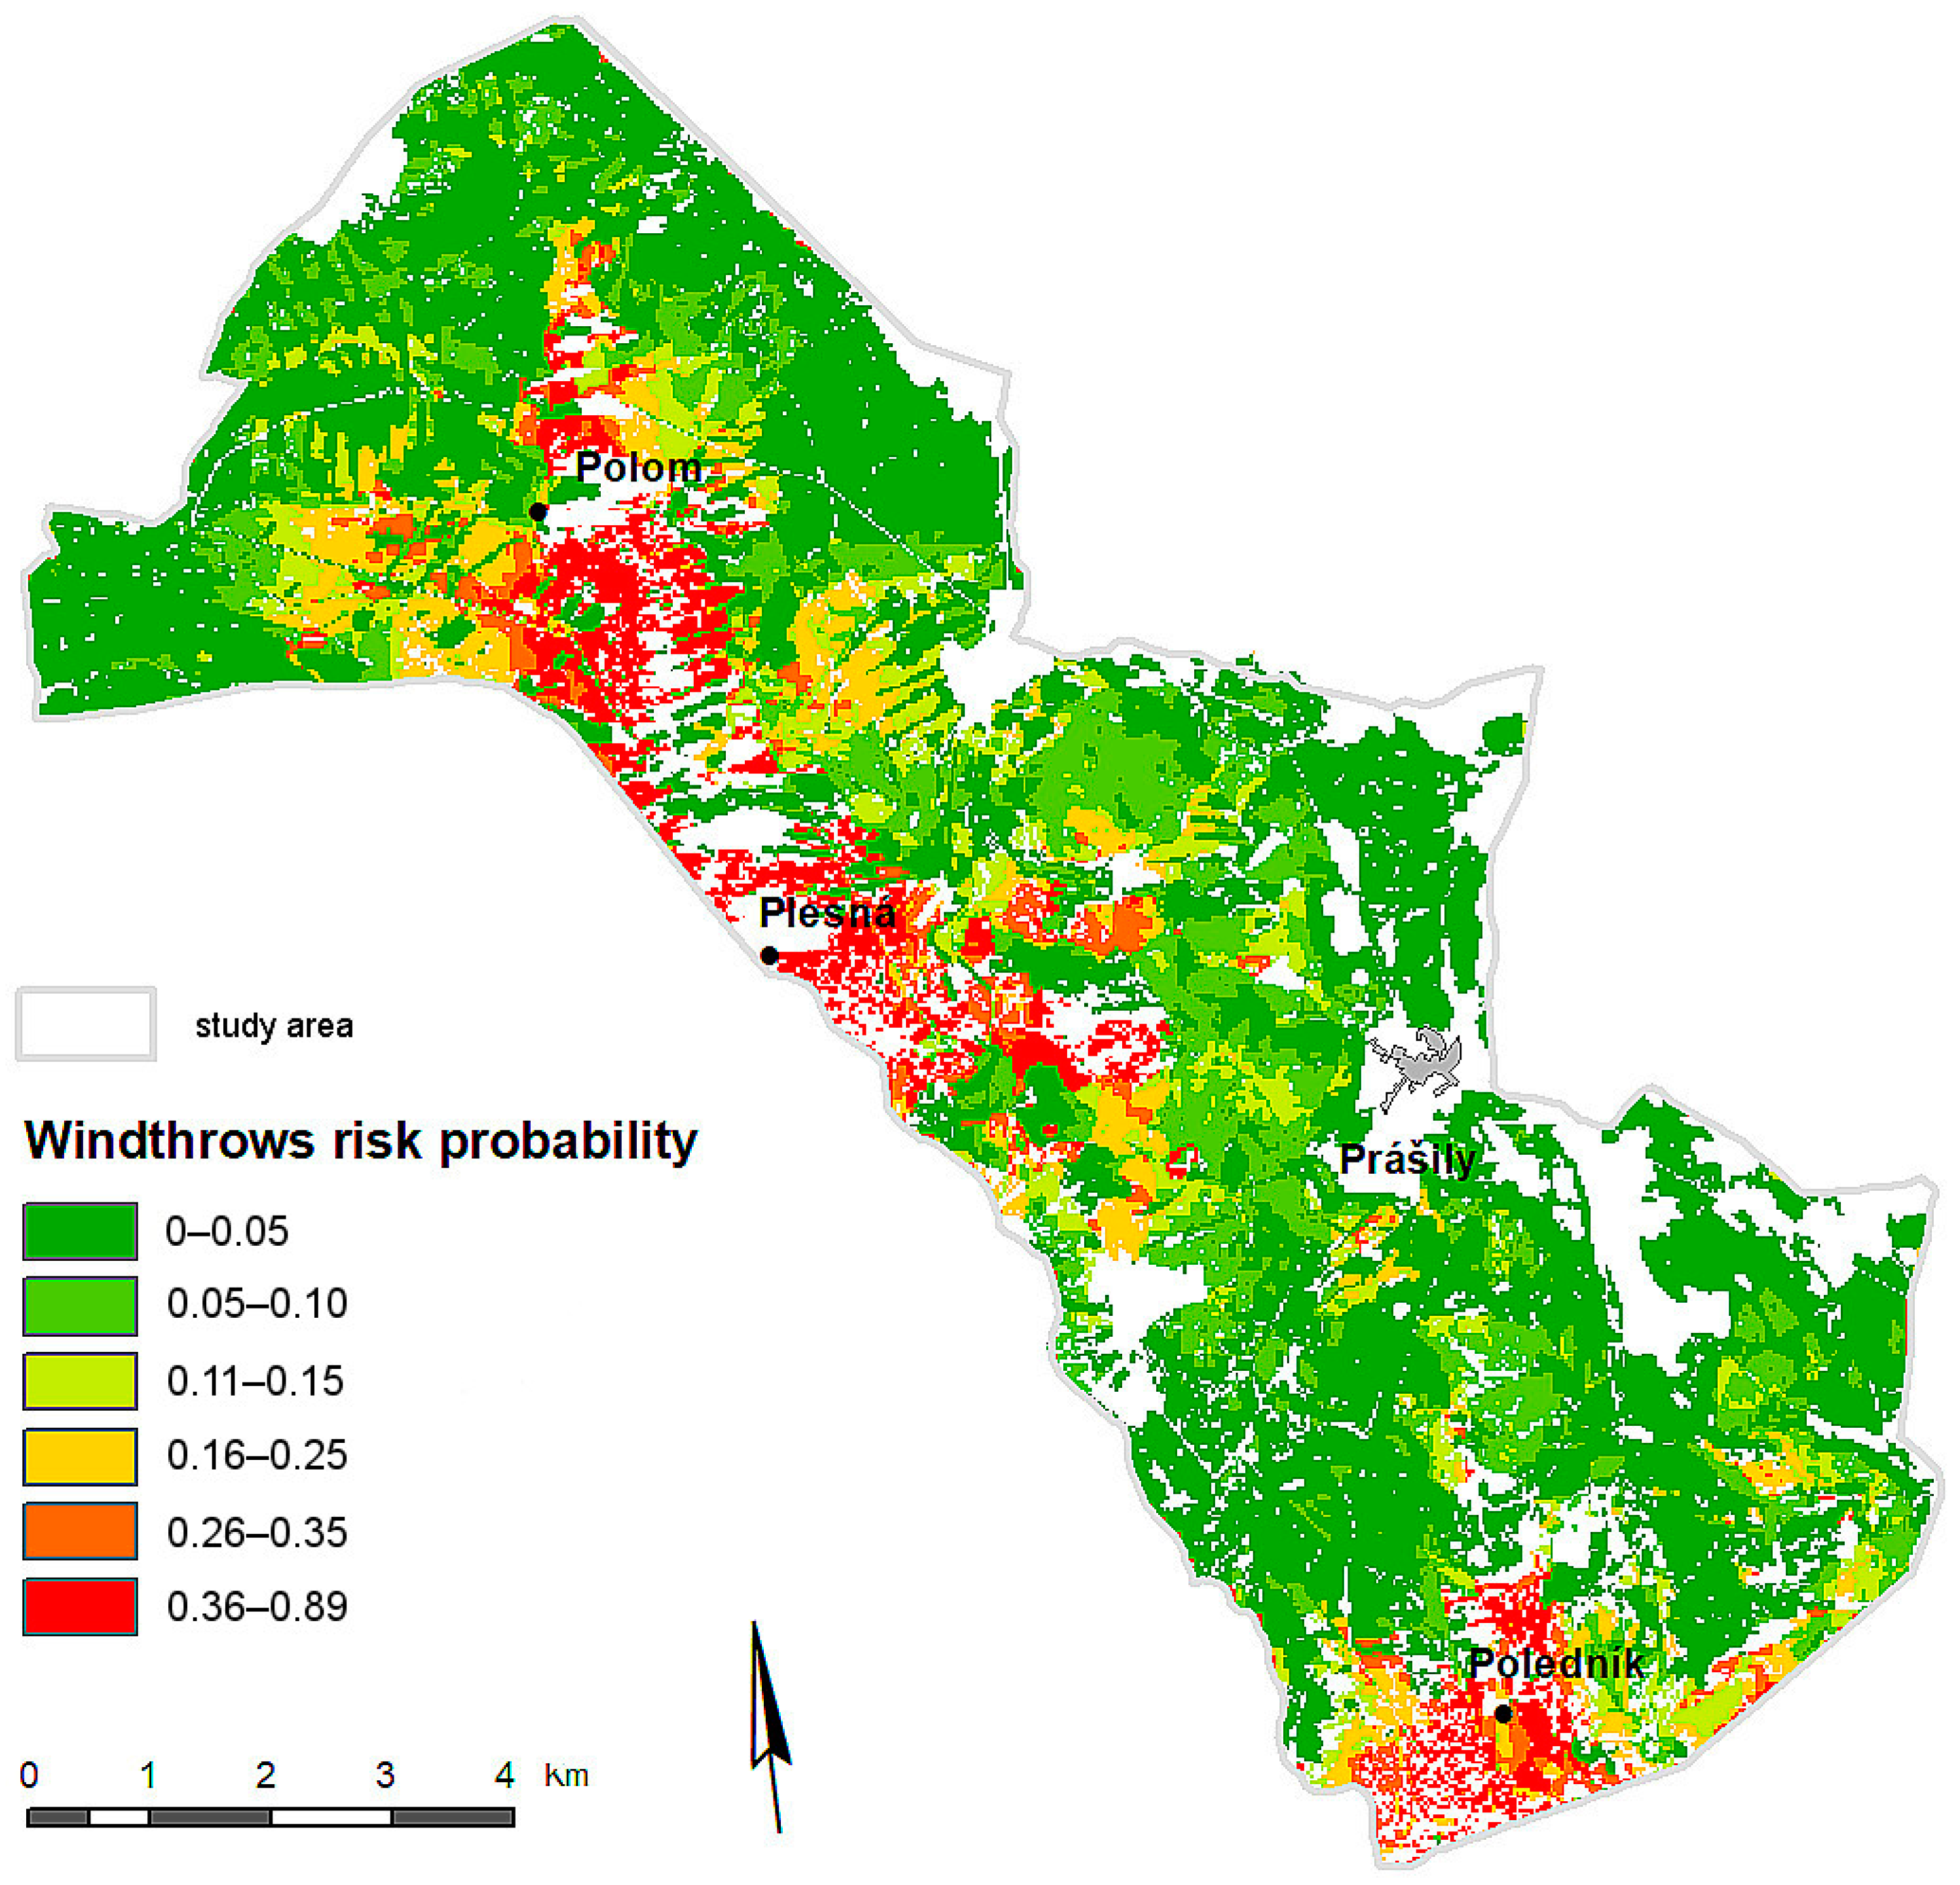
To build a good quality logistic regression model, the dataset of explanatory (independent) and dependent variables was extracted from the digital terrain model, from regional forest development plans (depth, soil moisture, etc.), from forest management plans, and from the measurements taken of wind speed and direction during the Kyrill cyclone (Table 1). From this primary dataset, the so-called segmentation database was compiled. First, 25 × 25 sample units (regular point layer) were created using the geoprocessing tool called Create Fishnet, which is available in Data Management toolbox (with option “Create Label Points”). Subsequently, individual layers of dependent and independent variables were overlapped using ArcGIS tools (Environmental Systems Research Institute, Inc., Redlands, CA, USA), specifically the tool called IDENTITY, which is located in the Data Management toolbox/Overlay toolset. Input point layers were used as the INPUT features and layers representing independent variables were set as IDENTITY features. The output was a new point feature class: the independent variable values. These overlays with the extraction were carried out separately for each layer representing an independent variable and the results were aggregated into one single point feature layer.
The calculation of logistic regression parameters was performed using SAS statistical software. Before calculating the parameters, Pearson’s correlation coefficients were calculated for all independent variables (Table 2; for p-values of the test, see Table 2). High correlation rates were found between age and crop density, stand age and mean height, and mean height of the stand and mean thickness of the stand. A moderately high correlation rate was detected between elevation and wind velocity during the Kyrill cyclone, and then between the average speed in the area of interest and the wind speed during the Kyrill cyclone (Table 2).
The selection of the most appropriate logistic regression involved the creation of thirteen alternative variants with different combinations of variables (Table 3), as well as the Akaike test criterion, and the value of the model’s credibility function, which contains information about all the data contained in the model (a lower value represents a better model).
The development of multiple statistical models clearly shows an improvement in the fit of the models with an increasing number of independent variables (decreasing value of 2LogL and Akaike Information Criterion (AIC) representing the fit of the model). Models 1–12 were compiled manually by adding individual independent variables and calculating 2LogL and AIC (stepwise regression options were not applied). However, model 13 was developed using a stepwise regression method (all independent variables were used at the beginning and comparison, and SAS provided the selection of the best independent variables). Therefore, model 13 was chosen as the best fit because of the relatively low number of significant independent variables and good AIC and 2LogL values.
The PROC LOGISTIC procedure was used to generate the models in SAS. For the first 12 models, the PROC LOGISTIC procedure was used without the “stepwise selection” option that was applied in the case of model 13.
In the SAS statistical software, all values were calculated in the form of −2logL (this value describes the overall suitability of the model and can be used to compare different models, see Table 3). A sequential regression method was applied to identify the most suitable variant of logistic regression. It allowed us to find the most appropriate combination of input independent variables to best explain the probability of the occurrence of the phenomenon under investigation [38]. A test of the statistical significance of individual parameters ELEV, AGE, SOIL, SPRUCE, DIR_K, and SPEED_K was performed using the Wald test and it was based on the ratio of the maximum credibility estimation to the estimate of the standard deviation (Table 4 and Table 5). Within the model evaluation, a Receiver Operating Characteristic Curve (ROC) was compiled to show the relation between the specificity and the sensitivity of the test (the ratio of the actual positive, the correctly classified as positive, and the false negative estimates in the model). Based on the tests (Table 5), the most appropriate explanatory variables were selected: elevation (ELEV), age (AGE), soil depth (SOIL), spruce occurrence (SPRUCE), wind direction (DIR_K), and wind speed (SPEED_K) during the Kyrill cyclone (Table 4).

3. Results

A geographic analysis of the probability of the local occurrence of forest windthrow was carried out and it resulted in a map of forest at risk from windthrow. Both of these were processed using map algebra in ArcMap 10.1. The logistic regression equation with the model parameters computed by the statistical software package SAS was expressed in map algebra as follows:
p   =   exp ( 15.9290   +   ELEV   ×   0.0106   +   AGE   ×   0.0215 +   SOIL   ×   0.3530 +   SPRUCE   ×   0.0288   +   DIR_K ×   0.0469     SPEED_K ×   0.1026 ) / ( 1   +   exp ( 15.9290   +   ELEV   ×   0.0106   +   AGE ×   0.0215 +   SOIL   ×   0.3530   +   SPRUCE   ×   0.0288   +   DIR_K ×   0.0469     SPEED_K   ×   0.1026 ) )
where:
  • p—probability of windthrow risk occurrence;
  • ELEV—elevation;
  • AGE—age;
  • SOIL—depth;
  • SPRUCE—spruce occurrence;
  • DIR_K—wind direction during the Kyrill cyclone;
  • SPEED_K—wind speed during the Kyrill cyclone.
The graph of probability intervals of forest at risk from windthrow (Figure 2) and the map of semi-surfaces caused by the Kyrill (Figure 3) provide evidence that more than 56% of the study area falls within the intervals with the lowest probability values of 0 and 0.05. Areas with probability value intervals 0.06–0.10; 0.11–0.15; 0.16–0.25; and 0.26–0.50, cover approximately 38% of the study area. The interval with the highest probability of the occurrence of windthrow covers approximately 4.1% of the study area.
The risk map (Figure 4) indicates that the intervals with the highest probability of the occurrence of windthrow overlap with the windthrow areas caused by the Kyrill cyclone (see Figure 3), which validates the correctness of the model results. Validation was carried out on a test area consisting of approximately 3000 units (25 × 25) that were excluded from the logistic regression model (parameters of the logistic regression were not calculated from the points (segmentation data) in this area, to ensure independence of the validation). Wind damage was used as a dependent variable in the model (however, it was validated on an independent data set—a small part of the area of interest (AOI) excluded from the analysis).
A significant match between the data from the forest risk map and the real occurrence of windthrow caused by the Kyrill cyclone is evident, especially at the interval with the highest risk values of 0.51–0.99. Almost 74% of the areas in the probability range of the occurrence of the windthrow were located in the half-surfaces caused by the Kyrill cyclone.
Extending the probability interval of 0.51–0.99 to include the additional intervals of 0.11–0.15; 0.16–0.25; and 0.26–0.50, which represent moderate to medium risks of wind damage, increased the match between the achieved results and the polar surfaces caused by the Kyrill cyclone to 86.2%.
Through evaluation of the opposite type of error (i.e., percentage of false field predictions of windthrow), it was found that approximately 26% of the predicted windthrow areas were falsely predicted (i.e., 26% of the windthrow occurrence probability 0.5–1.0 were located in areas that were not damaged by the Kyrill cyclone). The number of correctly predicted windthrows increased with the widening of the probability risk interval. This increased the number of these areas within the total area of the territory. Additionally, the percentage of false predictions also increased. The number of false predictions in the model increased from 1% to 39% when the interval was extended to 0.4–1.0 and from 1% to 49% when the interval was extended to 0.3–1.0. A high coincidence between the windthrow areas caused by the Kyrill cyclone and the probability categories was found when the risk probability interval was extended to a value of 0.1–1.0, with nearly 90% of all the windthrows in this category. However, this category of risk probability (0.1–1.0) covers almost 25% of the study area, while the windthrows caused by the Kyrill cyclone only covered about 10% of the study area. This means that a large percentage of the area was assessed as being at risk, even though windthrows did not occur there. Therefore, this category also had the highest frequency of false predictions of windthrows.
Based on the results obtained through logistic regression and GIS, it was found that the probability of the occurrence of windthrows mainly increases with higher elevation (ELEV), the higher age of stands (AGE), and the higher percentage of spruce in the stands (SPRUCE). Wind direction (DIR_K) also significantly influences the risk of windthrow.

4. Discussion

The sensitivity of forest stands to windthrow is mainly caused by a high proportion of coniferous trees in forest stands [45]. The presence of spruce in the forest also had a significant impact on the financial cost of the damage caused by the Kyrill cyclone in the study area, as was expected. The most damaged trees (more than 60% of all damage) were located in stands with more than 91% spruce. The number of forests damaged by the wind also decreased with a decreasing percentage of spruce trees in the stand. The influence of spruce in a stand was also found to be a statistically significant independent variable and was therefore used for risk assessment with the statistical method of logistic regression. Based on a long series of observations of forest stands in southwestern Germany [46], wind damage was most observed in the stands where Norway spruce (47%) and Pseudotsuga menziesii (21%) dominated. Only 11% of the damage was found in stands with deciduous trees (9% beech, 2% oak). Due to the presence of spruce in wind-resistant stands, the study by Usbeck et al. [47] found that an increasing presence of Norway spruce increases the probability of wind damage. If the Norway spruce dominates, and there are 25–30% of deciduous trees, the probability of wind damage is reduced by approximately 50% compared to stands with spruce only. The above-described findings are supported by earlier studies, such as the study by Valinger and Fridman [48].
Windthrow risk modelling in coniferous monocultures has been widely examined on a local and a regional scale. For example, a risk model for damage to Norway spruce dominated forests caused by wind [49] was associated with the following groups of factors: the variable characteristics of a forest stand, its permanent characteristics, the position of a forest district in a region of the country, and the damage that occurred to the stand in the past. The model was used for the assessment of risk to forest stands near Cracow (Poland).
The study by Quine and Gardiner [50] outlined four sets of factors that influence the probability of wind forest damage: meteorological characteristics, habitat characteristics, surface conditions, and tree and stand qualities. This article is based on this fundamental definition of factors. The most relevant factor in wind damage to forests is the type of wood and the height of the stand [51]. The influence of the stand structure on the financial cost of forest damage caused by wind has been confirmed by numerous studies [52]. Another study [53] highlighted the fact that a stand’s susceptibility to wind damage is not always heavily dependent on the species but is also often significantly associated with the depth of rooting and the soil type. Understanding the relationship between the root system and the soil is essential to an improvement in the modelling of root system immunity and in the subsequent uprooting of trees [54].
In Japan, for example, there is a greater risk of wind damage to stands over 41 years of age than to younger stands, with damage to older stands being closely related to their structure, in particular height, trunk diameter, and crown size [55]. However, damage is not always proportional to the age of the stands. Another study [56] analyzed approximately 30,000 trees (nine tree species) in Minnesota (USA) using a logistic regression method. It found that the damage was highest in mature stands aged 90 to 125 years, while the very old stands (126 to 200 years) were less damaged. Stand fragmentation can also increase the susceptibility of forest stands to wind damage because the occurrence of stand edges is a source of potential wind damage and is of major importance for the structure of stands, animal species, the microclimate, and processes in the ecosystem [57].
An empirical approach was applied in this article and was extended by integrating the logistic regression method into geographic information systems. The advantage of GIS applications is in the ability to perform effective spatial analyses of stands in a short time and to obtain clearly visualized data (Figure 4). This data can be used immediately as a decision-making support tool for forest management and for planning, both on a local scale and on the scale of an entire forested landscape. The application of GIS technology to the empirical windthrow risk model is of great importance in protected areas where the aim is to maintain forest biodiversity [58].
The local risk of windthrow is the result of the interactions of several factors, such as climatic conditions [59], relief [60], and soil and stand characteristics [61]. This is generally confirmed by the results of this article. We have found chi-squared values to be lower for soil depth than for other variables. Similarly, the authors tested the semi-empirical wind-risk model ForestGALES [62] and found soil type and rooting depth to be variables that contribute only marginally to the variation inputs. Soil characteristic can be fixed at a nominal value without significantly affecting the predictions of the model. Soil type [63], soil pH [64], soil moisture, and soil depth [65] are additional factors that may influence the susceptibility of the tree to windthrow. According to Schaetzl et al. [66], trees growing in moist, gleyed, and organic soils are more susceptible to being uprooted than those growing in well-drained soils. Through the statistical evaluation of the stand site, no significant influence of soil characteristics on the height of the forest stands was found in the study area and the above-mentioned facts were not confirmed. The insignificant influence of soil moisture on the financial cost of damage in the study area could be because the Kyrill cyclone hit the territory of Šumava National Park in January when most of the forest land was frozen.
Through statistical data and geographical analysis of the local occurrence of windthrow, it was found that the damage caused by the Kyrill cyclone increased with elevation in the study area and that the highest occurrence of the windthrow surfaces was identified at elevation above 1200 m a.s.l. This is in accordance with some studies [67,68] that highlighted positive effects of higher elevation on tree and stand stability. Similar results are presented in study [69] which analyzed the factors influencing the damage caused by wind and snow in the Beskydy Mountains (the eastern part of the Czech Republic), where wind damage significantly correlated with elevation. The significant correlation of elevation damage is in agreement with the fact that the speed of the wind correlates with increasing altitude in the Czech Republic [70]. These results contradict the findings of a previous study [71] that attached little importance to the elevation factor in relation to forest damage. However, elevation (within the topography gradient of the forest landscape) is generally a significant environmental factor for forest ecosystems [72]. The importance of the elevation factor will probably increase in the future, because recent climate warming has shifted the timing of spring and autumn vegetation phenological events in the mountain forest ecosystems of Europe. Consequently, the length of the growing season in mountain areas of European forests has been extended [73] and this can affect mountain forest stand stability. Climate changes in European mountain forests are followed by an increase in the abundance of invasive forest pathogens, which have increased exponentially in the last four decades and have affected tree physiology and stability [74,75]. Thus, changed climatic conditions as predicted by climatic change scenarios will result in the destabilization of existing Norway spruce stands [76]. This is apart from our unexpected results from the statistical analyses, which proved that the incidence of wind damage correlates to the increasing thickness of the stand, because the elevation of CO2 has an important impact on the Norway spruce’s root system [77], stem respiration [78], and needle parameters [79]. This requires the serious attention of forest research in the context of the catastrophic storm damage that has increased over recent decades in many forested regions in Europe [80]. Logistic regression analysis seems to be a very beneficial tool for creating a storm sensitivity index [81], which (in combination with climate change signals) can promote the development of forest protection measures.
Another factor that significantly affected windthrow occurrence after the Kyrill cyclone in Šumava National Park was the age of the forest stands. This factor was identified in this article as being statistically significant. A high correlation with the age of the stand was also found in the mean thickness and height of the stand. The influence of the age of the stand on the financial cost of damage is confirmed by Savill et al. [82]. They concluded that the increasing age of stands increases their susceptibility to wind damage and when comparing conifers with deciduous trees, coniferous stands are much more susceptible to wind damage from a young age and the risks increase with age [83]. Generally, as the height of stands increases, the probability of damage also increases [84]. Surprisingly, the results of tree growth simulation model testing [85] indicate that tree height is a factor that is more strongly influenced by the simulated storm damage than different forest management regimes. Height has been found to be an important factor that increases the susceptibility of stands to wind damage in this study. This is in accordance with the results of a statistical logistic regression model from Scottish upland coniferous forests [86], which demonstrated that increasing tree height and local wind speed during a storm were the main factors associated with increased damage levels. With the increasing height of the stands, the probability of damage caused by the Kyrill cyclone in the study area, where damage to forest stands of up to 25 m occurred, also increased. The highest trees (30.1–38 m) are very rare in the study area and surprisingly they had a lower percentage of windthrows. The average diameter at breast height of the stand also correlated with its height and age. Statistical analysis proved that the incidence of damage caused by wind increased with the increasing diameter at breast height of the stand.
Sustainable forest management should focus on spatially re-engineering a forest landscape for the production of ecological, economic, and socio-cultural values [87]. Currently, we can observe a shift in the focus of forest management in many European countries, from resource-based to holistic management planning, which takes into account a wide range of risks in order to achieve multifunctional forests [88]. The windthrow risk empirical model can be seen as an essential decision support tool. Models are indispensable tools in the implementation of ecosystem-based forest management plans, because they enable us to find the optimal combinations of alternatives [89]. This is of extraordinary importance in non-native Norway spruce-dominated forests, included in the Natura 2000 European network of protected areas [90], which are very sensitive to natural disturbances such as windthrow.

5. Conclusions

Based on the results of the geographical analysis of forest stands in terms of occurrence of forest stands and on the basis of an empirical approach that used the logistic regression method in the study area of Šumava National Park, it was found that more than 57% of the study area is located at intervals with the lowest risk. About 38% of the forest area is moderately affected by strong winds, and 4.1% of the study area is the most vulnerable to windthrow damage. The probability of windthrow occurrence increases with altitude, the age of stands, and higher percentages of spruce in the stands. The financial cost of damage was also significantly affected by wind direction during the Kyrill cyclone. On the other hand, soil moisture and soil depth were found to be variables with little statistical significance.
By integrating GIS and logistic regression, there was a relatively close agreement between the results achieved in this study and the observed data regarding the Kyrill cyclone.
The methodical verification of the importance of the integration of the logistic regression method and geographic information systems is the main benefit of this study. Additionally, the results achieved in this study are applicable to the management of Šumava National Park. In regard to the logistic regression method, future research should be aimed at testing models in other locations, with an emphasis on the portability of various models for different mountain forested landscapes in Europe. Exciting results could be achieved by testing other windthrow risk assessment methods, such as neural networks, classification and regression trees, and generalized linear networks.

Acknowledgments

The input data for the analyses were obtained within the Interreg IIIB CADSES project “STRiM: Remotely Accessed Decision Support System for Transnational Environmental Risk Management” (CZ.04.4.86/4.2.00.4/0081) at the Institute of Geoinformation Technologies in the Faculty of Forestry and Wood Technology of the Mendel University in Brno. The authors thank the Šumava National Park Administration for their active cooperation and data related to the course and consequences of the Kyrill cyclone in the study area. The authors are grateful for the valuable comments received, including those by anonymous reviewers, concerning the text of the manuscript.

Author Contributions

Lukas Krejci conceived and designed the model and analyzed data by GIS; Jaromir Kolejka contributed to the landscape ecology aspects; Vit Vozenilek supervised spatial analysis in GIS and compiled the paper; Ivo Machar contributed to forest management implications and interpreted the results from modelling.

Conflicts of Interest

The authors declare no conflict of interest.

References

  1. Turner, M.G. Landscape ecology: The effect of pattern on process. Annu. Rev. Ecol. Syst. 1989, 20, 171–197. [Google Scholar] [CrossRef]
  2. Pechanec, V.; Brus, J.; Kilianová, H.; Machar, I. Decision support tool for the evaluation of landscapes. Ecol. Inform. 2015. [Google Scholar] [CrossRef]
  3. Baskent, E.Z. Forest landscape modelling as a tool to develop conservation targets. In Setting Conservation Targets for Managed Forest Landscapes; Villard, M.A., Jonsson, B.G., Eds.; Cambridge University Press: Cambridge, UK, 2009; pp. 304–327. [Google Scholar]
  4. Spathelf, P. Sustainable Forest Management as a Model for Sustainbale Development: Conclusions Toward a Concrete Vision. Sustain. For. Manag. Chang. World Manag. For. Ecosyst. 2009, 19, 237–240. [Google Scholar] [CrossRef]
  5. Buongiorno, J.; Gilless, J.K. Decision Methods for Forest Resource Management; Academic Press: Amsterdam, The Netherlands, 2003; 439p, ISBN 9780121413606. [Google Scholar]
  6. Noss, R.F. Indicators for monitoring biodiversity: A hierarchical approach. Conserv. Biol. 1989, 4, 355–364. [Google Scholar] [CrossRef]
  7. Lingua, E.; Garbarino, M.; Mondino, E.B.; Motta, R. Natural disturbance dynamics in an old-growth forest: From tree to landscape. Procedia Environ. Sci. 2011, 7, 365–370. [Google Scholar] [CrossRef]
  8. Nilsson, S.G. Selecting biodiversity indicators to set conservation targets: Species, structures or processes? In Setting Conservation Targets for Managed Forest Landscapes; Villard, M.A., Jonsson, B.G., Eds.; Cambridge University Press: Cambridge, UK, 2009; pp. 79–108. [Google Scholar]
  9. Bengtsson, J.; Nilsson, S.G.; Franc, A.; Menozzi, P. Biodiversity, disturbances, ecosystem function and management of European forests. For. Ecol. Manag. 2000, 132, 39–50. [Google Scholar] [CrossRef]
  10. Nilsson, S.G.; Niklasson, M.; Hedin, J.; Eliasson, P.; Ljungberg, H. Biodiversity and sustainable forestry in changing landscapes—Principles and southern Sweden as an example. J. Sustain. For. 2005, 21, 12–42. [Google Scholar] [CrossRef]
  11. Vacchiano, G.; Garbarino, M.; Lingua, E.; Motta, R. Forest dynamics and disturbance regimes in the Italian Apennines. For. Ecol. Manag. 2017, 388, 57–66. [Google Scholar] [CrossRef]
  12. Kilianova, H.; Pechanec, V.; Brus, J.; Kirchner, K.; Machar, I. Analysis of the development of land use in the Morava River floodplain, with special emphasis on the landscape matrix. Morav. Geogr. Records 2017, 25, 46–59. [Google Scholar] [CrossRef]
  13. Müller, J.; Bussler, H.; Gossner, M.; Rettelbach, T.; Duelli, P. The European spruce bark beetle Ips typographus in a national park: From pest to keystone species. Biodivers. Conserv. 2008, 17, 2979–3001. [Google Scholar] [CrossRef]
  14. Macek, M.; Wild, J.; Kopecky, M.; Cervenka, J.; Svoboda, M.; Zenahlikova, J.; Bruna, J.; Mosandl, R.; Fischer, A. Life and death of Picea abies after bark-beetle outbreak: Ecological processes driving seedlings recruitment. Ecol. Appl. 2017, 27, 156–167. [Google Scholar] [CrossRef] [PubMed]
  15. Hanewinkel, M.; Hummel, S.; Albrecht, A. Assessing natural hazards in forestry for risk management: A review. Eur. J. For. Res. 2011, 130, 329–351. [Google Scholar] [CrossRef]
  16. Kulakowski, D.; Svoboda, M.; Bebi, P. The central role of disturbances in mountain forests in Europe. For. Ecol. Manag. 2017, 388, 1–2. [Google Scholar] [CrossRef]
  17. Panayotov, M.; Gogushev, G.; Tsavkov, E.; Vasileva, P.; Tsvetanov, N.; Kulakowski, D.; Bebi, P. Abiotic disturbances in Bulgarian mountain coniferous forests—An overview. For. Ecol. Manag. 2017, 388, 13–28. [Google Scholar] [CrossRef]
  18. Seidl, R.; Schelhaas, M.J.; Rammer, W.; Ververk, P.J. Increasing forest disturbances in Europe and their impact on carbon storage. Nat. Clim. Chang. 2014, 4, 806–810. [Google Scholar] [CrossRef] [PubMed]
  19. Del Rio, M.; Pretzsch, H.; Alberdi, I.; Bielak, K.; Bravo, F.; Brunner, A.; Condes, S.; Ducey, M.J.; Fonseca, T.; von Lupke, N.; et al. Characterization of the structure, dynamics, and productivity of mixed-species stands: Review and perspectives. Eur. J. For. Res. 2016, 135, 23–49. [Google Scholar] [CrossRef]
  20. Cada, V.; Morissey, R.C.; Michalova, Z.; Bace, R.; Janda, P.; Svoboda, M. Frequent severe natural disturbances and non-equilibrium landscape dynamics shaped the mountain spruce forest in central Europe. For. Ecol. Manag. 2016, 363, 169–178. [Google Scholar] [CrossRef]
  21. Bebi, P.; Seidl, R.; Motta, R.; Fuhr, M.; Firm, D.; Krumm, F.; Conedera, M.; Ginzler, C.; Wohlgemuth, T.; Kulakowski, D. Changes of forest cover and disturbance regimes in the mountain forests of the Alps. For. Ecol. Manag. 2017, 388, 43–56. [Google Scholar] [CrossRef] [PubMed]
  22. Hanewinkel, M.; Peltola, H.; Soares, P.; González-Olabarria, J.R. Recent approaches to model the risk of storm and fire to European forests and their integration into simulation and decision support tools. For. Syst. 2010, 19, 30–47. [Google Scholar]
  23. Peltola, H.; Kellomaki, S.; Vaisanen, H.; Ikonen, V.P. A mechanistic model for assessing the risk of wind and snow damage to single trees and stands of Scots pine, Norway spruce, and birch. Can. J. For. Res. 1999, 29, 647–661. [Google Scholar] [CrossRef]
  24. Scott, R.E.; Mitchell, S.J. Empirical modelling of windthrow risk in partially harvested stands using tree, neighbourhood, and stand attributes. For. Ecol. Manag. 2005, 218, 193–209. [Google Scholar] [CrossRef]
  25. Lanquaye-Opoku, N.; Mitchell, S.J. Portability of stand-level empirical windthrow risk models. For. Ecol. Manag. 2005, 216, 134–148. [Google Scholar] [CrossRef]
  26. Kamimura, K.; Gardiner, B.; Dupont, S.; Guyon, D.; Meredieu, C. Mechanistic and statistical approaches to predicting wind damage to individual maritime pine (Pinus pinaster) trees in forests. Can. J. For. Res. 2015, 46, 88–100. [Google Scholar] [CrossRef]
  27. Gardiner, B.A.; Quine, C.P. Management of forests to reduce the risk of abiotic damage—A review with particular reference to the effects of strong winds. For. Ecol. Manag. 2000, 135, 261–277. [Google Scholar] [CrossRef]
  28. Ennos, A.R. Wind as an ecological factor. Trends Ecol. Evol. 1997, 12, 108–111. [Google Scholar] [CrossRef]
  29. Quine, C.P. Estimation of mean wind climate and probability of strong winds from assessments of relative windiness. Forestry 2000, 73, 247–258. [Google Scholar] [CrossRef]
  30. Gardiner, B.; Byrne, K.; Hale, S.; Kamimura, K.; Mitchell, S.J.; Peltola, H.; Ruel, J.C. Review of mechanistic modelling of wind damage risk to forests. Forestry 2008, 81, 447–463. [Google Scholar] [CrossRef]
  31. Schelhaas, M.J.; Nabuurs, G.J.; Schuck, A. Natural disturbances in the European forests in the 19th and 20th centuries. Glob. Chang. Biol. 2003, 9, 1620–1633. [Google Scholar] [CrossRef]
  32. Samec, P.; Vozenilek, V.; Vondrakova, A.; Macku, J. Diversity of forest soils and bedrock in soil regions of the Central-European highlands (Czech Republic). Catena 2018, 160, 95–102. [Google Scholar] [CrossRef]
  33. Vacek, S.; Podrázský, V. Forest ecosystems of the Šumava Mts. and their management. J. For. Sci. 2003, 49, 291–301. [Google Scholar] [CrossRef]
  34. Šantrůčková, H.; Vrba, J.; Křenová, Z.; Svoboda, M.; Benčoková, A.; Edwards, M.; Fuchs, R.; Hais, M.; Hruška, J.; Kopáček, J.; et al. Co vyprávějí šumavské smrčiny. (What Spruce Forests in Šumava Mts. Tell Us); South Bohemian University: České Budějovice, Czech Republic, 2010; ISBN 978-80-87257-04-3. [Google Scholar]
  35. Thorn, S.; Bassler, C.; Svoboda, M.; Mueller, J. Effects of natural disturbances and salvage logging on biodiversity—Lessons from the Bohemian Forest. For. Ecol. Manag. 2017, 388, 113–119. [Google Scholar] [CrossRef]
  36. Svoboda, M.; Pouska, V. Structure of a Central-European mountain spruce old-growth forest with respect to historical development. For. Ecol. Manag. 2008, 255, 2177–2188. [Google Scholar] [CrossRef]
  37. Tolasz, R.; Mikova, T.; Valeriánova, A.; Vozenilek, V. Atlas podnebí Česka (Climate in Czechia); Palacky University and ČHMU: Prague, Czech Republic, 2007; 255p. [Google Scholar]
  38. Bohn, U.; Neuhäusl, R.; Gollub, G.; Hettwer, C.; Neuhäuslová, Z.; Schlüter, H.; Weber, H. Map of the Natural Vegetation of Europe. Scale 1:2500000; Landwirtschaftsverlag: Münster, Germany, 2002. [Google Scholar]
  39. Machar, I.; Vozenilek, V.; Kirchner, K.; Vlckova, V.; Bucek, A. Biogeographic model of climate conditions for vegetation zones in Czechia. Geografie 2017, 122, 64–82. [Google Scholar]
  40. Machar, I.; Vlckova, V.; Bucek, A.; Vozenilek, V.; Salek, L.; Jerabkova, L. Modelling of Climate Conditions in Forest Vegetation Zones as a Support Tool for Forest Management Strategy in European Beech Dominated Forests. Forests 2017, 8, 82. [Google Scholar] [CrossRef]
  41. Machar, I.; Vozenilek, V.; Simon, J.; Pechanec, V.; Brus, J.; Fulnecek, P.; Vitek, T. Joining of the historical research and future prediction as a support tool for the assessment of management strategy for European beech-dominated forests in protected areas. Nat. Conserv. 2017, 22, 51–78. [Google Scholar] [CrossRef]
  42. Machar, I.; Simon, J.; Brus, J.; Pechanec, V.; Kiliánová, H.; Filippovová, J.; Vrublová, K.; Mackovcin, P. A growth simulation model as a support tool for conservation management strategy in a mountain protected area. J. Protect. Mount. Areas Res. 2018, 10, 61–69. [Google Scholar] [CrossRef]
  43. Vondrakova, A.; Vavra, A.; Vozenilek, V. Climatic Regions of the Czech Republic. J. Maps 2013, 9, 425–430. [Google Scholar] [CrossRef]
  44. Kudelka, M.; Horak, Z.; Vozenilek, V.; Snasel, V. Ortophoto feature extraction and clustering. Neural Netw. World 2012, 22, 103–121. [Google Scholar] [CrossRef]
  45. Klaus, M.; Holsten, A.; Hostert, P.; Kropp, J.P. Integrated methodology to assess windthrow impacts on forest stands under climate change. For. Ecol. Manag. 2011, 261, 1799–1810. [Google Scholar] [CrossRef]
  46. Albrecht, A.; Hanewinkel, M.; Bauhus, J.; Kohnle, U. How does silviculture affect storm damage in forests of south-western Germany? Results from empirical modeling based on long-term observations. Eur. J. For. Res. 2012, 131, 229–247. [Google Scholar] [CrossRef]
  47. Usbeck, T.; Wohlgemuth, T.; Dobbertin, M.; Pfister, C.; Bürgi, A.; Rebetez, M. Increasing storm damage to forests in Switzerland from 1858 to 2007. Agric. For. Meteorol. 2010, 150, 47–55. [Google Scholar] [CrossRef]
  48. Valinger, E.; Fridman, J. Modelling the probability of snow and wind damage in Scots pine stands using tree characteristics. For. Ecol. Manag. 1997, 97, 215–222. [Google Scholar] [CrossRef]
  49. Bruchwald, A.; Dmyterko, E. Application of wind damage risk models for the assessment of danger to stands within a forest district. Sylwan 2011, 155, 459–471. [Google Scholar]
  50. Quine, C.P.; Gardiner, B.A. Understanding how the interaction of wind and trees results in windthrow, stem breakage, and canopy gap formation. In Plant Disturbance Ecology—Process and Response; Johnson, E.A., Miyanishi, K., Eds.; Elsevier: Amsterdam, The Netherlands, 2007; pp. 103–155. [Google Scholar]
  51. Valinger, E.; Fridman, J. Factors affecting the probability of windthrow at stand level as a result of Gudrun winter storm in southern Sweden. For. Ecol. Manag. 2011, 262, 398–403. [Google Scholar] [CrossRef]
  52. Nicoll, B.C.; Gardiner, B.A.; Rayner, B.; Peace, A.J. Anchorage of coniferous trees in relation to species, soil type and rooting depth. Can. J. For. Res. 2006, 36, 1871–1883. [Google Scholar] [CrossRef]
  53. Schindler, D.; Bauhus, J.; Mayer, H. Wind effects on trees. Eur. J. For. Res. 2012, 131, 159–163. [Google Scholar] [CrossRef]
  54. Lekes, V.; Dandul, I. Using airflow modelling and spatial analysis for defining wind damage risk classification (WINDARC). For. Ecol. Manag. 1999, 135, 331–344. [Google Scholar] [CrossRef]
  55. Kuboyama, H.; Zheng, Y.; Oka, H. Study about damage probabilities on major forest climatic risks according to ageclasses [in Japanese with English summary]. J. Jpn. For. Soc. 2003, 85, 191–198. [Google Scholar]
  56. Rich, R.L.; Frelich, L.E.; Reich, P.B. Wind-throw mortality in the southern boreal forest: Effects of species, diameter and stand age. J. Ecol. 2007, 95, 1261–1273. [Google Scholar] [CrossRef]
  57. Zheng, D.; Chen, J.; LeMoine, J.M.; Euskirchen, E.S. Influences of land- use change and edges on soil respiration in a managed forest landscape, WI, USA. For. Ecol. Manag. 2005, 215, 169–182. [Google Scholar] [CrossRef]
  58. Tucek, P.; Caha, J.; Janoska, Z.; Vondrakova, A.; Samec, P.; Vozenilek, V.; Bojko, J. Forest vulnerability zones in the Czech Republic. J. Maps 2014, 10, 179–182. [Google Scholar] [CrossRef]
  59. Marjanovic, M.; Kovacevic, M.; Bajat, B.; Vozenilek, V. Landslide susceptibility assessment using SVM machine learning algorithm. Eng. Geol. 2011, 123, 225–234. [Google Scholar] [CrossRef]
  60. Svobodova, J.; Vozenilek, V. Relief for models of natural phenomena. In Landscape Modelling: Geographical Space, Transformation and Future Scenarios (Urban and Landscape Perspectives); Anděl, J., Bičík, I., Dostál, P., Shasneshin, S., Eds.; Springer: Dordrecht, The Netherlands, 2010; pp. 183–196. [Google Scholar] [CrossRef]
  61. Ruel, J.C.; Pineau, M. Windthrow as an important process for white spruce regeneration. For. Chron. 2002, 78, 732–738. [Google Scholar] [CrossRef]
  62. Locatelli, T.; Tarantola, S.; Gardiner, B.; Patenaude, G. Variance-based sensitivity analysis of a wind risk model—Model behaviour and lessons for forest modelling. Environ. Modell. Softw. 2017, 87, 84–109. [Google Scholar] [CrossRef]
  63. Kramer, M.G.; Hansen, A.J.; Taper, M.L.; Kissinger, E.J. Abiotic controls on long-term windthrow disturbance and temperate rain forest dynamics in southeast Alaska. Ecology 2001, 82, 2749–2768. [Google Scholar] [CrossRef]
  64. Mayer, P.; Brang, P.; Dobbertin, M.; Hallenbarter, D.; Renaud, J.-P.; Walthert, L.; Zimmermann, S. Forest storm damage is more frequent on acidic soils. Ann. For. Sci. 2005, 62, 303–311. [Google Scholar] [CrossRef]
  65. Stathers, R.J.; Rollerson, T.P.; Mitchell, S.J. Windthrow Handbook for British Columbia Forests; Working Paper 9401; Ministry of Forests: Victoria, BC, Canada, 1994; 38p.
  66. Schaetzl, R.J.; Johnson, D.L.; Burns, S.F.; Small, T.W. Tree uprooting: Review of terminology, process and environmental implications. Can. J. For. Res. 1989, 19, 1–11. [Google Scholar] [CrossRef]
  67. Albrecht, A.; Kohnle, U.; Hanewinkel, M.; Bauhus, J. Storm damage of Douglas-fir unexpectedly high compared to Norway spruce. Ann. For. Sci. 2013, 70, 195–207. [Google Scholar] [CrossRef]
  68. Hale, S.E.; Gardiner, B.; Peace, A.; Nicoll, B.; Taylor, P.; Pizzirani, S. Comparison and validation of three versions of a forest wind risk model. Environ. Modell. Softw. 2015, 68, 27–41. [Google Scholar] [CrossRef] [Green Version]
  69. Holuša, J.; Křístek, Š.; Trombik, J. Stability of spruce forests in the Beskids: An analysis of wind, snow and drought damages. Beskydy 2010, 3, 43–54. [Google Scholar]
  70. Machar, I.; Pechanec, V.; Brus, J.; Kilianova, H.; Kirchner, K. Forest management at the upper treeline in Jeseniky Mountains (Czech Republic). In International Multidisciplinary Scientific GeoConference-SGEM; SGEM, Ed.; STEF92 Technology Ltd.: Albena, Bulgaria, 2014; pp. 361–366. [Google Scholar]
  71. Klopcic, M.; Poljanec, A.; Gartner, A.; Boncina, A. Factors related to natural disturbances in mountain Norway spruce (Picea abies) forests in the Julian Alps. Ecosience 2009, 16, 48–57. [Google Scholar] [CrossRef]
  72. Garbarino, M.; Lingua, E.; Weisberg, P.J.; Bottero, A.; Meloni, F.; Motta, R. Land-use history and topographic gradients as driving factors of subalpine Larix decidua forests. Landsc. Ecol. 2013, 28, 805–817. [Google Scholar] [CrossRef]
  73. Crabbe, R.A.; Dash, J.; Rodriguez-Galiano, V.F.; Janous, D.; Pavelka, M.; Marek, M.V. Extreme warm temperatures alter forest phenology and productivity in Europe. Sci. Total Environ. 2016, 563, 486–495. [Google Scholar] [CrossRef] [PubMed]
  74. Santini, A.; Ghelardini, L.; De Pace, C.; Desprez-Loustau, M.L.; Capretti, P.; Chandelier, A.; Cech, T.; Chira, D.; Diamandis, S.; Gaitniekis, T.; et al. Biogeographical patterns and determinants of invasion by forest pathogens in Europe. New Phytol. 2013, 197, 238–250. [Google Scholar] [CrossRef] [PubMed]
  75. Machar, I. Changes in ecological stability and biodiversity in a floodplain landscape. In Applying Landscape Ecology in Conservation and Management of the Floodplain Forests (Czech Republic); Palacky University: Olomouc, Czech Republic, 2012; pp. 73–78. [Google Scholar]
  76. Jankovsky, L.; Cudlin, P.; Cermak, P.; Moravec, I. The prediction of development of secondary Norway spruce stands under the impact of climatic change in the Drahany Highlands (the Czech Republic). Ekologia-Bratislava 2004, 23, 101–112. [Google Scholar]
  77. Pokorny, R.; Tomaskova, I.; Marek, M.V. Response of Norway spruce root system to elevated atmospheric CO2 concentration. Acta Physiol. Plant. 2013, 35, 1807–1816. [Google Scholar] [CrossRef]
  78. Acosta, M.; Pokorny, R.; Janous, D.; Marek, M.V. Stem respiration of Norway spruce trees under elevated CO2 concentration. Biol. Plant. 2010, 54, 773–776. [Google Scholar] [CrossRef]
  79. Pokorny, R.; Tomaskova, I.; Marek, M.V. The effects of elevated atmospheric [CO2] on Norway spruce needle parameters. Acta Physiol. Plant. 2011, 33, 2269–2277. [Google Scholar] [CrossRef]
  80. Hlasny, T.; Barka, I.; Kulla, L.; Bucha, T.; Sedmak, R.; Trombik, J. Sustainable forest management in a mountain region in the Central Western Carpathians, northeastern Slovakia: The role of climate change. Reg. Environ. Chang. 2017, 17, 65–77. [Google Scholar] [CrossRef]
  81. Lohmander, P.; Helles, F. Windthrow Probability as a Function of Stand Characteristics and Shelter. Scand. J. For. Res. 1987, 2, 227–238. [Google Scholar] [CrossRef]
  82. Savill, P.; Evans, J.; Auclair, D.; Falck, J. Plantation Silviculture in Europe; Oxford University Press: Oxford, UK; New York, NY, USA; Tokyo, Japan, 1997; 297p, ISBN 0198549083. [Google Scholar]
  83. Dobbertin, M. Influence of stand structure and site factors on wind damage comparing the storms Vivian and Lothar. For. Snow Landsc. Res. 2002, 77, 187–205. [Google Scholar]
  84. Albrecht, A.T.; Fortin, M.; Kohnle, U.; Ningre, F. Coupling a tree growth model with storm damage modeling—Conceptual approach and results of scenario simulations. Environ. Modell. Softw. 2015, 69, 63–76. [Google Scholar] [CrossRef]
  85. Machar, I.; Simon, J.; Rejsek, K.; Pechanec, V.; Brus, J.; Kilianova, H. Assessment of Forest Management in Protected Areas Based on Multidisciplinary Research. Forests 2016, 7, 285. [Google Scholar] [CrossRef]
  86. Shtatland, E.S.; Cain, E.; Barton, M.B. The Perils of Stepwise Logistic Regression and How to Escape Them Using Information Criteria and the Output Delivery System; SAS Users Group International (SUGI) 26: Long Beach, CA, USA, 2001. [Google Scholar]
  87. Anyomi, K.A.; Mitchell, S.J.; Perera, A.H.; Ruel, J.C. Windthrow dynamics in boreal Ontario: A simulation of the vulnerability of several stand types across a range of wind speeds. Forests 2017, 8. [Google Scholar] [CrossRef]
  88. Riviere, C. From “wood” as a resource to the multifunctional forest? A study of forest management plans for private properties located in the Regional Natural Park of Alpilles (South of France). Dev. Durable Territ. 2017, 8, 1. [Google Scholar] [CrossRef]
  89. Simon, J.; Machar, I.; Brus, J.; Pechanec, V. Combining a growth-simulation model with acoustic-wood tomography as a decision-support tool for adaptive management and conservation of forest ecosystems. Ecol. Inform. 2015, 30. [Google Scholar] [CrossRef]
  90. Miko, L. Nature and landscape protection in the European context. In Ochrana Prirody a Krajiny v Ceske Republice, Vols I and II; Machar, I., Drobilova, L., Eds.; Palacky University: Olomouc, Czech Republic, 2012; pp. 43–49. ISBN 978-80-244-3041-6. [Google Scholar]
Figure 1. Study area in Central Europe and Šumava National Park (NP Šumava).
Forests 09 00096 g001
Figure 2. The number of probability intervals for forest stands at risk from the wind in the study area.
Forests 09 00096 g002
Figure 3. Semi-surfaces caused by the Kyrill cyclone in 2007 in the study area.
Forests 09 00096 g003
Figure 4. Windthrow risk probability in the study area.
Forests 09 00096 g004
Table 1. Description and values of input independent variables.
Parameter CodeData TypeDescriptionAverageMinimum ValueMaximum ValueUnits
ELEVintegerelevation10477221336meters a.s.l.
SLOPErealslope angle9.4029degrees
ASPECTintegerexposition1760359degrees
AGEintegerage of the stand892223years
DENSrealstand density8.7210level of stand density
SOILstringsoil depthno datano datano data-
SPRUCErealspruce occurrence85.90100percents
MOISstringsoil moistureno datano datano data-
DIR_Kintegerwind direction (Kyrill)317273360degrees
SPEED_Krealwind speed (Kyrill)15.6140m·s−1
THICKrealaverage thickness of spruce25.5066centimeters
HEIGHTintegeraverage height of spruce21038meters
SOIL_Tstringsoil typeno datano datano data-
Table 2. Correlation matrix of independent variables based on the Pearson correlation test with p values (Pearson’s r coefficients/p values). Significant r values are highlighted in bold.
ELEVSLOPEASPECTAGEDENSSOILSPRUCEMOISDIR_KSPEED_KTHICKHEIGHT
ELEV1.00/00.12/0−0.05/00.16/00.16/0−0.32/00.26/00.26/0−0.21/00.62/0−0.06/0−0.16/0
SLOPE0.12/01.00/0−0.08/00.15/00.10/0−0.04/0−0.11/00.35/0−0.10/00.11/0.0070.17/00.17/0
ASPECT−0.05/0−0.08/01.00/0−0.09/00.06/00.04/0−0.11/0−0.03/0−0.05/0−0.17/0.0441−0.11/0−0.12/0
AGE0.16/00.15/0−0.09/01.00/0−0.33/00.01/0.8370.08/00.14/0−0.01/0.5590.06/0−0.09/00.83/0
DENS0.16/00.10/00.06/0−0.33/01.00/00.04/0−0.18/00.06/0−0.08/0−0.07/0−0.22/0−0.15/0
SOIL−0.32/0−0.04/00.04/00.01/0.8370.04/01.00/0−0.15/0−0.20/00.01/0.04−0.18/00.08/00.11/0
SPRUCE0.26/0−0.11/0−0.11/00.08/0−0.18/0−0.15/01.00/0−0.04/00.05/00.13/0−0.01/0−0.07/0
MOIS0.26/00.35/0−0.03/00.14/00.06/0−0.20/0−0.04/01.00/0−0.10/00.34/00.11/00.10/0
DIR_K−0.21/0−0.05/0−0.05/0−0.01/0.559−0.08/00.01/0.040.05/0−0.10/01.00/0−0.37/00.05/00.07/0
SPEED_K0.62/00.11/0.007−0.17/0.4410.06/0−0.07/0−0.18/00.13/00.34/0−0.37/01.00/0−0.08/0−0.14/0
THICK−0.06/00.17/0−0.11/0−0.09/0−0.22/00.08/0−0.01/00.11/00.05/0−0.08/01.00/00.96/0
HEIGHT−0.16/00.17/0−0.12/00.83/0−0.15/00.11/0−0.07/00.10/00.07/0−0.14/00.96/01.00/0
Table 3. Comparison of alternative models.
Variables in the Model2LogLAIC
1None56,055.13356,057.133
2ELEV48,375.39348,379.393
3ELEV + SLOPE48,322.76848,328.768
4ELEV + SLOPE + ASPECT48,322.02448,330.024
5ELEV + SLOPE + ASPECT + AGE42,825.55042,835.550
6ELEV + SLOPE + ASPECT + AGE + DENS42,811.35742,823.357
7ELEV + SLOPE + ASPECT + AGE + DENS + SOIL41,727.09641,741.096
8ELEV + SLOPE + ASPECT + AGE + DENS + SOIL + SPRUCE39,657.97639,673.976
9ELEV + SLOPE + ASPECT + AGE + DENS + SOIL + SPRUCE + PUD_T39,657.84039,675.840
10ELEV + SLOPE + ASPECT + AGE + DENS + SOIL + SPRUCE + PUD_T + MOIS39,585.51739,605.517
11ELEV + SLOPE + ASPECT + AGE + DENS + SOIL + SPRUCE + PUD_T + MOIS + DIR_K37,991.07038,013.070
12ELEV + SLOPE + ASPECT + AGE + DENS + SOIL + SPRUCE + PUD_T + MOIS + DIR_K + SPEED_K36,382.39336,406.390
13ELEV + AGE + SOIL + SPRUCE + DIR_K + SPEED_K37,075.83937,089.839
Table 4. Estimates of model parameters.
ParameterEstimateStandard ErrorWald Chi-SquarePr > Chi-Square
Tercept- ˂0
Intercept−15.9290.2344624.369<0.0001
ELEV0.0110.0002976.051<0.0001
AGE0.0220.0003010.780<0.0001
SOIL0.3530.015571.728<0.0001
SPRUCE0.0290.001431.424<0.0001
DIR_K0.0470.0011115.667<0.0001
SPEED_K−0.1030.0031229.294<0.0001
Note: Pr is two tailed p value of Chi Square distribution.
Table 5. Testing the significance of the selected model.
TestChi-SquareDFPr ˃ Chi-Square
Likelihood Ratio15,152.46016˂0.0001
Score14,712.89496˂0.0001
Wald9850.56536˂0.0001
CriterionIntercept OnlyIntercept and Covariates
AIC52,230.29937,089.839
SC52,239.52337,154.408
−2LogL52,228.29937,075.839
Note: DF is degree of statistical freedom, SC is Schwartz Criterion.

