Article

Effect of Wind on the Relation of Leaf N, P Stoichiometry with Leaf Morphology in Quercus Species

1
East China Coastal Forest Ecosystem Long-Term Research Station, Research Institute of Subtropical Forestry, Chinese Academy of Forestry, Hangzhou 311400, China
2
Dongtai Forest Center, Dongtai 224200, China
3
Department of Forestry and Environmental Conservation, Clemson University, Clemson, SC 29634-0317, USA
*
Author to whom correspondence should be addressed.
Forests 2018, 9(3), 110; https://doi.org/10.3390/f9030110
Submission received: 29 November 2017 / Revised: 2 February 2018 / Accepted: 26 February 2018 / Published: 28 February 2018
(This article belongs to the Section Forest Ecophysiology and Biology)

Abstract

:
Leaf nitrogen (N) and phosphorus (P) stoichiometry correlates closely to leaf morphology, which is strongly impacted by wind at multiple scales. However, it is not clear how leaf N, P stoichiometry and its relationship to leaf morphology changes with wind load. We determined the leaf N and P concentrations and leaf morphology—including specific leaf area (SLA) and leaf dissection index (LDI)—for eight Quercus species under a simulated wind load for seven months. Leaf N and P concentrations increased significantly under these conditions for Quercus acutissima, Quercus rubra, Quercus texana, and Quercus palustris—which have elliptic leaves—due to their higher N, P requirements and a resultant leaf biomass decrease, which is a tolerance strategy for Quercus species under a wind load. Leaf N:P was relatively stable under wind for all species, which supports stoichiometric homeostasis. Leaf N concentrations showed a positive correlation to SLA, leaf N and P concentrations showed positive correlations to LDI under each wind treatment, and the slope of correlations was not affected by wind, which indicates synchronous variations between leaf stoichiometry and leaf morphology under wind. However, the intercept of correlations was affected by wind, and leaf N and P use efficiency decreased under the wind load, which suggests that the Quercus species changes from “fast investment-return” in the control to “slow investment-return” under windy conditions. These results will be valuable to understanding functional strategies for plants under varying wind loads, especially synchronous variations in leaf traits along a wind gradient.

1. Introduction

The leaf economics spectrum (LES) is a general concept describing coordinated variations in leaf traits across environmental gradients [1], which can reflect the adaptation strategy of plants under diverse environmental stresses [2]. It is known that LES refers to leaf life and physiology, and includes two strategies of resource utilization. At the quick-return end, leaves have a high photosynthetic rate, high respiration rate, high nutrient content, short leaf lifespan, and low-cost dry-mass investment; at the slow-return end, leaves present the reverse trend, exhibiting a long leaf lifespan [3,4]. Leaf nitrogen (N), phosphorus (P) stoichiometry is correlated to leaf morphology [1,2,5,6]. For example, leaf N and P concentrations will vary based on the specific leaf area (SLA) [7,8,9], and leaf stoichiometry shows covariations with leaf morphology [6]. Moreover, leaf N, P stoichiometry is closely related to environment. For example, leaf N, P concentrations differ along latitudinal gradients [10]. Less is known, however, about the responses to wind environmental gradients of leaf N, P stoichiometry and its relationship to morphology.
Previous studies have mostly focused on investigating leaf morphology, structure, and physiology in a windy environment, exhibiting synchronous variations [11,12,13]. To adapt to wind, leaf area and SLA decreased [13,14,15], leaf thickness increased [16], and photosynthetic rate decreased due to the long CO2 diffusion path for thick leaves [17]. Therefore, N and P need to be more preferentially allocated to non-photosynthetic functions, such as increasing cell wall thickness to strengthen the leaf’s mechanical toughness [18,19,20]. In a limited number of previous studies, only the leaf N concentration was found to be higher under wind when compared to wind-protected leaves [13,21,22]; leaf P concentrations and N:P were not studied under wind. Leaf P concentrations should exhibit similar trends to N concentrations [10,23,24], and leaf N:P should remain stable along environmental gradients [7,25], due to similar biochemical pathways for N and P [7]. Therefore, two hypotheses are proposed based on the previous studies: 1) leaf N, P concentrations will increase, and leaf N:P will remain stable under a wind load; 2) leaf N, P stoichiometry and leaf morphology will display synchronous variation under a wind load.
Eight Quercus species with diverse leaf shapes—including elliptic and lanceolate leaves—were selected to be tested for their responses to a wind load. Leaf morphological (width, length, SLA, and leaf dissection index (LDI)) and photosynthetic physiological (photosynthesis, transpiration, and stomatal conductance) responses were found in our previous studies, the results of which demonstrated that species with lanceolate leaves or deeply lobed elliptic leaves (higher LDI) exhibited better adaptation to windy conditions [13,17,26]. In this study, leaf N, P concentrations, N:P, and their relations with leaf morphology (SLA, LDI) were determined to test the two hypotheses, which may be valuable to understanding the adaptation strategy for plants in windy environments.

2. Materials and Methods

2.1. Materials and Growing Conditions

Eight Quercus species were collected from the nursery at Research Institute of Subtropical Forestry in Hangzhou: Quercus acutissima Carruth., with elliptic leaves; Quercus rubra L. and Quercus falcata Michx., with shallowly lobed elliptic leaves; Quercus texana Buckl, Quercus palustris Muenchh., and Quercus coccinea Muenchh., with deeply lobed elliptic leaves; and Quercus virginiana Mill. and Quercus phellos L., with lanceolate leaves. Seedlings, 100 individuals for each species, were transplanted to 25 cm deep pots with a 20 cm diameter in January 2013. All transplanted seedlings were acclimated for one month in a greenhouse. Fifty-four average-sized seedlings, of average base diameter and height, per species were then selected for the study.

2.2. Experimental Design

Nine rooms were constructed from glass with a size of 2 m × 2 m × 2 m and were housed within a greenhouse with air temperature between 20 and 35 °C for the entirety of the experiment. Three treatments were designed: control (CK); about 4 m s−1 wind speed (T1); and about 6 m s−1 wind speed (T2). Here, 6 m s−1 was used because it is the annual average wind speed in the open area of our coastal station in Shanghai, and 4 m s−1 is the annual average wind speed on the leeward side of forest windbreaks [27]. Each treatment had three replicates that were randomly assigned to each of the nine rooms. In each room, eight Quercus species, with six seedlings of each species, were randomly placed in each row. The wind load was produced by electric-powered fans for two one-hour durations at 0:00 and 12:00 from 1 March to 7 October, following the procedure developed by Murren and Pigliucci [15]. Each day, each species was moved one row from left to right, and individual trees were moved within the row, to ensure that each species and individual were subjected to similar wind exposure in each treatment room. All trees were watered equally every day with tap water to compensate for evaporative loss. All treatments were identical except for wind load.

2.3. Leaf Morphology and Leaf N and P Concentrations Measurements

After the experiment, healthy and mature fresh leaves were sampled for determining leaf morphology. Thirty leaves were selected from six plants of each species from each room, and scanned to produce digitized images. Leaf perimeter and area were analyzed by Wseen Leaf Area Analysis Systems (Wseen Co., Ltd., Hangzhou, China). Leaves were dried to their constant weight, then weighed to the nearest 0.001 g using an electronic balance (JA12002, Jinghai Instruments Co., Ltd., Shanghai, China). SLA was calculated as leaf area/mass. LDI was calculated by perimeter/square root of area [28].
Each dried sample was ground using a mill and sieved through a 1 mm mesh screen. Leaf N concentration was determined for each sample using an autoanalyser (Kjeltec 2300 Analyzer Unit, Foss, Sweden), and leaf P concentration was determined by inductively coupled plasma atomic emission spectrometry (ICP-OES, Thermo scientific optima 7000 series, Agilent Technologies Inc., Santa Clara, CA, USA) at wave length of 177.4 nm [29]. Leaf N and P data are expressed as dry mass for direct comparison with previous studies.

2.4. Statistical Analysis

The data obtained for leaf N and P concentrations and N:P exhibited significant heteroscedasticity and non-normal distributions using One-Sample Kolmogorov-Smirnov test (Appendix A Table A1). Thus, these variables were transformed using the natural logarithm prior to analysis to eliminate major departures from normality or homogeneity of variances [26].
Scatter plots were then used to visualize the relationships among leaf traits. Standardized major axis slope (SMAs) described bivariate line-fitting scaling relationships among leaf traits. One-way ANOVA was used to test the differences in leaf stoichiometry among wind treatments. All statistics were analyzed by SPSS 15.0 (SPSS, Chicago, IL, USA), and the DOS-based computer package (S) MATR (Version 3.3.3, 2017, Vienna University of Economics and Business, Vienna, Austria) and Excel 2007 (Microsoft Corporation, Redmond, WA, USA).

3. Results

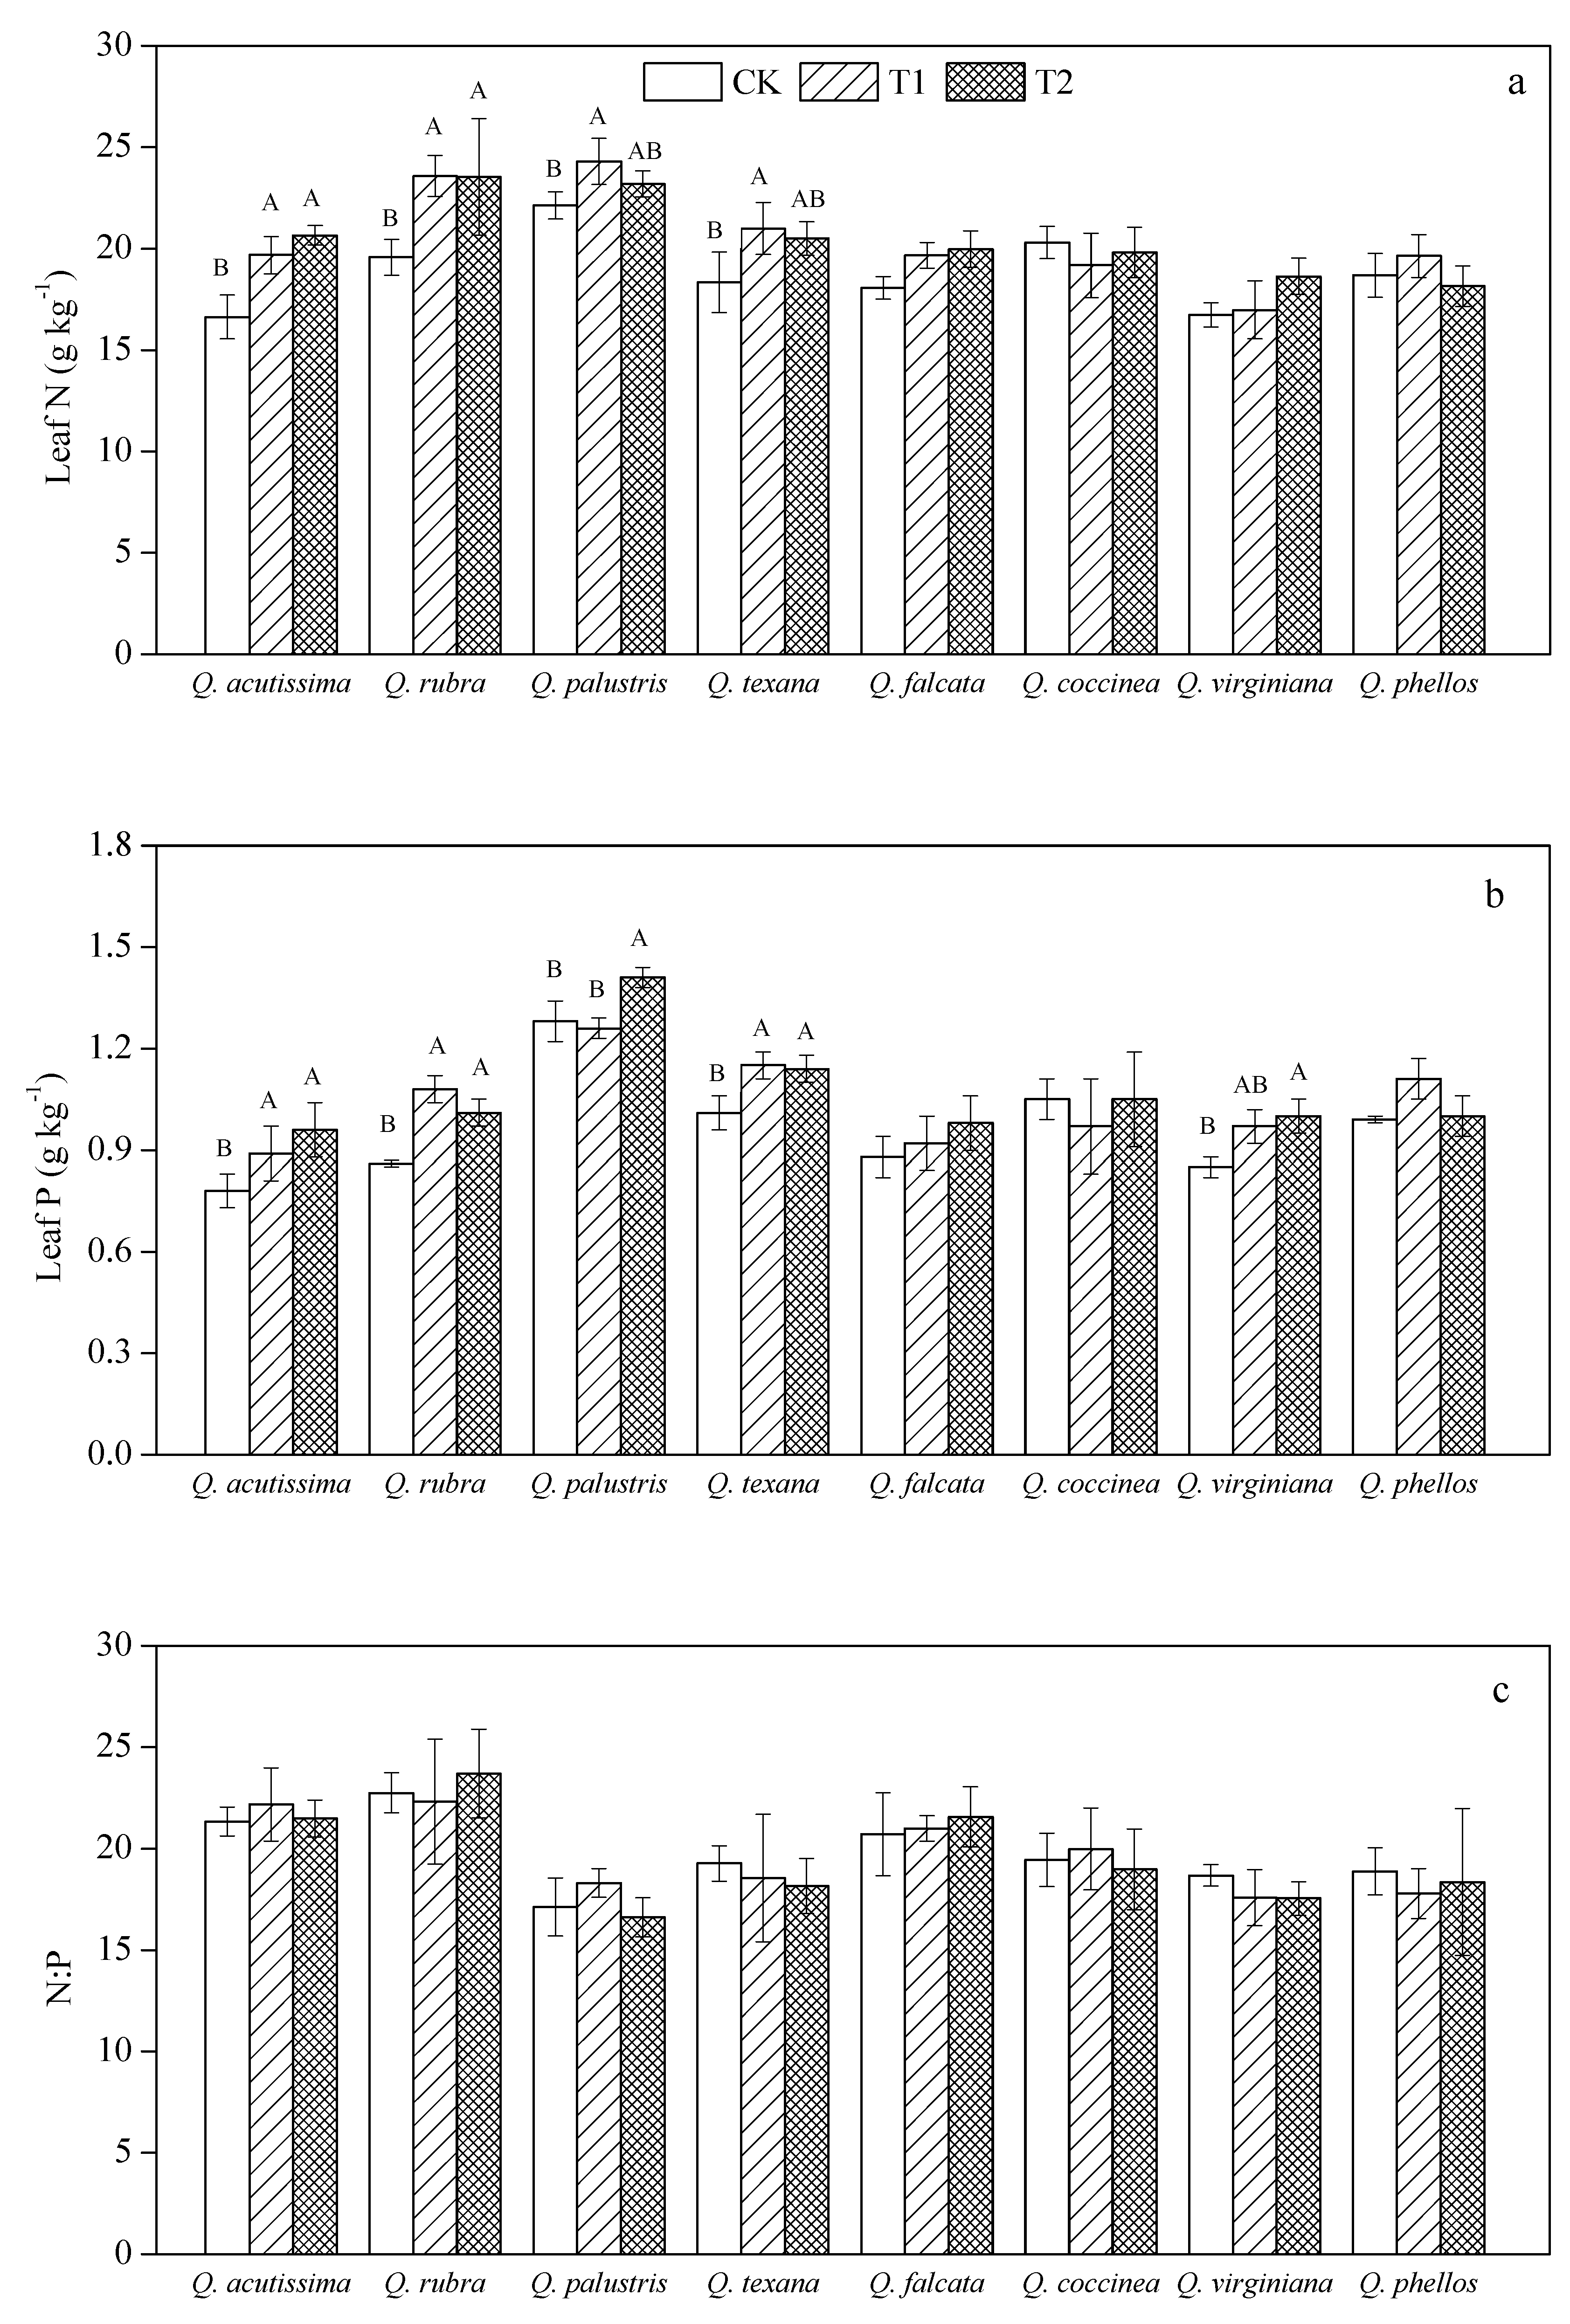
3.1. Effects of Wind on Leaf N, P Stoichiometry for Quercus Species

Both leaf N and P concentrations increased under wind treatments for Q. acutissima, Q. rubra, Q. texana, and Q. palustris, all having elliptic leaves (Figure 1a,b). Only leaf P concentrations increased under wind treatments for Q. virginiana with lanceolate leaves. Leaf N:P was not affected by wind for all species (p > 0.05) (Figure 1c). Leaf N and P concentrations showed positive correlations under each treatment, and SMAs fitted among treatments did not show significant differences in slope (test for SMA heterogeneity, 95% CIS, p = 0.26) and in intercept (p = 0.79) (Figure 2).

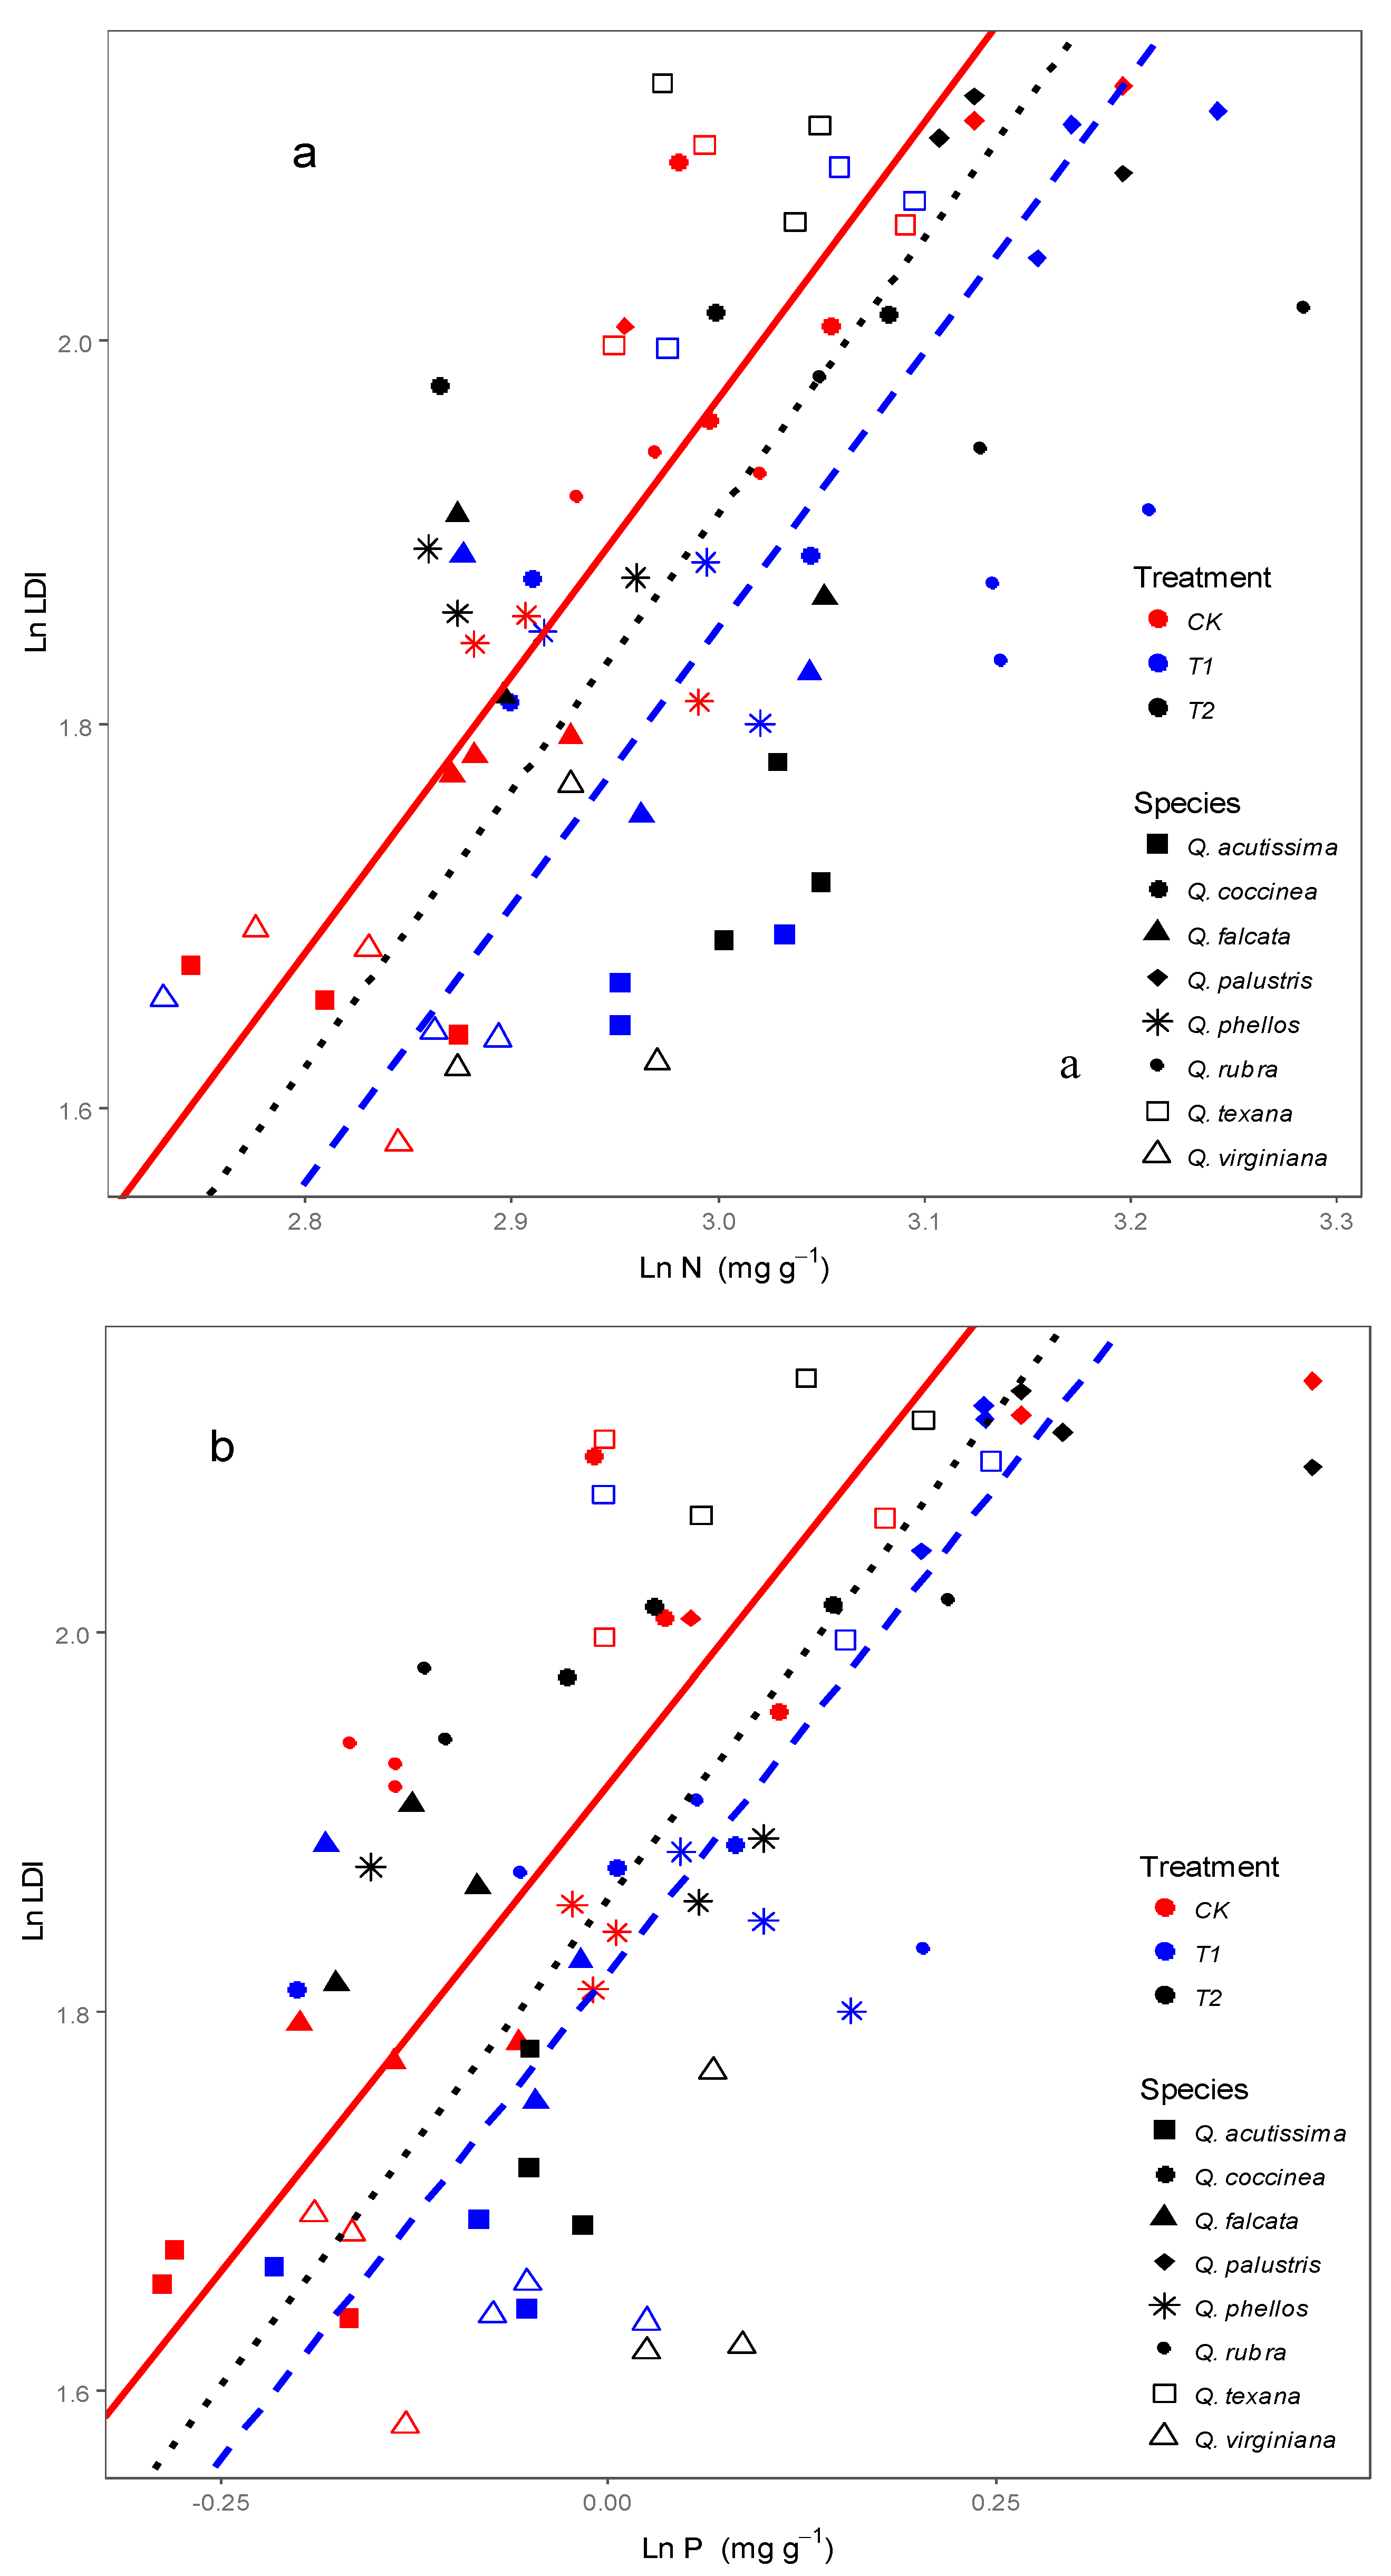
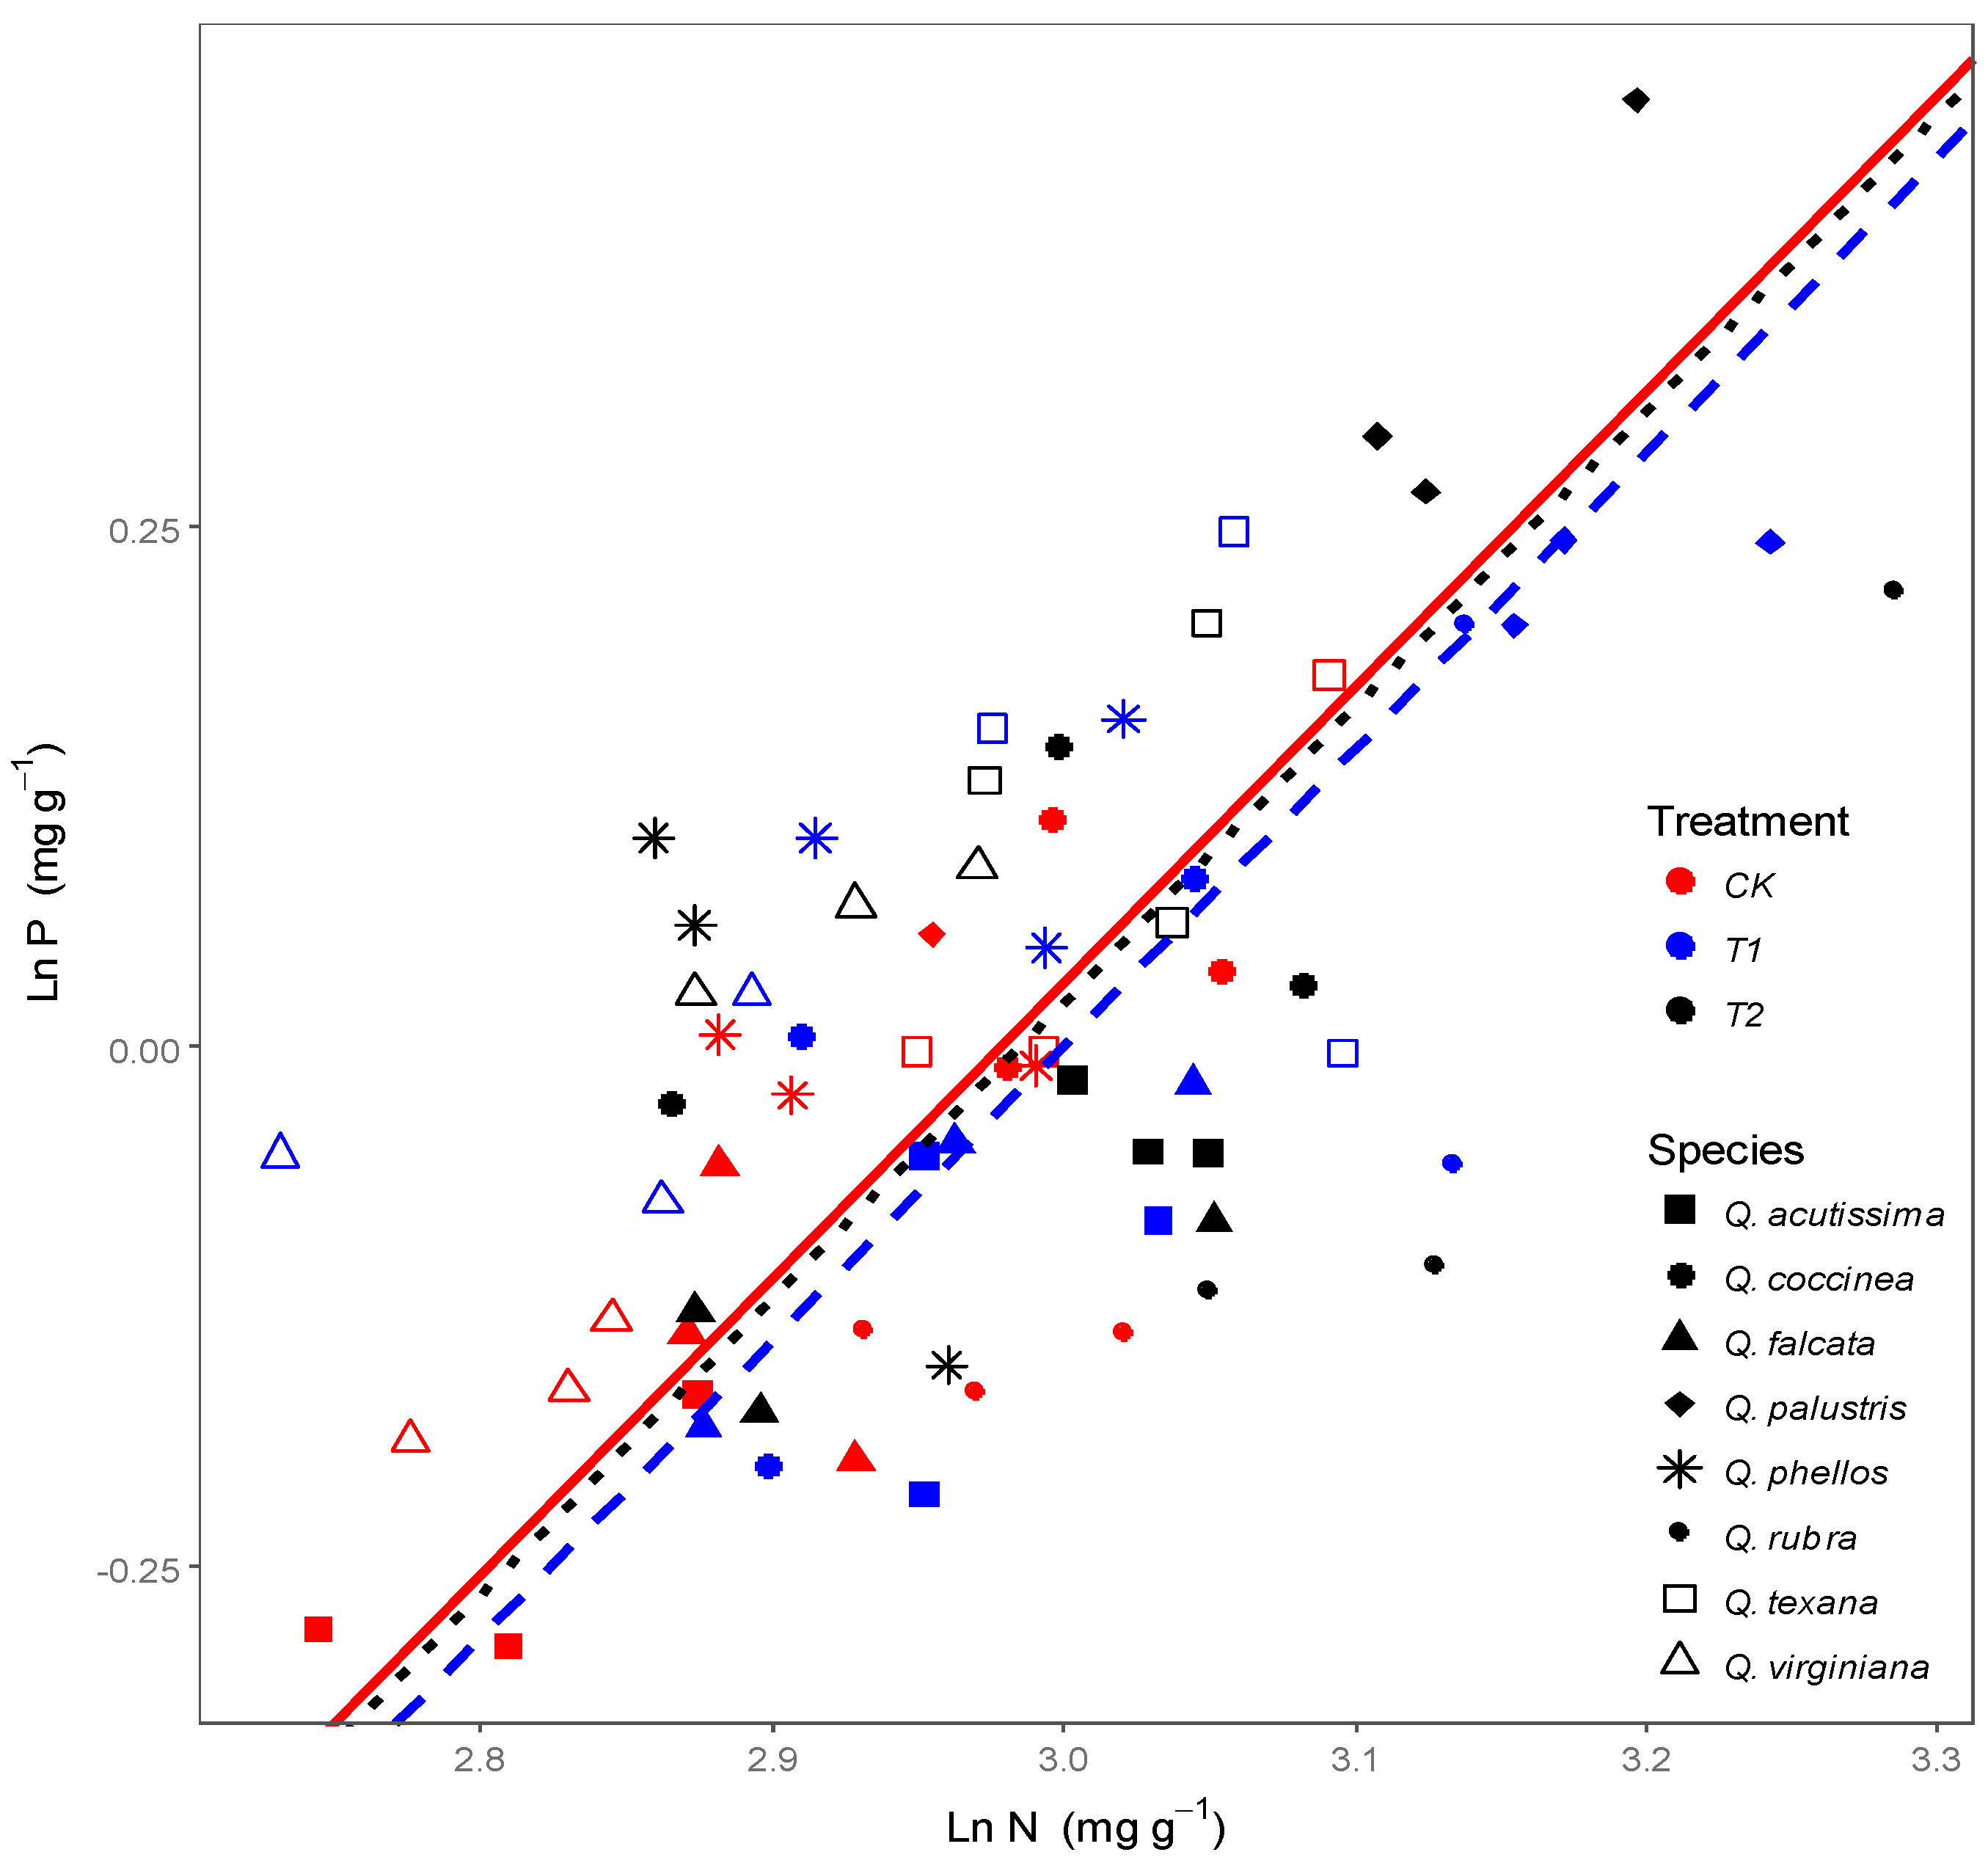
3.2. Effects of Wind on Relationships between Leaf N, P Stoichiometry and Leaf Morphology

Leaf N concentration and SLA showed positive correlations under each treatment (Figure 3a), and the slope of correlations was not affected by wind (p = 0.96); the intercept, however, decreased significantly under wind treatments (p < 0.01). Leaf P concentration and SLA showed no correlations under each treatment (Figure 3b). Leaf N, P concentrations and LDI showed positive correlations (Figure 4), and the slope of correlations was not affected by wind (leaf N concentration and LDI: p = 0.55, leaf P concentration and LDI: p = 0.83, respectively). The intercept, though, decreased significantly under wind treatments (p < 0.01, p = 0.03, respectively).

4 Discussion

4.1. Response of Leaf N, P Stoichiometry to Wind

Leaf N, P concentrations were significantly impacted by wind for most Quercus species with elliptic leaves, which were similar to leaf morphology and photosynthesis in our previous studies [13,17,30]. The leaf N, P concentrations of Quercus species with lanceolate leaves, except for leaf P concentration of Q. virginiana, were not significantly impacted by wind, likely due to leaf shapes having reduced drag from wind as described previously [13].
Leaf N, P concentrations were found to increase with wind load, which is consistent with previous studies in which leaf N concentration under a wind regime was found to be higher than those under a no wind environment [11,21,22]. One reason for this is that plants must allocate more N and P to leaf cell walls under windy conditions in order to increase cell wall thickness to strengthen the leaf’s mechanical toughness [18,19,20]. Previous studies suggest that the N found in cell walls probably represented structural proteins such as hydroxyproline-rich glycoproteins [31,32]. Another reason is that more biomass was allocated to the organs that are only slightly or not at all affected by mechanical stimuli from wind loads, such as the roots [11,33,34], and leaf biomass was found to decrease under wind load for Quercus species with elliptic leaves [13]. It is possible that leaf N, P concentrations increased due to the decrease in leaf biomass under the wind loadsince there was a dilution effect caused by high leaf area and biomass growth under no wind load [21]. In addition, wind can increase the movement of water from the leaf surface by removing the boundary layer where water vapor hugs the surface of leaves, thus creating a shorter path for water to reach the atmosphere [35,36]. Therefore, more nutrition—such as calcium, nitrogen, and phosphorus—would be transported from the roots and stems to leaves, accompanied by an increase in leaf water evaporation [37]. We also found that leaf transpiration rate increased under wind load for Q. texana, Q. palustris, and Q. virginiana in a previous study [30]. This may be another reason for higher leaf N, P concentrations under wind load.
Leaf stoichiometric relationships vary among plant life form [10], sizes [38], ages [39,40], and environmental gradients [41]. But stoichiometric relationships are not found to differ along soil nutrient gradients or latitudinal gradients [42,43]. In this study, our findings supported the claim that stoichiometric relationships remain stable under different wind conditions, with a synchronous variation between leaf N and P concentrations. Responses of N and P biochemical pathways were similar [7]: both leaf N and P concentrations increased for Quercus species, and thus leaf N:P did not vary under the wind load. These results bolster support for our first hypothesis, and provide additional evidence for stoichiometric homeostasis.

4.2. Response of Relationships between Leaf Stoichiometry and Morphology to Wind

Leaf N, P stoichiometry, which plays a vital role among leaf traits, has been closely linked to leaf morphology in previous studies [1,6]. For example, leaf N and P concentrations have been correlated to SLA at a large spatial scale [7,44,45]. Here, we also found positive correlations between leaf N concentration and SLA under each treatment; meanwhile, SMAs fitted for leaf N concentration and SLA did not shift in slope among treatments. This indicates that wind load significantly impacted leaf N, P concentrations and SLA, but did not change the relationship between leaf N concentration and SLA, suggesting relative stability of the leaf N-SLA relationship for a given Quercus species. This is consistent with our previous study on the leaf stoichiometry-morphology relationship [6].
Some studies have found that species with higher SLA are likely to be toothed [46] and have a higher photosynthetic rate [28,47,48]. Therefore, higher leaf N and P concentrations may be needed to support photosynthesis. In our study, LDI was positively correlated to leaf N and P concentrations. SMAs fitted for leaf N and P concentrations and LDI did not shift in slope among treatments, which indicates that relationships between leaf N and P concentrations and LDI kept a synchronous variation, demonstrating that stoichiometry-morphology relationships do not vary under wind load. This supports our second hypothesis that leaf N, P stoichiometry and leaf morphology display synchronous variations under wind load.
LES holds that plant traits do not vary independently but rather form groups of co-varying traits, which can explain the trade-off strategy for plants under environmental stresses [1,49]. Here, leaf N, P concentrations increased to support leaf structural components under a wind load, with leaf thickness increasing and leaf size decreasing [13], inducing lower SLA and LDI. These are stress tolerance strategies for Quercus species under a wind load. For this reason, leaf N, P stoichiometry and leaf morphology showed synchronous variations under the wind load.
However, intercepts of SMAs changed significantly among treatments, with lower intercepts under the wind load (Figure 3 and Figure 4). This suggests that lower values of SLA and LDI were found under wind treatments than in control conditions for a given value of leaf N or leaf P concentrations because the N and P use efficiency decreased due to the wind load. For example, both leaf photosynthetic nitrogen-use efficiency (PNUE) and photosynthetic phosphorus-use efficiency (PPUE) significantly decreased under wind (Appendix A Table A2). This indicates that the Quercus species changed from “fast investment-return” in the wind-protected environment to “slow investment-return” in windy conditions, which is consistent with previous studies along soil moisture, soil nutrients, and temperature gradients [8,50,51]. We believe this study is the first to reveal synchronous variations between leaf N, P stoichiometry and leaf morphology under a wind load, which will be of value in understanding functional strategies for plants under a wind load, and be supplemental for LES along a wind gradient.

5. Conclusions

Leaf N and P concentrations increased significantly for most Quercus species with elliptic leaves under wind, while leaf N:P was stable for all species. Quercus species changed from “fast investment-return” in a wind-protected environment to “slow investment-return” in windy conditions. Specifically, leaf N and P concentrations increased, use efficiency (PNUE and PPUE) and SLA decreased, and leaf N, P concentrations and leaf morphology showed synchronous variations to adapt to wind. These results will be of value in understanding the functional strategies for plants under wind stress and in the construction of shelterbelts to ensure plant growth in windy areas.

Acknowledgments

This project was supported by National Natural Science Foundation of China (No. 31200533, 31570583). We thank Bridget Blood from Clemson University for language improvement.

Author Contributions

T.W. was responsible for funding acquisition and resources. T.W. and Q.W. conceptualized the study. H.W., Q.W. and P.Z. participated in the design of the study. P.Z. performed the data curation and investigation. M.Y. supervised the experiment process. P.Z. and T.W. wrote original draft. All authors read and approve the final manuscript.

Conflicts of Interest

The authors declare no conflict of interest.

Appendix A

Table A1. One-Sample Kolmogorov-Smirnov Test.
N (g kg−1)P (g kg−1)N:P
N 727272
Normal Parameters a,bMean19.9841.02919.741
Std. Deviation2.40260.17292.390
Asymp. Sig. (2-tailed)0.0390.0020.013
a Test distribution is Normal; b Calculated from data.
Table A2. Variance analysis of leaf PNUE and PPUE for eight Quercus species under wind load.
DFPNUE (μmol m−2 s−1)PPUE (μmol m−2 s−1)
MSFPMSFP
Tree species7179410.51539.2390.00057420784.7125.7460.000
Treatment225103.1335.4900.00712724003.315.7050.006
PNUE = Pn/leaf N concentration; PPUE = Pn/leaf P concentrations.
The methods of PNUE and PPUE were cited in “Guo, R., Sun, S., Liu, B. Difference in leaf water use efficiency/photosynthetic nitrogen use efficiency of Bt-cotton and its conventional peer. Scientific Reports, 2016, 6: 33539”

References

  1. Niinemets, U. Is there a species spectrum within the world-wide leaf economics spectrum? Major variations in leaf functional traits in the Mediterranean sclerophyll Quercus ilex. New Phytol. 2015, 205, 79–96. [Google Scholar] [CrossRef] [PubMed]
  2. Blonder, B.; Vasseur, F.; Violle, C.; Shipley, B.; Enquist, B.J.; Vile, D. Testing models for the leaf economics spectrum with leaf and whole-plant traits in Arabidopsis thaliana. AoB Plants 2015, 7. [Google Scholar] [CrossRef] [PubMed]
  3. Tian, M.; Yu, G.; He, N.; Hou, J. Leaf morphological and anatomical traits from tropical to temperate coniferous forests: Mechanisms and influencing factors. Sci. Rep. 2016, 6, 19703. [Google Scholar] [CrossRef] [PubMed]
  4. Heberling, J.M.; Fridley, J.D. Biogeographic constrains on the world-wide leaf economic spectrum. Glob. Ecol. Biogeogr. 2012, 21, 1137–1146. [Google Scholar] [CrossRef]
  5. Osnas, J.L.D.; Lichstein, J.W.; Reich, P.B.; Pacala, S.W. Global leaf trait relationships: Mass area and the leaf economics spectrum. Science 2013, 340, 741–744. [Google Scholar] [CrossRef] [PubMed]
  6. Zhang, H.; Yang, X.; Guo, W.; Yu, M.; Wu, T. Leaf N and P stoichiometry in relation to leaf shape and plant size for Quercus acutissima provenances across China. Sci. Rep. 2017, 7, 46133. [Google Scholar] [CrossRef] [PubMed]
  7. Wu, T.; Yu, M.; Wang, G.; Dong, Y.; Cheng, X. Leaf nitrogen and phosphorus stoichiometry across forty-two woody species in Southeast China. Biochem. Syst. Ecol. 2012, 44, 255–263. [Google Scholar] [CrossRef]
  8. De la Riva, E.G.; Olmo, M.; Poorter, H.; Ubera, J.L.; Villar, R. Leaf mass per area (LMA) and its relationship with leaf structure and anatomy in 34 Mediterranean woody species along a water availability gradient. PLoS ONE 2016. [Google Scholar] [CrossRef] [PubMed]
  9. Hoffmann, W.A.; Da, S.E.J.; Machado, G.C.; Bucci, S.J.; Scholz, F.G.; Goldstein, G.; Meinzer, F.C. Seasonal leaf dynamics across a tree density gradient in a Brazilian savanna. Oecologia 2005, 145, 306–315. [Google Scholar] [CrossRef] [PubMed]
  10. Reich, P.B.; Oleksyn, J. Global patterns of plant leaf N and P in relation to temperature and latitude. Proc. Natl. Acad. Sci. USA 2004, 101, 11001–11006. [Google Scholar] [CrossRef] [PubMed]
  11. Anten, N.P.R.; Alcala-Herrera, R.; Schieving, F.; Onoda, Y. Wind and mechanical stimuli differentially affect leaf traits in Plantago major. New Phytol. 2010, 188, 554–564. [Google Scholar] [CrossRef] [PubMed]
  12. Royer, D.L.; Mcelwain, J.C.; Adams, J.M.; Wilf, P. Sensitivity of leaf size and shape to climate within Acer rubrum and Quercus kelloggii. New Phytol. 2008, 179, 808–817. [Google Scholar] [CrossRef] [PubMed]
  13. Wu, T.; Zhang, P.; Zhang, L.; Wang, G.; Yu, M. Morphological response of eight Quercus species to simulated wind load. PLoS ONE 2016. [Google Scholar] [CrossRef] [PubMed]
  14. Hoad, S.P.; Marzoli, A.; Grace, J.; Jeffree, C.E. Response of leaf surfaces and gas exchange to wind stress and acid mist in birch (Betula pubescens). Trees 1998, 13, 1–12. [Google Scholar] [CrossRef]
  15. Murren, C.J.; Pigliucci, M. Morphological responses to simulated wind in the genus Brassica (Brassicaceae): Allopolyploids and their parental species. Am. J. Bot. 2005, 92, 810–818. [Google Scholar] [CrossRef] [PubMed]
  16. Kimmins, J.P. Forest Ecology; Addison-Wesley Press: New York, NY, USA, 2003. [Google Scholar]
  17. Wu, Q. Eight Oak Trees Growth Characteristics in Response to Simulated Wind Stimulus. Mater’s Theses, Hainan University, Haikou, China, 2014. [Google Scholar]
  18. Washusen, R.; Baker, T.; Menz, D.; Morrow, A. Effect of thinning and fertilizer on the cellulose crystallite width of Eucalyptus globulus. Wood Sci. Technol. 2005, 39, 569–578. [Google Scholar] [CrossRef]
  19. Shi, Z.; Tang, J.; Cheng, R.; Luo, D.; Liu, S. A review of nitrogen allocation in leaves and factors in its effects. Acta Ecol. Sin. 2015, 35, 5909–5919. [Google Scholar]
  20. Onoda, Y.; Hikosaka, K.; Hirose, T. Allocation of nitrogen to cell walls decreases photosynthetic nitrogen-use efficiency. Funct. Ecol. 2004, 18, 419–425. [Google Scholar] [CrossRef]
  21. Cordero, R.A. Ecophysiology of Cecropia schreberiana saplings in two wind regimes in an elfin cloud forest: Growth, gas exchange, architecture and stem biomechanics. Tree Physiol. 1999, 19, 153–163. [Google Scholar] [CrossRef] [PubMed]
  22. Woodward, F.I. Ecophysiological studies on the shrub Vaccinium myrtillus L. taken from a wide altitudinal range. Oecologia 1998, 70, 580–586. [Google Scholar] [CrossRef] [PubMed]
  23. Ordonez, J.C.; Sykes, M. A global study of relationships between leaf traits, climate and soil measures of nutrient fertility. Glob. Ecol. Biogeogr. 2009, 18, 137–149. [Google Scholar] [CrossRef]
  24. Zhao, N.; He, N.; Wang, Q.; Zhang, X.; Wang, R.; Xu, Z.; Yu, G. The altitudinal patterns of leaf C:N:P stoichiometry are regulated by plant growth form, climate and soil on Changbai mountain, China. PLoS ONE 2014, 9, e95196. [Google Scholar]
  25. Du, B.; Ji, H.; Peng, C.; Liu, X.; Liu, C. Altitudinal patterns of leaf stoichiometry and nutrient resorption in Quercus variablilis in the Baotianman Mountains, China. Plant Soil 2017, 413, 193–202. [Google Scholar] [CrossRef]
  26. Yang, X.; Tang, Z.; Ji, C.; Liu, H.; Ma, W.; Mohhamot, A.; Shi, Z.; Sun, W.; Wang, T.; Wang, X.; et al. Scaling of nitrogen and phosphorus across plant organs in shrubland biomes across Northern China. Sci. Rep. 2014, 4, 5448. [Google Scholar] [CrossRef] [PubMed]
  27. Dong, Y.; Wang, Z.; Wu, T.; Yu, M.; Cheng, X.; Duan, X. Temporal and spacial distribution of wind in coastal area, Shanghai. Resour. Environ. Yangtze Basin 2013, 22, 40–45, (In Chinese with English abstract). [Google Scholar]
  28. Nicotra, A.B.; Cosgrove, M.; Cowling, A.; Schlichting, C.D.; Jones, C.S. Leaf shape linked to photosynthetic rates and temperature optima in South African Pelargonium species. Oecologia 2008, 154, 625–635. [Google Scholar] [CrossRef] [PubMed]
  29. Jiang, P.; Chen, Y.; Cao, Y. C:N:P stoichiometry and carbon storage in a naturally-regenerated secondary Qercus variabilis forest age sequence in the Qinling Mountains, China. Forests 2017, 8, 281. [Google Scholar] [CrossRef]
  30. Yang, X.; Zhang, P.; Wu, Q.; Yan, H.; Yu, M.; Wang, G.G.; Wu, T. Effects of simulated wind load on leaf photosynthesis and carbohydrate allocation in eight Quercus species. J. Biobased Mater. Biol. 2017. [Google Scholar] [CrossRef]
  31. Buchanan, B.; Gruissem, W.; Jones, R. Biochemistry and Molecular Biology of Plants; American Society of Plant Physiologists: Rockeweel, MD, USA, 2000. [Google Scholar]
  32. Onoda, Y.; Schieving, F.; Anten, N.P.R. Effects of light and nutrient availability on leaf mechanical properties of Plantgo major: A conceptual approach. Ann. Bot. 2008, 101, 727–736. [Google Scholar] [CrossRef] [PubMed]
  33. Coutand, C.; Dupraz, C.; Jaouen, G.; Ploquin, S.; Boris, A. Mechanical stimuli regulate the allocation of biomass in trees: Demonstration with young Prunus avium trees. Ann. Bot. 2008, 101, 1421–1432. [Google Scholar] [CrossRef] [PubMed]
  34. Niklas, K.J. Differences between Acer saccharum leaves from open and wind-protected sites. Ann. Bot. 1996, 78, 61–66. [Google Scholar] [CrossRef]
  35. Kume, T.K.; Laplace, S.; Komatsu, H.; Chu, C. Transpiration in response to wind speed: Can apparent leaf-type differences between conifer and broadleaf trees be a practical indicator? Trees 2015, 29, 605–612. [Google Scholar] [CrossRef]
  36. Schymanski, S.J.; Or, D. Wind increases leaf water use efficiency. Plant Cell Environ. 2016, 39, 1448–1459. [Google Scholar] [CrossRef] [PubMed]
  37. Sonneveld, C.; Vooge, W. Plant Nutrition of Greenhouse Crops; Springer: New York, NY, USA, 2009. [Google Scholar]
  38. Sardans, J.; Penuelas, J. Trees increase their P:N ratio with size. Glob. Ecol. Biogeogr. 2015, 24, 147–156. [Google Scholar] [CrossRef] [PubMed]
  39. Liu, W.; Su, J. Successional leaf traits of monsoon evergreen broad-leaved forest, Southerwest China. iForest 2017, 10, 391–396. [Google Scholar] [CrossRef]
  40. Li, H.; Crabbe, M.J.C.; Xu, F.; Wang, W.; Niu, R.; Gao, X.; Zhang, P.; Chen, H. Seasonal variations in carbon, nitrogen and phosphorus concentrations and C:N:P stoichiometry in the leaves of differently aged Larix principis-rupprechtii Mayr. plantations. Forests 2017, 8, 373. [Google Scholar] [CrossRef]
  41. Edwards, E.J.; Chatelet, D.S.; Sack, L.; Donoghue, M.J. Leaf life span and the leaf economic spectrum in the context of whole plant architecture. J. Ecol. 2014, 102, 328–336. [Google Scholar] [CrossRef]
  42. Hidaka, A.; Kitayama, K. Physiological linkage in co-variation of foliar nitrogen and phosphorus in tropical tree species along a gradient of soil phosphorus availability. J. Trop. Ecol. 2015, 31, 221–229. [Google Scholar] [CrossRef]
  43. Zhang, H.; Guo, W.; Wang, G.; Yu, M.; Wu, T. Effects of environment and genetics on leaf N and P stoichiometry for Quercus acutissima across China. Eur. J. For. Res. 2016, 135, 795–802. [Google Scholar] [CrossRef]
  44. Kull, O.; Niinemets, U. Variations in leaf morphology and nitrogen concentration in Betula pendula Roth., Corylus avellana L. and Lonicera xylosteum L. Tree Physiol. 1993, 12, 311–318. [Google Scholar] [CrossRef] [PubMed]
  45. Shipley, B.; Lechowicz, M.J. The functional co-ordination of leaf morphology, nitrogen concentration, and gas exchange in 40 wetland species. Ecosci. 2000, 7, 183–194. [Google Scholar] [CrossRef]
  46. Royer, D.L.; Wilf, P.; Janesko, D.A.; Kowalski, E.A.; Dilcher, D.L. Correlating climate and plant ecology to leaf size and shape: Potential proxies for the fossil record. Am. J. Bot. 2005, 92, 1141–1151. [Google Scholar] [CrossRef] [PubMed]
  47. Nicotra, A.B.; Leigh, A.; Boyce, C.K.; Jones, C.S.; Niklas, K.J.; Royer, D.L.; Tsukaya, H. The evolution and functional significance of leaf shape in the angiosperms. Funct. Plant Biol. 2011, 38, 535–552. [Google Scholar] [CrossRef]
  48. Santiago, L.S.; Kim, S.C. Correlated evolution of leaf shape and physiology in the woody Sonchus alliance (Asteraceae: Sonchinae) in Macaronesia. Int. J. Plant Sci. 2009, 170, 83–92. [Google Scholar] [CrossRef]
  49. Blonder, B.; Violle, C.; Enquist, B.J. Inclusion of vein traits improves predictive power for the leaf economic spectrum: A response to Sack et al. (2013). J. Exp. Bot. 2014, 65, 5109–5114. [Google Scholar] [CrossRef] [PubMed]
  50. Walters, M.B.; Gerlach, J.P. Intraspecific growth and functional leaf trait responses to natural soil resource gradients for conifer species with contrasting leaf habit. Tree Physiol. 2013, 33, 297–310. [Google Scholar] [CrossRef] [PubMed]
  51. Gornish, E.S.; Prather, C.M. Foliar functional traits that predict plant biomass response to warming. J. Veg. Sci. 2014, 25, 919–927. [Google Scholar] [CrossRef]
Figure 1. Effects of wind on leaf N, P stoichiometry (means ± standard deviation) for Quercus species. (a) Leaf N concentration; (b) Leaf P concentration; (c) Leaf N:P. For each species, different capital letters on the bars indicate significant differences among treatments (p < 0.05). CK: control, T1: about 4 m s−1 wind speed, T2: about 6 m s−1 wind speed.
Forests 09 00110 g001
Figure 2. Relationships between leaf N and P concentrations for Quercus species under wind load. Ln N and Ln P: leaf N and P concentrations were transformed using the natural logarithm prior to analysis. CK: control, T1: about 4 m s−1 wind speed, T2: about 6 m s−1 wind speed. CK: y = 1.02x − 3.04, R2 = 0.56, p < 0.01; T1: y = 0.67x − 1.98, R2 = 0.35, p < 0.01; T2: y = 0.81x − 2.37, R2 = 0.217, p = 0.01. SMAs fitted among treatments did not show significant differences in slope (test for SMA (Standardized major axis) heterogeneity, 95% CIS (Confidence intervals), p = 0.26) and in intercept (p = 0.79).
Forests 09 00110 g002
Figure 3. Relationships between leaf N, P concentrations and SLA (Specific leaf area) for Quercus species under wind load. Ln N, Ln P and Ln SLA: leaf N ,P concentrations and SLA were transformed using the natural logarithm prior to analysis. CK: control, T1: about 4 m s−1 wind speed, T2: about 6 m s−1 wind speed. (a) Leaf N concentration and SLA. CK: y = 1.78x − 0.99, R2 = 0.17, p = 0.04; T1: y = 2.06x − 2.01, R2 = 0.33, p < 0.01; T2: y = 1.83x − 1.41, R2 = 0.18, p = 0.04. SMAs fitted among treatments did not show significant differences in slope (p = 0.96), but apparent in intercept (p < 0.01); (b) Leaf P concentration and SLA.
Forests 09 00110 g003
Figure 4. Relationships between leaf N, P concentrations and LDI (Leaf dissection index) for Quercus species under wind load. Ln N, Ln P and Ln LDI: leaf N ,P concentrations and LDI were transformed using the natural logarithm prior to analysis. CK: control, T1: about 4 m s−1 wind speed, T2: about 6 m s−1 wind speed. (a) Leaf N concentration and LDI. CK: y = 1.19x − 1.58, R2 = 0.41, p < 0.01; T1: y = 0.83x − 0.67, R2 = 0.45, p < 0.01; T2: y = 0.78x − 0.44, R2 = 0.23, p = 0.02. SMAs fitted among treatments did not show significant differences in slope (p = 0.55), but apparent in intercept (p < 0.01); (b) Leaf P concentration and LDI. CK: y = 0.90x + 1.95, R2 = 0.436, p < 0.01; T1: y = 0.73x + 1.83, R2 = 0.43, p < 0.01; T2: y = 0.48x + 1.89, R2 = 0.22, p = 0.02. SMAs fitted among treatments did not show significant differences in slope (p = 0.83), but apparent in intercept (p = 0.03).
Forests 09 00110 g004

