Does Certification Change the Trajectory of Tree Cover in Working Forests in The Tropics? An Application of the Synthetic Control Method of Impact Evaluation


1
Department of Natural Resources and Environmental Sciences, University of Illinois, W-425, Turner Hall, 1102 S. Goodwin Ave., Urbana, IL 61801, USA
2
Department of Forestry and Environmental Resources, North Carolina State University, 3110 Jordan Hall, Raleigh, NC 27695-8008, USA
*
Author to whom correspondence should be addressed.
Forests 2018, 9(3), 98; https://doi.org/10.3390/f9030098
Submission received: 11 January 2018
/
Revised: 13 February 2018
/
Accepted: 22 February 2018
/
Published: 25 February 2018
(This article belongs to the Special Issue Sustainable Forest Management and Forest Certification)
Abstract
:Certification by the Forest Stewardship Council (FSC) remains rare among forest management units (FMUs) in natural tropical forests, presenting a challenge for impact evaluation. We demonstrate application of the synthetic control method (SCM) to evaluate the impact of FSC certification on a single FMU in each of three tropical forest landscapes. Specifically, we estimate causal effects on tree cover change from the year of certification to 2012 using SCM and open-access, pan-tropical datasets. We demonstrate that it is possible to construct synthetic controls, or weighted combinations of non-certified FMUs, that followed the same path of tree cover change as the certified FMUs before certification. By using these synthetic controls to measure counterfactual tree cover change after certification, we find that certification reduced tree cover loss in the most recent year (2012) in all three landscapes. However, placebo tests show that in one case, this effect was not significant, and in another case, it followed several years in which certification had the opposite effect (increasing tree cover loss). We conclude that SCM has promise for identifying temporally varying impacts of small-N interventions on land use and land cover change.
1. Introduction
Tropical forests have attained new significance in the context of climate change. High rates of tropical deforestation threaten not only the ability of these forests to act as carbon sinks but also endanger their biodiversity and the livelihoods of millions of forest-dependent people around the world. Deforestation often reflects the higher income potential of alternative land uses, such as commodity crops and ranching [1,2,3]. One reason that the income potential of forests is lower than these alternatives is that the profitability of sustainable management and harvest of timber is undercut by low timber prices due to rampant illegal logging in the tropics [4,5]. Forest certification aims to increase the value of responsibly managed forests by encouraging the market to recognize verified sustainable management of forest management units (FMUs) including compliance with regulatory frameworks, adoption of reduced-impact logging, forest stock enhancement, and respect for the rights of both workers and local people [6,7,8,9]. The costs incurred in the certification process (for adoption of new practices and for audits) are supposed to be defrayed by consumers and translated into benefits for firms through price premiums or improved market access for timber products from certified FMUs. The costs of certification could also be compensated by improved management effectiveness or reputational and other indirect benefits. Yet all of these private benefits have proved elusive, raising the question of whether civil society and overseas development assistance should continue to promote and underwrite the costs of certification.
The answer to this question depends in part on the effectiveness of certification at achieving its stated environmental goals. In this paper, we analyze the impact of the FSC (Forest Stewardship Council) on tropical deforestation. Along with the Programme for the Endorsement of Forest Certification (PEFC), the FSC is one of the two largest forest certification programs globally. One of the original aspirations of the non-governmental organizations that founded the FSC was to reduce tropical deforestation [6,10,11,12]. While certification may contribute to this goal through multiple channels (e.g., by raising consumer awareness and influencing government regulatory frameworks [13]), the advocates of certification clearly expected that certification of a FMU would help protect it from deforestation by increasing its value for timber production. Surprisingly, there have been few robust counterfactual-based analyses of whether FSC certification actually reduces the probability of deforestation [14,15]. One barrier to evaluation is that FSC certification remains rare in the tropical forest landscape, meaning that there are few FMUs to evaluate. Another challenge is that the effects may evolve over time. In this paper, we illustrate the use of the synthetic control method [16,17] to address these issues. For this proof of concept, we use open-access pan-tropical datasets available for the three major tropical forest biomes: the Amazon Basin, the Congo Basin, and Indo-Malaysian forests. In particular, we evaluate impacts on tree cover loss, as reported in the dataset released by Matthew Hansen, University of Maryland, Google, United States Geological Survey, and the National Aeronautics and Space Administration on “Global Forest Change 2000–2012” [18]. We limit consideration to pixels that were forest at the beginning of the time series, and then evaluate whether certification reduced tree cover loss (e.g., due to more effective protection of FMUs), while recognizing that it could also increase tree cover loss (e.g., due to more active logging).
2. Results
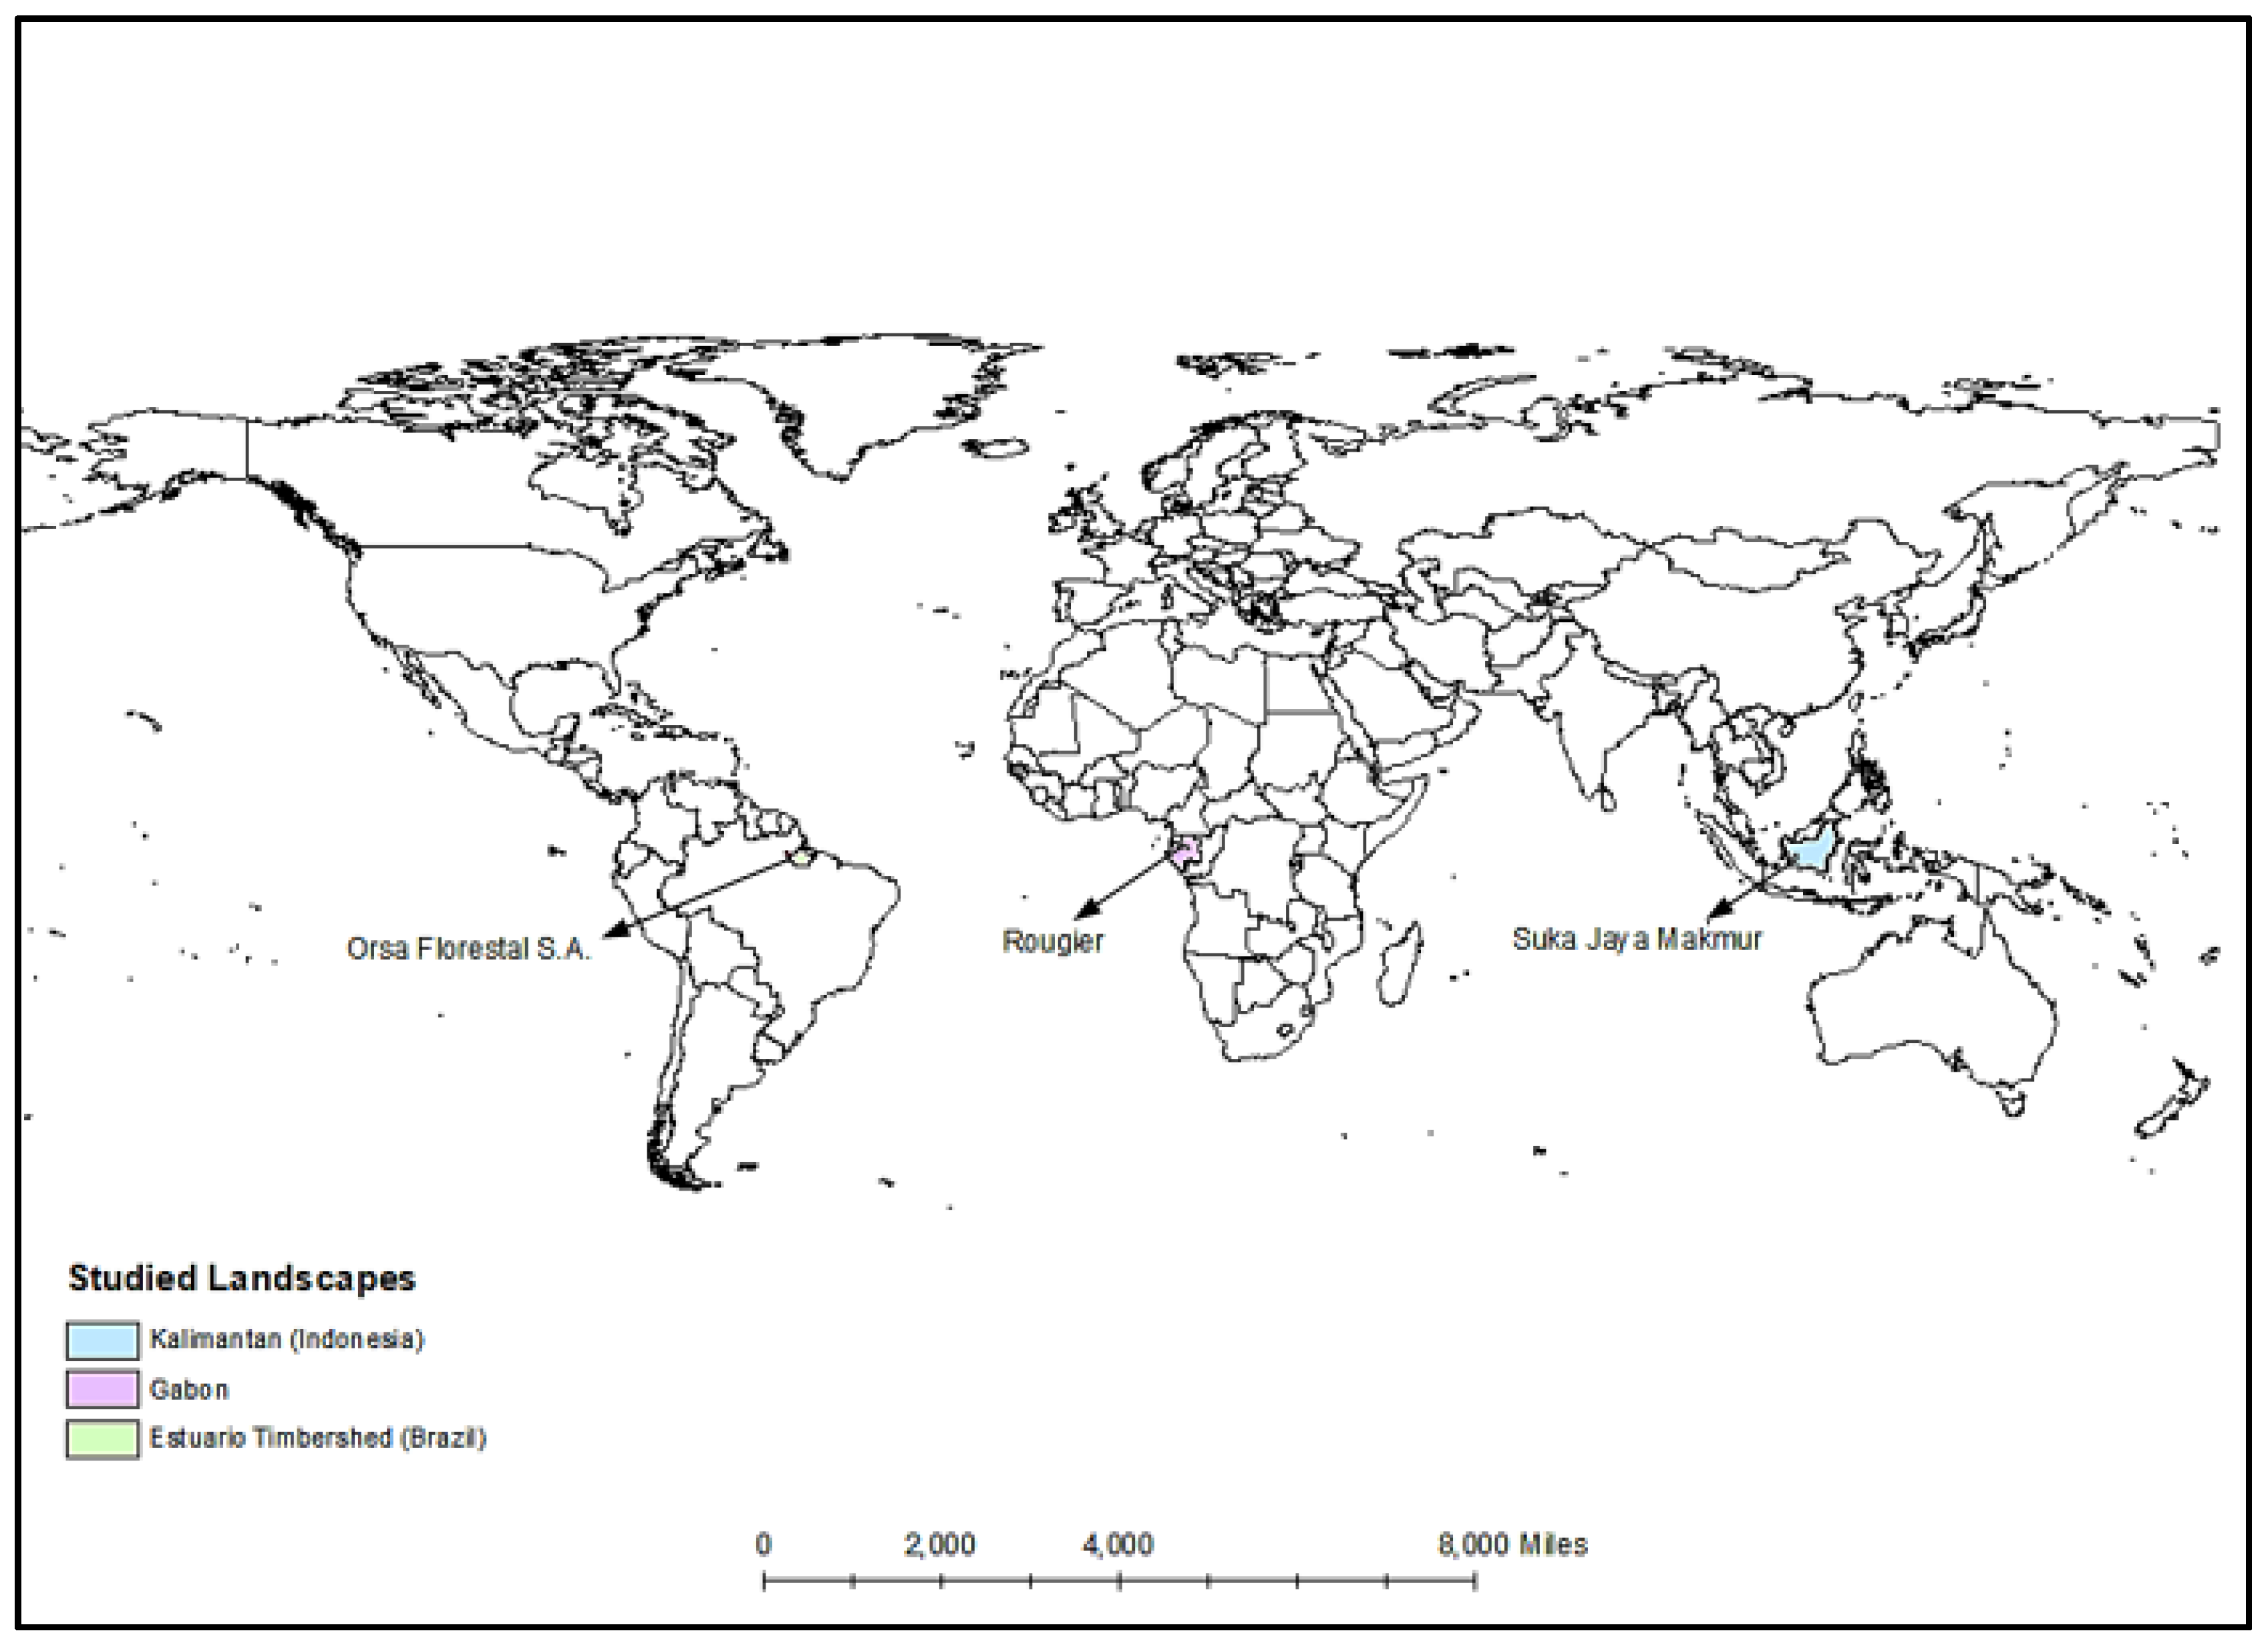
We studied one FSC certified FMU in each of three topical forest landscapes: Orsa Florestal S.A. (Estuário zone in the eastern Brazilian Amazon), Rougier (Gabon), and Suka Jaya Makmur (Kalimantan, Indonesia) (Figure 1). We selected these three locations to illustrate the synthetic control method (SCM) because we had sufficient observations on tree cover change both before and after certification and because we found that it was possible to construct plausible synthetic controls that matched tree cover change in the pre-certification period.
In Brazil, Orsa Florestal S.A., has an approved PMFS (plano de manejo florestal sustentável or sustainable forest management plan; for further information, see: http://www.ibama.gov.br/areas-tematicas/manejo-florestal-sustentavel) located in the state of Pará, with an area of 545,335 ha. The company harvests and sells about 35 timber species, mostly to the European market. Orsa Florestal S.A. was certified in December 2004. Conroy [19] reported that in 2006, the company produced 2000 m3 of rough-sawn tropical hardwood per month and earned a 30% price premium due to FSC certification.
In Gabon, Rougier obtained certification of a 688,262-ha timber concession in October 2008. Rougier belongs to the international Rougier Group, which has been operating in Central Africa since 1952 [20]. In Gabon, Rougier and its subsidiaries have an annual log production of approximately 280,000 m3 and employ around 1500 people. Their major export market is Europe, followed by Asia [21].
Lastly, PT Suka Jaya Makmur has a 171,340-ha timber concession (divided into two areas) in West Kalimantan. PT. Suka Jaya Makmur is a private domestic company, which was granted its first forest concession permit by the Indonesian Ministry of Forestry in 1982. Its annual production is about 103,466 logs per year [22,23]. This company obtained certification of their timber concession in September 2010.
2.1. Comparison of Tree Cover Loss in FMUs
For each of these three FMUs, we first compared its rate of tree cover loss from 2001 to 2012 with the average rate of tree cover loss in all FMUs without FSC certification in the relevant landscape. It should be noted that we have not screened out FMUs certified under national systems affiliated with PEFC, because those FMUs are still eligible for FSC certification. Including some of those FMUs in a synthetic control will tend to result in an underestimate of the effect of certification (in general) while still giving us a good estimate of the incremental effect of FSC certification. As shown in the second and third columns of Table 1, Orsa Florestal S.A. experienced higher annual tree cover loss compared to non-certified FMUs in the same landscape in every year except 2007, both pre- and post-certification.
In contrast, the annual rate of tree cover loss in Rougier was lower than the average rate of tree cover loss in FMUs without FSC certification in Gabon in each of the three years post-certification and on average across the entire time period (Table 2).
Similar to Rougier, Suka Jaya Makmur had a much lower rate of tree cover loss, both over the entire period and in the two years post-certification, compared to FMUs without FSC certification in Kalimantan (Table 3).
We emphasize that the above are naïve comparisons that do not account for any differences other than FSC certification among FMUs in a given landscape. As discussed by Romero et al. [9], some of the other factors that vary across FMUs may affect both the probability of certification and the probability of tree cover loss due to either logging or deforestation. Thus, the observed differences in tree cover loss in columns 2 and 3 of these tables may reflect those confounding factors rather than certification.
2.2. Causal Effects of Certification on Tree Cover Loss in Certified FMUs
In order to distinguish the effect of certification from the effects of other potentially confounding factors, we constructed synthetic controls for each of the certified FMUs. Annual tree cover loss in each synthetic control is given in the third column of Table 1, Table 2 and Table 3 and graphed in the following three figures. The figures show the annual rate of tree cover loss in the FSC certified FMUs and their synthetic controls both pre-certification (the calibration period) and post-certification (the evaluation period).
In these figures, tree cover loss increases down the y-axis. Because we only consider loss of tree cover in pixels that were forest in 2000, this is likely to represent deforestation, meaning that the y-axis is the negative of deforestation and the desired outcome is for the certified FMU to be higher than the synthetic control (its counterfactual without certification) on the y-axis.
Figure 2 compares tree cover loss in Orsa Florestal S.A. and its synthetic control. Prior to certification, the trajectories are similar, although they are not perfectly matched. After certification, there is no consistent difference, with more tree cover loss in the synthetic control in some years and less in others.
Figure 3 shows similar trajectories in the certified FMU Rougier and its synthetic control in both the pre-certification and post-certification periods. After certification, tree cover loss is just slightly less in the certified FMU compared to its synthetic control, suggesting that certification has no substantial effect.
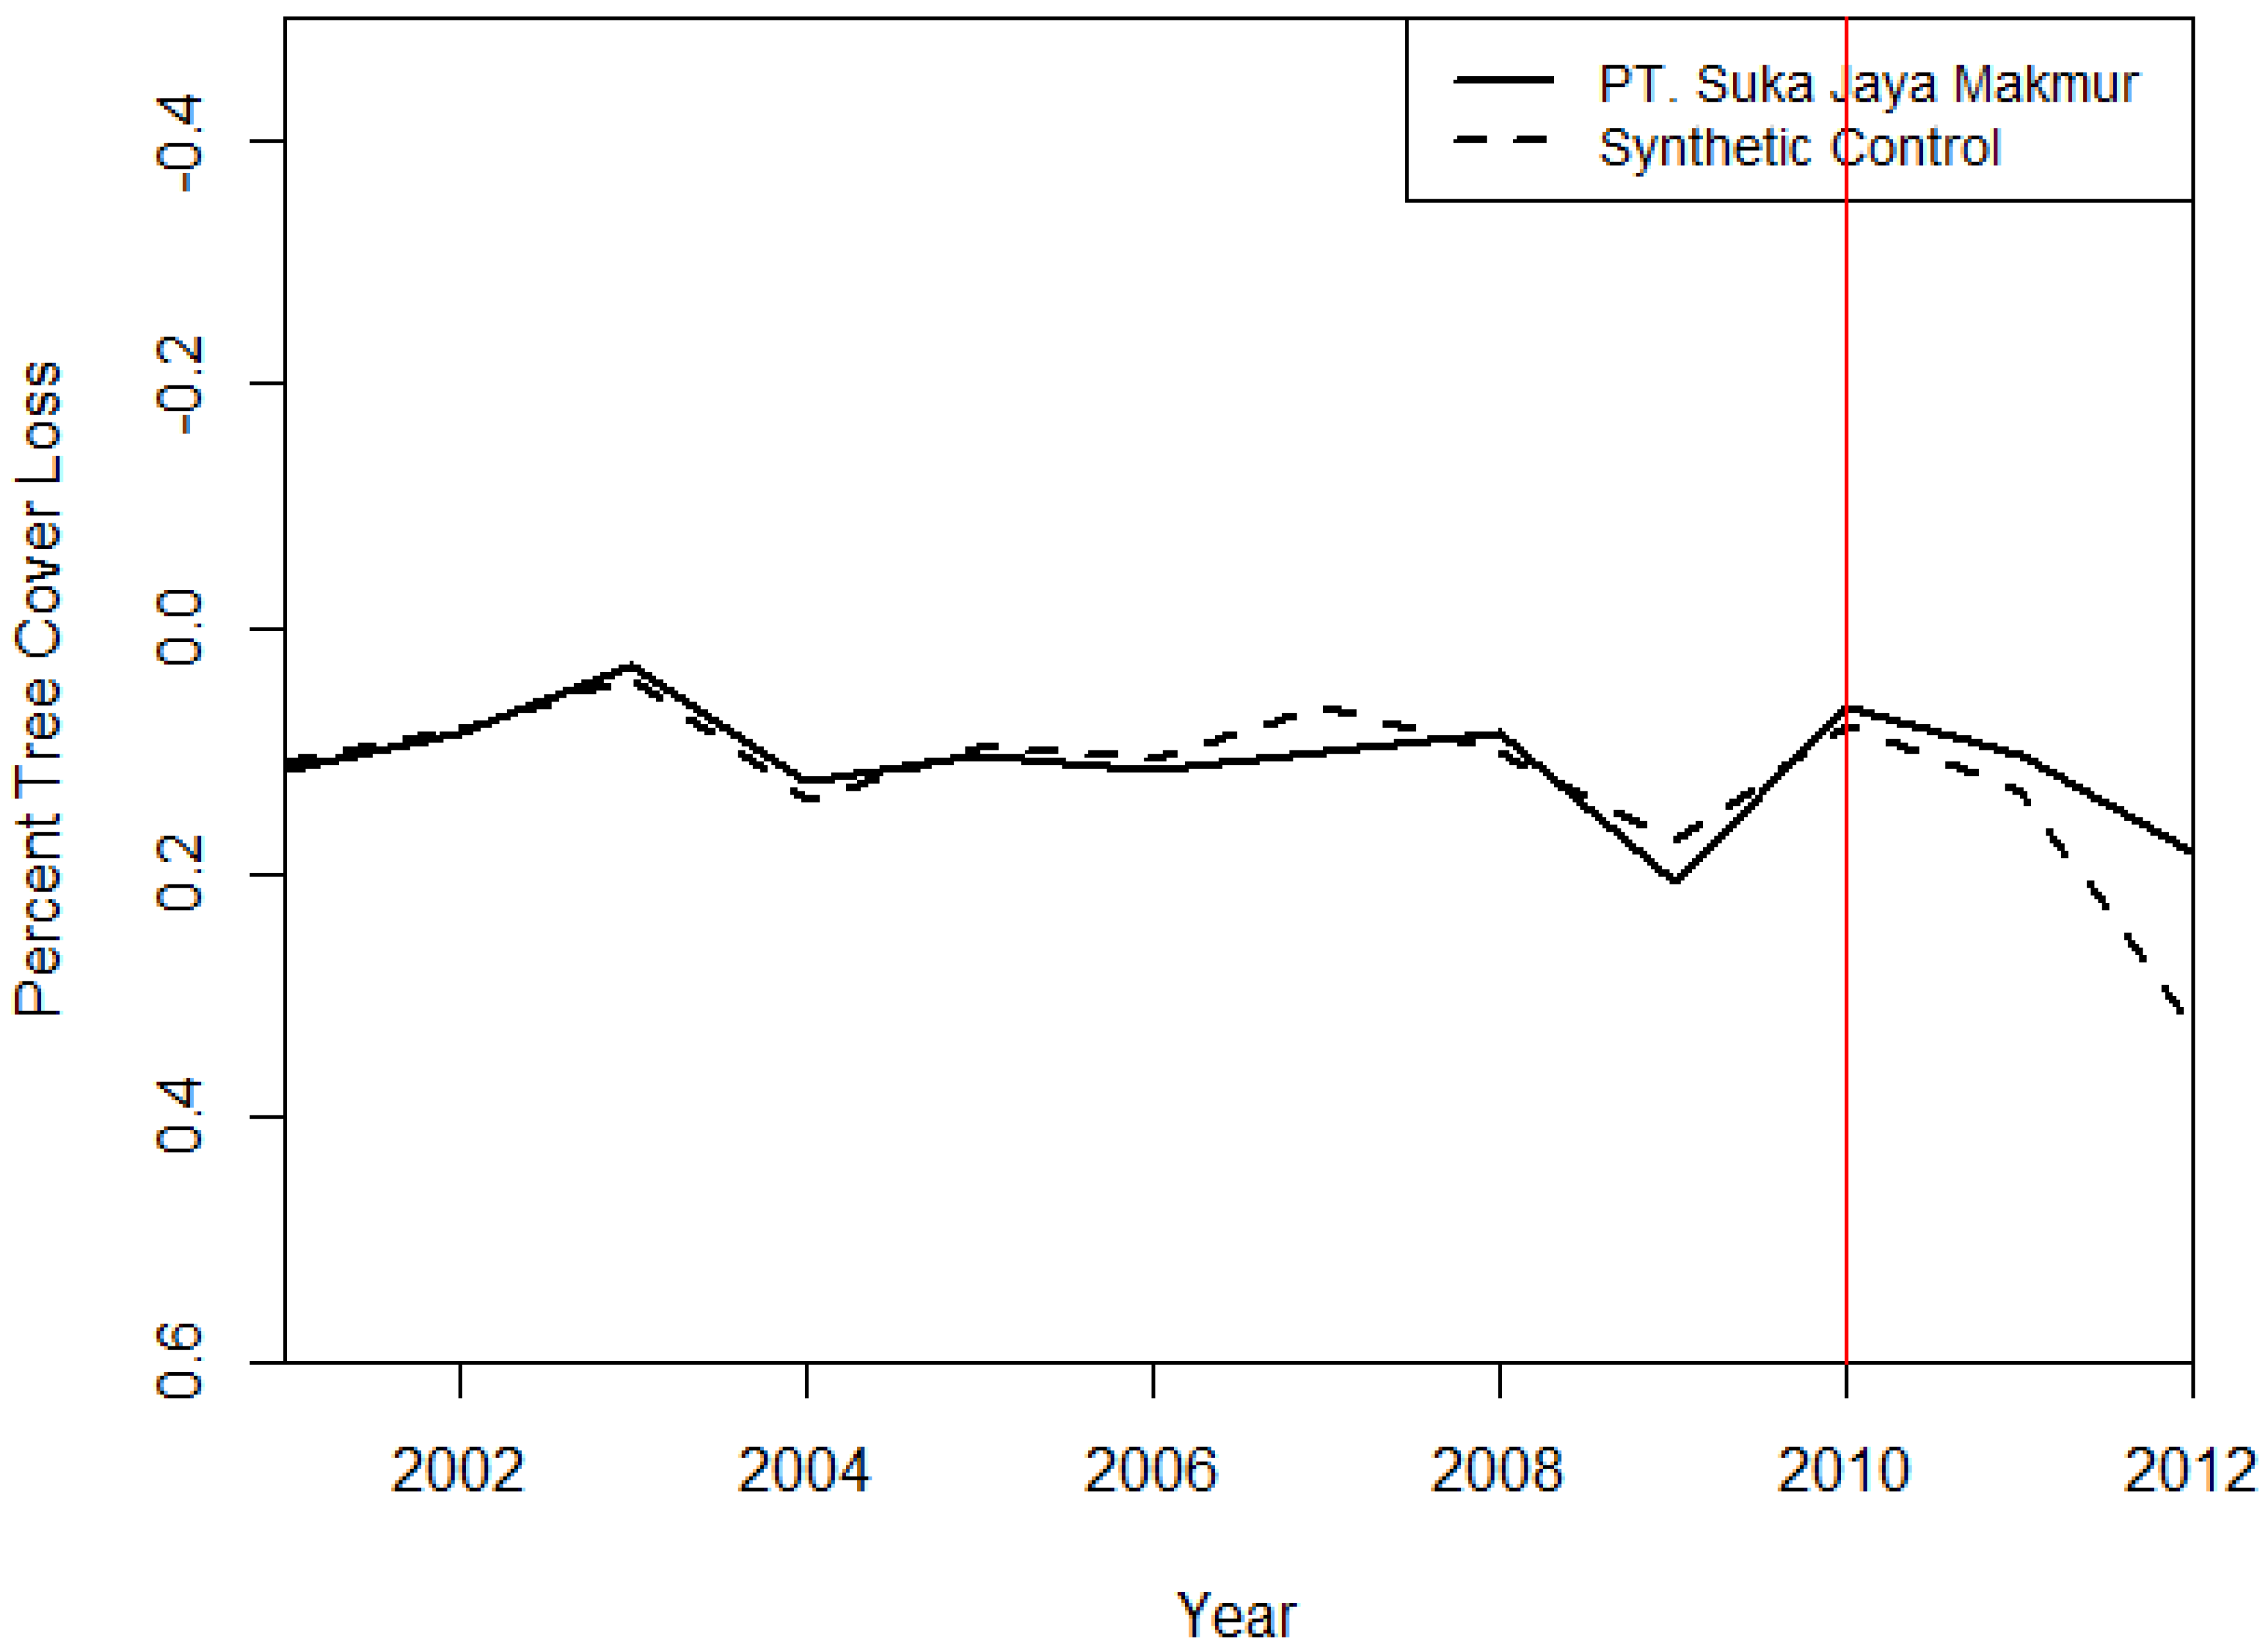
Figure 4 shows a very close match between tree cover loss in Suka Jaya Makmur and its synthetic control in the years before certification (Figure 4). After 2010, there is less tree cover loss in Suka Jaya Makmur compared to its synthetic control, suggesting that certification reduced tree cover loss.
2.3. Plausibility of Synthetic Controls as Counterfactuals
To assess the utility of SCM for evaluating the impacts of certification, we examine the plausibility of the synthetic controls by comparing tree cover loss in each certified unit and its synthetic control prior to certification. As shown in the figures, the overall trends match, with similar turning points. Likewise, the level of tree cover loss in the year before certification is similar in each certified unit and its synthetic control. However, the scales of the figures are different, and we calculate a much lower mean squared prediction error (MSPE) in Rougier (0.0005) and Suka Jaya Makmur (0.0003) than Orsa Florestal (0.029).
2.4. Sign and Significance of Causal Effects
Based on these synthetic controls, the point estimates of the effect of certification on tree cover loss are given by the difference between tree cover loss in the certified unit and in its synthetic control, as shown in Figure 1, Figure 2 and Figure 3 and calculated as column 2 min column 4 in Table 1, Table 2 and Table 3. Assuming that tree cover loss represents deforestation, the desired sign of the effect is negative, indicating that certification reduces tree cover loss.
The effects and their statistical significance, based on placebo tests, are reported in Table 4. The sign and the significance of the effect varies across years and across landscapes. In all cases, the point estimates are negative in the year immediately after certification and the last year in our dataset (2012), but the effects in the intermediate years are highly variable in terms of both sign and statistical significance.
The estimated effects of certification in Orsa Florestal are statistically different from zero, that is, they fall outside of the 10th to 90th percentiles of the placebo effects. Thus, certification of Orsa Florestal does appear to affect tree cover, but not always in the expected direction. In the first year after certification, it reduced tree cover loss, i.e., tree cover loss in Orsa Florestal was significantly lower (at the 90% level) than tree cover loss in its synthetic control. However, in the next four years (2006 to 2009), tree cover loss was lower in the synthetic control than in the Orsa FMU. Certification again appears to reduce tree cover loss in the years 2010 and 2012, but not the intervening year 2011. Thus, SCM reveals that the effects of certification vary over time, although the raw comparison of tree cover loss in Orsa Florestal and all non-certified FMUs in the landscape suggested systematically higher tree cover loss in Orsa Florestal.
3. Discussion
We used the synthetic control method (SCM), which controls for confounding factors through a robust counterfactual-based analysis [14,24], to estimate the effect of FSC certification of a FMU on tree cover in that FMU. While tree cover change is not the same as deforestation, our results suggest that certification likely did reduce deforestation in our case study FMU in Indonesia, and likely did not in our case study FMU in Gabon. In our case study FMU in Brazil, the effect of certification varied over time. Standard impact evaluation estimates a single average effect on the cumulative or most recent annual rate of tree cover change. In contrast, SCM automatically generates estimates for each individual FMU in each post-treatment year included in the dataset.
We identify two possible explanations for the variation in the estimated effects across years and FMUs, which also suggest caveats on our analysis. First, the FMUs that were certified had both more tree cover loss and more tree cover gain during the full period of data availability (2000–2012), suggesting that they may be more actively managed, with logging followed by reforestation (Table 5). Because we have annual data only on tree cover loss (and not tree cover gain), our synthetic controls may not have matched the pre-certification patterns of tree cover gain in the certified FMUs. Second, tree cover loss may reflect either deforestation or logging activities, including tree-fall gaps, skid trails, and decks. If certification increases logging activity in response to market demand, this could fluctuate up and down from year to year, resulting in the pattern of effects observed for Orsa Florestal.
While SCM applied to time series remote sensing data has great potential for evaluating the causal effects of small-N interventions like certification, such data cannot be used to address all of the questions (and perhaps not even the most important questions) about forest certification, such as its impacts on forest quality and local communities. Answers to these questions require field work [9]. The sampling design for data collection in the field could potentially be informed by SCM and specifically by the weights placed on different FMUs in the synthetic control.
To qualify as a plausible synthetic control for a certified FMU, tree cover loss in that synthetic control should follow the same path of tree cover loss in the certified FMU before certification. This leads to two further caveats on the use of SCM. First, we have only a small window of pre-treatment years to judge the similarity between the historical trajectory of tree cover loss in each certified FMU and its synthetic control. Second, for the three FMUs discussed here, we were able to construct plausible synthetic matches. However, as shown by Rana and Sills [25], this was not possible for all certified FMUs in these landscapes. This may be partly due to the lack of a clear trend in tree cover change, different from the outcomes considered in most previous applications of SCM [16,26]. Unlike public health or economic outcomes, the rate of tree cover change fluctuates up and down over time, reflecting demand for timber and agricultural commodities, and shifts in policies.
Finally, we note that our ability to construct plausible synthetic controls and estimate impacts is constrained by data availability. For our proof of concept, we relied on the first release of tree cover data from Hansen et al. [18] for the years 2000 to 2012. This limits our analysis to FMUs that were certified between 2003 and 2010 and thus have at least two years of data on the outcome both pre- and post-certification. We recommend the application of SCM to new releases of these tree cover data as well as national datasets such as the PRODES (Projeto de Estimativa do Desflorestamento da Amazônia) time series for Brazil, allowing impacts to be evaluated over a longer time frame. Second, the lack of a long time series of data on covariates for our study landscapes not only limits our choice of variables but limits our ability to standardize variables across the studied landscapes. With the increasing availability of long time series of high-resolution spatial data on tropical deforestation, socio-economic conditions, and forest certification [27], SCM can potentially provide causally-valid and robust inferences regarding the long-term effectiveness of forest certification.
4. Materials and Methods
For this proof of concept that SCM can be applied to evaluate the effect of a small-N intervention like FSC certification on Land Use Land Cover Change (LULCC), we needed to make methodological choices about (1) the outcome measure, (2) the unit of analysis, and (3) confounders that affect both tree cover change and the adoption of certification in that unit. We sought to standardize data and methods across our three study landscapes in Brazil, Gabon, and Indonesia to the degree possible, while also considering the units, time frame, and covariates relevant for each case. For more details on certification in these three landscapes, see [9,28,29,30].
For the first choice, the only data on forest cover available for multiple years for all of our landscapes was the Hansen data on tree cover change. We used original version 1.0 of the data, including annual tree cover loss layers from 2000 to 2012. For the second choice, decisions about certification are typically made at the level of the FMU: either an entire FMU is certified or it is not. Thus, FMUs are the logical unit of analysis. This means that we have a “small N” because there were only a few certified FMUs in each of our three landscapes prior to 2010, which we established as the cut-off in order to have sufficient data on tree cover post-certification.
For the third choice, the literature on tropical deforestation suggests potential confounders. For details on available datasets, see Rana and Sills [25]. SCM then selects and assigns weights to those covariates such that a synthetic control constructed to match their values in the certified unit also has the same history of tree cover change as that unit (prior to certification). This is accomplished through a nested optimization process described in greater detail by Abadie et al. [31].
The objective of SCM is to determine a set of weights on all potential comparison units that results in the synthetic unit that most closely resembles the unit of interest before that unit was treated (certified, in our case). The method makes unambiguously clear how much a particular comparison unit contributes to the construction of the counterfactual (i.e., the relative weight of each control unit). The explicit weights help quantitatively and qualitatively explore the plausibility of the synthetic control as the counterfactual of the unit of interest [16,24]. SCM is preferred to other quasi-experimental approaches when there are only a few treated units, which is often the case when analyzing aggregate units like countries or states. In such cases, it is difficult to identify treatment effects using traditional matching, because the law of large numbers or matching on covariates does not help produce treated and control groups that are similar on average. To compensate for the small number of units, however, SCM requires a long time series of data on the outcome variable. This is because SCM uses a nested optimization process that identifies a set of weights on potential covariates such that matching on those weighted covariates results in the closest possible match on the outcome over the full time series available prior to treatment.
4.1. Synthetic Control Method (SCM)
We used the Synthetic Control Method (SCM) to evaluate the effect of FSC certification (our treatment) of a FMU (our unit) on tree cover loss in that FMU (our outcome). SCM is based on Mill’s Method of Difference and thus simulates the counterfactual of a treated case in the absence of treatment. SCM was introduced by Abadie and Gardeazabal [24] and further developed by Abadie et al. [16]. It has been used to construct the counterfactual for single jurisdictions affected by anti-smoking legislation, minimum wages, terrorist conflict, and immigration controls [16,24,26,32]. Sills et al. [17] illustrated the use of SCM for evaluating policy impacts on land use. SCM has also been suggested as a way to systematically choose comparison units for comparative case studies, thus bridging the quantitative/qualitative methodological divide [16]. We adopted SCM as a rigorous and robust method, which is appropriate for the very small and heterogeneous pool of certified FMUs in our three landscapes and which is feasible due to the long time series of data on the outcome available in the Hansen dataset.
To establish whether our estimated effects are statistically significant, we used placebo tests. These tests are used to assess the robustness of estimates by exploring the likelihood that they would have been observed merely by chance [16,24,33]. For these tests, we estimated the “impacts” of placebo (or fictitious) certification treatments on each non-certified FMU, i.e., the FMUs in the “donor pool” for the synthetic control. We were interested in whether the estimated impact of actual certification was larger than the “impacts” of placebo treatments of FMUs that were not actually certified. If the estimated impact of certification on the certified FMU is larger (in absolute value) than almost all of the placebo effects on non-certified FMUs, that increases our confidence that the estimated impact is significantly different from zero, because it falls outside the range of statistical noise as represented by the placebo effects.
Placebo impacts are the differences in tree cover loss between fictitiously-certified FMUs and their synthetic controls. However, these estimated impacts are not all comparable. If a synthetic control fails to reproduce changes in tree cover before the fictitious intervention, then the placebo impact is not a reasonable basis for comparison. Thus, we only considered placebo impacts based on synthetic controls with mean square prediction error (MSPE) lower or equal to the MSPE of the synthetic control for the unit that was actually treated. We trimmed off the high MSPE placebo cases in order to focus on the range of estimated effects possible when the method works well but there is no real treatment. In this trimmed sample, we identified the 10th and 90th percentiles of the placebo effects in order to assess statistical significance at the 80% confidence level.
4.2. Covariates Used in Construction of Synthetic Control
We included several bio-physical characteristics in the pool of covariates for constructing the synthetic controls in each landscape. These are size of the FMU and its baseline tree cover, climate variables, and a measure of compactness of the FMU (perimeter of the FMU divided by perimeter of a circle of the same area). Information on units and sources of all covariates are provided in the Supplementary Materials (Table S1).
In addition to these common bio-physical factors, we identified factors that drive deforestation, or tree cover loss due to conversion of forest to other land uses, in each landscape. We favored measures of those factors available across the tropics, for consistency of the analyses, but we also drew on the different data sources available in each country. We could not use common covariates for all the three landscapes owing to lack of data for time periods before certification.
4.2.1. Orsa Florestal S.A. (Estuário Landscape)
The spatio-temporal distribution of deforestation in Brazil is shaped by a range of socio-economic, political, and bio-physical factors [34,35]. We identified factors from previous literature on the Brazilian Amazon and then defined proxy measures based on available data. In addition to the pan-tropical datasets described above, we drew upon country-specific data from the Instituto Brasileiro de Geografia e Estatística (IBGE, Brazilian Institute of Geography and Statistics) and ImazonGeo (http://www.imazongeo.org.br/doc/downloads.php). The full list of variables compiled is provided in the Supplementary Materials (Table S2, descriptive in Table S3). Many of these factors are confounders in the sense that they influence both the decision whether to certify and deforestation. For example, the probability of certification is likely related to the timber stock in the FMU, which in turn depends on both its size and its prior tree cover. Larger FMUs are more likely to remain certified over a longer period [35,36]. Of course, a larger timber stock may also make a FMU more attractive to illegal loggers and therefore more susceptible to deforestation. Likewise, the accessibility of a FMU, which we represent by distances to nearest settlement and timber pole, may influence the probabilities of certification and deforestation. These potential causal mechanisms are also described in the Supplementary Materials (Table S2). The covariates identified as the most influential factors explaining tree cover loss through the nested optimization are described in Table S4 of the Supplementary Materials.
4.2.2. Rougier (Gabon)
The timber economy in Gabon relies heavily on a single tree species: Okoume (Aucoumea klaineana Pierre). The species commands a high price due to its desirable properties for rotary peeling and slicing [29]. Thus, the proportion of a FMU’s land area that has Okoume may influence both its proneness to illegal logging and interest in certification.
Gabon’s relatively low population density (4.6 persons per km2) and high per capita income (USD 9200 Gross National Income per person) suggest limited pressure to clear forests for agriculture [37]. However, people do have customary subsistence rights over forests and thus we include population density as a possible factor explaining the spatial variation in deforestation. Higher population density could also encourage uptake of certification as a way to demonstrate social responsibility.
There are significant concerns about poor governance capacity in the forestry sector in Gabon [29,38]. We captured this factor with two types of variables: distance from FMU to the nearest city, where the government forest office would normally be located; and size and shape of concession. The size and shape of concessions matters because monitoring and enforcement is more expensive in large and fragmented FMUs. We considered total area under management by a company, the shape of those areas (as defined by our measure of compactness), and the maximum distance between any two spatial units managed by a company as predictors of the efficacy of monitoring and hence of deforestation outcomes. A larger total area under management may also encourage certification by spreading the transactions costs of obtaining certification over more hectares [29].
Both von Thünen’s theory and a large body of empirical evidence suggest that the probability of deforestation is linked to market access. Market access is influenced by timber companies in Gabon, because they construct roads to transfer harvested timber or to fulfill their social responsibilities by connecting villages [29]. We used road density and number of villages in 2000 to represent market access.
While there are clearly many other factors that affect deforestation, we were limited to variables available from secondary sources, as listed in Table S5 (descriptive in Table S6) of the Supplementary Materials. Although we do not know the exact causal mechanisms through which these variables influence the trajectories of the forest deforestation, we suggest some plausible mechanisms in the Supplementary Materials (Table S5). Table S7 in the Supplementary Materials shows the vector of weights on the covariates that were identified as the most influential through nested optimization.
4.2.3. Suka Jaya Makmur (Kalimantan)
Table S8 (Supplementary Materials) lists the variables used to construct the synthetic control for Suka Jaya Makmur (SJM), in addition to the bio-physical factors listed in Table S1. As with the other two landscapes, these were selected based on previous literature about the determinants of deforestation and operationalized using data available from across the tropics to the extent possible (Supplementary Materials, Table S8, descriptive in Table S9). Factors that have been found to influence deforestation outcomes in Indonesia include forest fires, poor governance, illegal logging, unclear property rights, social conflicts, market access, and perverse incentives created by government policies [39,40,41,42]. Poor implementation of sustainability policies has led to over-exploitation of forest resources [40].
Almost all native forests in Indonesia are publicly owned, and different levels of government allocate logging concessions, or permits, to harvest timber from forests. This has often led to conflicts with communities who consider these forests as their own. These conflicts have serious implications for deforestation and the uptake of certification by timber companies [40,43,44]. For example, Cerutti et al. [45] found that local populations may feel constrained by new regulations on forest use imposed to comply with certification requirements, resulting in social conflicts that may trigger deforestation. The costs of managing these conflicts and monitoring the resource use of local people in turn may deter companies from seeking certification [46,47,48].
To capture the potential for conflict as well as the demand for cleared land, we included population density and change of population in the jurisdictions where FMUs are located. Deforestation is also a function of the area available to be deforested, which depends on the forest stock and its accessibility. Thus, we included the proportion of primary forests, past tree cover, total area logged, logging intensity, and logging road density.
The most influential factors driving tree cover loss in the case of Suka Jaya Makmur, as identified through the nested optimization, are listed in Table S10 of the Supplementary Materials.
5. Conclusions
We presented a proof of concept that the synthetic control method can be applied to evaluate the impact of certification. Its advantages include (a) modeling the decision-making unit (the FMU), and (b) allowing for variable impacts over time. For this proof of concept, we used Hansen’s data on tree cover loss as our outcome, because it is available for a long time series across all of our tropical landscapes. There are a number of channels through which tree cover loss may be affected by certification, for example, increasing due to more active forest management as a result of higher market demand for certified products, or decreasing due to reduced slash-and-burn agriculture as a result of better company control over the FMU.
We demonstrated with one FSC certified FMU each from three topical forest landscapes: Orsa Florestal S.A. (Brazil), Rougier (Gabon), and SJM (Indonesia). In each case, our nested optimization procedure identified a weighted combination of non-certified FMUs that followed similar trends in tree cover change as the certified FMU. While this demonstrates the potential of the method, we caution that it was not possible to identify a good synthetic control in all cases [25].
In terms of tree cover loss, we found no impact of certification on the FMU in Gabon, small impacts on the FMU in Indonesia, and larger, statistically significant, but variable, impacts on the FMU in Brazil. These results demonstrate the value of applying a counterfactual method like SCM to evaluate the impacts of FSC on tree cover: the naïve comparison between certified and non-certified FMUs suggested increased tree cover loss in Brazil, but our SCM analysis revealed more variable impacts on tree cover loss. In Indonesia, the naïve comparison suggested much lower tree cover loss in certified concessions, but we found a smaller effect by comparing the FMU to the synthetic control representing its counterfactual.
Compared to traditional matching approaches, SCM presents two further advantages. Instead of estimating an average treatment effect for all certified units, SCM estimates the effect on each FMU. Also, instead of only considering one outcome—i.e., tree cover loss in a single year, such as the first year after certification or the most recent year, or total tree cover loss over the time period since certification—SCM estimates the full temporal profile of certification effects. In other words, we have estimated the effects of forest certification on tree cover in each year since certification. Recognizing heterogeneity across space and time is key to understanding the potential effects of certification across an entire landscape and over the long term.
Supplementary Materials
The following are available online at www.mdpi.com/1999-4907/9/3/arcitle number/S1, Table S1: Bio-physical factors considered in the construction of synthetic controls, due to established relationship with deforestation, Table S2: Description of covariates in case of Estuário, Table S3: Descriptive statistics for FMUs in the Estuário Landscape, Table S3 (a): Descriptive statistics for non-certified FMUs in the Estuário Landscape (Donor pool), Table S3 (b): Description of the certified FMU: Orsa Florestal S.A., Table S4: Vectors of weights on covariates used in construction of synthetic control for Orsa Florestal S.A., Table S5: Description of covariates in case of Gabon, Table S6: Descriptive statistics for FMUs in Gabon, Table S6 (a): Descriptive statistics of non-certified FMUs in Gabon, Table S6 (b): Description of Rougier (Certified FMU), Table S7: Vector of weights on covariates used in construction of synthetic control for Rougier, Table S8: Description of covariates in case of Kalimantan (Indonesia), Table S9: Descriptive statistics for FMUs in Kalimantan (Indonesia), Table S9 (a): Descriptive statistics of the non-certified FMUs (Donor pool), Table S9 (b): Description of the certified FMU Suka Jaya Makmur, Table S10: Vectors of weights on covariates used in construction of synthetic control for Suka Jaya Makmur.
Acknowledgments
This work was funded by CIFOR, the Center for International Forestry Research, under a project led by Claudia Romero and Manuel Guariguata. We gratefully acknowledge assistance compiling data and understanding national contexts from colleagues including Luciana Papp, Maureen Voigtlaender, Andre Monteiro, Guilherme Rodrigues Lima, David Gaveau, Ruslandi, Ahmad Maryudi, Nicolas Picard, Guillaume Lescuyer, and Paolo Cerutti. We have also benefited from discussions with the NCEAS SNAPP Working Group on Sharing vs. Sparing.
Author Contributions
P.R. and E.S. conceived and designed the analysis; P.R. analyzed the data; P.R. and E.S. wrote the paper.
Conflicts of Interest
The authors declare no conflict of interest. The funder had no role in the design of the study; in the collection, analyses, or interpretation of data; in the writing of the manuscript, and in the decision to publish the results.
References and Notes
- Börner, J.; Wunder, S. The scope for reducing emissions from forestry and agriculture in the Brazilian Amazon. Forests 2012, 3, 546–572. [Google Scholar] [CrossRef]
- Butler, R.A.; Koh, L.P.; Ghazoul, J. REDD in the red: Palm oil could undermine carbon payment schemes. Conserv. Lett. 2009, 2, 67–73. [Google Scholar] [CrossRef]
- Pacheco, P. Actor and frontier types in the Brazilian Amazon: Assessing interactions and outcomes associated with frontier expansion. Geoforum 2012, 43, 864–874. [Google Scholar] [CrossRef]
- Bisschop, L. Governance of the Illegal Trade in E-waste and Tropical Timber: Case Studies on Transnational Environmental Crime. Routledge 2016. [Google Scholar]
- Schepers, D.H. Challenges to legitimacy at the Forest Stewardship Council. J. Bus. Ethics 2010, 92, 279–290. [Google Scholar] [CrossRef]
- FSC INTERNATIONAL STANDARD FSC PRINCIPLES AND CRITERIA FOR FOREST STEWARDSHIP FSC-STD-01-001 (version 4-0). Available online: https://ic.fsc.org/file-download.principles-and-criteria-v4.a-1056.pdf (accessed on 2 January 2018).
- May, P. Forest Certification in Brazil, Confronting Sustainability: Forest Certification in Developing and Transitioning Countries; Yale School of Forestry & Environmental Studies: New Haven, CT, USA, 2004. [Google Scholar]
- Cashore, B. Legitimacy and the privatization of environmental governance: How non–state market–driven (NSMD) governance systems gain rule–making authority. Governance 2002, 15, 503–529. [Google Scholar] [CrossRef]
- Romero, C.; Putz, F.E.; Guariguata, M.R.; Sills, E.O.; Maryudi, A. The Context of Natural Forest Management and FSC Certification in Indonesia; Center for International Forestry Research (CIFOR): Bogor, Indonesia, 2015; Volume 126, pp. 1–94. [Google Scholar]
- Auld, G.; Gulbrandsen, L.H.; McDermott, C.L. Certification schemes and the impacts on forests and forestry. Annu. Rev. Environ. Resour. 2008, 33, 187–211. [Google Scholar] [CrossRef]
- Merry, F.D.; Carter, D.R. Certified wood markets in the US: Implications for tropical deforestation. For. Ecol. Manag. 1997, 92, 221–228. [Google Scholar] [CrossRef]
- Rametsteiner, E.; Simula, M. Forest certification—An instrument to promote sustainable forest management? J. Environ. Manag. 2003, 67, 87–98. [Google Scholar] [CrossRef]
- Brack, D.; Bailey, R. Ending Global Deforestation: Policy Options for Consumer Countries; Chatham House: London, UK, 2013; pp. 1–77. [Google Scholar]
- Ferraro, P.J. Counterfactual thinking and impact evaluation in environmental policy. New Dir. Eval. 2009, 2009, 75–84. [Google Scholar] [CrossRef]
- Ferraro, P.J.; Pattanayak, S.K. Money for nothing? A call for empirical evaluation of biodiversity conservation investments. PLoS Biol. 2006, 4, e105. [Google Scholar] [CrossRef] [PubMed]
- Abadie, A.; Diamond, A.; Hainmueller, J. Synthetic control methods for comparative case studies: Estimating the effect of California’s tobacco control program. J. Am. Stat. Assoc. 2010, 105, 493–505. [Google Scholar] [CrossRef]
- Sills, E.O.; Herrera, D.; Kirkpatrick, A.J.; Brandão, A., Jr.; Dickson, R.; Hall, S.; Pattanayak, S.; Shoch, D.; Vedoveto, M.; Young, L. Estimating the impacts of local policy innovation: The synthetic control method applied to tropical deforestation. PLoS ONE 2015, 10, e0132590. [Google Scholar] [CrossRef] [PubMed]
- Hansen, M.C.; Potapov, P.V.; Moore, R.; Hancher, M.; Turubanova, S.; Tyukavina, A.; Thau, D.; Stehman, S.V.; Goetz, S.J.; Loveland, T.R. High-resolution global maps of 21st-century forest cover change. Science 2013, 342, 850–853. [Google Scholar] [CrossRef] [PubMed]
- Conroy, M.E. Branded!: How the ‘Certification Revolution’ Is Transforming Global Corporations; New Society Publishers: Gabriola Island, BC, Canada, 2007; pp. 1–322. [Google Scholar]
- Rougier, F.; Clément, M. Preliminary Feedback on FSCTM Certification from an Operator’s Point of View; Proparco: Paris, France, 2012. [Google Scholar]
- Annual Report 2015: Managing Forests, Enriching Wood; Rougier S.A.: Paris, France, 2016.
- PT. Suka Jaya Makmur. Available online: http://www.pt-sjm.com/ (accessed on 2 January 2018).
- WWF Suka Jaya Makmur. Available online: https://www.wwf.or.id/?11440/PT-Suka-Jaya-Makmur (accessed on 2 January 2018).
- Abadie, A.; Gardeazabal, J. The Economic Costs of Conflict: A Case-Control Study for the Basque Country; National Bureau of Economic Research: Cambridge, MA, USA, 2003; pp. 1–35. [Google Scholar]
- Rana, P.; Sills, E. Does Certification Change the Trajectory of Tree Cover in Working Forests in the Tropics? An Application of the Synthetic Control Method of Impact Evaluation; Center for Environmental and Resource Economic Policy: Raleigh, NC, USA, 2017. [Google Scholar]
- Bohn, S.; Lofstrom, M.; Raphael, S. Do E-verify mandates improve labor market outcomes of low-skilled native and legal immigrant workers? South. Econ. J. 2015, 81, 960–979. [Google Scholar] [CrossRef]
- Kraxner, F.; Schepaschenko, D.; Fuss, S.; Lunnan, A.; Kindermann, G.; Aoki, K.; Dürauer, M.; Shvidenko, A.; See, L. Mapping certified forests for sustainable management-A global tool for information improvement through participatory and collaborative mapping. For. Policy Econ. 2017, 83, 10–18. [Google Scholar] [CrossRef]
- Romero, C.; Guariguata, M.R.; Putz, F.E.; Sills, E.O.; Lima, G.R.; Papp, L.; Voigtlaender, M.; Vidal, E. The Context of Natural Forest Management and FSC Certification in Brazil; Center for International Forestry Research (CIFOR): Bogor, Indonesia, 2015; Volume 148, pp. 1–106. [Google Scholar]
- Atyi, R.E. Forest certification in Gabon. In Confronting Sustainability: Forest Certification in Developing and Transitioning Countries; Yale School Forestry & Environmental Studies: New Haven, CT, USA, 2006; p. 442. [Google Scholar]
- Klassen, A.; Romero, C.; Putz, F.E. Forest Stewardship Council Certification of Natural Forest Management in Indonesia: Required Improvements, Costs, Incentives, and Barriers; Center for International Forestry Research (CIFOR): Bogor, Indonesia, 2014; pp. 255–273. [Google Scholar]
- Abadie, A.; Diamond, A.; Hainmueller, J. Synth: An R Package for Synthetic Control Methods in Comparative Case Studies. J. Stat. Softw. 2011, 42. [Google Scholar] [CrossRef]
- Sabia, J.J.; Burkhauser, R.V.; Hansen, B. Are the effects of minimum wage increases always small? New evidence from a case study of New York State. ILR Rev. 2012, 65, 350–376. [Google Scholar] [CrossRef]
- Bertrand, M.; Duflo, E.; Mullainathan, S. How much should we trust differences-in-differences estimates? Q. J. Econ. 2004, 119, 249–275. [Google Scholar] [CrossRef]
- Pfaff, A.; Robalino, J.; Walker, R.; Aldrich, S.; Caldas, M.; Reis, E.; Perz, S.; Bohrer, C.; Arima, E.; Laurance, W. Road investments, spatial spillovers, and deforestation in the Brazilian Amazon. J. Reg. Sci. 2007, 47, 109–123. [Google Scholar] [CrossRef]
- Voigtlaender, M. Chapter 4. Assessment of self-selection into natural forest management certification in the Brazilian Amazon. In The Context of Natural Forest Management and FSC Certification in Brazil; Center for International Forestry Research (CIFOR): Bogor, Indonesia, 2015; Volume 148, p. 84. [Google Scholar]
- Zerbini, F. Cenário da Madeira FSC No Brasil 2012–2013; FSC Brasil: São Paulo, Brazil, 2014. [Google Scholar]
- International Tropical Timber Organization (ITTO). Promotion of Sustainable Management of African Forests; ITTO: Yokohama, Japan, 2003. [Google Scholar]
- Kaplinsky, R.; Terheggen, A.; Tijaja, J. China as a final market: The Gabon timber and Thai cassava value chains. World Dev. 2011, 39, 1177–1190. [Google Scholar] [CrossRef]
- Mayers, J.; Bass, S.; Macqueen, D. The Pyramid: A Diagnostic and Planning Tool for Good Forest Governance; World Bank: Washington, DC, USA, 2002. [Google Scholar]
- Muhtaman, D.R.; Prasetyo, F.A. Forest certification in Indonesia. In Confronting Sustainability: Forest Certification in Developing and Transitioning Countries; Yale School Forestry & Environmental Studies: New Haven, CT, USA, 2006; p. 32. [Google Scholar]
- Musthofid, D.; Wijaksana, D. Effort to curb illegal logging hamper by collusion. Jakarta Post 19 September 2002.
- Mir, J.; Fraser, A. Illegal logging in the Asia-Pacific region: An ADB perspective. Int. For. Rev. 2003, 5, 278–281. [Google Scholar] [CrossRef]
- Ruwiatuti, M.R. Sesat Pikir: Politik Hukum Agraria: Membongkar Alas Penguasaan Negara Atas Hak-Hak Adat; Diterbitkan Atas kerjasama Insist Press: KPA, dan Pustaka Pelajar, Jogjakarta, 2000; pp. 1–196. [Google Scholar]
- Rowland, I.; Simpoha, M. Analysis of the Forest Management Certification Process, Indonesia: Draft; Department for International Development: DFID Forestry Indonesia, London, UK, 1999.
- Cerutti, P.O.; Lescuyer, G.; Tsanga, R.; Kassa, S.N.; Mapangou, P.R.; Mendoula, E.E.; Missamba-Lola, A.P.; Nasi, R.; Eckebil, P.P.T.; Yembe, R.Y. Social Impacts of the Forest Stewardship Council Certification: An Assessment in the Congo Basin; Center for International Forestry Research (CIFOR): Bogor, Indonesia, 2014; Volume 103, pp. 1–58. [Google Scholar]
- Gullison, R.E. Does forest certification conserve biodiversity? Oryx 2003, 37, 153–165. [Google Scholar] [CrossRef]
- Raunetsalo, J.; Juslin, H.; Hansen, E.; Forsyth, K. Forest Certification Update for the UNECE Region, Summer 2002; United Nations Publications: Herndon, VA, USA, 2002; Volume 25, pp. 1–34. [Google Scholar]
- Teisl, M.F.; Plantinga, A.J.; Allen, T.G.; Field, D. Funding forest certification. Choices 2001, 7, 1–8. [Google Scholar]
Figure 1.
Locations of Orsa Florestal S.A., Rougier, and Suka Jaya Makmur in studied landscapes.

Figure 2.
Comparison of tree cover loss in Orsa Florestal S.A. and its synthetic control, 2001–2012. Tree cover loss increases down the y-axis. Red line indicates the year of certification.
Figure 2.
Comparison of tree cover loss in Orsa Florestal S.A. and its synthetic control, 2001–2012. Tree cover loss increases down the y-axis. Red line indicates the year of certification.
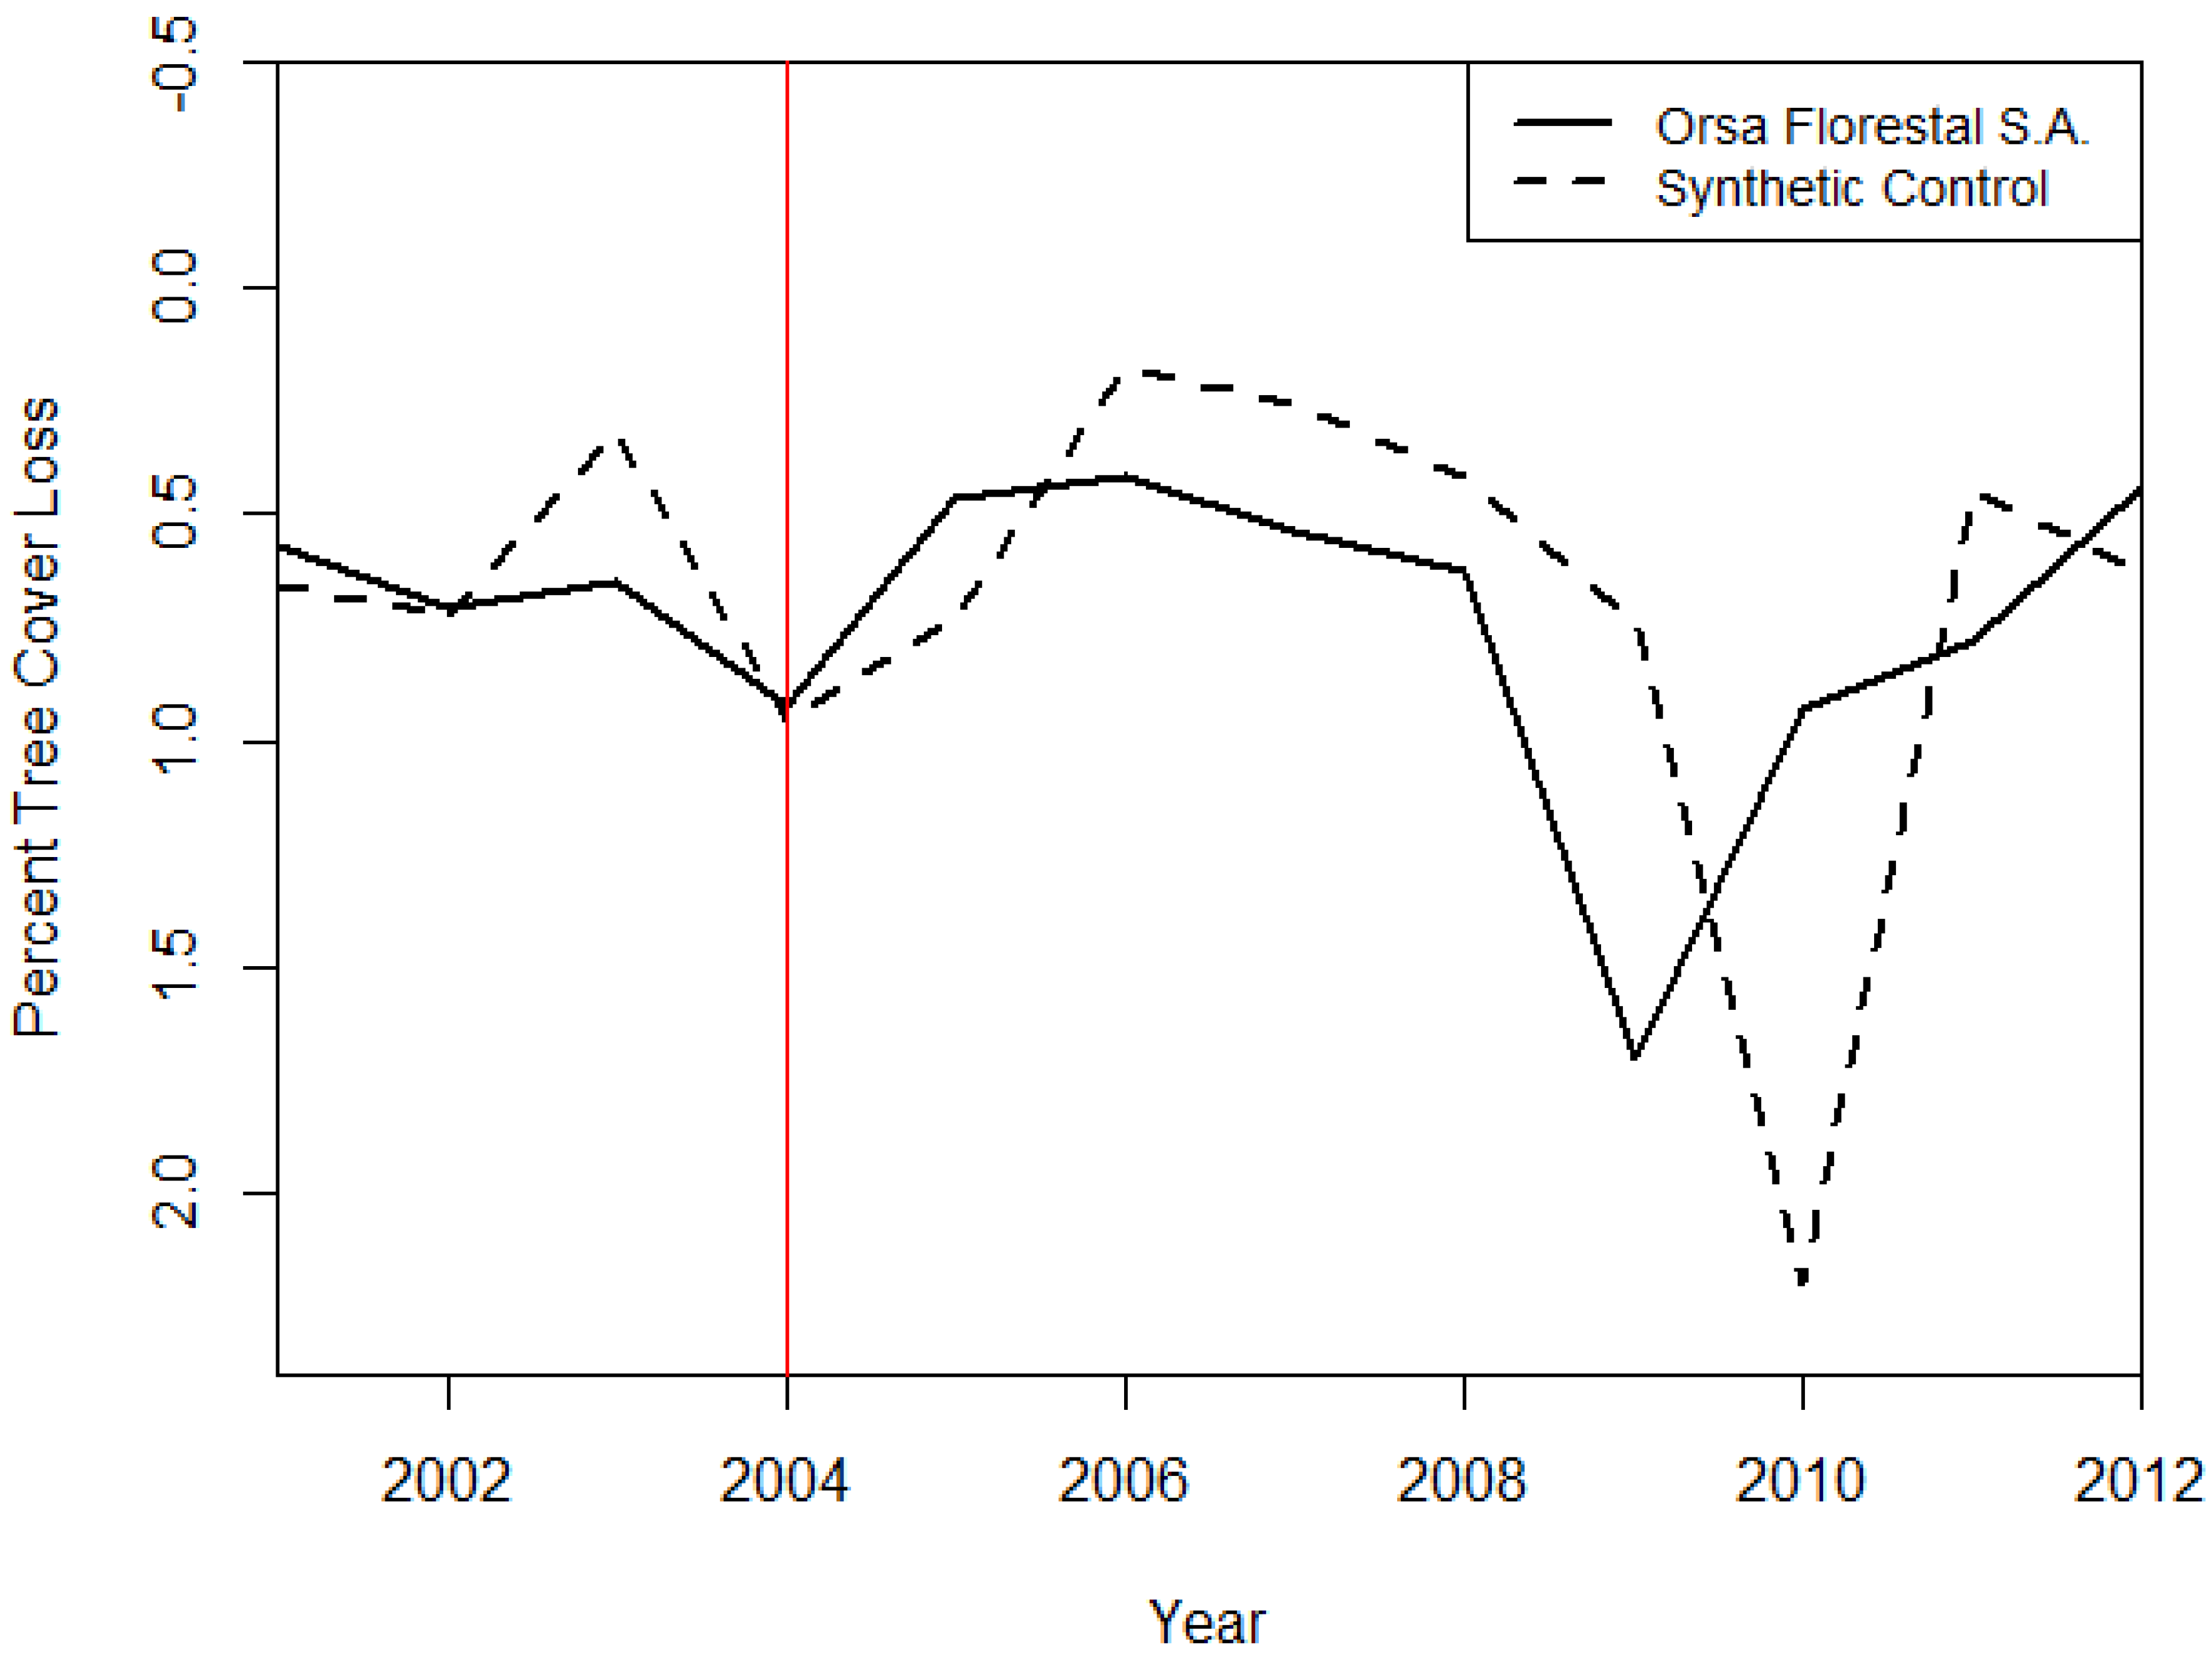
Figure 3.
Comparison of tree cover loss in Rougier and its synthetic control, 2001–2012. Tree cover loss increases down the y-axis. Red line indicates the year of certification.
Figure 3.
Comparison of tree cover loss in Rougier and its synthetic control, 2001–2012. Tree cover loss increases down the y-axis. Red line indicates the year of certification.
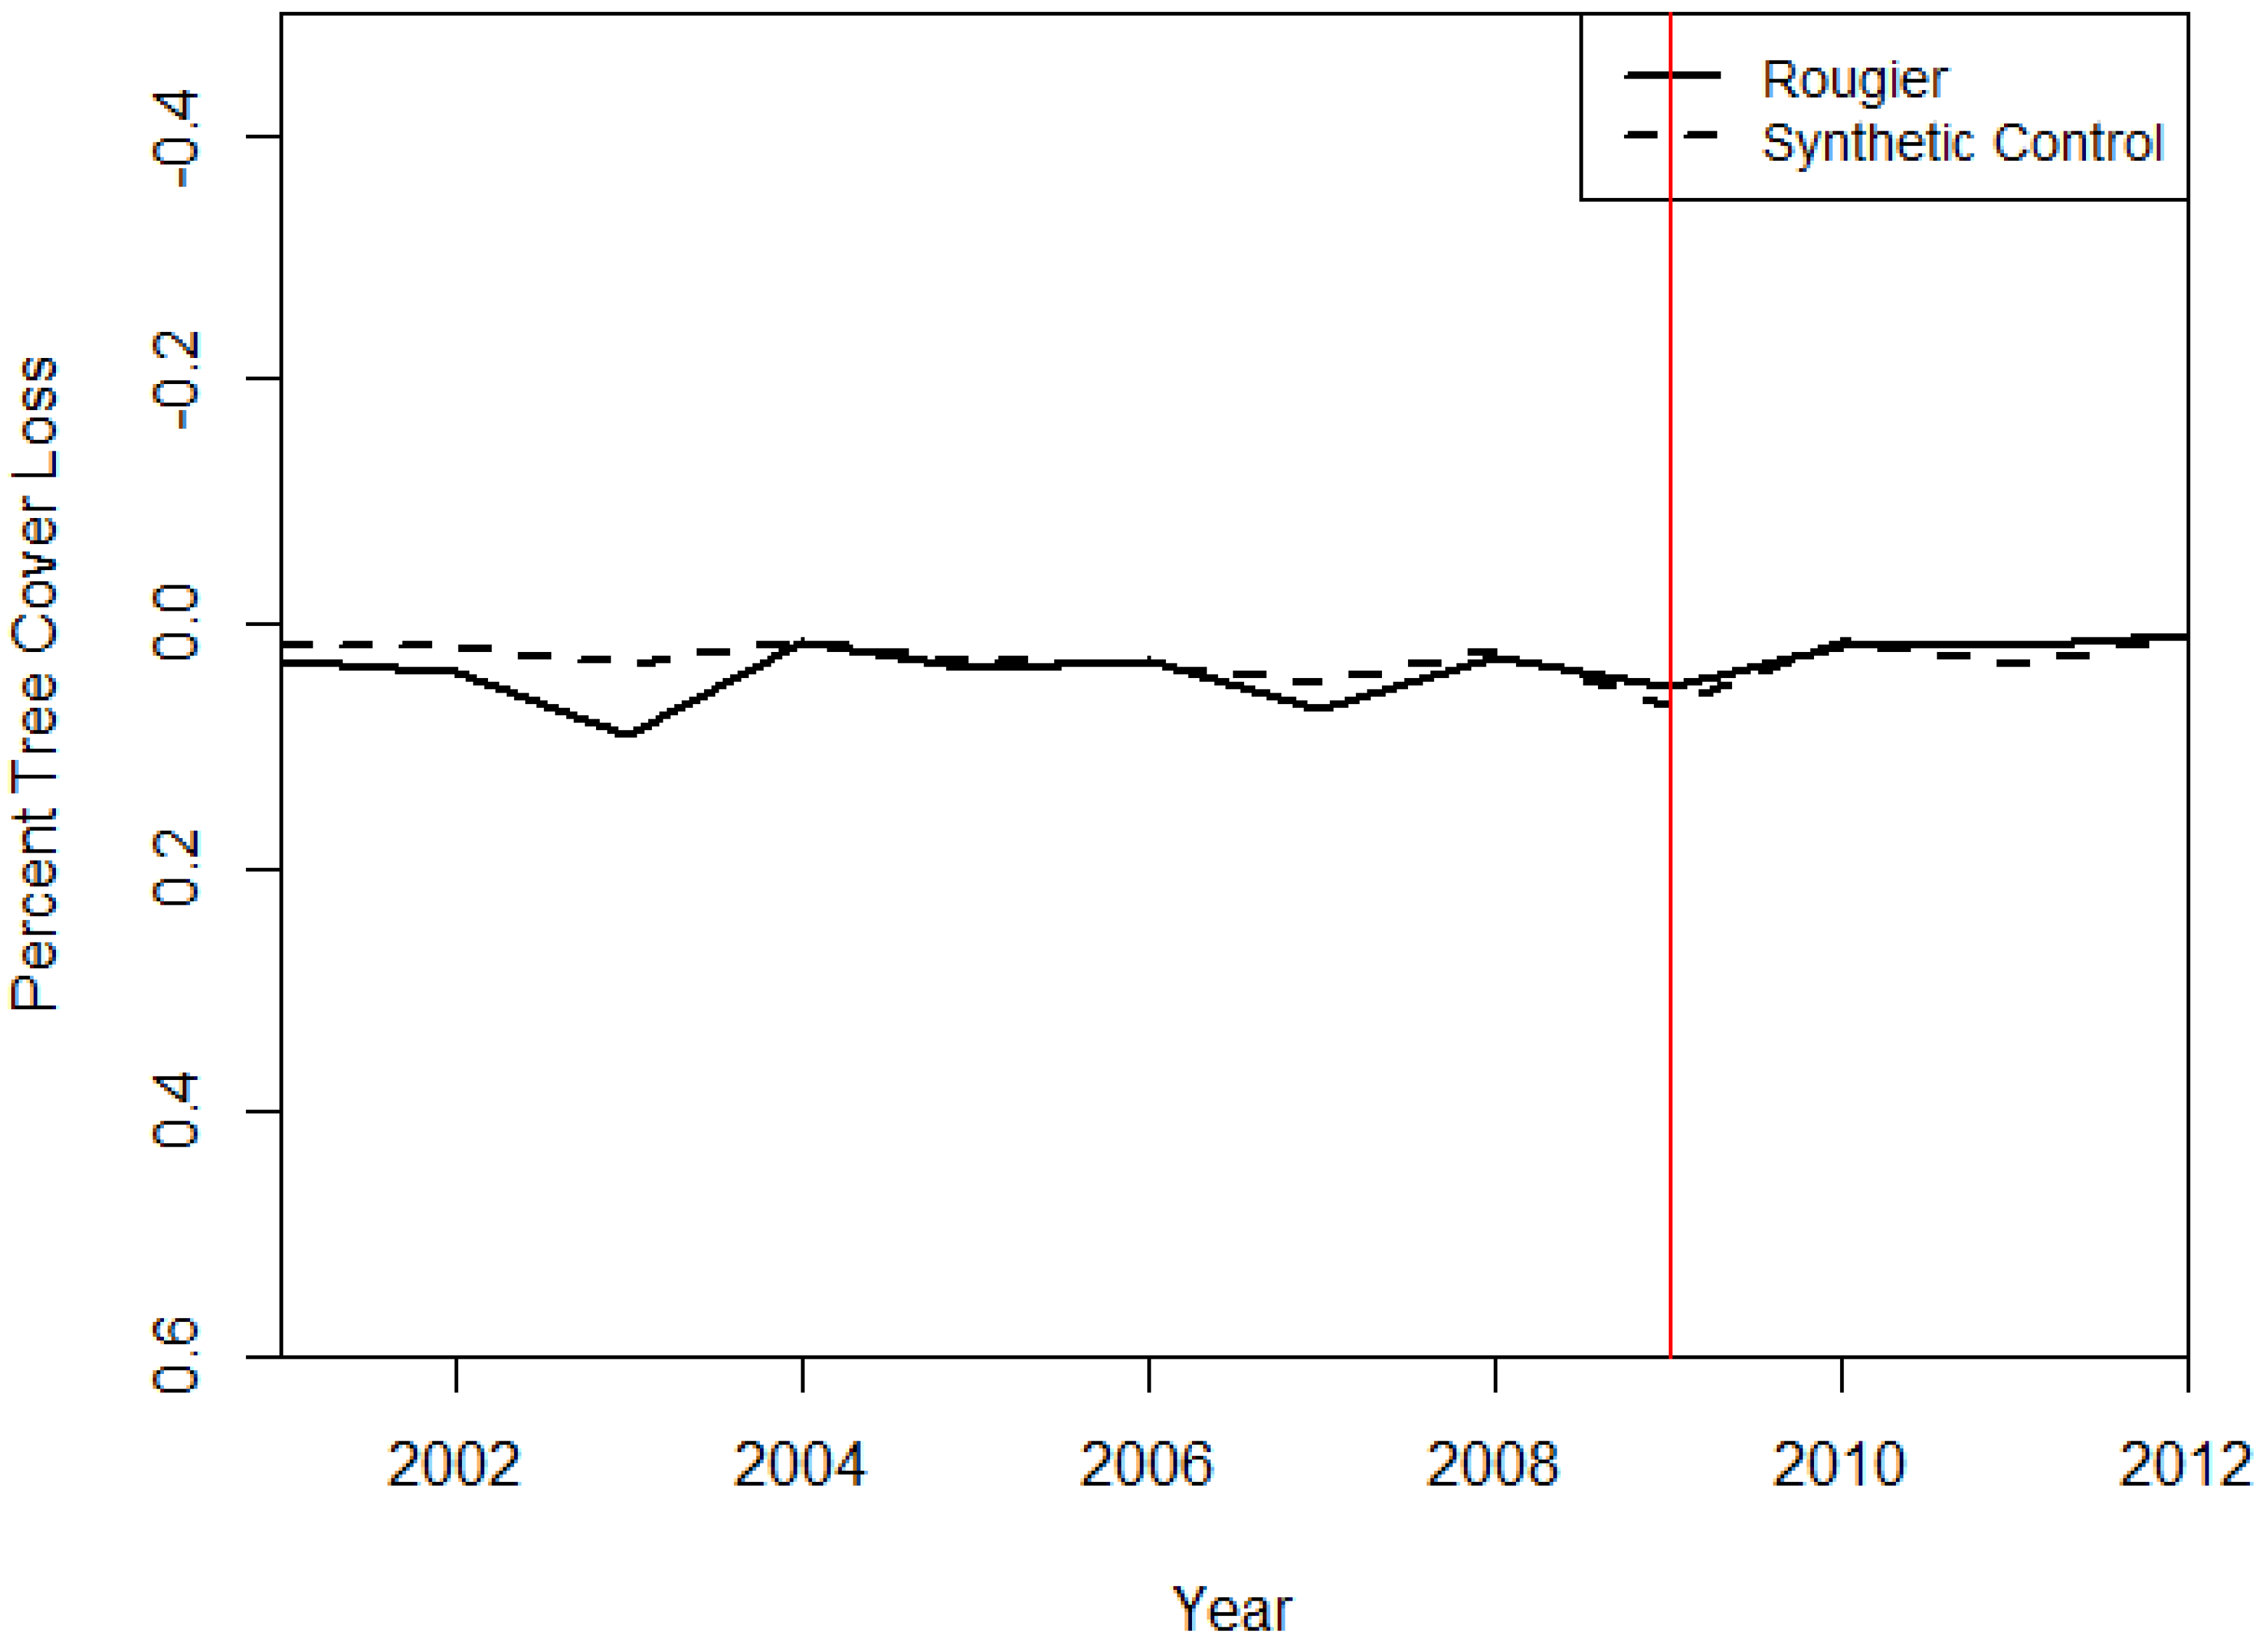
Figure 4.
Comparison of tree cover loss in Suka Jaya Makmur and its synthetic control, 2001–2012. Tree cover loss increases down the y-axis. Red line indicates the year of certification.
Figure 4.
Comparison of tree cover loss in Suka Jaya Makmur and its synthetic control, 2001–2012. Tree cover loss increases down the y-axis. Red line indicates the year of certification.

Table 1.
Percent of tree cover lost annually in forest management units (FMUs) in the Estuário Landscape of the Brazilian Amazon. Shaded rows correspond to years after Forest Stewardship Council (FSC) certification of Orsa Florestal.
Table 1.
Percent of tree cover lost annually in forest management units (FMUs) in the Estuário Landscape of the Brazilian Amazon. Shaded rows correspond to years after Forest Stewardship Council (FSC) certification of Orsa Florestal.
| Year | Orsa Florestal (Certified FMU) | Non-Certified FMUs in the Same Landscape | Synthetic Control (Rate of Tree Cover Loss × Weight (W*) for Each Donor FMU in the Synthetic Control) |
|---|---|---|---|
| 2001 | 0.57 | 0.10 | 0.66 |
| 2002 | 0.70 | 0.19 | 0.72 |
| 2003 | 0.65 | 0.05 | 0.32 |
| 2004 | 0.92 | 0.48 | 0.96 |
| 2005 | 0.47 | 0.20 | 0.73 |
| 2006 | 0.42 | 0.30 | 0.17 |
| 2007 | 0.53 | 0.99 | 0.25 |
| 2008 | 0.62 | 0.52 | 0.42 |
| 2009 | 1.70 | 0.35 | 0.73 |
| 2010 | 0.93 | 0.68 | 2.21 |
| 2011 | 0.77 | 0.16 | 0.44 |
| 2012 | 0.44 | 0.13 | 0.62 |
Table 2.
Percent of tree cover lost annually in FMUs in Gabon. Shaded rows correspond to years after FSC certification of Rougier.
Table 2.
Percent of tree cover lost annually in FMUs in Gabon. Shaded rows correspond to years after FSC certification of Rougier.
| Rougier (Certified FMU) | Non-Certified FMUs in the Same Landscape | Synthetic Control (Rate of Tree Cover Loss × Weight (W*) for Each Donor FMU in the Synthetic Control) | |
|---|---|---|---|
| 2001 | 0.03 | 0.04 | 0.02 |
| 2002 | 0.04 | 0.05 | 0.02 |
| 2003 | 0.09 | 0.05 | 0.03 |
| 2004 | 0.02 | 0.02 | 0.01 |
| 2005 | 0.04 | 0.04 | 0.03 |
| 2006 | 0.03 | 0.05 | 0.03 |
| 2007 | 0.07 | 0.04 | 0.05 |
| 2008 | 0.03 | 0.04 | 0.02 |
| 2009 | 0.05 | 0.06 | 0.07 |
| 2010 | 0.017 | 0.02 | 0.013 |
| 2011 | 0.02 | 0.04 | 0.03 |
| 2012 | 0.008 | 0.02 | 0.009 |
Table 3.
Percent of tree cover lost annually in FMUs in Kalimantan. Shaded rows correspond to years after FSC certification of Suka Jaya Makmur.
Table 3.
Percent of tree cover lost annually in FMUs in Kalimantan. Shaded rows correspond to years after FSC certification of Suka Jaya Makmur.
| Year | Suka Jaya Makmur (Certified FMU) | Non-Certified FMUs in the Same Landscape | Synthetic Control (Rate of Tree Cover Loss × Weight (W*) for Each Donor FMU in the Synthetic Control) |
|---|---|---|---|
| 2001 | 0.12 | 0.25 | 0.11 |
| 2002 | 0.09 | 0.26 | 0.08 |
| 2003 | 0.03 | 0.21 | 0.04 |
| 2004 | 0.13 | 0.35 | 0.14 |
| 2005 | 0.10 | 0.36 | 0.10 |
| 2006 | 0.11 | 0.45 | 0.11 |
| 2007 | 0.10 | 0.31 | 0.06 |
| 2008 | 0.09 | 0.31 | 0.10 |
| 2009 | 0.21 | 0.39 | 0.17 |
| 2010 | 0.06 | 0.25 | 0.08 |
| 2011 | 0.10 | 0.34 | 0.13 |
| 2012 | 0.18 | 0.58 | 0.32 |
Table 4.
Estimated effects of certification on percent tree cover loss by calendar year for three certified FMUs.
Table 4.
Estimated effects of certification on percent tree cover loss by calendar year for three certified FMUs.
| Brazilian Amazon | Gabon | Kalimantan (Indonesia) | |
|---|---|---|---|
| Year | ORSA | ROUGIER | SJM |
| 2005 | −0.26 * | ||
| 2006 | 0.25 * | ||
| 2007 | 0.28 * | ||
| 2008 | 0.20 * | ||
| 2009 | 0.97 * | −0.02 | |
| 2010 | −1.28 * | 0.004 | |
| 2011 | 0.33 * | −0.01 | −0.03 * |
| 2012 | −0.18 * | −0.001 | −0.14 * |
ORSA: Orsa Florestal S.A.; SJM: Suka Jaya Makmur. Negative effects indicate less tree cover loss in the certified FMU compared to its synthetic control. * Effect of certification is significant at 80% level, as demonstrated by effects that fall outside of the 10th to 90th percentiles of the placebo treatment effects, including only placebo effects from synthetic controls with mean squared prediction error (MSPE) equal or less than MSPE of synthetic control for certified FMU.
Table 5.
Forest Gain and Loss, 2000 to 2012.
| Certified FMUs | Total Area (Ha) | Forest Gain (Ha) | Forest Gain as % of FMU | Forest Loss (Ha) | Forest Loss as % of FMU | Net Change (+/−) | Net Change (%) |
|---|---|---|---|---|---|---|---|
| Orsa Florestal | 910,507.7 | 45,776.61 | 5.03 | 82,166.49 | 9.02 | −36,389.9 | −3.99 |
| Rougier | 886,751.34 | 859.23 | 0.10 | 3661.74 | 0.41 | −2802.51 | −0.32 |
| Suka Jaya Makmur | 182,977.08 | 364.59 | 0.19 | 2263.14 | 1.24 | −1898.55 | −1.04 |
© 2018 by the authors. Licensee MDPI, Basel, Switzerland. This article is an open access article distributed under the terms and conditions of the Creative Commons Attribution (CC BY) license (http://creativecommons.org/licenses/by/4.0/).
Share and Cite
MDPI and ACS Style
Rana, P.; Sills, E.O. Does Certification Change the Trajectory of Tree Cover in Working Forests in The Tropics? An Application of the Synthetic Control Method of Impact Evaluation. Forests 2018, 9, 98. https://doi.org/10.3390/f9030098
AMA Style
Rana P, Sills EO. Does Certification Change the Trajectory of Tree Cover in Working Forests in The Tropics? An Application of the Synthetic Control Method of Impact Evaluation. Forests. 2018; 9(3):98. https://doi.org/10.3390/f9030098
Chicago/Turabian StyleRana, Pushpendra, and Erin O. Sills. 2018. "Does Certification Change the Trajectory of Tree Cover in Working Forests in The Tropics? An Application of the Synthetic Control Method of Impact Evaluation" Forests 9, no. 3: 98. https://doi.org/10.3390/f9030098
Note that from the first issue of 2016, this journal uses article numbers instead of page numbers. See further details here.