Article

Evaluation of Tree Species for Biomass Energy Production in Northwest Spain

by
Pedro Álvarez-Álvarez
1,*,
Consuelo Pizarro
2,
Marcos Barrio-Anta
1,
Asunción Cámara-Obregón
1,
Julio Luis María Bueno
2,
Ana Álvarez
2,
Inés Gutiérrez
2 and
David F. R. P. Burslem
3
1
GIS-Forest Group, Department of Organisms and Systems Biology, University of Oviedo, E-33993 Mieres, Spain
2
Department of Chemical and Environmental Engineering, Chemistry Faculty, University of Oviedo, Julián Clavería 8, 33006 Oviedo, Spain
3
School of Biological Sciences, University of Aberdeen, Cruickshank Building, St Machar Drive, Aberdeen AB24 3UU, UK
*
Author to whom correspondence should be addressed.
Forests 2018, 9(4), 160; https://doi.org/10.3390/f9040160
Submission received: 23 February 2018 / Revised: 16 March 2018 / Accepted: 20 March 2018 / Published: 23 March 2018
(This article belongs to the Section Forest Ecology and Management)

Abstract

:
Three types of forest stands (chestnut coppice, maritime pine stands, and poplar and willow short-rotation woody crops (SRWC)) were evaluated to determine their potential for energy production. The properties of the main aboveground biomass fractions (wood, bark and crown) and also the whole tree were analysed, thus providing data that could be used for management purposes and for evaluating potential forest, biomass energy yields and atmospheric emissions. Proximate, elemental and energetic analyses of the biomass provided important information for evaluating the fuel potential. The energetic value of the biomass derived from the maritime pine stands was higher than that of the poplar and willow clonal stands and chestnut coppice stands. The high ash content of the chestnut bark, relative to that of the wood and crown material, is also an important consideration in relation to energy production. The proportion of carbon concentration accumulated per tree was very similar in all types of material studied, although the N and S contents were higher in the maritime pine stands than in the other stands. For this reason, selection of species and fractions can help to improve fuel quality and the efficiency of the combustion processes, and to minimize atmospheric emissions.

1. Introduction

The use of forest biomass as a primary source of energy has decreased in the past century as a result of the massive use of fossil fuels (coal, natural gas, etc.). However, recognition of the need to reduce our dependence on fossil fuels and to meet emissions commitments in terms of carbon credits has promoted renewed consideration of forest biomass, forest residues and short-rotation biomass plantations as potentially important sources of renewable energy [1,2]. Forest biomass is thus a potentially significant source of renewable energy for the energy sector, consistent with the ecological and economic importance of forests [3]. Moreover, as current European Union (EU) policy (Directive 2009/28/EC) endorses a mandatory target of a 20% share of energy from renewable sources in overall energy consumption in the EU by 2020, woody biomass is expected to be an important energy resource in the near future.
The region of Asturias in NW Spain occupies an area of 1,060,357 ha. Forestland covers an area of 764,598 ha in the region, and the total afforested area is 451,000 ha. Sweet chestnut coppice (Castanea sativa Mill.) and maritime pine (Pinus pinaster Ait.) stands are well represented in the region, covering more than 84,560 ha and 22,500 ha respectively [4]. These are the third and fourth most important species in terms of annual cutting volume (more than 30,900 m3 for chestnut and 110,000 m3 for maritime pine), and they are grown in rotations of 35–45 years (chestnut) and of 40–50 years (pine) [5]. Moreover, Asturias was a major coal-producing region in the last century, and although coal mining continues to be one of the most important sources of employment in the region [6,7], the sector is currently in recession. Large areas of abandoned mine land could now be used to produce forest biomass by introducing short-rotation woody crops (SRWCs), especially on degraded sites, with fast-growing tree species cultivated with the aim of producing high biomass yields in a short time (3–10 years) [8,9,10,11]. The use of forest biomass for generating energy therefore represents a potentially reliable means of reactivating the forest sector and gradually replacing the extraction of fossil fuels in the region.
The edaphic, climatic and ecological conditions in Asturias are ideal for growing trees and the area represents one of the regions with highest potential for growth of trees in Europe [12,13,14,15,16,17]. The trees could be used to generate a significant amount of timber and timber residues with a huge potential for use in energy production. Moreover, SRWCs may also be suitable for planting on abandoned mine lands with degraded soils, despite the difficulties in establishing energy crops in soils with unfavourable structure and properties [8,10,18]. To date, the only plantations involving SRWCs in Asturias are used in research trials (totalling 7 ha) currently being carried out by the University of Oviedo. However, the former mining company Grupo Hunosa, which currently owns around 700 ha of abandoned mining land in the region, is conducting the first commercial SRWC plantations (across an area of 40 ha) on the basis of the results obtained from research trials.
Sustainable development of biomass resources for energy purposes requires knowledge of the biomass supply capacity but also the biomass quality [19,20], which can improve the forest-based bioenergy sector and may result in its increased and more efficient use [21]. Stand characteristics (age, site quality, stand parameters) must be measured in order to determine how they affect the quality of biomass in relation to bioenergy products as well as to evaluate any potentially negative effects on the environment [22]. In this respect, sufficient details must be obtained in order to characterize and identify specific types of biomass because the quality of forest biomass is strongly associated with the contents of organic and inorganic components [23]. Moreover, biomass resources used for energy production also have potential for carbon sequestration even taking into account the fossil fuels used to produce and transport the forest biomass [22,24].
Comprehensive characterization of the forest biomass in relation to its chemical and fuel properties is therefore required [20,25]. Information about fuel properties (i.e., calorific value, ash content, volatile content, fixed carbon content, ultimate carbon and hydrogen) is therefore very important for evaluating the energy potential, to minimize atmospheric emissions and to meet or surpass stringent public health and air-quality standards [19,26]. Such information is usually obtained by standard test methods, ultimate and proximate analysis and calorimetry (for higher heating value). In this context, the calorific value or higher heating value (HHV) is one of the most important parameters for characterizing biomass or fuel and is obviously determined by its chemical composition, i.e., cellulose, hemicellulose, lignin, extractives and ash-forming minerals [27]. Changes in moisture, concentration of volatile and essential oils strongly influence this value in the combustion process [28]. The quality of the biomass or fuel is determined by the amount of heat (energy) generated from a unit mass of fuel (J/g) [19].
The aims of this study were as follows: (1) to investigate the fuel properties of different biomass components (crown, wood and bark) and whole trees in mature chestnut coppice and maritime pine stands and in five important clonal stands (3 of poplar and 2 of willow) grown as SRWCs (5–6 years old), to provide the information required for their use for energy purposes; and (2) to examine the differences in quality parameters relative to several dasometric variables (age, dn, N, G and Site Index).

2. Materials and Methods

2.1. Data Collection and Samples

The data were obtained from 40 experimental plots (20 in chestnut coppice stands and another 20 in maritime pine plantations) established throughout the area of distribution of these species in the region of Asturias. The plots were subjectively selected to represent the different site conditions for these species in Asturias. The plots used in this study belong to the University of Oviedo (GIS-Forest Research Group) and the Forest and Wood Technology Research Centre (CETEMAS) research networks. Descriptive statistics of the trees and stands analysed are shown in Table 1. Two trees (dominant and co-dominant) were felled in each plot. The aboveground biomass was separated in situ into crown (branch and leaves or needles) and stem wood (logs with bark with a minimum thin-end diameter of 7 cm) components. The bark fraction was separated in the laboratory.
To obtain the values of the different parameters (carbon, hydrogen, nitrogen, sulphur, moisture, ash, volatile content and HHV) per tree in the maritime pine and chestnut coppice stands, the percentage of dry biomass of each fraction relative to the total biomass per tree was first determined. Aboveground biomass was separated and weighed in the field and then further separated in the laboratory into foliage (needles or leaves), twigs (diameter, d, less than 0.5 cm at the insertion), thin branches (d from 0.5 to 2 cm), thick branches (d from 2 to 7 cm), stem bark and stem wood (debarked logs with a thin-end diameter of 7 cm).
The total fresh weight of each fraction was measured in the field with a portable balance. Three disks of wood including bark were cut in each stem (from the bottom, middle and the top). The disks, together with representative composite samples of each tree component, were sampled at the same time as bulk weighing was carried out, and they were transported to the laboratory and weighed on a digital balance. The sample of branches less than 2 cm in diameter was later subdivided into twigs (diameter less than 0.5 cm), thin branches (diameter 0.5–2 cm) and foliage. Finally, the samples were oven-dried to constant weight at 65 ± 2 °C for determination of the proportion of dry matter (biomass) in each component. The dried disks were also used to calculate the dry weight ratios of wood to bark. A total of 180 samples of each species were collected (in total, 360), according to the fractions sampled (20 plots × 3 fractions × 3 samples).
For the energy crops, a total of 45 samples were collected from each of two experimental trials established on abandoned mining land (5 clones × 3 treatments × 3 samples). The experimental trials were established in 2009 (CANTIL I) and 2010 (CANTIL 2). Samples were collected in the spring of 2015 (6 years for CANTIL I and 5 for CANTIL 2) and included the most productive poplar clones (Populus x euramericana (I-214), Populus x interamericana (Beaupré), Populus x canadensis (AF2)) and willow (Salix viminalis x (S. schwerinii x S. viminalis) (clones Tordis, Olof)) and the nutrient addition treatment applied (F0: control, F1: 300 kg ha−1 N-P-K, and F2: 600 kg ha−1 N-P-K). The two experiments (CANTIL I and CANTIL II) were established following a randomized complete block design (three blocks with a total of 54 plots of area 400 m2 per experiment), in which two qualitative factors were considered: clone (three levels) and fertilization treatment (three levels).
Samples of each biomass fraction were obtained from chestnut, pine and poplar and willow in the case of the SRWC (in the latter case all samples were considered to be crown), in triplicate, and each fraction was randomly selected from each of the harvested trees. The moisture content of all samples on arrival at the laboratory was between 50 and 60%. The samples were conditioned to prevent alteration of the properties and also to aid the grinding process. The conditioning consisted of allowing the sample to dry at room temperature in a forced air convection oven (model CARBOLITE PF 800) until a moisture content of less than 15% was obtained.
In order to guarantee the homogeneity of the samples under study and correct application of the methods selected, the samples were first ground in a cutting mill (Retsch, model SM 100) and then in a planetary ball mill (Retsch, model PM 100). The ground biomass samples were then sieved, to <500 µm or <1 mm, depending on the requirements of the method used. The samples were stored in plastic bags to avoid possible contamination or loss of material.

2.2. Energy Evaluation

2.2.1. Ultimate Analysis

The carbon, hydrogen, nitrogen and sulphur concentrations (weight percent) of each biomass sample were determined in a Vario Macro CHNS elemental analyser (Elementar, Langenselbold, Germany). Approximately 50 mg of sample of particle size <500 µm was burnt in a pure oxygen atmosphere (99.995%, Air Liquide, Paris, France) and combustion gases (CO2, H2O, N2 and SO2) were measured.
The oxygen concentration (percentage) was estimated by subtracting the sum of the other four elements from 100 [29,30], as shown in Equation (1).
O = 100 ( C + H + N + S )

2.2.2. Proximate Analysis

The moisture, ash and volatile contents of the biomass samples were estimated according to ASTM standards E 871-82 [31], D 1102-84 [32] and E 872-82 [33] respectively. For all analyses, the samples were placed in porcelain crucibles and combusted in a chamber furnace (Carbolite, model CWF 11/13). Before being weighed, the samples were stored in a desiccator until they reached ambient temperature, to prevent them absorbing moisture as they cooled. For determination of the moisture content, each biomass sample was heated to 105 °C for at least 4 h until reaching constant weight. The moisture content was calculated using Equation (2).
Moisture   ( % ) =   W 0 W W S 0   100
where W0 represents the initial weight of sample and crucible together, W is the resulting dry weight of the crucible plus dry sample and WS0 the initial sample weight.
For determination of the ash content, the samples were combusted at 600 °C for at least 4 h, and the value was calculated using Equation (3):
Ash   content   ( % ) =   W a W c W d S 0   100
where Wa is the resulting weight of the crucible plus the sample waste, Wc is the weight of the empty crucible and WdS0 is the initial weight of the dried sample (after calculating moisture content).
For determination of the volatile matter content, the samples were combusted at 950 °C for 7 min, and the value was calculated using Equation (4).
Volatile   matter   ( % ) =   W v 0 W v W S 0 100 %   Moisture
where Wvo represents the initial weight of sample plus crucible with top, and Wv is the resulting weight of the crucible plus top and sample waste.
Fixed carbon may also be determined using empirical formulae, by subtracting the sum of the experimentally determined moisture, ash and volatile matter experimental contents from 100 (% mass) [34,35], as in Equation (5):
Fixed   carbon   ( % ) =   100 %   Moisture %   Ash   content %   Volatile   matter

2.2.3. High Heating Value, HHV

The HHV was estimated according to ASTM standard E-711-87 [36], by bomb calorimetry (IKA Werke C5000 calorimeter). All of the samples were tightly packed with a pressing machine to produce pellets weighing around 0.8–0.9 g. Pressed pellets were used to prevent splashing and incomplete combustion of the sample in the calorimeter. The decomposition vessel, in which both the sample pellet and ignition wire were located, was filled with oxygen (99.995%, Air Liquide) at a pressure of 30 bar to produce complete combustion. The recipient was also immersed in water so that the initial temperature of the sample was 22 °C. When complete combustion occurs, the biomass sample releases an amount of heat that is measured as the temperature difference in the calorimeter. The device was calibrated with benzoic acid pellet.
All biomass samples were analysed in triplicate to guarantee reproducibility of the method. The standard deviations were also calculated for these experimentally obtained values.

2.3. Statistical Analysis

Discriminant Analysis

We used discriminant analysis [37] to evaluate the accuracy of the classification procedure. The main objective of using this multivariate statistical technique was to describe differences between the different species and clones analysed. This enables prediction of a response variable that depends on the values of the classification variables. For this purpose, a set of discriminating functions and some related statistical parameters are calculated. The statistics indicate the significance of each of the functions and also the amount of variability explained by each. Finally, the predictions were compared with the observed outcomes. The analysis was performed using STATGRAPHICS Centurion XVI software (Statgraphics Technologies, Inc., The Plains, VA, USA).

3. Results and Discussion

We report here the descriptive statistics for the various parameters measured (moisture (Moi), ash content (Ash), volatile matter (VM), Fixed Carbon (FC), higher heating value (gross calorific value (HHV)) and, carbon (C), hydrogen (H), nitrogen (N) and sulphur (S) contents) in the different types of stands considered: chestnut coppice, adult maritime pine stands, and five high-yielding clones (3 poplar and 2 willow clones) tested as energy crops in an experimental trial in Asturias (Table 2 and Table 4). Information about the biomass or fuel properties, i.e., calorific value, ash content, volatile content, fixed carbon content, ultimate carbon and hydrogen, is essential for evaluating the potential use of this material as fuel [19,38,39].
The results of the chemical analysis are presented for the main biomass fractions (bark, crown and stem wood) (Table 2). The mean values per tree were established using the biomass distribution per tree obtained in the field samples and further separated in the laboratory (Table 3 and Table 4), with the aim of obtaining real reference values (the stand characteristics are summarised in Table 1). The biomass derived from the five clonal plantations of energy crops was directly considered as being proportional to the mean values per tree, as the stands consisted of 5- and 6-year rotations of fine material (shoots, branches and leaves).
Stem wood was the most abundant biomass fraction for both species, representing 66.89 and 66.64% of the total aboveground tree biomass for chestnut and pine and maritime pine (i.e., almost the same proportion), respectively, whereas crown biomass represented 26.48 and 20.89%, and the bark fraction showed large differences, 6.61% for chestnut and 12.46% for maritime pine (differences would be higher if tree samples with larger diameters were considered). In SRWC, all of the biomass was classified as crown material (Table 3).

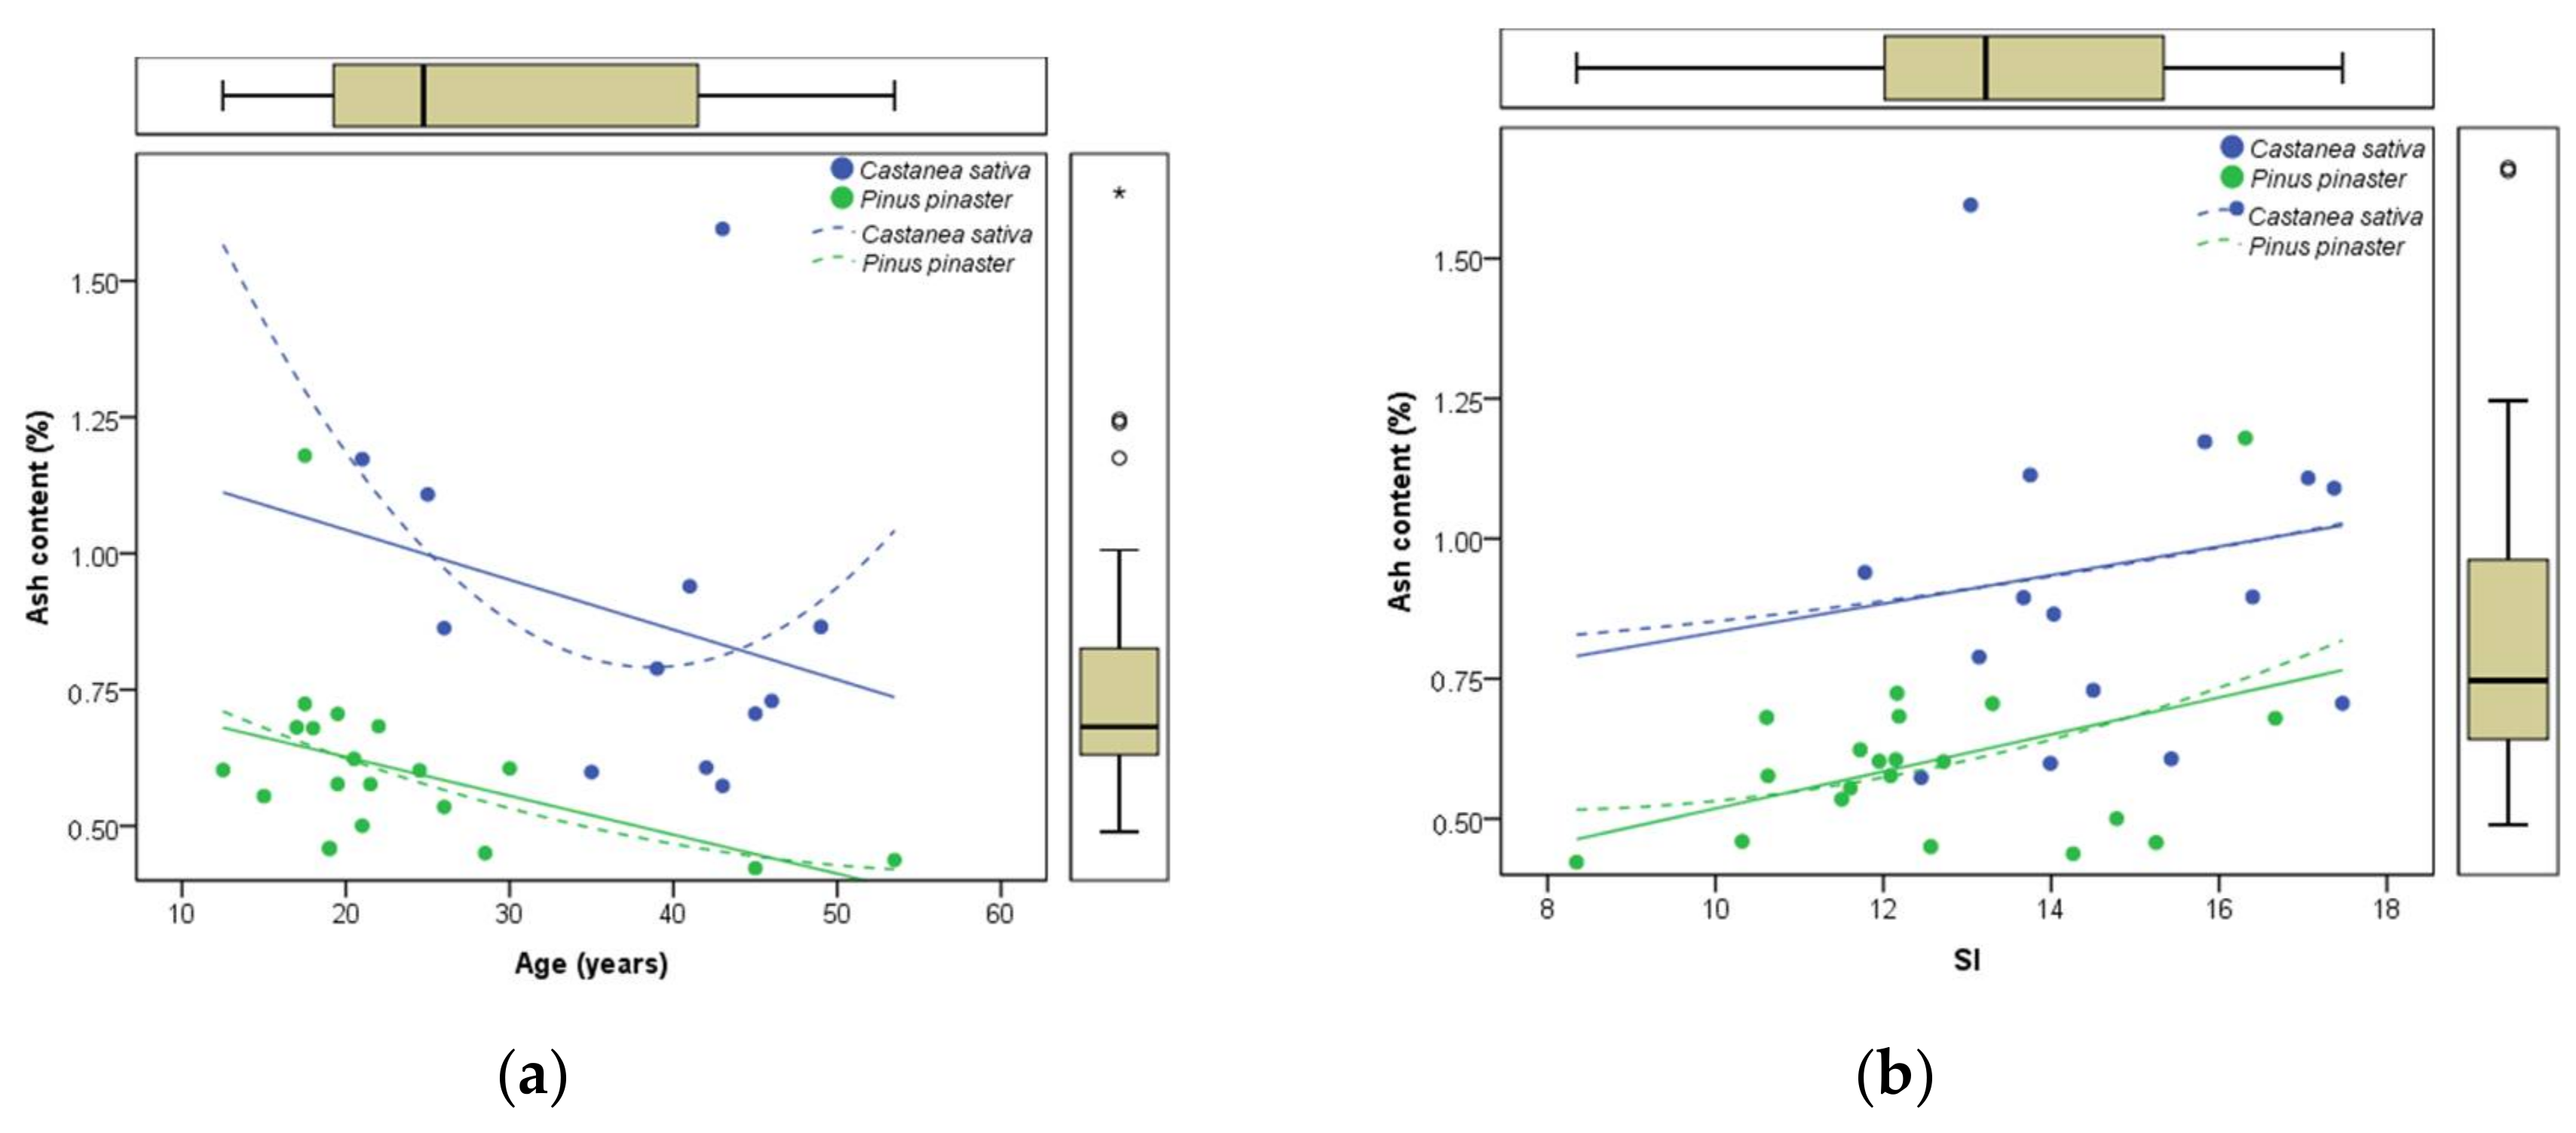
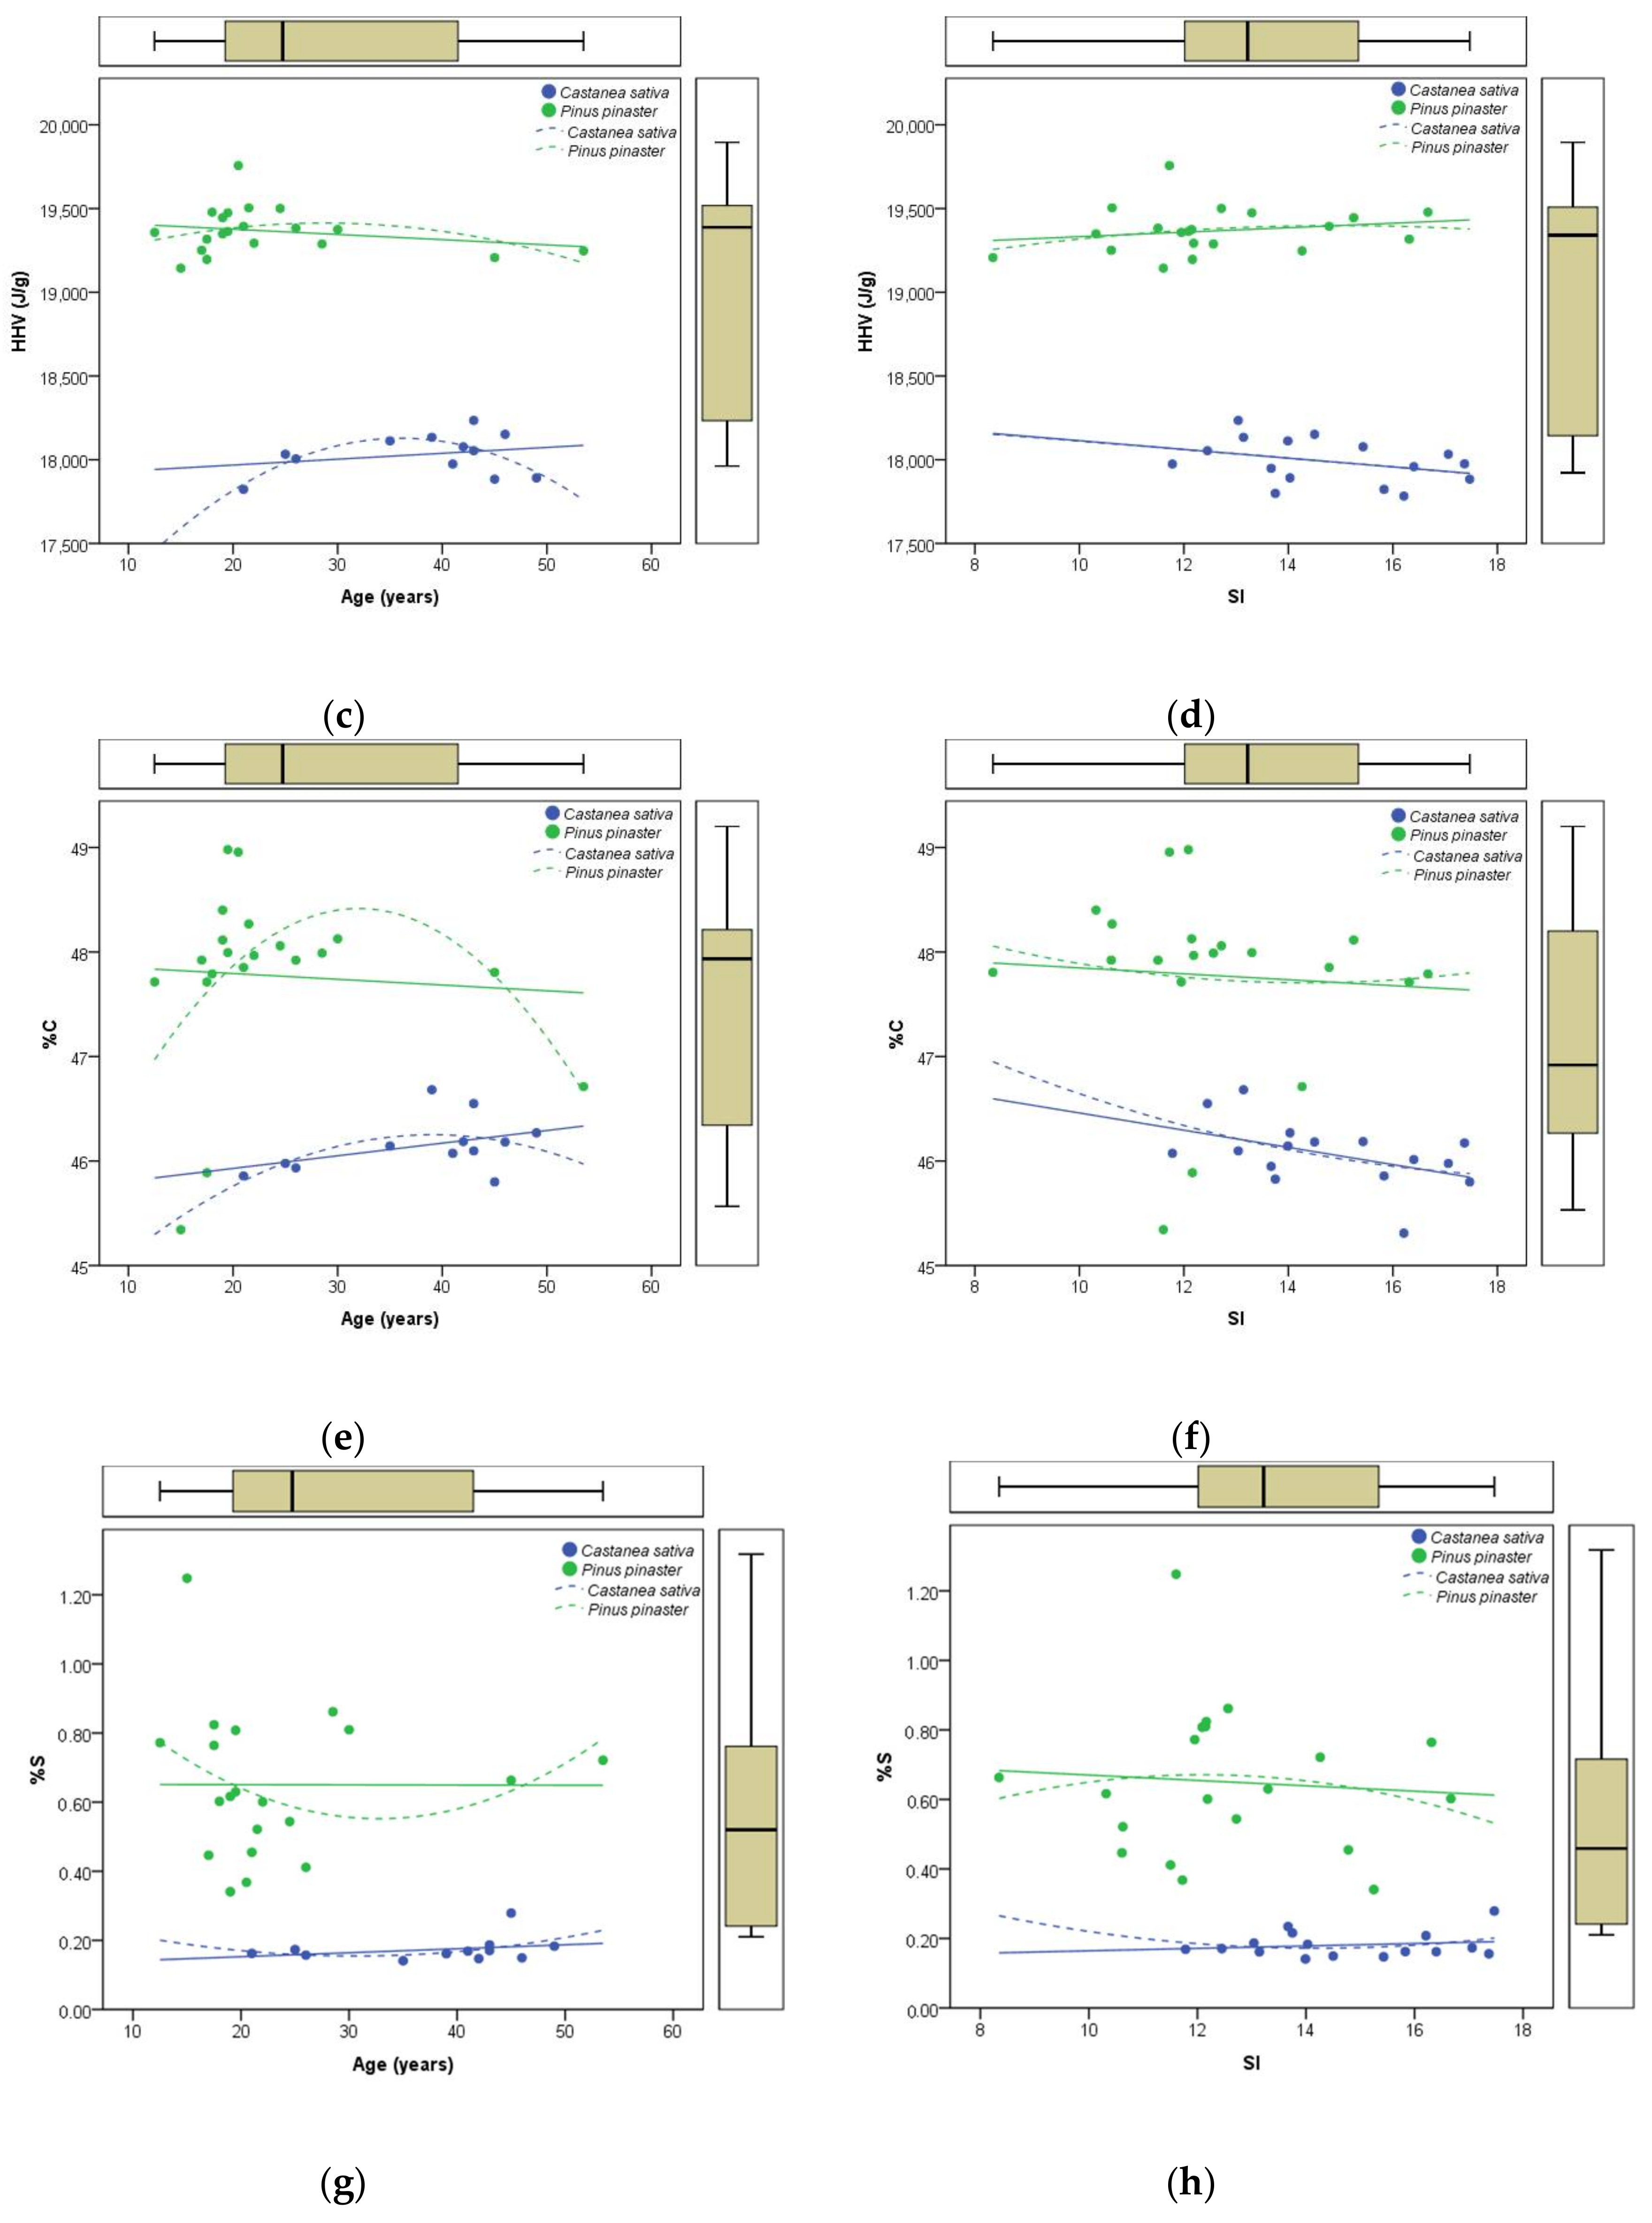
3.1. Ultimate Analysis

The results of the ultimate analysis are shown in Table 2 and Table 4. Carbon, nitrogen and oxygen are the main components of solid fuels. Carbon and oxygen react during combustion in an exothermic reaction, generating CO2 and H2O. Thus, as internal O is a part of the comburent fraction, only C contributes positively to the HHV of the fuel. The C and O contents of most of the crown biomass samples are about 43 and 50%, with a higher percentage of carbon in pine (47.34%) and a higher proportion of oxygen in chestnut (46.69%) (Table 4). Regarding the fractions analysed, the proportion of carbon in the crown and bark from pine stands was high (48.19 and 50.38% respectively) relative to those fractions from chestnut coppice stands (46.19 and 44.89%). The carbon contents of the wood fraction in these types of stands are very similar (around 46%).
One of the effects of burning biomass for energy of most concern is the atmospheric emission of sulphur dioxide (SO2), different nitrogen oxides (NOx) and to a lesser extent ammonia (NH3), which directly or indirectly affect natural ecosystems. In this respect, the S contents of the different fractions considered varied from 0.179–0.197% for chestnut coppice and from 0.610–0.802% for maritime pine. The corresponding mean values per tree (Table 4) ranged from a minimum of 0.139–0.164% for the different clones studied, to 0.185 for chestnut, or to a maximum of 0.650 for pine. In this case the Pinus pinaster biomass appeared less valuable than the chestnut biomass and biomass of the clones considered, with values below 1% [34,40,41].
The nitrogen content of the samples was lower than 1% and less than on average 0.5% per tree, although the contents in the crown fraction were high (0.613% and 0.968% for chestnut and pine respectively). Nonetheless, those values indicate that the contribution of biomass to NOx in waste gases is lower than by the air, which contributes 15–20 times more [41]. Nonetheless, for both S and N, the highest values were obtained for the crown fraction and the lowest for the stem wood fraction.
Regarding the fuel specifications and classes, which are regulated by ruling ISO 17225-1:2014 (adopted to Spanish legislation of UNE-EN ISO 17225-1 of 14 November [42]), the energetic characterization is merely informative (not linked). In the case of N, the material from the SRWC and the chestnut material would be classified as respectively N0.2 (≤0.2%), the highest level, and N1.0 (≤1.0%) an intermediate-high level. Taking into account the contribution of each fraction in the case of the chestnut and pine, we can observe that the nitrogen content of the chestnut timber is very low (N0.02); however, the bark is classified as N0.5 (≤0.5%) and the crown provides the highest levels, N1.0 (≤1.0%). The pine timber and bark would be classified as N0.5 and the crown as N1.0. For S the material would be classified in category S.010+ (>0.10%)

3.2. Proximate Analysis

Proximate analysis is the method most commonly used to characterize biofuels. The samples obtained in the present study have moisture levels below 10% [41], considered optimal for combustion processes, with mean values of around 7%. In addition, the ash content was determined in each fraction after combustion, taking into account that the quality of fuel decreases as the amount of ash in the biomass increases [19,27]. Regarding the fractions considered in the present study, the high ash content in the bark and crown fractions in chestnut (respectively 3.9% and 2.0%) contrast with the low ash content in the stem wood fraction (0.13%). However, the ash content of all fractions of Pinus pinaster was relatively low, less than 1.45% (Table 2). Nevertheless, considering the mean values per tree, the highest ash contents corresponded to the willow and poplar clones, with values between 1.17 and 2.18%, whereas for both pine and chestnut the values were below 1%. These values are similar to those reported by other authors for productive species, e.g., Kumar et al. [19] reported values of between 0.43 and 1.09% for the wood fraction in Eucalyptus hybrids, and González García et al. [43] reported a value of 0.76% for the same fraction in Eucalyptus nitens. Therefore, the high ash content in crown and bark fractions reduces their fuel quality in comparison with the wood fraction.
Another important consideration in proximate analysis, which also influences the energetic value, are the volatile materials that are released when organic substances are heated at high temperatures [41]. For the chestnut and pine fractions, the proportion of volatile substances present in the samples was fairly homogeneous, ranging between 64.83% for pine bark to 79.55% for the stem wood fraction of pine. The mean values determined per tree showed that for the SRWC crops, maritime pine and chestnut stands, the values ranged from 74–77%. The percentage values for crown and especially for bark are lower than those obtained for the stem wood fraction. Nonetheless, the values are very similar to those reported by other authors for the same fraction and with other species. Thus, Kumar et al. [19] reported values of around 80–82% for Eucalyptus hybrids, González-García et al. [34] reported a value of 80.07% for shining gum (Eucalyptus nitens H.Deane & Maiden)and García et al. [41] reported values of 65–85% for samples of different species and fractions.
In this section the fuel specifications and classes [42] were determined using the ash content as one of the classification criteria. For the material analysed in the present study, the chestnut, pine and the willow clones (Olof and Tordis) would be classified as A1.5 (≤1.5%), while the poplar clones would have a lower classification (AF2 and Boupré, A2.0 and I214, A3.0).

3.3. High Heating Value, HHV

Determination of HHV is fundamental for evaluating a substance from the point of view of its energetic value, as well as providing an idea of its flammability or its potential to generate and propagate fires. The results of the energy evaluation for the three-biomass components of chestnut coppice stands and maritime pine are shown in Table 2. Wood showed little variability in the calorific value, with mean values of 17,973 and 19,093 J g−1 respectively for chestnut coppice and maritime pine stands. The low variability in the heating value of wood is due to the great uniformity in its composition, while this is not the case for other components, such as bark and crown (leaves, branches), which are more heterogeneous [44].
For chestnut and pine, the crown fraction generated the highest calorific and energetic values, and bark and wood the lowest energetic values. Obviously, this may have direct consequences for waste management, with good opportunities for using the pruning remains from chestnuts grown for fruit and that require periodic pruning [45]. The calorific value per tree was lowest for chestnut (17,997 J/g), intermediate for the SRC crops (18,185–18,419 J/g) and highest for maritime pine (19,366 J/g).
The results obtained in this study are consistent with the trends observed by Telmo et al. [40] who reported higher HHV for different pine species than for native broadleaved or autochthonous species in northern Portugal. This is caused by the higher lignin and resin contents in coniferous species. Wood extractives such as resins, waxes, oils, tannins, and other phenolic substances also have much higher heating values than cellulose and hemicelluloses and they are more abundant in the wood of coniferous species [46]. In fact, Demirbaş [47] stated that “softwoods are considered to have greater HHVs because of their resin or extractive contents. Terpenes and resin are the two classes of extractives that significantly affect the fire behavior of lignocellulosic fuel”. Furthermore, Howard [48] calculated the higher heating value of resin as 15,000 to 16,000 Btu/lb (34,890 to 37,216 kJ/kg). In addition, we also found that the HHV values obtained for the poplar (17.3 MJ kg−1) and willow (18.7 MJ kg−1) clones grown as SRWCs were within the interval determined by McKendry [34].

3.4. Forest Stand Classification

Discriminant analysis (Figure 1a,b) shows the statistically significant differences among the forest species studied. The chemical properties and characteristics of the biomass (moisture, ash content, volatile matter, Fixed Carbon, higher heating value (gross calorific value)) of chestnut, pine, polar and willow were clearly differentiated. In the case of the poplar and willow, the differentiation was less evident for the genetic material studied (clones).
Finally, in the case of the chestnut coppice and pine, the main variables obtained in the chemical analyses were also correlated with the dasometric characteristics of the plots (age, mean diameter, density, basimetric area and site index) and no statistically significant relationship was observed (Table 5 and Figure 2). Thus, the stands cannot be classified with the data available (in relation to age, site index, etc.) regarding the chemical and energetic properties of the biomass. This is similar to the tendencies reported in other studies. For example, Dibdiakova et al. [21] found that site index (SI) was significantly related to the chemical composition, calorific power and ash content in Norway spruce. Likewise, Pérez et al. [49] obtained similar results regarding the calorific power of young and adult material of Tasmanian blue gum (Eucalyptus globulus Labill.) and E. nitens.

4. Conclusions

The main conclusion reached in the study is that analysis of biomass properties should be analysed with the main biomass fractions (stem wood, bark and crown) and mean values per tree should be provided. This will also generate information that can be used to optimize the management and use of biomass to generate energy.
The data obtained in this study also reveal that the biomass obtained in pine plantations has a high potential to generate energy, although the values obtained for the SRWC are also relatively high The values obtained for chestnut were also similar to those obtained for the clones, particularly for the crown fraction, which is often harvested in pruning treatments applied to stands destined for chestnut production or in intermediate and final timber harvests in low forest. In addition, from an environmental perspective, the crown of both chestnut and pine displayed higher concentrations of N and S, which can be considered contaminating elements.
Finally, the discriminant analysis revealed that the properties of the biomass obtained differ depending on the species and genetic material considered. On the other hand, we analysed the forest stand characteristics in chestnut coppice and pine stands, but did not find any significant relationships between the analytical parameters and the dasometric variables in the plots in which the samples were obtained. This may be positive in regard to classification of biomass destined for generating energy.

Acknowledgments

This work was funded by the TRIBIONOR Project (Reference CTQ2013-45155-R) and the coal mining company HUNOSA GROUP supported by the HUNOSA CHAIR at the University of Oviedo (Project Reference SV-17-HUNOSA-1). The authors acknowledge the helpful co-operation of Hunosa staff in this study. The TRIBIONOR Project (CTQ2013-45155-R) is funded by the National Program for Research, Development and Innovation in Society Challenges, within the framework of the National Plan for Scientific and Technical Research and Innovation 2013–2016 from the State Research Agency (Ministry of Economy, Industry and Competitiveness), co-financed with FEDER Funds. The authors gratefully acknowledge the Government of the Principality of Asturias for supporting Ana Álvarez with a fellowship within the Severo Ochoa Program.

Author Contributions

P.Á.-Á.: Wrote the paper and analyzed the data; C.P., M.B.-A. and D.F.R.P.B.: Co-wrote the paper and supervised the work; A.Á. and I.G.: Carried out the laboratory experiments; and A.C.-O., J.L.M.B.: Supervised the results and the reserch projects involved.

Conflicts of Interest

The authors declare no conflict of interest.

References

  1. Popp, J.; Lakner, Z.; Harangi-Rákos, M.; Fáric, M. The effect of bioenergy expansion: Food, energy, and environment. Renew. Sustain. Energy Rev. 2004, 32, 559–578. [Google Scholar] [CrossRef]
  2. Rodrigues, A.; Loureiro, L.; Nunes, L.J.R. Torrefaction of woody biomasses from poplar SRC and Portuguese roundwood: Properties of torrefied products. Biomass Bioenergy 2018, 108, 55–65. [Google Scholar] [CrossRef]
  3. Dale, V.H.; Kline, K.L.; Wright, L.L.; Perlack, R.D.; Downing, M.; Graham, R.L. Interactions among bioenergy feedstock choices, landscape dynamics, and land use. Ecol. Appl. 2011, 21, 1039–1054. [Google Scholar] [CrossRef] [PubMed]
  4. Ministerio de Agricultura, Alimentación y Medio Ambiente (MAGRAMA). Cuarto Inventario Forestal Nacional y Tercer Mapa Forestal de España (1:25,000); Ministerio de Agricultura, Alimentación y Medio Ambiente: Madrid, Spain, 2012.
  5. Sociedad Asturiana de Estudios Económicos e Industriales (SADEI), Anuario Estadístico de Asturias. Instituto Asturiano de Estadística; Gobierno del Principado de Asturias: Oviedo, Spain, 2017.
  6. Suárez Antuña, F. La organización de los espacios mineros de la hulla en Asturias. In Revista Electrónica de Geografía y Ciencias Sociales; Universidad de Barcelona: Barcelona, Spain, 2005. [Google Scholar]
  7. Paredes-Sánchez, J.P.; García-Elcoro, V.E.; Rosillo-Calle, F.; Xiberta-Bernat, J. Assessment of forest bioenergy potential in a coal-producing area in Asturias (Spain) and recommendations for setting up a Biomass Logistic Centre (BLC). Appl. Energy 2016, 171, 133–141. [Google Scholar] [CrossRef]
  8. Dillen, S.Y.; Djomo, S.N.; Al Afas, N.; Vanbeveren, S.; Ceulemans, R. Biomass yield and energy balance of a short-rotation coppice with multiple clones on degraded land during 16 years. Biomass Bioenergy 2013, 56, 157–165. [Google Scholar] [CrossRef]
  9. Dimitriou, I.; Rutz, D. Sustainable Short Rotation Coppice, A Handbook. Available online: http://www.srcplus.eu/images/Handbook_SRCplus.pdf (accessed on 16 March 2018).
  10. Domec, J.-C.; Ashley, E.; Fischer, M.; Noormets, A.; Boone, J.; Williamson, J.C.; King, J.S. Productivity, biomass partitioning, and energy yield of low-input short-rotation American sycamore (Platanus occidentalis L.) grown on marginal land: Effects of planting density and simulated drought. Bioenergy Res. 2017, 10, 903–914. [Google Scholar] [CrossRef]
  11. Lafleur, B.; Lalonde, O.; Labrecque, M. First-rotation performance of five short-rotation willow cultivars on different soil types and along a large climate gradient. Bioenergy Res. 2017, 10, 158–166. [Google Scholar] [CrossRef]
  12. Gandullo, J.M.; Blanco, A.; Sánchez, O.; Rubio, A.; Elena, R.; Gómez, V. Las Estaciones Ecológicas de los Castañares Españoles; Instituto Nacional de Investigación y Tecnología Agraria y Alimentaria; Ministerio de Educación y Ciencia: Madrid, Spain, 2004. [Google Scholar]
  13. Álvarez-Álvarez, P.; Afif-Khouri, E.; Cámara-Obregón, A.; Castedo-Dorado, F.; Barrio-Anta, M. Effects of foliar nutrients and environmental factors on site productivity in Pinus pinaster Ait. stands in Asturias (NW Spain). Ann. For. Sci. 2011, 68, 497–509. [Google Scholar] [CrossRef]
  14. Menéndez-Miguélez, M.; Álvarez-Álvarez, P.; Majada, J.; Canga, E. Effects of soil nutrients and environmental factors on site productivity in Castanea sativa Mill. coppice stands in NW Spain. New For. 2015, 46, 217–233. [Google Scholar] [CrossRef]
  15. Menéndez-Miguélez, M.; Canga, E.; Barrio-Anta, M.; Majada, J.; Álvarez-Álvarez, P. A three level system for estimating the biomass of Castanea sativa Mill. coppice stands in North-West Spain. For. Ecol. Manag. 2013, 291, 417–426. [Google Scholar] [CrossRef]
  16. Menéndez-Miguélez, M.; Álvarez-Álvarez, P.; Majada, J.; Canga, E. Management tools for Castanea sativa coppice stands in northwestern Spain. Bosque (Valdivia) 2016, 37, 119–133. [Google Scholar] [CrossRef]
  17. Arias-Rodil, M.; Barrio-Anta, M.; Diéguez-Aranda, U. Developing a dynamic growth model for maritime pine in Asturias (NW Spain): Comparison with nearby regions. Ann. For. Sci. 2016, 73, 297–320. [Google Scholar] [CrossRef]
  18. Castaño-Díaz, M.; Álvarez-Álvarez, P.; Tobin, B.; Nieuwenhuis, M.; Afif-Khouri, E.; Cámara-Obregón, A. Evaluation of the use of low-density LiDAR data to estimate structural attributes and biomass yield in a short-rotation willow coppice: An example in a field trial. Ann. For. Sci. 2017, 74, 16. [Google Scholar] [CrossRef]
  19. Kumar, R.; Pandey, K.K.; Chandrashekar, N.; Mohan, S. Effect of tree-age on calorific value and other fuel properties of Eucalyptus hybrid. J. For. Res. 2010, 21, 514–516. [Google Scholar] [CrossRef]
  20. Patel, B.; Gami, B. Biomass characterization and its use as solid fuel for combustion. Iran. J. Energy Environ. 2012, 3, 123–128. [Google Scholar] [CrossRef]
  21. Dibdiakova, J.; Gjølsjø, S.; Wang, L. Solid Biofuels from Forest-Fuel Specification and Quality Assurance. In Inherent properties of Norway Spruce Biomass in Some Geographical Locations in South Norway; Norwegian Institute of Forestry and Landscape: Ås, Norway, 2014. [Google Scholar]
  22. Costanza, J.K.; Abt, R.C.; McKerrow, A.J.; Collazo, J.A. Bioenergy production and forest landscape change in the southeastern United States. GCB Bioenergy 2017, 9, 924–939. [Google Scholar] [CrossRef]
  23. Warburg, C.T.; King’ondu, C.K. Energy characteristics of five indigenous tree species at Kitulangalo Forest Reserve in Morogoro, Tanzania. Int. J. Renew. Energy Res.-IJRER 2014, 4, 1078–1084. [Google Scholar]
  24. Johnson, J.M.; Coleman, M.D.; Gesch, R.; Jaradat, A.; Mitchell, R.; Reicosky, D.; Wilhelm, W.W. Biomass-bioenergy crops in the United States: A changing paradigm. Am. J. Plant Sci. Biotechnol. 2007, 1, 1–28. [Google Scholar]
  25. Gordobil, O.; Moriana, R.; Zhang, L.; Labidi, J.; Sevastyanova, O. Assesment of technical lignins for uses in biofuels and biomaterials: Structure-related properties, proximate analysis and chemical modification. Ind. Crops Prod. 2016, 83, 155–165. [Google Scholar] [CrossRef]
  26. Biomass Energy Resource Center (BERC). Biomass Energy: Efficiency, Scale, and Sustainability; Biomass Energy Resource Center: Montpelier, VT, USA, 2009. [Google Scholar]
  27. Shafizadeh, F. Basic principles of direct combustion. In Biomass Conversion Process for Energy and Fuels; Sofer, S.S., Zabrosky, O.R., Eds.; Plenum Press: New York, NY, USA, 1981; pp. 103–112. [Google Scholar]
  28. Pérez, S.; Renedo, C.; Ortiz, A.; Mañana, M.; Silió, D. Energy evaluation of the Eucalyptus globulus and the Eucalyptus nitens in the north of Spain (Cantabria). Thermochim. Acta 2006, 451, 57–64. [Google Scholar] [CrossRef]
  29. Ghetti, P.; Ricca, L.; Angelini, L. Thermal analysis of biomass and corresponding pyrolysis products. Fuel 1996, 75, 565–573. [Google Scholar] [CrossRef]
  30. Wang, G.; Zhang, J.; Shao, J.; Liu, Z.; Zhang, G.; Xu, T.; Guo, J.; Wang, H.; Xu, R.; Lin, H. Thermal behaviour and Kinetic analysis of co-combustion of waste biomass/low rank coal blends. Energy Convers. Manag. 2016, 124, 414–426. [Google Scholar] [CrossRef]
  31. ASTM International. Standard Test Method for Moisture Analysis of Particulate Wood Fuels; ASTM E 871-82; ASTM International: West Conshohocken, PA, USA, 2013. [Google Scholar]
  32. ASTM International. Standard Test Method for Ash in Wood; ASTM D 1102-84; ASTM International: West Conshohocken, PA, USA, 2007. [Google Scholar]
  33. ASTM International. Standard Test Method for Volatile Matter in the Analysis of Particulate Wood Fuels; ASTM E 872-82; ASTM International: West Conshohocken, PA, USA, 2006. [Google Scholar]
  34. McKendry, P. Energy production from biomass (part 1): Overview of biomass. Bioresour. Technol. 2002, 83, 37–46. [Google Scholar] [CrossRef]
  35. Solar, J.; de Marco, I.; Caballero, B.M.; Lopez-Urionabarrenechea, A.; Rodriguez, N.; Aguirre, I.; Adrados, A. Influence of temperature and residence time in the pyrolysis of woody biomass waste in a continuous screw reactor. Biomass Bioenergy 2016, 95, 416–423. [Google Scholar] [CrossRef]
  36. ASTM International. Standard Test Method for Gross Calorific Value of Refuse-Derived Fuel by the Bomb Calorimeter; ASTM E 711-87; ASTM International: West Conshohocken, PA, USA, 2004. [Google Scholar]
  37. Fisher, R.A. The use of multiple measurements in taxonomic problems. Ann. Eugen. 1936, 7, 179–188. [Google Scholar] [CrossRef]
  38. Nordin, A. Chemical and elemental characteristics of biomass fuels. Biomass Bioenergy 1994, 6, 339–347. [Google Scholar] [CrossRef]
  39. Dickinson, K.J.M.; Kirkpatrick, J.B. The flammability and energy content of some important plant species and fuel components in the forests of southeastern Tasmania. J. Biogeogr. 1985, 12, 121–134. [Google Scholar] [CrossRef]
  40. Telmo, C.; Lousada, J.; Moreira, N. Proximate analysis, backwards stepwise regression between gross calorific value, ultimate and chemical analysis of wood. Bioresour. Technol. 2010, 101, 3808–3815. [Google Scholar] [CrossRef] [PubMed]
  41. García, R.; Pizaro, C.; Lavín, A.G.; Bueno, J.J. Characterization of Spanish biomass wastes for energy use. Bioresour. Technol. 2012, 103, 249–258. [Google Scholar] [CrossRef] [PubMed]
  42. International Organization for Standardization. Solid Biofuels-Fuel Specifications and Classes-Part 1: General Requirements (ISO 17225-1:2014), AENOR; UNE-EN ISO 17225-1:2014; ISO: Geneva, Switzerland, 2014. [Google Scholar]
  43. González-García, M.; Hevia, A.; Majada, J.; Rubiera, F.; Barrio-Anta, M. Nutritional, carbon and energy evaluation of Eucalyptus nitens short rotation bioenergy plantations in northwestern Spain. iForest 2015, 9, 303–310. [Google Scholar] [CrossRef]
  44. Sims, R.E.H.; Senelwa, K.; Maiava, T.; Bullock, B.T. Eucalyptus species for biomass energy in New Zealand—Part II: Coppice performance. Biomass Bioenergy 1999, 17, 333–343. [Google Scholar] [CrossRef]
  45. Nati, C.; Montorselli, N.B.; Olmi, R. Wood biomass recovery from chestnut orchards: Results from a case study. Agrofor. Syst. 2016. [Google Scholar] [CrossRef]
  46. Francescato, V.; Antonini, E.; Bergomi, L.Z. Wood Fuels Handbook. AIEL-Italian Agroforestry Energy Association, Agripolis; Food and Agriculture Organization: Rome, Italy, 2008; p. 83. [Google Scholar]
  47. Demirbaş, A. Relationship between lignin contents and heating values of biomass. Energy Convers. Manag. 2001, 42, 183–188. [Google Scholar] [CrossRef]
  48. Howard, E.T. Heat of combustion of various southern pine materials. Wood Sci. 1973, 5, 194–197. [Google Scholar]
  49. Pérez, S.; Renedo, C.J.; Ortiz, A.; Delgado, F.; Fernández, I. Energy potential of native shrub species in northern Spain. Renew. Energy 2014, 62, 79–83. [Google Scholar] [CrossRef]
Figure 1. Plots of Canonical Discriminant Functions. (a) Figure for each species (Group centroid: 1: Maritime pine; 2: Chestnut; 3: Poplar; 4: Willow) (b) Figure for each species and clone (Group centroid: 1: Maritime pine; 2: Chestnut; 3: Poplar-I214; 4: Poplar-AF2; 5: Poplar-Boupré; 6: Willow-Tordis; 7: Willow-Olof). Note: based on the values of other quantitative variables (moisture, ash content, volatile matter, Fixed Carbon, higher heating value (gross calorific value)).
Forests 09 00160 g001
Figure 2. Regression Relationships Plots for Ash content, HHV, Carbon and Sulphur with respect to Age and Site Index (SI). (a) Age-Ash content (b) SI-Ash content (c) Age-HHV (d) SI-HHV (e) Age-%C (f) SI-%C (g) Age-%S (h) SI-%S. Note: Solid line, linear fit; dashed line, quadratic fit.
Forests 09 00160 g002aForests 09 00160 g002b
Table 1. Descriptive statistics for the forest stands evaluated in the study.
Species NnstooldnGHoSIAge
Chestnut coppiceMinimum410.2651.00012.73016.47512.15711.78021.000
(Castanea sativa)Maximum4229.9758.00024.750104.19925.01417.47049.000
Mean1781.6992.48718.39539.63318.11914.75737.917
Std. Deviation1009.7761.8873.65819.2193.4171.8089.150
Maritime pineMinimum466.667---10.36814.6337.4008.34412.500
(Pinus pinaster)Maximum2075.000---36.96076.24927.30016.67053.500
Mean1178.417---19.42734.91513.79512.55623.350
Std. Deviation407.692---7.09017.0154.3332.0619.916
BeapréMinimum9382.6751.0008.1000.0071.250---5.000
(Populus x interamericana )Maximum18,765.3502.0000.10048.34910.400---5.000
Mean10,296.0331.0973.30110.7704.911---5.000
Std. Deviation2787.4530.2971.93311.5252.107---0.000
AF2Minimum9382.6751.0000.7200.3822.000---6.000
(Populus x canadensis )Maximum28,148.0253.00011.56098.47610.600---6.000
Mean11,259.2101.2005.37625.3976.716---6.000
Std. Deviation4266.1940.4552.36919.8311.899---0.000
I-214Minimum9382.6751.0000.3800.1061.390---6.000
(Populus x euramericana )Maximum37,530.7004.0005.04018.71910.000---6.000
Mean12,025.6821.2822.3645.1394.295---6.000
Std. Deviation5060.9570.5391.1844.6851.714---0.000
OlofMinimum9.382.6751.0000.2000.0291.300---6.000
(Salix viminalis x (S. schwerinii x S. viminalis))Maximum37,530.7004.0007.63042.90111.100---6.000
Mean15,235.2351.6242.7046.4555.744---6.000
Std. Deviation6.464.2230.6891.2055.7862.247---0.000
TordisMinimum9382.6751.0000.6900.3511.800---6.000
((Salix viminalis x (S. schwerinii x S. Viminalis))Maximum37,530.7004.0005.27020.46610.000---6.000
Mean18,920.8642.0172.8236.3775.982---6.000
Std. Deviation6885.9670.7340.8273.5531.479---0.000
Note: N: stocking density (stems or trees/ha); nstool: shoots per stool; dn: diameter at breast height (cm); G: basal area (m2/ha); Ho: dominant height (m); SI: Site Index. * The Short-Rotation Coppices (SRC) were measured in 2013 (CANTIL I) and 2015 (CANTIL II).
Table 2. Results of proximate, calorimetry and ultimate analysis per biomass fraction for chestnut and maritime pine.
Species Proximate AnalysisCalorimetryUltimate Analysis
%Moi.%Ash%VM%FCHHV (J/g)%C%H%S%N%O
Chestnut (C. sativa)Crown (%)Minimum3.5771.33371.19317.25718,051.33345.5806.1680.1630.19545.160
Maximun8.1793.14876.37919.97618,680.66746.9106.4480.3481.28847.505
Mean6.2092.01673.41018.36618,261.56746.1936.3100.1970.61346.687
Std. Deviation1.1500.4751.4650.779146.3090.3510.0770.0480.2550.509
Bark (%)Minimum3.7712.51554.98315.60516,358.66743.4305.7690.1330.18547.183
Maximun10.5935.71573.20835.57518,287.66745.7806.3530.3530.61750.085
Mean7.7673.97966.90921.18717,180.88344.8905.9940.1840.35348.579
Std. Deviation1.5400.9293.6503.772452.6160.6420.1310.0460.1030.721
Wood (%)Minimum2.5830.06264.04614.42217,779.33345.4405.9600.1340.08646.671
Maximun7.5010.30381.49220.90818,202.66746.8406.3220.3880.15748.087
Mean5.8000.13176.08017.44917,973.21746.0816.1590.1790.10847.473
Std. Deviation1.3130.0563.6801.556119.4090.3160.0980.0680.0160.314
Maritime pine (P. pinaster)Crown (%)Minimum5.1101.15272.27117.15119,435.00046.1605.9100.3660.48041.468
Maximun7.7112.04475.86119.27720,375.33349.9106.6991.4183.08344.278
Mean6.2881.44773.92418.34119,964.83348.7056.4330.8020.96843.092
Std. Deviation0.6520.2121.0390.649229.7570.8410.1920.4040.6070.902
Bark (%)Minimum6.6070.48262.88822.09319,351.33348.4405.4770.3340.20841.141
Maximun8.9885.81766.80227.71620,580.00051.9306.0921.4121.28044.257
Mean7.8610.97164.83426.33319,838.36750.3855.8620.6560.39542.701
Std. Deviation0.7211.1601.1321.283321.0280.8960.1780.3200.2980.815
Wood (%)Minimum6.1190.18278.19510.56018,843.66744.3005.8370.3010.14743.989
Maximun8.6540.35381.46813.94119,554.00048.8206.4601.1932.46647.565
Mean7.0010.27279.55213.24319,093.25046.9786.2770.6100.43945.695
Std. Deviation0.6280.0380.7590.731163.4921.0580.1510.2110.6060.667
Note: Moi, moisture; Ash, ash content; VM, volatile matter; FC, Fixed Carbon; HHV, higher heating value (gross calorific value).
Table 3. Biomass distribution statistics per tree (%) for chestnut and maritime pine.
SpeciesDescriptive StatisticsBiomass Fraction
Wood (%)Bark (%)Crown (%)
ChestnutMinimum16,29822678345
Maximum83,95110,40381,433
Mean66,898661426,487
Std. Deviation12,262163113,162
Maritime pineMinimum57,257850511,085
Maximum76,00017,89533,626
Mean66,64112,46720,891
Std. Deviation511821555601
SRWCTotal------100.000
Note: SRWC, short rotation woody crops.
Table 4. Results of proximate, calorimetry and ultimate analysis per tree for seven tree species.
Proximate AnalysisCalorimetryUltimate Analysis
SpeciesClone Moi.%Ash%VM%FC%HHV (J/g)%C%H%S%N%O
WillowOlofMinimum6.0741.01675.93215.63718,368.66745.2206.3630.1420.13947.651
Maximum6.9011.26777.03115.92618,539.33345.6506.3780.1940.17948.066
Mean6.4061.17476.66215.75718,458.00045.3876.3730.1620.16347.915
Std. Deviation0.4370.1380.6320.15185.6140.2310.0080.0280.0210.230
TordisMinimum6.7941.12075.04215.82618,157.00045.3136.3400.1290.15047.645
Maximum7.4241.25075.86417.00118,511.66745.6136.3680.2110.25348.027
Mean7.1061.19375.33016.37018,318.77845.4926.3580.1630.18947.797
Std. Deviation0.3150.0670.4630.592179.3680.1580.0150.0430.0560.202
PoplarI214Minimum6.2032.10275.56015.26218,132.66745.0006.2340.1400.11848.252
Maximum6.6652.23676.34115.53818,250.00045.2036.2880.1820.19248.380
Mean6.4502.17775.98515.38818,185.00045.1066.2590.1640.14648.326
Std. Deviation0.2330.0680.3950.14059.6830.1020.0270.0220.0400.066
AF2Minimum5.7871.52175.92314.69718,396.33345.4936.2510.1380.12547.779
Maximum6.3751.91177.40716.25818,446.00045.6506.2740.1560.17347.933
Mean6.0231.70476.90415.36918,419.66745.5786.2610.1480.15347.861
Std. Deviation0.3100.1960.8490.80324.9690.0790.0110.0090.0250.077
BeaupréMinimum5.5571.81975.52614.77818,277.00045.4736.2810.1380.10847.318
Maximum7.1171.90277.51515.72418,560.66746.1306.3810.1410.11247.961
Mean6.1871.85976.63415.31918,386.11145.7046.3210.1390.11047.725
Std. Deviation0.8220.0411.0140.488152.7380.3690.0530.0020.0020.354
Chestnut Minimum3.0330.57367.92615.66117,782.88445.3096.0430.1400.11546.802
Maximum7.9501.59478.73223.01618,234.77946.6816.3220.3340.44647.937
Mean6.0660.92074.71818.29417,997.54946.0396.1840.185 0.24547.345
Std. Deviation1.1740.2892.2301.461127.4730.2840.0730.0480.1020.271
Maritime Pine Minimum6.1860.42275.43213.49519,143.67345.3435.8060.3410.18743.523
Maximum8.2161.17978.23216.62119,756.89248.9806.4201.2482.28346.329
Mean6.9470.60276.57515.97519,366.27747.7756.2600.6500.49444.820
Std. Deviation0.5670.1650.7220.677138.9180.8560.1510.2130.5230.568
Note: Moi., moisture; Ash, ash content; VM, volatile matter; FC, Fixed Carbon; HHV, higher heating value (gross calorific value).
Table 5. Pearson correlations among proximate, calorimetry and ultimate variables with dasometric variables for chestnut (Castanea sativa) and maritime pine (Pinus pinaster).
Species Moi. (%)Ash (%)VM (%)FC (%)HHV (J/g)%C%H%S%N%O
Chestnut (C. sativa)AgeCorrelation0.519−0.284−0.061−0.2890.2630.423−0.0170.293−0.363−0.289
Sig. (2-tailed)0.0840.3720.8510.3620.4090.1700.9590.3550.2460.362
N16161616161616161616
dnCorrelation0.491−0.445−0.160−0.070−0.1410.022−0.3640.513−0.4310.184
Sig. (2-tailed)0.1050.1470.6190.8280.6630.9450.2440.0880.1620.567
N16161616161616161616
NCorrelation−0.5060.4080.462−0.387−0.135−0.2350.388−0.2580.2760.093
Sig. (2-tailed)0.0380.1040.0620.1250.6060.3640.1240.3170.2830.721
N17171717171717171717
GCorrelation0.015−0.3670.071−0.0510.085−0.036−0.3170.421−0.2950.164
Sig. (2-tailed)0.9530.1480.7880.8470.7470.8920.2160.0920.2510.529
N17171717171717171717
SICorrelation−0.0040.1470.009−0.041−0.354−0.475−0.1670.1730.3020.425
Sig. (2-tailed)0.9870.5860.9740.8810.1780.0630.5360.5220.2560.100
N16161616161616161616
Maritime pine (P. pinaster)AgeCorrelation−0.314−0.4280.2480.103−0.223−0.062−0.173−0.0020.175−0.018
Sig. (2-tailed)0.1780.0600.2930.6650.3450.7940.4660.9920.4610.940
N20202020202020202020
dnCorrelation−0.320−0.4110.328−0.019−0.021−0.011−0.221−0.2200.0820.083
Sig. (2-tailed)0.1690.0720.1580.9370.9290.9630.3490.3520.7310.728
N20202020202020202020
NCorrelation0.1270.311−0.2370.070−0.227−0.0010.0120.075−0.1380.097
Sig. (2-tailed)0.5940.1810.3150.7690.3350.9980.9590.7530.5610.685
N20202020202020202020
GCorrelation−0.167−0.2160.1800.001−0.0910.039−0.230−0.0680.079−0.047
Sig. (2-tailed)0.4810.3600.4480.9960.7020.8690.3300.7760.7420.845
N20202020202020202020
SICorrelation0.2030.4120.114−0.3920.199−0.066−0.041−0.0750.0660.081
Sig. (2-tailed)0.3900.0710.6320.0870.4000.7810.8640.7540.7820.736
N20202020202020202020
Note: ** Correlation is significant at the 0.01 level (2-tailed). * Correlation is significant at the 0.05 level (2-tailed). dn: diameter at breast height (cm); N: stocking density (stems or trees/ha); G: basal area (m2/ha); SI: Site Index.

