Article

Biochar Can Be a Suitable Replacement for Sphagnum Peat in Nursery Production of Pinus ponderosa Seedlings

by
R. Kasten Dumroese
1,*,
Jeremiah R. Pinto
1,
Juha Heiskanen
2,
Arja Tervahauta
3,
Katherine G. McBurney
1,
Deborah S. Page-Dumroese
1 and
Karl Englund
4
1
U.S. Department of Agriculture Forest Service, Rocky Mountain Research Station, 1221 South Main Street, Moscow, ID 83843, USA
2
Natural Resources Institute Finland, Soil Ecosystems, Neulaniementie 5, FI-70210 Kuopio, Finland
3
Natural Resources Institute Finland, Soil Ecosystems, Latokartanonkaari 9, FI-00790 Helsinki, Finland
4
Composite Materials & Engineering Center, Washington State University, Pullman, WA 99164-2262, USA
*
Author to whom correspondence should be addressed.
Forests 2018, 9(5), 232; https://doi.org/10.3390/f9050232
Submission received: 27 March 2018 / Revised: 20 April 2018 / Accepted: 24 April 2018 / Published: 27 April 2018
(This article belongs to the Special Issue Seedling Production and Field Performance of Seedlings)

Abstract

:
We replaced a control peat medium with up to 75% biochar on a volumetric basis in three different forms (powder, BC; pyrolyzed softwood pellets, PP; composite wood-biochar pellets, WP), and under two supplies of nitrogen fertilizer (20 or 80 mg N) subsequently grew seedlings with a comparable morphology to the control. Using gravimetric methods to determine irrigation frequency and exponential fertilization to ensure all treatments received the same amount of N at a given point in the growing cycle, we successfully replaced peat with 25% BC and up to 50% PP. Increasing the proportion of biochar in the media significantly increased pH and bulk density and reduced effective cation exchange capacity and air-filled porosity, although none of these variables was consistent with resultant seedling growth. Adherence to gravimetric values for irrigation at an 80% water mass threshold in the container revealed that the addition of BC and WP, but not PP, required adjustments to the irrigation schedule. For future studies, we encourage researchers to provide more details about bulk density, porosity, and irrigation regime to improve the potential inference provided by this line of biochar and growing media work.

1. Introduction

Deforestation is a global crisis [1,2,3]. As Haase and Davis [4] note, mitigating deforestation and other forms of forest degradation often requires active afforestation and reforestation, especially the outplanting of seedlings grown in nurseries. In addition, the practice of reforestation is recognized as having, among management options relying on natural pathways, the greatest potential to mitigate changes in climate [5]. Growing seedlings for reforestation in nurseries using containers is a common practice worldwide, and a prominent method in, for example, Canada, Finland, Chile, and other countries with intensive forest management activities.
While producing reforestation seedlings efficiently and economically has long been the prevailing practice, a conundrum for nursery managers is how to do so while reducing impacts to the environment. Recently, several techniques have emerged to diminish the environmental impacts of seedling production. For example, reducing irrigation needs through sub-irrigation [6,7] and efficiently applying nutrients through controlled-release fertilizer [8] or exponential fertilization [9] can reduce runoff and potential negative impacts on ground and surface water [10,11,12]. Using light-emitting diodes rather than more traditional energy-consuming light sources works well [13,14,15]. In addition, employing more sustainable organic materials to grow reforestation seedlings, such as coir [16], sawdust [17], compost [18], or composted wood bark [19] are gaining interest as growing media because they are perceived as a way to avoid issues (e.g., reduced biodiversity, increased carbon emissions) associated with traditional Sphagnum peat moss harvesting [20,21]. Moreover, local alternatives for some inorganic components of growing media, such as vermiculite or perlite that are mined and often shipped great distances, are also being sought, especially given that the costs of some commonly used amendments, such as vermiculite, continue to climb [22].
One alternative to inorganic and organic constituents in growing media for container plants is biochar. Biochar is a carbon-rich byproduct consisting of the fine-granular material remaining after pyrolysis, the process of combusting a biomass feedstock rapidly in the absence of oxygen [23]. In general, biochar properties appear conducive to plant growth in container nursery systems [24], and have shown promising potential as a replacement for peat [21,25,26,27] and inorganic components of media [24,28,29] in the production of container crops, including forest trees. In addition to its role as a suitable component of growing media, biochar can also provide the extra benefit of sequestering carbon (C) belowground; in addition to C storage, buried C provides enumerable ecosystem benefits through the enhancement of many biogeochemical processes [30]. As noted by Dumroese et al. [24], incorporating biochar into the growing medium becomes part of the seedling root plug, and therefore most of the expense of the transportation and burial of the carbon, a significant hindrance in many agricultural and forest situations [31,32], is already included in the overall cost of outplanting seedlings.
We previously described the potential of using pelleted biochar to grow seedlings in containers, suggesting that pelletizing biochar may be a means to avoid both the nuisance dust associated with it and its non-uniform distribution in small-volume containers typical of reforestation seedlings [24]. Our primary study objective was to evaluate different modes of biochar delivery to amend and replace Sphagnum peat moss in the production of nursery plants in containers. Therefore, we report on the growth of ponderosa pine (Pinus ponderosa) seedlings grown with three types of biochar (fine biochar powder, pelletized fine biochar powder as described in Dumroese et al. [24], and pyrolyzed softwood pellets) under two different supplies of nitrogen.

2. Materials and Methods

To satisfy the objectives, we grew Pinus ponderosa seedlings (Lolo National Forest, MT, USA, 730 m elevation) at the U.S. Department of Agriculture Forest Service, Rocky Mountain Research Station in Moscow, ID, USA (lat 46.723179, long -117.002753) in various mixtures of Sphagnum peat (peat) amended with either fine biochar powder, composite wood-biochar pellets, or pyrolyzed softwood pellets.

2.1. Media Components and Analysis of Individual Medium

The peat was a fine-textured, non-fertilized horticultural grade without a wetting agent (Sunshine grower grade green, Sun Gro Horticulture Ltd., Vancouver, BC, Canada). Biochar powder (BC) was created as a byproduct of fast pyrolysis that was produced from 1 to 2 mm particles of cellulosic biomass from mixed hardwood residues with <10% moisture, pyrolyzed at 450 to 500 °C (C-Quest biochar, Dynamotive Energy Systems Corp., Richmond, BC, Canada), and with 69% C content, 9% ash, and 2.8 m2 g−1 surface area [33]. Composite wood–biochar pellets (WP) were produced at the Composite Materials and Engineering Center (Washington State University, Pullman, WA, USA) by dry blending 43% BC, 43% finely-ground Pinus strobus wood flour, 7% polylactic acid, and 7% wheat starch in a ribbon mixer and feeding that into a 75 kW (100 hp) commercial pellet mill fitted with a parabolic entry die with an overall length of 63.5 mm. The mill extruded random length (4 to 25 mm) pellets with an output diameter of 5.4 mm (see [24] for additional detail on material specifications and pellet output). Pyrolyzed pellets (PP) were the result of wood pellets (6 mm diameter; 5 to 15 mm length) comprised primarily of Pseudotsuga menziesii and Tsuga heterophylla that were pyrolyzed at 500 °C for 10 min (Sonofresco, Burlington, WA, USA). By hand and on a volume basis (0, 25, 50, 75, and 100%), we combined peat with BC, WP, or PP to form 13 distinct growing media (Table 1). All chemical and physical assessments were conducted at the Natural Resources Institute Finland (LUKE) facilities in Vantaa and Suonenjoki, respectively.

2.1.1. Physical Properties

The particle size distribution for individual media components (peat, BC, WP, and PP) was measured using a series of sieves (0.5 to 5 mm; n = 3). We determined bulk density as the ratio of dry mass (dried at 105 °C) to saturated volume (n = 5) [34]. Particle density was estimated using an average density of 2.65 g cm−3 for mineral and 1.5 g cm−3 for organic components [34,35]. Loss-on-ignition at 550 °C for 2 h provided an approximate estimate of the organic matter for each growing medium (n = 5) [36]. We measured the water uptake and volume change of the growing media directly from the bag using metal cylinders (height 60 mm, diameter 58 mm) filled with each media; cylinders were placed into water kept 5 to 10 mm deep (n = 3) [24]. Volumetric water content (VWC) at decreasing matric potentials (i.e., desorption water retention characteristics) was measured using a pressure plate apparatus (Soilmoisture Equipment Corp., Santa Barbara, CA, USA) and standard methods [37,38]—similar metal cylinders were filled with each growing media, saturated, allowed to drain freely (to about −0.3 kPa), and then exposed to successive matric potentials of −1, −5, and −10 kPa (n = 5). Water content was reassessed gravimetrically at each matric potential. Our initial suction was 1 kPa because this value reflects the “container capacity”, the upper limit of plant available water retained in the container following saturation and subsequent free draining of the medium [39,40].
Total porosity (TP) was estimated using:
TP = (Dp − Db)/Dp
where Dp is the particle density of the material and Db is the bulk density.
Air-filled porosity (AFP) was estimated using:
AFP = TP − VWC
where VWC is the volumetric water content at −1 kPa matric potential, assumed to be container capacity.
Unsaturated hydraulic conductivity was measured using an automated evaporation ku-pF apparatus (UGT GmbH, Müncheberg, Germany), where sample cylinders (n = 2) were sealed on the bottom and the top of the core was allowed to evaporate at room temperature [41,42]. Cylinders were measured every 10 min with moisture tensiometers.

2.1.2. Chemical Properties

Our measurements of total, soluble, and press water nutrient concentrations, as well as effective cation exchange capacity, were replicated 5 times. We measured total C and nitrogen (N) from sieved and air-dried samples on a CHN analyzer (LECO-1000, LECO Corp., St. Joseph, MI, USA). Samples for other elements were digested by the closed wet HNO3-HCl digestion method in a microwave (CEM MDS-2000; CEM Corp., Matthews, NC, USA) and the extract was analyzed on an iCAP 6500 Duo ICP-emission spectrometer (Thermo Scientific Ltd., Cambridge, UK).
To assess soluble nutrients, we wetted samples of each medium and allowed them to incubate for 1, 15, or 29 days at room temperature to see how amounts of soluble nutrients change over time, especially N forms (see [24]). To mimic the wetting and drying cycles found under normal nursery cultural practices, we remoistened the samples about twice each week. For each sample date, acid ammonium acetate (pH 4.65) was used to gather soluble cations and easily soluble phosphorus (P). We quantified the cations in the filtrate using the previously described ICP-emission spectrometer. Soil ammonium (NH4-N), nitrate (NO3-N), and total N were determined from a KCl-extract on a FIA-analyzer (Lachat QuickChem 8000, Lachat Instruments, Milwaukee, WI, USA). Using a microwave (CEM MDS-2000 described above), we used the hot water refluxing method to extract easily soluble boron [43], quantified using the previously described ICP-emission spectrometer.
For cation exchange capacity, substrates were prepared as described for soluble nutrients. We used a 0.1 M BaCl2 solution to extract exchangeable cations, and their total concentrations in the filtrate were determined using the previously described ICP-emission spectrometer. To determine exchangeable acidity, the 0.1 M BaCl2 extract was titrated with a 0.05 M NaOH solution up to pH 7.8. Effective cation exchange capacity [ECEC(cmol∙kg−1)] was then calculated using:
ECEC(cmol∙kg−1) = Na(cmol∙kg−1) + K(cmol∙kg−1) + Ca(cmol∙kg−1) + Mg(cmol∙kg−1) +
ACI_E(cmol∙kg−1)
where ACI_E is exchangeable acidity from BaCl2 extract. Percentage base saturation was calculated as the sum of the bases (Na, K, Ca, Mg) divided by ECEC.
To determine the nutrients in a press water extract after the incubation periods described above, we pressed each growing media sample in a custom apparatus consisting of a cylindrical chamber and a vertical piston that, when deployed, delivered a constant 300 kPa pressure. The resulting extracts were measured for pH and electrical conductivity, filtered, and analyzed for dissolved micro and macro elements on the previously described spectrometer. Concentrations of dissolved NH4-N, NO3-N, and dissolved total N were determined on the FIA-analyzer described above. Because our analysis of NO3-N included NO2-N, we estimated organic N (ON) using:
ON = Ntotal − NH4-N − NO3-N.

2.2. Seedling Culture

Our original study plan only included peat, BC, and WP; these were tested the first year. As we had the opportunity to obtain PP, we repeated the experiment the second year but limited the treatments to peat and PP because of limited resources. In neither year were seedlings grown in media comprised of 100% BC, PP, or WP.

2.2.1. Year One

In early April (Julian dates 98 and 99, hereafter Julian), each medium was hand loaded into 3 trays that each held 98 Ray Leach SC-10 Super “Cone-tainers”™ (hereafter, cell; each 3.8 cm diameter, 21 cm depth, 164 ml, 528 seedlings m−2) and irrigated to container capacity. On Julian 111, three seeds were sown per cell. After germination (Julian 127), germinants were thinned to one per cell and 240 individual cells from each medium were evenly dispersed across eight trays to faciliate irrigation and fertigation (irrigation with soluble fertilizer added). Subsequently, four trays (120 seedlings) were randomly assigned to each of two soluble N treatments: 20 (low N) or 80 (based on a typical rate [17]) mg N seedling−1 for the growing season. Daytime greenhouse temperatures ranged from 21 to 29 °C and nighttime low temperatures were kept above 16 °C.
To avoid confounding N application and irrigation, we used exponential fertilization [17] and determined the irrigation frequency and amount gravimetrically [44]. The basic exponential fertilization equation was:
NT = NS × (ert − 1)
where r is the relative addition rate required to increase NS (initial level of N in plant) and NT is the desired amount to be added during t, the number of fertilizer applications [45]. For both N rates, t = 150 (the number of days between the first and last fertigation during the growing season) and NS was assumed to be 0.5 mg N. For the NT = 80 mg N treatment, r = 0.03388 whereas for NT = 20, r = 0.02476. The amount to apply on a specific day was calculated using:
NT = NS × (ert − 1) − Nt−1
where NT is the amount of N to apply daily, Nt−1 is the cumulative amount of N applied, and t goes from 1 to 150. For each application, we custom-blended fertilizers, including micronutrients (Peters Professional® S.T.E.M.™. The Scotts Company, Marysville, OH, USA) and chelated Fe (Sprint 330; 10% Fe; Becker Underwood, Inc., Ames, IA, USA) to achieve these nutrient ratios: 100N (54NO3: 46NH4+): 90P: 109K: 68S: 33Mg: 3Fe: 0.3Cu: 0.3Mn: 0.7Zn: 0.2B: 0.006Mo.
For gravimetric water content, we determined the average mass of an empty tray, 30 empty cells, and their oven-dry growing medium (60 °C for 72 h). On Julian 102, each tray was weighed approximately 60 min after watering to container capacity; the mass of the container at container capacity minus the container and media mass equaled the mass of the water. Between Julian 103 and 131, cells were weighed daily at 0800 and irrigated when the water mass reached a threshold of 80% (±5 percentage points) of the water mass at container capacity [44]. Container capacity mass was recalculated monthly to adjust for media shrinkage and plant biomass. Beginning on Julian 131, seedlings were fertilized during each irrigation (fertigation). The necessary amount of fertilizer (cumulative daily amounts since the prior irrigation) was diluted in the calculated amount of water required to recharge the medium to container capacity. Fertigation solutions were carefully applied by hand to individual seedlings to ensure an even distribution of nutrients and minimize leaching. From the end of the fertigation period (early October; Julian 281) until harvest, seedlings were irrigated when the water mass reached 75% (±5 percentage points). Fourteen days after the last fertigation, greenhouse temperatures were allowed to go ambient but above freezing (4 to 10 (day)/2 to 4 °C (night)).
Eight randomly-selected seedlings (two from each tray) from each medium × fertilizer combination were sampled on Julian 328. We measured height and stem diameter at the root collar (RCD). Shoots were separated from roots, roots were gently washed free of media, and roots and shoots were dried 72 h at 60 °C to determine biomass. Tissue samples were analyzed for macro-and micro-nutrient concentrations by JR Peters Laboratory (Allentown, PA, USA).

2.2.2. Year Two

We used the same seed and peat sources and followed the methods described above, except that BC was not repeated and PP replaced WP. Due to logistical constraints, seeds were sown on Julian 165 and fertigation commenced on Julian 182. Therefore, the exponential fertilization period was shortened to t = 93; thus r = 0.0546 for NT = 80, and r = 0.0399 for NT = 20. On Julian 311 seedlings were sampled and analyzed as described above.

2.3. Statistical Analyses and Visualizations

We used generalized linear mixed models (GLIMMIX) within SAS (version 9.4 Software; SAS, Inc., Cary, NC, USA) to compare treatment means using the Gaussian response distribution and the default covariance matrix format. Type III tests were utilized. We used Tukey–Kramer adjustments for post-hoc multi-comparison tests of the differences between model means.
GLIMMIX tested for differences among the biochar types (BC, PP, WP) and peat for media physical and chemical properties. For seedlings, we previously speculated [24] that peat amended with ≥50% WP would likely experience too much expansion when wetted to be a valid treatment in a nursery. Indeed, when wetted in the current experiment, WP ≥50% expanded and split the cells. Subsequently, we were unable to control water loss (evaporation as well as fertigation) through the ruptures, and although we continued to culture the seedlings, the result was extremely poor growth. Thus, seedling growth in WP50 and WP75 was excluded from analysis.
Seedling biomass and soil chemistry data was relativized using response ratios in order to reduce variation between the two years [46]. The response ratio is the difference between the natural logarithm for each biomass variable (shoot height, stem diameter at the root collar, shoot and root dry biomass) and soil chemistry variable (media C, N, pH and electrical conductivity (EC)) and the natural logarithm for each biomass, soil chemistry, or VWC control (100% peat treatments). Seedling biomass response ratios were analyzed using GLIMMIX, accounting for the split-plot design by including the nitrogen treatment as the whole plot followed by media treatment as the split-plot (n = 9) before comparing variable means.
Visualizations, including vector diagrams that allow for the robust presentation and comparison of relative values [47], were created using SigmaPlot (version 13.0; Systat Software, San Jose, CA, USA).

3. Results

3.1. Media Characteristics

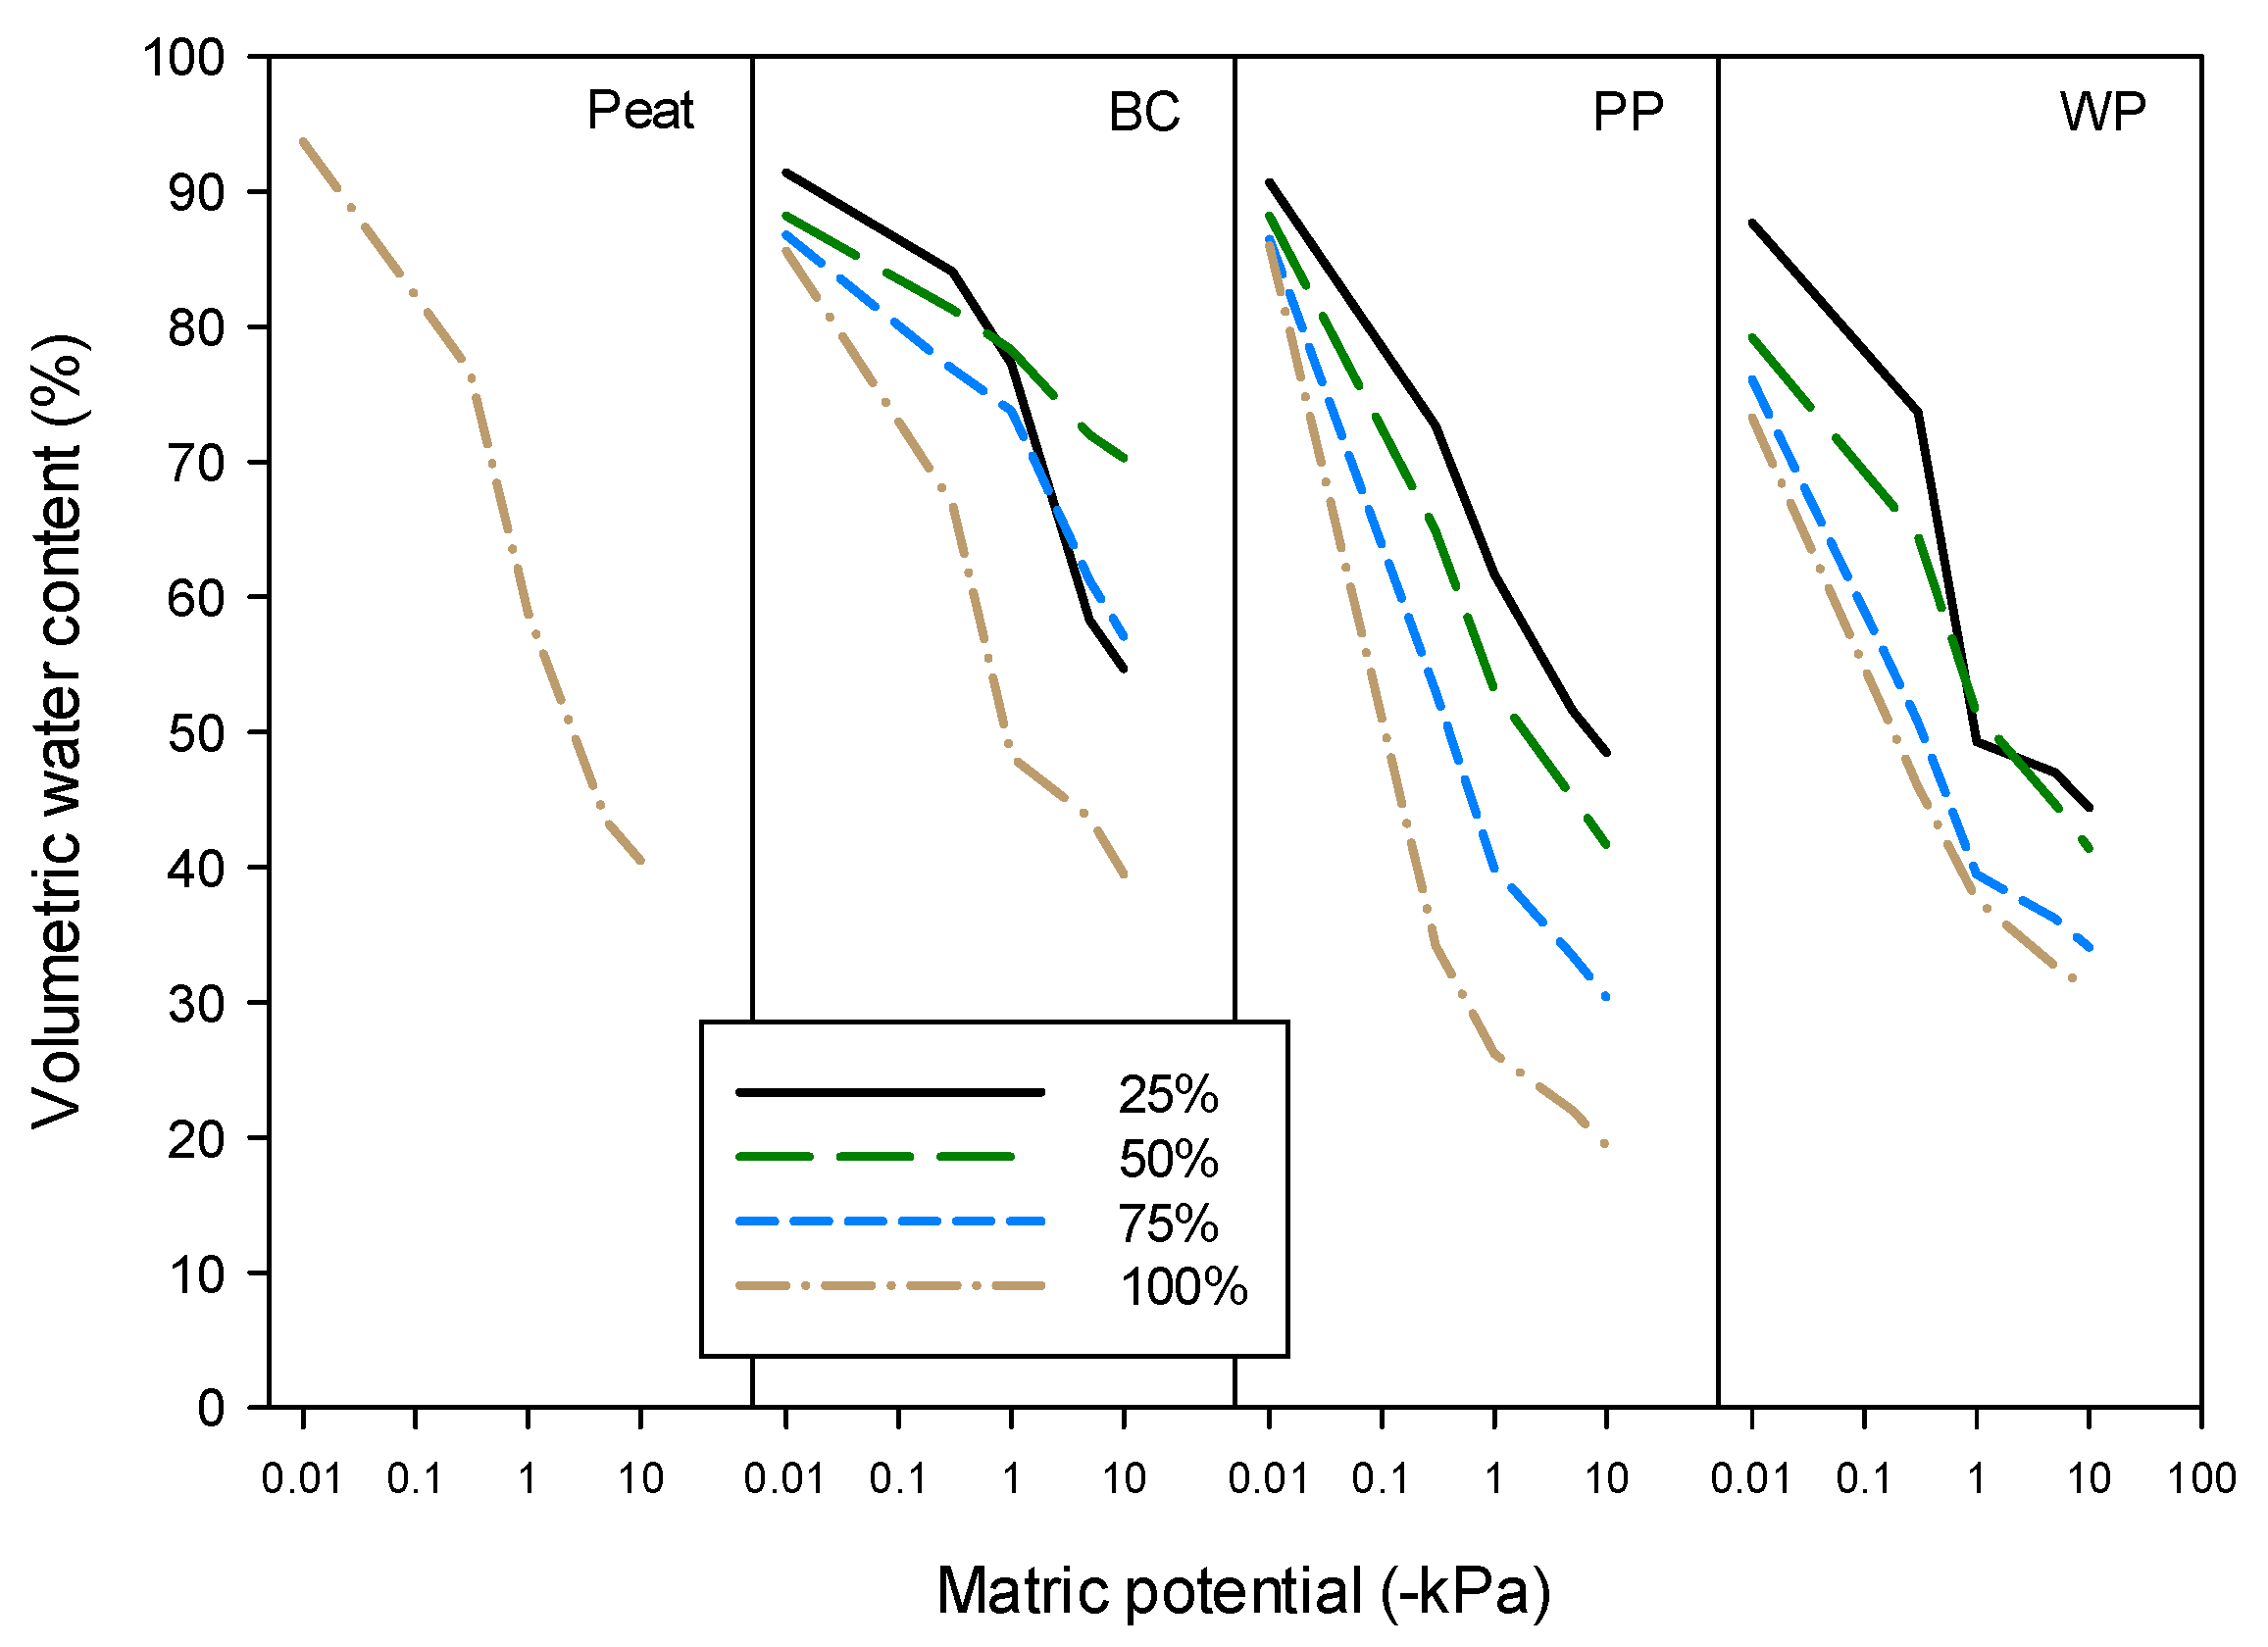
3.1.1. Physical Properties

The mean particle sizes of peat were the most evenly distributed, with all size classes well represented except for >5 mm (Table 2). In contrast, most (99%) of the BC had a particle size ≤1 mm, whereas for pellets (PP and WP) most (85%+) of the particles were >2 mm, and for PP nearly half were >5 mm. Peat had the lowest Db (0.099 g cm−3) and BC and PP had a similar Db at each added proportion, ranging from about 0.176 g cm−1 at the 25% level to about 0.323 g cm−3 at 100%; and WP had the highest Db at each added proportion, ranging from 0.223 to 0.527 g cm−3 as the proportion of WP increased in the media from 25 to 100%, respectively (Table 1). Organic matter (%) significantly decreased as the amount of peat replaced by individual biochar-based components increased (Figure 1). Across the components, peat had the greatest level of organic matter, followed by WP, and finally BC and PP.
When initially exposed to water, all growing media absorbed water with the exception of BC100 (data not shown). During the first 5 min, BC25 and BC50 absorbed only about one-fourth and one-fifth that of peat, respectively. Conversely, absorption doubled or tripled for PP ≤75 compared to peat and absorption values for WP25 and WP50 were similar to peat. Upon initial wetting of the media to container capacity, only WP50, WP75, and WP100 showed an increase in volume (≈12 to 27%) (Figure 2). Conversely, the shrinkage in peat was about 9%. The addition of BC ≤75% and any addition of PP (except PP50) decreased the shrinkage relative to 100% peat.
For peat, the water conductivity occurred at the highest matric potential (−0.3 kPa) but the rate was variable (1 to 10 cm day−1), declining steadily once the matric potential dropped to −10 kPa (Figure 3). BC50 and WP25 also showed consistent conductivity of about 1 cm day−1 at the highest potential. While BC50 followed a similar trend to peat, conductivity in WP25 began a steady decline at about −10 kPa. Water moved about 1 cm day−1 in PP50 at matric potentials between −1 and −10 kPa. BC25 and PP25 had little conductivity at matric potentials <−7 kPa, whereas WP50 had little conductivity at matric potentials <−5 kPa.
Once brought to container capacity, the subsequent volumes of the media during drying from −1 to −10 kPa varied. The volume of peat at each matric potential decreased (94.2 to 90.7 to 89.1% for −1, −5, and −10 kPa, respectively), and each volume was significantly lower than any biochar-amended media (Figure 4). BC25 and WP25 displayed the next greatest amount of shrinkage, significantly more than the other BC and WP rates, and all PP. In general, when the proportion of any biochar was ≥50%, the changes in volume were small (<5% shrinkage to <4% swelling). At −1 kPa, VWC, in general, decreased as the amount of biochar amendment increased (Figure 5). Amending peat with BC significantly reduced air-filled porosity (AFP) compared to all other treatments (about a 65% reduction compared to peat). AFP in peat, peat amended with up to 50% PP, and all rates of WP were fairly similar (28 to 38%); higher rates of PP (75 and 100%) increased the AFP by about 34 and 75%, respectively, compared to peat.

3.1.2. Chemical Properties

All four media components (peat, BC, PP, and WP) had significantly (P < 0.0001) different amounts of C (53, 74, 91, and 59% for peat, BC, PP, and WP, respectively). For N, peat had the greatest concentration (1.3%), significantly (P < 0.0001) more than BC and PP, which had similar values of 0.37 and 0.45%, respectively, which were statistically greater than WP (0.23%).
Peat had an initial pH of 3.9 (Table 1). Additions of biochar in any form increased the pH and the media with the most biochar also had the highest pH. Nitrogen content varied among media (Table 3); total N in the media containing pure biochar (either BC or PP) followed the same trend, with total N decreasing with increasing amounts of amendment. The opposite result was noted for WP. PP had, in general, greater total N and more ammonium at each amendment rate than BC. WP had minor amounts of ammonium regardless of the amendment rate. Conversely, WP had higher amounts of organic N compared to either BC or WP, which had similar amounts. Low levels of nitrate were observed across all media and amendment levels. The levels of soluble elements varied by media. Compared to peat, amending with biochar in any form reduced the amounts of calcium, magnesium, manganese (Mn), and sulfur and increased the levels of boron (B) and potassium (K) (Table 4). Low levels of heavy metals (cadmium, chromium, copper, nickel, and lead) were observed in the press water extract regardless of the amendment level (Table 4).
The effective cation exchange capacity (ECEC) was greatest in pure peat (Table 1). The addition of 25% v v−1 of any amendment significantly decreased ECEC by 37 to 46%, and each additional 25% v v−1 increase further decreased ECEC. Pure amendment had, on average, just 15% of the total ECEC of pure peat.

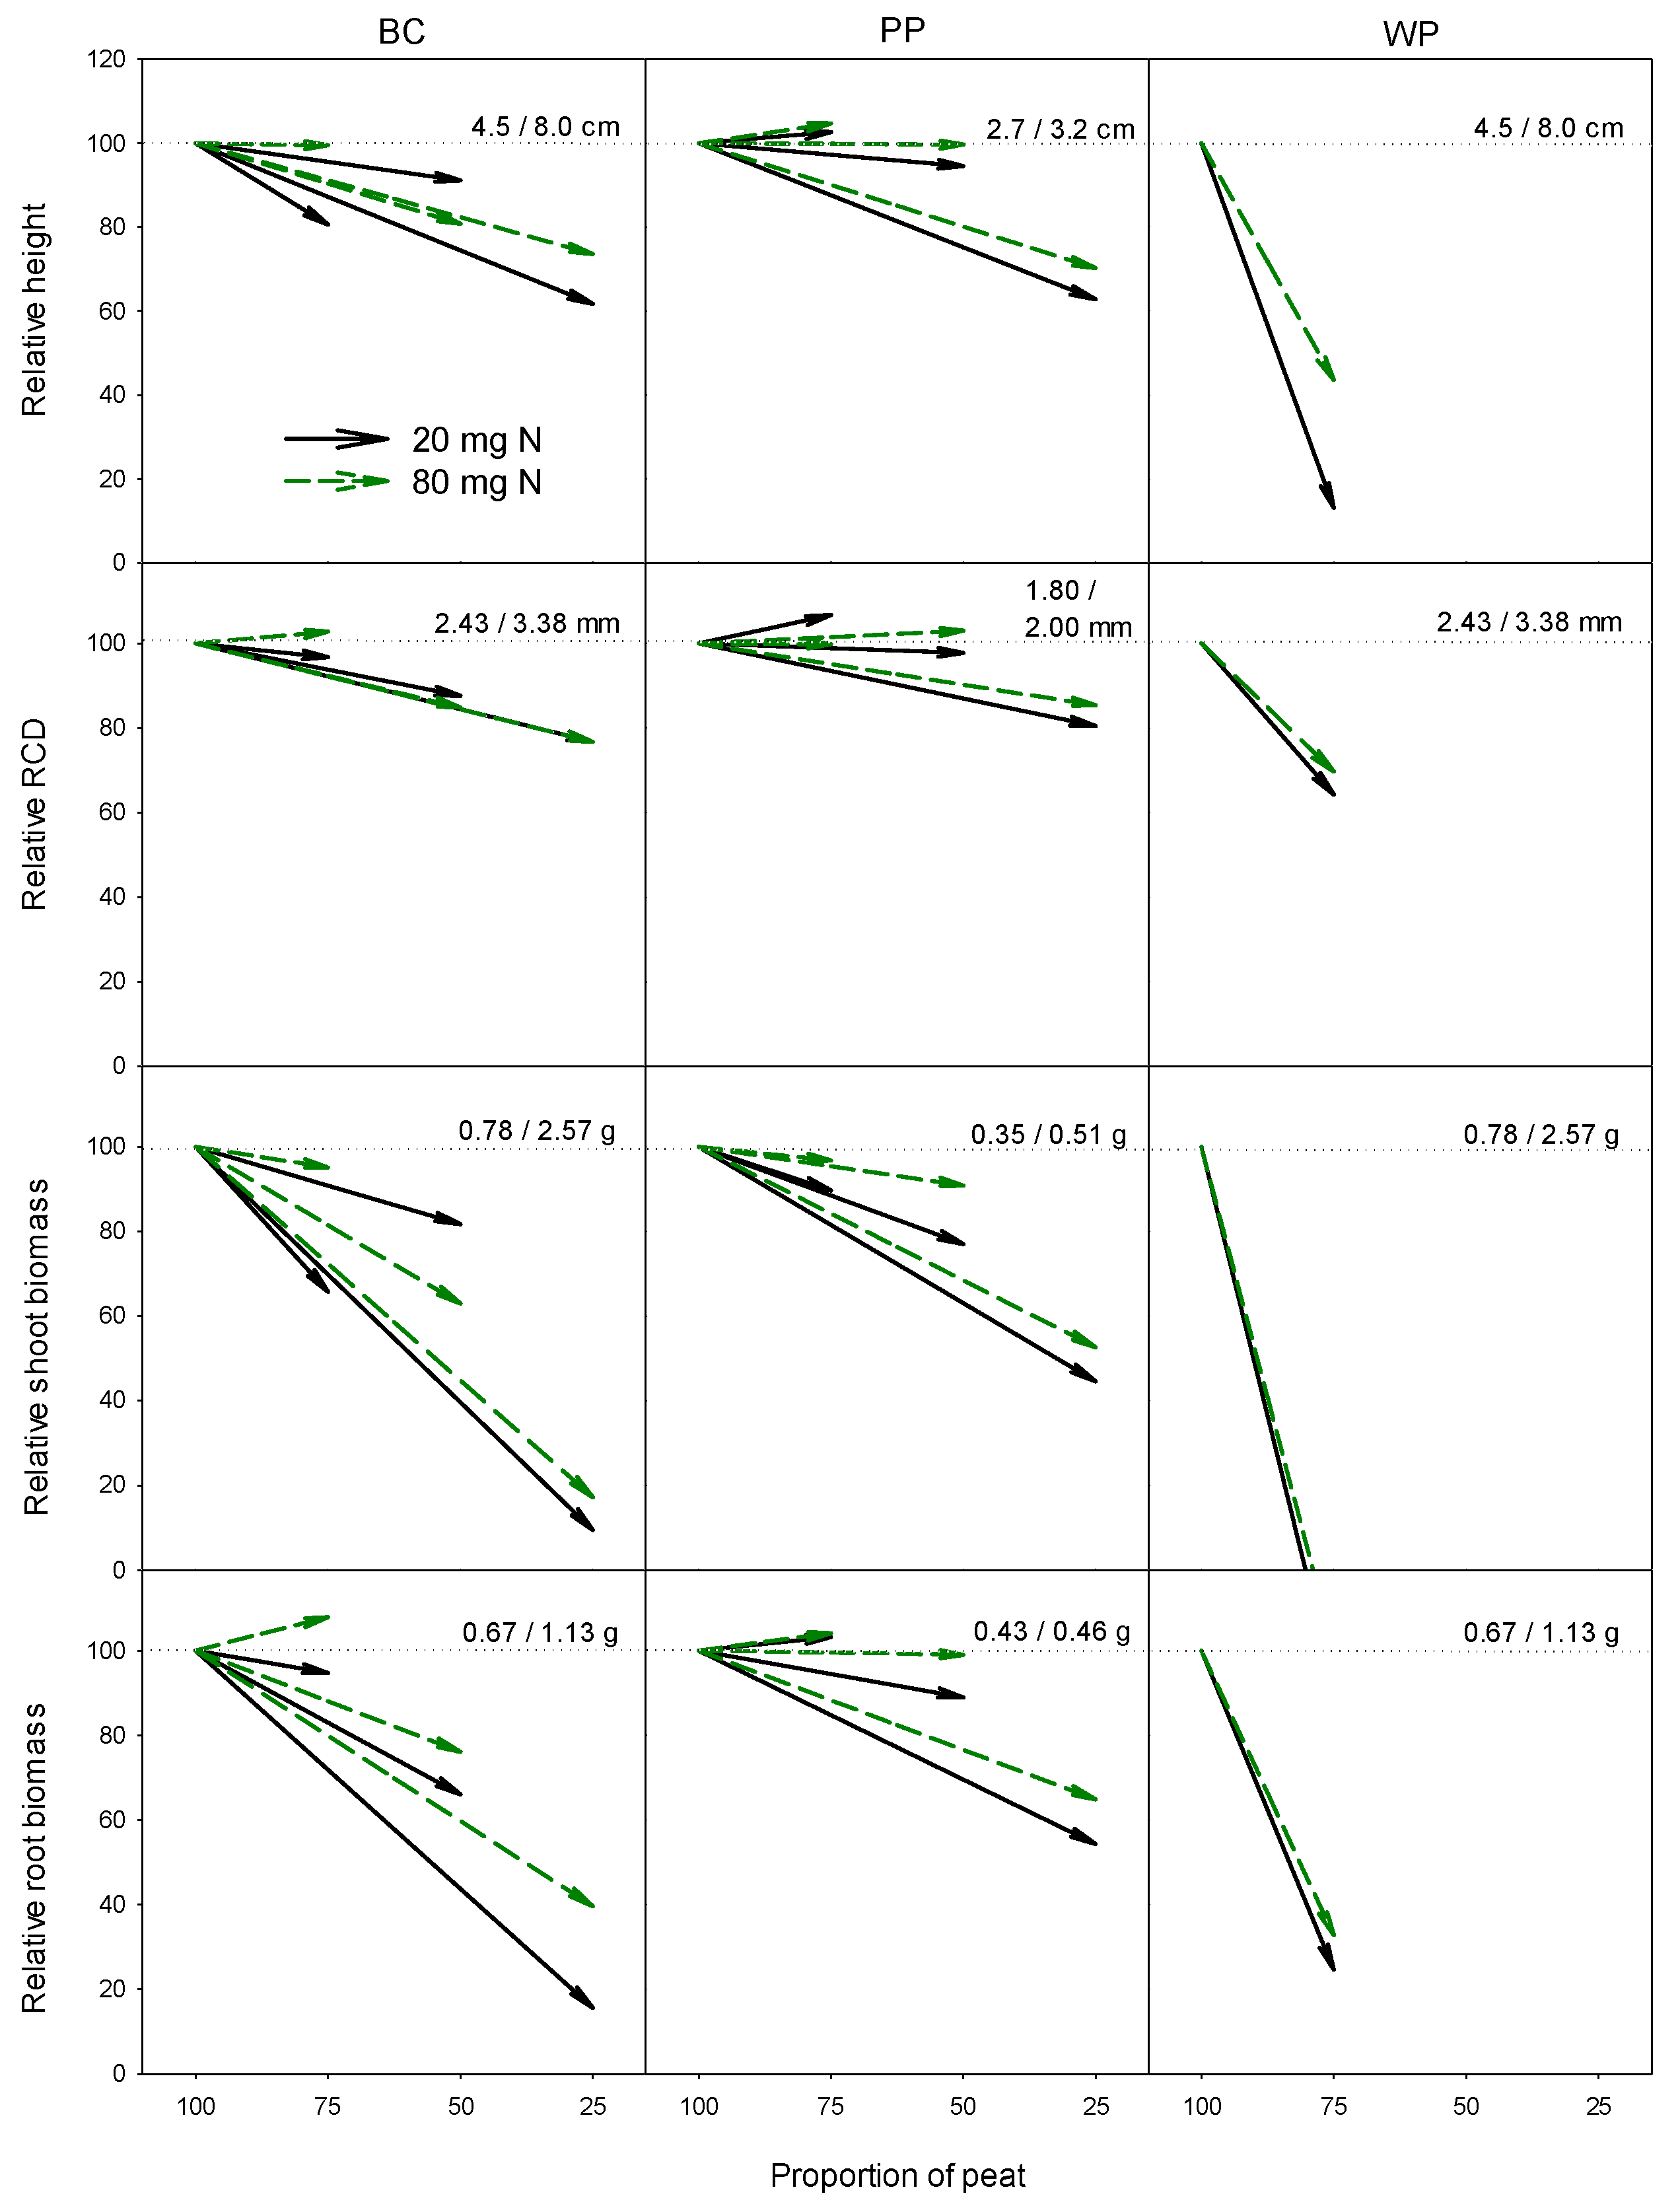
3.2. Seedling Growth

Although the media and N fertilization rate interacted to affect RCD, shoot biomass, and root biomass measured at the end of the experiment (Table 5), N fertilization as an independent variable was not significant. This is likely an artifact of analysis because the morphological values of seedlings from the biochar-amended media were normalized to the control for each year, and the pattern of growth was similar for each level of N (Figure 6). We noted no significant differences in the morphological attributes for the control and seedlings grown with ≤50% biochar (all P > 0.05), with the exception of WP, where a 25% addition dramatically reduced all morphological parameters relative to the 100% peat control. For BC, the higher rate of N in combination with a 25% addition yielded similar results (95 to 108%) to the control for all morphological traits, as did the addition of PP at either 25% or 50% (91 to 107%). Moreover, with the higher N rate, BC25, BC50, and PP25 had similar shoot N concentrations (96 to 100% of the control), whereas PP50 had 86% of the control.
For the most part, the concentrations of macro-and micro-nutrients in the shoots, regardless of amendment or N rate, were within the standard ranges for conifer seedlings [48,49]. Iron (Fe), B, and Mn were most affected. Seedlings grown with BC25 and BC75 and 20 mg N had 41 to 340% more Fe than the control, which exceeded (by about 40%) the high end of the recommendation range (200 ppm). All seedlings grown with PP and receiving 80 mg N had B values 10 to 40% higher than the peat control (4 to 22% higher than the 100 ppm recommendation). Mn was high across all treatments; only the two amendments with 75% biochar, BC75 and PP75, fell within the recommended range of 100 to 250 ppm. All others ranged from 300 to 640 ppm. For all treatments, molybdenum fell within the recommended range (0.05 to 5 ppm), but the control peat had the lowest concentrations (0.05 ppm), whereas all biochar-amended treatments ranged from 0.1 to 4.2 ppm with an average of 1.2 ppm.
The substrates affected the number of irrigations required using a water mass threshold of 80% of container capacity. We observed less irrigation events for the BC and WP treatments, whereas PP required about the same number as pure peat (Table 6). The BC irrigation frequency was reduced from 12 to 25%, with the greatest reduction noted when 50% of the peat was replaced.

4. Discussion

For healthy seedling growth, media pH, CEC, inherent fertility, and porosity are some of the most important aspects. Our peat substrate had the lowest pH (3.9), but was typical for Sphagnum [50]. The lowest rates of biochar (25%) and peat had pH values lower than the range of 5.5 to 6.5 recommended for most woody plants for restoration [48], although it was within the recommended range for conifers grown in pure peat (4.5 to 5.5 [51]). Replacement of 50% of the peat with the biochar amendments yielded values within the Landis et al. [48] range, and replacement of 75% peat exceeded that range. Bunt [50] notes, however, that most plants can be grown across a wide range of pHs provided that nutrients are appropriately supplied.
All of the components within our media were organic. Organic matter (OM) increases the cation exchange capacity of native soils by increasing the number of negative exchange sites available to retain nutrients. Therefore, it is interesting to note the decline in OM across all amendment combinations as compared to the peat (Figure 1). Our samples were analyzed by Ball’s [36] loss-on-ignition and this method is routinely used for soil samples. This method may have shown lower levels of OM in the biochar treatments because charcoal is resistant to further heating and mass loss. Biochar (or black carbon) is not easy to volatilize [52] and, therefore, other thermal or chemical methods may be a better way to assess the contribution of carbon to the amendments. Despite not being able to categorize OM adequately, biochar is unique in that it has a high cation exchange capacity, which can significantly increase nutrient retention because of the higher surface charge [53]. However, the direct evidence of biochar’s influence on nutrient cycling and retention in soils is inconsistent [54]. For example, biochar may accelerate nutrient cycling in the long-term and serve as a short-term source of highly available nutrients [55]. Many of the changes in nutrient cycling are related to specific biochars (e.g., feedstock, pyrolysis temperatures) and how they age within the soil matrix. Very little is known about the nutrient exchange from biochar in a nursery setting.
During nursery production, a high cation exchange capacity is desired because it mitigates the leaching of nutrients during irrigation, which maintains a high level of substrate fertility [48]. Earlier we reported that replacing 25% (v v−1) peat with WP reduced the effective cation exchange capacity (ECEC) by about 50% [24]; here we found that replacing 25% peat with either BC or PP only reduced ECEC by about a third (Table 1). These changes in ECEC did not, however, result in large differences in observed shoot nutrient concentrations (data not shown); we believe that our strict adherence to irrigation applied at discrete thresholds, hand application, and the use of exponential fertilization to ensure that all treatments received the same level of N, may have reduced any potential negative effects of nutrient leaching during fertigation [17,44].
Compared to peat, we noted high levels of soluble K when any amount and type of biochar was used (Table 4), as well as a decreases in soluble Mg, and this was also apparent in the press water extracts. High values of K have also been noted by others, with suggestions that biochar may serve as the sole source of K in container production systems [28,56,57,58]. We noted increases in shoot K concentrations of 6 to 31% when BC or WP replaced peat (which yielded an average value of 0.93% K), but the values when PP was added were more modest (zero to +4%). While using biochar as the sole source of P has also been suggested [56] and increased nutrient concentrations have been observed with 10% v v−1 [56] and ≤35% w w−1 [58], we only noted increases (of about 15%) with PP concentrations ≤50%. While high rates of K were associated with Mg deficiency in Pinus radiata [59], we noted that our combination of biochar and fertigation programs yielded shoot Mg concentrations 4 to 50% higher than the peat, with the exception of PP50 and PP75, which had 7 to 11% reductions, respectively. Despite these findings, the values were generally similar to peat (0.12% Mg versus 0.11% Mg) and within the suggested range of Landis et al. [48]. Although we did not specifically test whether biochar could provide sufficient P and K for seedling growth, our varied results across biochars and proportions suggest that when appropriate nutrition is provided through fertigation, addition by biochar are probably not sufficient to be excessive, and that reliance on biochar as a fertilizer will be biochar-specific.
In his review, Heiskanen [60] suggests that an air-filled porosity (AFP) at −1 kPa near 40% is an optimum threshold for container reforestation seedlings, and later determined that 50% of the TP is about optimum WC and AFP for any medium [18]. In this study, the peat had an AFP of about 35%, and replacing the peat with PP yielded media with an AFP ranging from 29 to 47% (increasing with the increasing addition of biochar; Figure 5). These treatments also required similar intervals of irrigation (Table 6), suggesting similar water and air availability to seedlings among the range of amendments. In contrast, the replacement of peat with BC generated media with a very low AFP (14, 10, and 13% as the amendment increased from 25 to 50 to 75%). This higher proportion of water-holding capacity at the expense of air-filled porosity is reflected in the decreased frequency of required irrigation (Table 6); notably the lowest AFP treatment (BC50) required the fewest irrigation events. WP25, despite having a near-optimum AFP (39%), required the least number of irrigations. Heiskanen [60] cautions, however, that water-and air-filled porosities “do not actually or commensurably describe the availability of air or water to the roots in all media”. Accordingly, we observed good growth of the seedlings in BC25 given the higher rate of N despite the low AFP, and less satisfactory growth of PP75 seedlings and very poor growth of WP25 seedlings despite a near-optimum AFP. Other factors, such as bulk density (Db), likely have an effect, given that BC25 had a relatively low Db and PP75 had a relatively high Db. Certainly a low Db is important. Vaughn et al. [26], working with cultivars of tomatoes (Solanum lycopersicum) and marigolds (Tagetes erecta), and biochar substrates (≤15% v v−1) with fairly similar Db (0.13 to 0.17) and AFP (24 to 29%), observed few differences in plant growth with the exception of tomato height. In a second experiment with the same species, Vaughn et al. [21] found that biochar mixtures with the greatest AFP (about 47%) yielded the highest amount of biomass for each species. In addition, Conversa et al. [61] reported very good seedling growth with biochar additions up to 70% (v v−1); as the biochar additions increased from zero to 70%, Db shifted upward from 0.13 to 0.16 g cm−3 and the AFP increased from 13 to 21%.
Our results, similar to those of several others [21,25,26,27,61,62], suggest that acceptable plant growth can often be achieved when peat-based substrates are replaced with suitable biochar forms ≤50% (v v−1). In addition, it is important to consider that in an operational setting and on an annual basis, prudent nursery managers adjust cultural practices to ensure target seedling growth [63,64], and a similar approach would be sensible when incorporating biochar into the growth medium. In their review of the association between biochar and plant diseases, Frenkel et al. [65] caution, however, that biochar rates exceeding 3% (w w−1) were more conducive to disease (our 25% v v−1 rates ranged from about 7 to 44% w w−1; see Table 1). The authors note that soil-borne pathogens were commonly enhanced in 83% of the studies they reviewed, but foliar pathogens were enhanced in only 33% of the studies. For forest nurseries in western North America, soil-borne pathogens (i.e., Cylindrocarpon, Fusarium, and Pythium) are ubiquitous (e.g., [66]), but the expression of disease is usually only associated with prolonged, excessive moisture in the growing media (e.g., [66,67,68,69]) often due to excessive irrigation. In addition, the basal portion of all containers, post irrigation, experience saturated conditions for some duration, which is a function of plant phenology, container height, and medium porosity [60]. Too frequent irrigation, even if applied to “maintain container capacity”, can prolong this saturated condition, particularly for media with lower porosity, as can be found when biochar is added, and the resulting anaerobic conditions can be stressful to seedlings [6,69,70]. Several studies reviewed by Frenkel et al. [65] that show enhanced disease expression with higher rates of biochar provide either scant, ambiguous, or solely qualitative estimates on how irrigation was managed during the experiments. This is unfortunate, given that Heiskanen [18] notes that when peat-based media are amended, particularly with organic components, irrigation should be adjusted for each mixture to achieve the correct water, oxygen, and nutrient availability. Indeed, Matt et al. [27] found that after increasing the volumetric proportions of biochar powder (same as the BC used in this study) in a well-drained, peat-based substrate (3:1:1 v:v:v peat, perlite, vermiculite), the irrigation frequency required to achieve similar water mass across treatments during the course of the experiment was reduced. That is, due to the specific water retention characteristics of the biochar treatments, those biochar treatments required less frequent irrigation (about 40% for the highest rate of biochar) compared to the more well-drained peat-based substrate. Our results were less straightforward, but we still noted a 12 to 25% difference in irrigation frequency among our biochar treatments. Given that frequent irrigation to container capacity of the media with higher water retention increases the risk of waterlogging [71], the elevated occurrence of disease associated with higher rates of biochar (with its subsequent higher water retention) may be a function of poor irrigation management.
While irrigation and fertilization methods are often poorly described in studies evaluating biochar and its impacts on disease expression, the same is true for published studies evaluating seedling performance when grown in biochar-amended substrates. As concluded by Pinto et al. [72], applying nursery culture without regard for the intrinsic nature of the differences provided by the treatments, for example, irrigating plants with a range of biochar additions every three days regardless of water availability, only evaluates the irrigation practice, not the true potential of the treatment (in this example, biochar). Thus, more attention to irrigation and fertilization practices that avoid confounding should be practiced. Irrigation can be easily managed by measuring water mass loss [44] and is an effective technique to reduce confounding irrigation and fertilization in greenhouse trials (e.g., [17]).

5. Conclusions

We evaluated replacing peat with three types of biochar (BC, powder; PP, pyrolyzed softwood pellets; WP, composite wood-biochar powder pellets) up to 75% (v v−1) and under two exponential fertilization regimes that supplied either 20 or 80 mg N during the course of the experiment. Exponential fertilization and gravimetric determination of water loss from the media were used to avoid confounding these variables across biochar types and proportions. Seedling growth patterns were similar for either N supply, suggesting that biochar alone has little effect on the overall substrate fertility. Additions of 25% (BC) and up to 50% (PP) with concurrent application of 80 mg N yielded seedlings with similar growth to the peat control. Worldwide, studies have demonstrated mixed responses in terms of plant growth when biochar was a component of the growing media. A better understanding of the potential for biochar as a nursery substrate may be achieved through proper irrigation and fertilization techniques and the reporting of basic media characteristics, in particular bulk density and air-filled porosity.

Author Contributions

R.K.D. and J.H. conceived the experiment; R.K.D., J.R.P., J.H., and D.S.P-D. designed the experiment; D.S.P-D. provided biochar; K.E. designed the composite wood-biochar pellets; J.H. completed the physical analyses of the growing media and their components; A.T. completed the chemical analyses of the growing media and their components; R.K.D. and J.R.P. cultured the seedlings; K.G.M. analyzed the data; R.K.D. wrote the first draft; all authors reviewed and provided comments to improve subsequent versions of the manuscript.

Acknowledgments

This research developed from conversations during R.K.D.’s sabbatical to the Finnish Forest Research Institute (METLA; now Natural Resources Institute Finland [LUKE]) in Suonenjoki, Finland, formalized with agreement 09-CO-11221633-158 and subsequently supported through agreements 10-IJ-11221633-192 (METLA), 13-CR-11221633-127 (Washington State University), and 14-JV-11221633-042 (University of Idaho). Primary support was provided by the U.S. Department of Agriculture Forest Service (USFS) Rocky Mountain Research Station (RMRS) and the USFS National Center for Reforestation, Nurseries, and Genetic Resources. We thank Jake Kleinknecht and Janelle Meyers for tending the seedlings and processing samples, and L. Scott Baggett, RMRS statistician, for assistance with data analysis. The views expressed are strictly those of the authors and do not necessarily represent the positions or policy of their respective institutions.

Conflicts of Interest

The authors declare no conflict of interest.

References

  1. Chazdon, R.L. Beyond deforestation: Restoring forests and ecosystem services on degraded lands. Science 2008, 320, 1458–1460. [Google Scholar] [CrossRef] [PubMed]
  2. Stanturf, J.A.; Palik, B.J.; Dumroese, R.K. Contemporary forest restoration: A review emphasizing function. For. Ecol. Manag. 2014, 331, 292–323. [Google Scholar] [CrossRef]
  3. Stanturf, J.A.; Palik, B.J.; Williams, M.I.; Dumroese, R.K.; Madsen, P. Forest restoration paradigms. J. Sustain. For. 2014, 33, S161–S194. [Google Scholar] [CrossRef]
  4. Haase, D.L.; Davis, A.S. Developing and supporting quality nursery facilities and staff are necessary to meet global forest and landscape restoration needs. Reforesta 2017, 4, 69–93. [Google Scholar] [CrossRef]
  5. Griscom, B.W.; Adams, J.; Ellis, P.W.; Houghton, R.A.; Lomax, G.; Miteva, D.A.; Schlesinger, W.H.; Shoch, D.; Siikamäki, J.V.; Smith, P.; et al. Natural climate solutions. Proc. Natl. Acad. Sci. USA 2017, 144, 11645–11650. [Google Scholar] [CrossRef] [PubMed]
  6. Heiskanen, J. Effect of subirrigation on the growth of Norway spruce container seedlings in a greenhouse: A pilot study. J. Appl. Irrig. Sci. 2007, 42, 19–28. [Google Scholar]
  7. Schmal, J.L.; Dumroese, R.K.; Davis, A.S.; Pinto, J.R.; Jacobs, D.F. Subirrigation for production of native plants in nurseries—Concepts, current knowledge, and implementation. Nativ. Plants J. 2011, 12, 81–93. [Google Scholar] [CrossRef]
  8. Shaviv, A.; Mikkelsen, R.L. Controlled-release fertilizers to increase efficiency of nutrient use and minimize environmental degradation: A review. Fert. Res. 1993, 35, 1–12. [Google Scholar] [CrossRef]
  9. Dumroese, R.K.; Page-Dumroese, D.S.; Salifu, K.F.; Jacobs, D.F. Exponential fertilization of Pinus monticola seedlings: Nutrient uptake efficiency, leaching fractions, and early outplanting performance. Can. J. For. Res. 2005, 35, 2961–2967. [Google Scholar] [CrossRef]
  10. Dumroese, R.K.; Page-Dumroese, D.S.; Wenny, D.L. Managing Pesticide and Fertilizer Leaching and Runoff in a Container Nursery. In Proceedings of the Intermountain Forest Nursery Association, Park City, UT, USA, 12–16 August 1991; Landis, T.D., Ed.; USDA Forest Service, Rocky Mountain Forest and Range Experiment Station: Fort Collins, CO, USA, 1992; pp. 27–33. Available online: https://www.researchgate.net/publication/272819594 (accessed on 15 March 2018).
  11. Dumroese, R.K.; Wenny, D.L.; Page-Dumroese, D.S. Nursery Waste Water: The Problem and Possible Remedies. In Proceedings of the National Proceedings, Forest and Conservation Nursery Associations, Kearney, NE, USA, 7–11 August 1995; Landis, T.D., Cregg, B., Eds.; USDA Forest Service, Pacific Northwest Research Station: Portland, OR, USA, 1995; pp. 89–97. Available online: https://www.researchgate.net/publication/272819463 (accessed on 15 March 2018).
  12. Juntunen, M.-L.; Hammar, T.; Rikala, R. Leaching of nitrogen and phosphorus during production of forest seedlings in containers. J. Environ. Qual. 2002, 31, 1868–1874. [Google Scholar] [CrossRef] [PubMed]
  13. Apostol, K.G.; Dumroese, R.K.; Pinto, J.R.; Davis, A.S. Response of conifer species from three latitudinal populations to light spectra generated by light-emitting diodes and high-pressure sodium lamps. Can. J. For. Res. 2015, 45, 1711–1719. [Google Scholar] [CrossRef]
  14. Riikonen, J.; Kettunen, N.; Gritsevich, M.; Hakala, T.; Särkkä, L.; Tahvonen, R. Growth and development of Norway spruce and Scots pine seedlings under different light spectra. Environ. Exp. Bot. 2016, 121, 112–120. [Google Scholar] [CrossRef]
  15. Montagnoli, A.; Dumroese, R.K.; Terzaghi, M.; Pinto, J.R.; Fulgaro, N.; Scippa, G.S.; Chiatante, D. Tree seedling response to LED spectra: Implications for forest restoration. Plant Biosyst. 2018, 152, 515–523. [Google Scholar] [CrossRef]
  16. Rose, R.; Haase, D.L. The use of coir as a containerized growing medium for Douglas-fir seedlings. Nativ. Plants J. 2000, 1, 107–111. [Google Scholar] [CrossRef]
  17. Dumroese, R.K.; Page-Dumroese, D.S.; Brown, R.E. Allometry, nitrogen status, and carbon stable isotope composition of Pinus ponderosa seedlings in two growing media with contrasting nursery irrigation regimes. Can. J. For. Res. 2011, 41, 1091–1101. [Google Scholar] [CrossRef]
  18. Heiskanen, J. Effects of compost additive in sphagnum peat growing medium on Norway spruce container seedlings. New For. 2013, 44, 101–118. [Google Scholar] [CrossRef]
  19. Villa Castillo, J. Inoculating composted pine bark with beneficial organisms to make a disease suppressive compost for container production in Mexican forest nurseries. Nativ. Plants J. 2004, 5, 181–185. [Google Scholar] [CrossRef]
  20. Caron, J.; Rochefort, L. Use of peat in growing media: State of the art on industrial and scientific efforts envisioning sustainability. Acta Hortic. 2013, 982, 15–22. [Google Scholar] [CrossRef]
  21. Vaughn, S.F.; Eller, F.J.; Evangelista, R.L.; Moser, B.R.; Lee, E.; Wagner, R.E.; Peterson, S.C. Evaluation of biochar-anaerobic potato digestate mixtures as renewable components of horticultural potting media. Ind. Crop Prod. 2015, 65, 467–471. [Google Scholar] [CrossRef]
  22. Landis, T.D.; Morgan, N. Growing Media Alternatives for Forest and Native Plant Nurseries. In Proceedings of the National Proceedings, Forest and Conservation Nursery Associations, Missoula, MT, USA, 23–25 June 2008; Dumroese, R.K., Riley, L.E., Eds.; USDA Forest Service, Rocky Mountain Research Station: Fort Collins, CO, USA, 2009; pp. 26–31. Available online: https://www.fs.usda.gov/treesearch /pubs/20894 (accessed on 15 March 2018).
  23. Huber, G.W.; Iborra, S.; Corma, A. Synthesis of transportation fuels from biomass: Chemistry, catalysts, and engineering. Chem. Rev. 2006, 106, 4044–4098. [Google Scholar] [CrossRef] [PubMed]
  24. Dumroese, R.K.; Heiskanen, J.; Englund, K.; Tervahauta, A. Pelleted biochar: Chemical and physical properties show potential use as a substrate in container nurseries. Biomass Bioenergy 2011, 35, 2018–2027. [Google Scholar] [CrossRef]
  25. Tian, Y.; Sun, X.; Li, S.; Wang, H.; Wang, L.; Cao, J.; Zhang, L. Biochar made from green waste as peat substitute in growth media for Calathea rotundifola cv. Fasciata. Sci. Hortic. 2012, 143, 15–18. [Google Scholar] [CrossRef]
  26. Vaughn, S.F.; Kenar, J.A.; Thompson, A.R.; Peterson, S.C. Comparison of biochars derived from wood pellets and pelletized wheat straw as replacements for peat in potting substrates. Ind. Crop Prod. 2013, 51, 437–443. [Google Scholar] [CrossRef]
  27. Matt, C.P.; Keyes, C.R.; Dumroese, R.K. Biochar effects on the nursery propagation of 4 northern Rocky Mountain native plant species. Nativ. Plants J. 2018, 19, 14–25. [Google Scholar] [CrossRef]
  28. Headlee, W.L.; Brewer, C.E.; Hall, R.B. Biochar as a substitute for vermiculite in potting mix for hybrid poplar. Bioenergy Res. 2014, 7, 120–131. [Google Scholar] [CrossRef]
  29. Nemati, M.R.; Simard, F.; Fortin, J.-P.; Beaudoin, J. Potential use of biochar in growing media. Vadose Zone J. 2015, 14. [Google Scholar] [CrossRef]
  30. Ennis, C.J.; Evans, A.G.; Islam, M.; Ralebitso-Senior, T.K.; Senior, E. Biochar: Carbon sequestration, land remediation, and impacts on soil microbiology. Crit. Rev. Environ. Sci. Technol. 2012, 42, 2311–2364. [Google Scholar] [CrossRef] [Green Version]
  31. McCarl, B.A.; Peacocke, C.; Chrisman, R.; Kung, C.-C.; Sands, R.D. Chapter 19: Economics of Biochar Production, Utilization and Greenhouse Gas Offsets. In Biochar for Environmental Management; Lehmann, J., Joseph, S., Eds.; Earthscan: Stirling, VA, USA, 2009; pp. 341–358. ISBN 978-1-84407-658-1. [Google Scholar]
  32. Page-Dumroese, D.S.; Anderson, N.M.; Windell, K.; Englund, K.; Jump, K. Development and Use of a Commercial-Scale Biochar Spreader; General Technical Report RMRS-GTR-354; USDA Forest Service, Rocky Mountain Research Station: Fort Collins, CO, USA, 2016; p. 10. Available online: https://www.fs.usda.gov/treesearch/pubs/52309 (accessed on 20 March 2018).
  33. McElligott, K.M. Biochar Amendments to Forest Soils: Effects on Soil Properties and Tree Growth. Master of Science Thesis, University of Idaho, Moscow, ID, USA, 2011. [Google Scholar]
  34. Blake, G.R.; Hartge, K.H. Bulk Density. In Methods of Soil Analysis. Part 1. Physical and Mineralogical Methods, 2nd ed.; Agronomy Monograph 9; Klute, A., Ed.; American Society of Agronomy and Academic Press: Madison, WI, USA, 1986; pp. 363–375. [Google Scholar]
  35. Heiskanen, J. Comparison of three methods for determining the particle density of soil with liquid pycnometers. Commun. Soil Sci. Plant Anal. 1992, 23, 841–846. [Google Scholar] [CrossRef]
  36. Ball, D.F. Loss-on-ignition as an estimate of organic matter and organic carbon in non-calcareous soils. Eur. J. Soil Sci. 1964, 15, 84–92. [Google Scholar] [CrossRef]
  37. Klute, A. Methods of Soil Analysis. Part 1. Physical and Mineralogical Methods, 2nd ed.; Agronomy Monograph 9; American Society of Agronomy and Academic Press: Madison, WI, USA, 1986. [Google Scholar]
  38. Heiskanen, J. Variation in water retention characteristics of peat growth media used in tree nurseries. Silva Fenn. 1993, 27, 77–97. [Google Scholar] [CrossRef]
  39. White, J.W.; Mastalerz, J.W. Soil moisture as related to “container capacity”. Am. Soc. Hortic. Sci. 1996, 89, 758–765. [Google Scholar]
  40. Wilson, G.C.S. The physico-chemical and physical properties of horticultural substrates. Acta Hortic. 1983, 150, 19–32. [Google Scholar] [CrossRef]
  41. Schindler, U. Ein Schnellverfahren zur Messung der Wasserleitfähigkeit im teilgesättigten Boden an Stechzylinderproben. Arch. Acker Pflanzenbau Bodenkd. 1980, 24, 1–7. (In German) [Google Scholar]
  42. Schindler, U.; Müller, L. Simplifying the evaporation method for quantifying soil hydraulic properties. J. Plant Nutr. Soil Sci. 2006, 169, 623–629. [Google Scholar] [CrossRef]
  43. Mahler, R.L.; Naylor, D.V.; Fredrickson, M.K. Hot water extraction of boron from soils using sealed plastic pouches. Commun. Soil Sci. Plant Anal. 1984, 15, 479–492. [Google Scholar] [CrossRef]
  44. Dumroese, R.K.; Montville, M.E.; Pinto, J.R. Using container weights to determine irrigation needs: A simple method. Nativ. Plants J. 2015, 16, 67–71. Available online: https://www.fs.usda.gov/treesearch/pubs/48087 (accessed on 15 March 2018). [CrossRef]
  45. Timmer, V.R.; Aidelbaum, A.S. Manual for Exponential Nutrient Loading of Seedlings to Improve Outplanting Performance on Competitive Forest Sites; NODA/NFP Technical Report TR-25; Natural Resources Canada, Canadian Forest Service, Great Lakes Forestry Center: Marie, ON, Canada, 1996; Available online: http://www.cfs.nrcan.gc.ca/pubwarehouse/pdfs/9567.pdf (accessed on 15 March 2018).
  46. Hedges, L.V.; Gurevitch, J.; Curtis, P.S. The meta-analysis of response ratios in experimental ecology. Ecology 1999, 80, 1150–1156. [Google Scholar] [CrossRef]
  47. Haase, D.L.; Rose, R. Vector analysis and its use for interpreting plant nutrient shifts in response to silvicultural treatments. For. Sci. 1995, 41, 54–66. [Google Scholar]
  48. Landis, T.D.; Tinus, R.W.; McDonald, S.E.; Barnett, J.P. Seedling Nutrition and Irrigation. The Container Tree Nursery Manual: Agriculture Handbook 674; USDA Forest Service: Washington, DC, USA, 1989; Volume 4, 119p, Available online: https://rngr.net/publications/ctnm/volume-4 (accessed on 18 March 2018).
  49. Landis, T.D.; Haase, D.L.; Dumroese, R.K. Plant Nutrient Testing and Analysis in Forest and Conservation Nurseries. In Proceedings of the National Proceedings, Forest and Conservation Nursery Associations―2004, Charleston, NC, USA, 12–15 July 2004; Dumroese, R.K., Riley, L.E., Landis, T.D., Eds.; USDA Forest Service, Rocky Mountain Research Station: Fort Collins, CO, USA, 2005; pp. 76–83. Available online: https://www.fs.usda.gov/treesearch/pubs/20894 (accessed on 15 March 2018).
  50. Bunt, A.C. Media and Mixes for Container-Grown Plants. A Manual on the Preparation and Use of Growing Media for Pot Plants, 2nd ed.; Unwin Hyman: London, UK, 1988; ISBN 978-94-011-7904-1. [Google Scholar]
  51. Rikala, R.; Jozefek, H.J. Effect of dolomite lime and wood ash on peat subtrate and develoment of tree seedlings. Silva Fenn. 1990, 24, 323–334. [Google Scholar] [CrossRef]
  52. Schmidt, M.W.I.; Skjemstad, J.O.; Czimczik, C.I.; Glaser, B.; Prentic, K.M.; Gelina, Y.; Kuhlbusch, T.A. Comparative analysis of black carbon in soils. Glob. Biogeochem. Cycles 2001, 15, 163–167. [Google Scholar] [CrossRef]
  53. Liang, B.; Lehmann, J.; Solomon, D.; Kinyangi, J.; Grossman, J.; O’neill, B.; Skjemstad, J.O.; Thies, J.; Luizao, F.J.; Petersen, J.; et al. Black carbon increases cation exchange capacity in soils. Soil Sci. Soc. Am. J. 2006, 70, 1719–1730. [Google Scholar] [CrossRef]
  54. DeLuca, T.H.; Gundale, M.J.; MacKenzie, M.D.; Jones, D.L. Biochar Effects on Soil Nutrient Transformations. In Biochar for Environmental Management: Science, Technology and Implementation, 2nd ed.; Lehmann, J., Joseph, S., Eds.; Earthscan: London, UK; New York, NY, USA, 2015; pp. 421–454. ISBN 978-0-415-70415-1. [Google Scholar]
  55. Jeffery, S.; Verheijen, F.G.A.; van der Velde, M.; Bastos, A.C.A. Quantitative review of the effects of biochar applications to soils on crop productivity using meta-analysis. Agric. Ecosyst. Environ. 2011, 144, 175–187. [Google Scholar] [CrossRef]
  56. Altland, J.E.; Locke, J.C. Gasified rice hull biochar is a source of phosphorus and potassium for container-grown plants. J. Environ. Hortic. 2013, 31, 138–144. [Google Scholar] [CrossRef]
  57. Wrobel-Tobiszewska, A.; Boersma, M.; Sargison, J.P.; Adams, P.; Singh, B.; Franks, S.; Birch, C.J.; Close, D.C. Nutrient changes in potting mix and Eucalyptus nitens leaf tissue under macadamia biochar amendments. J. For. Res. 2018, 29, 383–393. [Google Scholar] [CrossRef]
  58. Zhang, L.; Sun, X.-Y.; Tian, Y.; Gong, X.-G. Biochar and humic acid amendments improve the quality of composted green waste as a growth medium for the ornamental plant Calathea insignis. Sci. Hortic. 2014, 176, 70–78. [Google Scholar] [CrossRef]
  59. Beets, P.N.; Oliver, G.R.; Kimberley, M.O.; Pearce, S.H.; Rodgers, B. Genetic and soil factors associated with variation in visual magnesium deficiency symptoms in Pinus radiata. For. Ecol. Manag. 2004, 189, 263–279. [Google Scholar] [CrossRef]
  60. Heiskanen, J. Favourable water and aeration conditions for growth media used in containerized tree seedling production: A review. Scand. J. For. Res. 1993, 8, 337–358. [Google Scholar] [CrossRef]
  61. Conversa, G.; Bonasia, A.; Lazzizera, C.; Elia, A. Influence of biochar, mycorrhizal inoculation, and fertilizer rate on growth and flowering of Pelargonium (Pelargonium zonale L.) plants. Front. Plant Sci. 2015, 6, 429. [Google Scholar] [CrossRef] [PubMed]
  62. Graber, E.R.; Harel, Y.M.; Kolton, M.; Cytryn, E.; Silber, A.; David, D.R.; Tsechansky, L.; Borenshtein, M.; Elad, Y. Biochar impact on development and productivity of pepper and tomato grown in fertigated soilless media. Plant Soil 2010, 337, 481–496. [Google Scholar] [CrossRef]
  63. Wenny, D.L.; Dumroese, R.K. A Growing Regime for Containerized Ponderosa Pine Seedlings; University of Idaho, Idaho Forest, Wildlife and Range Experiment Station: Moscow, ID, USA, 1987; p. 9. Available online: https://www.researchgate.net/publication/272828130 (accessed on 16 April 2018).
  64. Landis, T.D.; Tinus, R.W.; McDonald, S.E.; Barnett, J.P. Seedling Propagation. The Container Tree Nursery Manual: Agriculture Handbook 674; USDA Forest Service: Washington, DC, USA, 1998; Volume 6, 166p. Available online: https://rngr.net/publications/ctnm/volume-6 (accessed on 16 April 2018).
  65. Frenkel, O.; Jaiswal, A.K.; Elad, Y.; Lew, B.; Kammann, C.; Graber, E.R. The effect of biochar on plant diseases: What should we learn while designing biochar substrates? J. Environ. Eng. Landsc. 2017, 25, 105–113. [Google Scholar] [CrossRef]
  66. Kope, H.H.; Axelrood, P.E.; Sutherland, J.; Reddy, M.S. Prevalence and incidence of the root-inhabiting fungi, Fusarium, Cylindrocarpon and Pythium, on container-grown Douglas-fir and spruce seedlings in British Columbia. New For. 1996, 12, 55–67. [Google Scholar] [CrossRef]
  67. Unestam, T.; Beyer-Ericson, L.; Strand, M. Involvement of Cylindrocarpon destructans in root death of Pinus sylvestris seedlings: Pathogenic behaviour and predisposing factors. Scand. J. For. Res. 1989, 4, 521–535. [Google Scholar] [CrossRef]
  68. Sutherland, J.R.; Shrimpton, G.M.; Sturrock, R.N. Diseases and Insects in British Columbian Forest Seedling Nurseries; FRDA Report 065; Forestry Canada and British Columbia Ministry of Forests: Victoria, BC, Canada, 1989; p. 85. Available online: https://www2.gov.bc.ca/assets/gov/farming-natural-resources-and-industry/forestry/forest-health/diseases_and_insects_in_bc_forest_seedling_nurseries-complete.pdf (accessed on 18 March 2018).
  69. Dumroese, R.K.; James, R.L. Root diseases in bareroot and container nurseries of the Pacific Northwest: Epidemiology, management, and effects on outplanting performance. New For. 2005, 30, 185–202. [Google Scholar] [CrossRef]
  70. Heiskanen, J. Water status of sphagnum peat and a peat–perlite mixture in containers subjected to irrigation regimes. HortScience 1995, 30, 281–284. [Google Scholar]
  71. Heiskanen, J. Irrigation regime affects water and aeration conditions in peat growth medium and the growth of containerized Scots pine seedings. New For. 1995, 9, 181–195. [Google Scholar] [CrossRef]
  72. Pinto, J.R.; Dumroese, R.K.; Davis, A.S.; Landis, T.D. Conducting seedling stocktype trials: A new approach to an old question. J. For. 2011, 109, 293–299. Available online: https://www.fs.usda.gov/treesearch/pubs/38391 (accessed on 22 March 2018).
Figure 1. Organic matter (n = 5) for peat and peat amended with biochar powder (BC), pyrolyzed softwood pellets (PP), and composite wood−biochar pellets (WP) at rates of 25, 50, 75, and 100% (v v−1). Vertical boxes represent approximately 50% of the observations and lines extending from each box are the upper and lower 25% of the distribution. The solid horizontal line in the center of each box is the median value. Different letters indicate significant differences at α = 0.05.
Forests 09 00232 g001
Figure 2. Change (percentage points) of bale-dry sample volumes during wetting in cylinders from below (n = 3; mean ± standard deviation). Peat was amended with biochar powder (BC), pyrolyzed softwood pellets (PP), and composite wood−biochar pellets (WP) at rates of 0, 25, 50, 75, and 100% (v v−1). PP75 had no change (all values were zero) and PP100 was not measured.
Forests 09 00232 g002
Figure 3. Unsaturated hydraulic conductivity (n = 2) for peat amended with biochar powder (BC), pyrolyzed softwood pellets (PP), and composite wood−biochar pellets (WP) at rates of 0, 25, and 50% (v v−1).
Forests 09 00232 g003
Figure 4. Media sample volumes at three matric potentials in relation to the initial wet volumes (=100%) (n = 5) for peat amended with biochar powder (BC), pyrolyzed softwood pellets (PP), and composite wood−biochar pellets (WP) at rates of 0, 25, 50, 75, and 100% (v v−1).
Forests 09 00232 g004
Figure 5. Mean desorption water retention characteristics of the growing media (peat amended with biochar powder (BC), pyrolyzed softwood pellets (PP), and composite wood−biochar pellets (WP) at rates of 0, 25, 50, 75, and 100% (v v−1) in relation to the initial wet volume means (n = 5). At estimate of total porosity is plotted as water content at −0.01 kPa, with air-filled porosity determined as total porosity less volumetric water content at each matric potential.
Forests 09 00232 g005
Figure 6. Vectors representing the changes in relative morphological values (height; root-collar diameter, RCD; and root and shoot biomass) for seedlings grown in peat (endpoint) and peat amended with biochar powder (BC), pyrolyzed softwood pellets (PP), and composite wood−biochar pellets (WP) at rates of 25, 50, and 75% (v v−1; arrows) and supplied with either 20 (solid black line) or 80 (dashed green line) mg N. The control means for each N rate (low/high) are provided.
Forests 09 00232 g006
Table 1. Initial, mean (n = 5) pH, bulk density (Db), and effective cation exchange capacity (ECEC) for peat amended with biochar (BC), pyrolyzed softwood pellets (PP), and composite wood-biochar pellets (WP) at rates of 0, 25, 50, 75, and 100% (v v−1). Different letters within a column indicate significant differences at α = 0.05.
Growing Media Designation(v v−1)(w w−1) apHDb (g∙cm−3)ECEC (cmol∙kg−1)
Peat (%)Biochar Amendment (%)Biochar Amendment (%)
Peat
Peat (control)1000-3.9g0.099j49.6a
Peat + biochar (BC)
BC257525105.0e0.173i31.0b
BC505050705.9c0.251g23.8c
BC752575906.7b0.294f15.4de
BC1000100100- 0.331d7.2gh
Peat + pyrolized softwood pellets (PP)
PP25752574.5f0.179i31.8b
PP505050695.4d0.264g17.8d
PP752575907.0a0.313e11.1f
PP1000100100- 0.318de5.2h
Peat + wood-biochar pellets (WP)
WP257525444.4f0.223h22.7c
WP505050814.7ef0.387c16.8de
WP752575945.2de0.469b13.2ef
WP1000100100- 0.527a10.4fg
P values <0.0001<0.0001<0.0001
a Estimated from bulk density measurements.
Table 2. Mean particle size distribution (%) of the peat, biochar powder (BC), pyrolyzed softwood pellets (PP), and composite wood−biochar pellets (WP) (n = 3).
Mean Particle Size Distribution (%)
(mm)
<0.50.5−11−22−5>5
Peat30.822.727.613.35.6
BC92.56.60.70.20.0
PP4.72.52.444.945.5
WP8.02.74.365.919.2
Table 3. Presswater extracts of ammonium (NH4), total nitrogen, nitrate (NO3), and organic nitrogen. All measured mg L−1. Ammonium and total N (n = 15 for each media) include all sampling days as the incubation day and the interaction with the media type was not significant (P > 0.05). Nitrate and organic N did have significant interactions between the media and date (P < 0.05), so the differences between each media treatment are shown for the three incubation dates. Different letters within a column indicate significant differences at α = 0.05.
MediaTotal NNH4NO3Organic N
Day 1Day 15Day 29Day 1Day 15Day 29
Peat17.9a13.0a1.60a0.70a0.27a5.04d3.85d3.19c
BC257.5bc1.1bc1.53ab0.01b0.01b5.60d5.91cd6.30b
BC506.9bc0.3c0.93abc0.01b0.01b4.56d7.00cd7.43b
BC753.5c<0.1c0.43c0.01b0.01b2.52e3.99d3.37c
PP2519.7a15.3a0.03c0.03b0.03ab5.73d3.81d3.63c
PP5010.8b6.7b0.02c0.02b0.04ab4.66d3.74d3.75c
PP755.5bc1.8bc0.07c0.04b0.03ab4.24de3.79d2.99c
WP259.3bc<0.1c0.49bc0.01b0.01b10.67c8.76c7.96b
WP5017.7a0.2c1.53ab0.05b0.06ab22.20b13.51b15.31a
WP7519.7a0.1c1.02abc0.26ab0.07ab27.45a17.70a14.28a
Table 4. Mean total element concentrations (mg kg−1) in peat, biochar powder (BC), pyrolyzed softwood pellets (PP), and composite wood−biochar pellets (WP) prior to mixing the growing media (n = 5); soluble nutrients (mg kg−1) in each growing media after 29 days of moist incubation (n = 5); and elements in the press water extract (mg L−1) of each growing media after 29 days of moist incubation (n = 5).
AlBCaCdCrCuFeKMgMnNaNiPPbSZn
Total
Peat10365.566150.111.42.316194461131150821.85232.2211122
BC16417.04694<0.1198.48.0110843405091398210.71793.311716
PP1788.2999<0.110.93.123018681651008560.5238<2.1459.6
WP9310.62642<0.1198.75.811682540363981485.22772.614018
Soluble
Peat262.85347---9.536110451344136-91-338-
BC25185.83666---8.925704357679-44-156-
BC50166.63062---12.830442746264-36-104-
BC75137.02440---22.230401775352-32-77-
BC10037.11522---93.928901204143-25-51-
PP25113.93614---3.71081780101426-106-254-
PP5064.51928---1.2151233365586-103-152-
PP7565.11074---0.6158016848634-114-102-
PP100115.4809---2.3152411443621-117-91-
WP25205.72492---11.8140836067140-87-109-
WP50176.21964---14.6168026757140-99-72-
WP75136.21456---31.9169019146131-106-49-
WP10056.21186---48.3159013739128-108-57-
Press water extract
Peat0.380.120<0.0010.010.0000.5117170.005<0.015340.04
BC250.530.57<0.0010.050.0131.7931<15<0.018<0.015200.02
BC500.670.512<0.0010.120.0372.91551<160.0210<0.01570.02
BC750.120.342<0.0010.070.0051.72507180.014<0.0153<0.01
BC100----------------
PP250.390.36<0.001<0.010.0060.5602<139<0.0121<0.005440.02
PP500.400.44<0.001<0.010.0070.5781<151<0.0130<0.005380.02
PP750.300.33<0.001<0.010.0070.3751<152<0.0119<0.005240.02
PP100----------------
WP250.580.423<0.0010.040.0092.713551160.0116<0.015270.07
WP501.750.653<0.0010.120.0056.3368141380.0336<0.015280.18
WP751.120.677<0.0010.110.0086.943020240.0430<0.015200.26
WP100----------------
Table 5. P-values for final seedling morphological characteristics.
Independent VariablesHeightStem DiameterShoot BiomassRoot Biomass
N fertilization (F)0.26720.13410.07840.6250
Medium (M)<0.0001<0.0001<0.0001<0.0001
F × M0.63680.0143<0.00010.0335
Table 6. Relative number of irrigation events for peat, biochar powder (BC), pyrolyzed softwood pellets (PP), and composite wood−biochar pellets (WP) substrates using a target water mass of 75%.
Percentage of Peat Replaced (v v−1)
0255075
Peat100
BC 887588
PP 101102100
WP 58

