Article

Spruce Budworm (Choristoneura fumiferana Clem.) Defoliation Promotes Vertical Fuel Continuity in Ontario’s Boreal Mixedwood Forest

1
Faculty of Forestry, University of Toronto, 33 Willcocks St., Toronto, ON M5S 3B3, Canada
2
Natural Resources Canada, Canadian Forest Service, Great Lakes Forestry Centre, Sault Ste. Marie, ON P6A 2E5, Canada
3
Faculty of Forestry, University of Toronto, 33 Willcocks St., Toronto, ON M5S 3B3, Canada
4
Department of Ecology & Evolutionary Biology, University of Toronto, 25 Willcocks Street, Toronto, ON M5S 3B2, Canada
*
Author to whom correspondence should be addressed.
Forests 2018, 9(5), 256; https://doi.org/10.3390/f9050256
Submission received: 15 February 2018 / Revised: 28 April 2018 / Accepted: 6 May 2018 / Published: 9 May 2018
(This article belongs to the Special Issue Wildland Fire, Forest Dynamics, and Their Interactions)

Abstract

:
Spruce budworm, Choristoneura fumiferana (Clem.), defoliation has been shown to affect the occurrence of crown fire in Ontario, highlighting the need to better understand the driving factors of this effect on forest structure, including changes in fuel loading, type and position. Here, we investigate five boreal mixedwood sites within four zones that experienced different durations of continuous defoliation by spruce budworm in northeastern Ontario. Duration of defoliation had significant effects on vertical stand components, namely, host overstory to host understory crown overlap, host overstory and host understory crown to downed woody debris overlap, and downed woody debris height and quantity. Vertical stand components tended to increase with the duration of continuous defoliation, with the highest vertical fuel continuity occurring after 16 years of continuous defoliation. Such increases in the vertical spatial continuity of fuels may be a key reason for the greater percentage of area burned in those forests which have recently sustained a spruce budworm outbreak.

1. Introduction

The spruce budworm, Choristoneura fumiferana (Clem.), periodically erupts into large-scale outbreaks during which its favoured host species, balsam fir (Abies balsamea), and to a lesser extent white spruce (Picea glauca) and black spruce (Picea mariana), are defoliated and killed [1]. This insect is a major biotic disturbance throughout the boreal forest in the province of Ontario, Canada. During its last major outbreak (1977–1987), the spruce budworm defoliated roughly 20 million hectares in Ontario [1] and depleted an average of 35 million cubic meters of host tree wood volume annually in Canada [2]. Research points to a large-scale outbreak cycle of variable length averaging about 35 years [3] and lasting between five and fifteen years [2]. Historical records showed that in Ontario the last major outbreak’s peak in defoliated area occurred around 1980 [1].
Severe and repeated spruce budworm defoliation is a major stress on forest stands [4] and can begin the process of stand breakdown. Defoliation usually begins at the top of the tree and becomes more extensive as budworm populations grow, with severity a function of the number of larvae feeding on the individual tree [5]. Several years of defoliation can remove the majority of foliage from crown branches [5], initially causing growth reduction, but eventually leading to tree crown mortality termed “top-kill” [5]. If only a few years of defoliation occur, a tree may completely recover; however, after five years of severe defoliation, full-tree mortality is likely to begin [6]. Partially eaten needles of live trees and needles from dying trees may be held in the tree crown by silk produced by budworms for feeding shelters. Reduced structural integrity in a dying or dead tree at first leaves the crown and branches susceptible to breakage from environmental stressors such as wind [7], gradually extending to the entire bole. After this, broken tree components may begin to accumulate suspended in the lower canopy or on the forest floor. The finer diameter elements of this suspended biomass are referred to as ladder fuels (i.e., biomass found above fuel accumulated on the forest floor and below the overstory crown) due to their ability to carry fire vertically into and above the overstory canopy [8]. As tree mortality and windthrow occur, canopy gaps allow previously suppressed trees to reach the canopy. The resulting canopy form will vary in initial composition, and in mixedwood forests a multilevel canopy can be expected [7]. Variable tree mortality rates among spruce budworm host tree species [5] provide a vertical distribution of biomass in differential amounts and stages of decomposition [9]. High levels of tree mortality, top-kill, and an abundance of dead leaf material in the canopy and on the ground represent the drastic shifts in distribution of flammable fuel types and loads that result from defoliation.
Changes in forest structure and the build-up of downed woody debris have been postulated to affect forest fire hazard [10], and historical records show the likelihood of large (>200 ha) fires to be greater during the short ‘window of opportunity’ following spruce budworm defoliation [11]. Study suggests that the potential for crown fire is likely greatest five to eight years following complete spruce budworm-caused stand mortality, largely due to stand breakdown and the accumulation of surface fuel [10]. After spring flush, the transition of surface fire to crown fire is inhibited by the moist deciduous and herbaceous vegetation layer up to four to five years after stand mortality, after which surface fuel accumulation overcomes this inhibition, making the height of surface fuels with respect to the herbaceous vegetation layer important. Previous work has shown that crown fire occurs disproportionately more often three to nine years following the end of spruce budworm defoliation in Ontario’s boreal forest, and that there is clear geographic variation in this ‘window of opportunity’: Fire begins later and lasts longer in western than in eastern parts of the region, with the difference being attributed to drier climates in the West [11]. The effect of a drier climate likely impacts fuel accumulation and decomposition directly, but may also operate indirectly on spruce budworm population dynamics and host tree composition (i.e., greater ratio of white spruce to balsam fir in the western compared to the eastern region). Subsequent analysis has shown that lagged spruce budworm defoliation (8–10 years) increases the probability of fire ignition, confirming previous conclusions [12].
Vertical fuel continuity describes the vertical spatial distribution of fuels within a stand. Limited attention has been placed on understanding the vertical position of fuels within the fuel ladder and surface stratums, as well as on how the amount and position of those fuels change, with respect to the duration of spruce budworm defoliation. Smaller vertical gaps between surface, ladder, and crown fuels indicate a more vertically continuous fuel. An understanding of such structural changes due to spruce budworm defoliation at the stand-level may point to one of the key driving factors behind landscape-scale observations [11,13], and help highlight the areas where risk of a large forest fire is elevated due to spruce budworm defoliation.
In Ontario, historical fire records show that the vast majority of forest fires burn relatively small areas. Stocks (2018, personal communication) deduced that most of these small fires burn along the surface and only rarely establish themselves in the crown. While relatively few forest fires involve the crown in a substantial way, those few fires that do cause the vast majority of the total area burned [14]. Studies suggest that vertical fuel continuity is an important factor in allowing what began as a surface fire to establish itself in the crown [10,15].
Here, we focus on factors that may contribute to the spruce budworm–crown fire interaction at the stand level. Specifically, we begin to quantify how an increase in duration of defoliation by spruce budworm alters fuel loads and leads to the re-arrangement of fuels in ways that can impact a stand’s propensity to support a crown fire.

2. Materials and Methods

2.1. Study Area

The study took place in a forested area over 150 km to the northeast of Warren, Ontario (i.e., referred to as ‘Warren’), identified based on the duration of past spruce budworm defoliation and general forest characteristics. Spruce budworm defoliation was established using the Forest Insect and Disease Survey (FIDS) of the Canadian Forest Service (CFS) and the OMNR, which provided aerial mapping of moderate–severe defoliation between 1941 and 2009. Moderate–severe defoliation was considered here to be the loss of 40–100% of new foliage [16].
From the aerially mapped dataset, four zones of continuous, moderate–severe spruce budworm defoliation were identified, corresponding to zero (i.e., no mapped defoliation), four (2004–2007), eight (2000–2007), and sixteen (1993–2008) years. Each zone of defoliation was a minimum of 30 km from the next. The previous defoliation event experienced by each zone occurred from 1973 to 1984, respectively nineteen, fifteen, and eight years prior to the defoliation identified in the most recent zones of continuous defoliation. Forest characteristics were established using Forest Resource Inventory (FRI) data provided by the Ontario Ministry of Natural Resources (OMNR) (Table 1). These data were collected in 1989 (three years prior to the commencement of the most recent period of spruce budworm defoliation), and showed the vegetation type to be boreal mixedwood composed of host (i.e., balsam fir, white spruce, black spruce) and non-host (i.e., sugar maple (Acer saccharum), trembling aspen (Populus tremuloides), white cedar (Thuja occidentalis), white birch (Betula papyrifera) and yellow birch (Betula alleghaniensis)) trees. According to the FRI data, mean dominant (or co-dominant) tree age of the stands selected in the defoliation zones ranged from 68 to 111 years and from 12 to 18 m in height. Mean host composition ranged from 30% to 50%.

2.2. Site Selection

Earlier work [11] focused on the time lag between the end of spruce budworm defoliation and the subsequent occurrence of a large fire in that area, without regard to the length of the defoliation period. Here, we chose zones that had been continuously defoliated for various lengths of time in order to measure the effect of defoliation duration on subsequent fuel characteristics that influence a stand’s ability to sustain a crown fire. Within each defoliation zone (i.e., areas defoliated continuously for zero, four, eight, and sixteen years according to the FIDS defoliation maps), five sites representing independent stands were randomly selected for data collection. These sites were measured in July 2011. We ensured that each of the sites had a minimum host tree composition of 20%, and dominant or co-dominant tree age of 50 years as defined by the FRI data collected from the study area in 1989 (Table 1). The sites also fell within Ontario’s Intensive Fire Management Zone, and did not show signs of recent fire. We included five more sites per zone to estimate the frequencies with which dead, top-killed, and topped trees occurred. These sites were measured in May 2011. Latitudinal and longitudinal coordinates were recorded (Table 1) using a handheld global positioning system (GPS) with an accuracy varying according to signal quality (i.e., error < 15 m). Coordinates corresponded to a randomly selected point at 0 m on a 30-m transect that ran as a North–South transect, and was used for data collection.

2.3. Data Collection

For the sites measured in each defoliation zone, forest structural data were collected from three points along a 30-m transect (0 m, 15 m, 30 m). Sampling methods followed those previously established [17] and used the point-centered quarter method [18] to inventory host overstory and understory trees. Species type (i.e., non-host, balsam fir, white spruce, black spruce) was also identified. The five sites measured in July were the basis for all analyses with the exception of the inventory of the state of trees. An additional five sites per defoliation zone, those measured in May, were included for that analysis. The vertical forest characteristics measured near Warren, and discussed throughout this study, are presented in Figure 1.
Data collected for all host trees included: the distance from the transect reference point, diameter at breast height (DBH), height (H), live crown base height (LCBH), dead crown base height (DCBH), and crown base height (CBH). Distance from the transect and DBH were measured for host overstory trees having a DBH ≥ 3.0 cm. Height was measured using a clinometer for the overstory tree in the first quadrant at each point, and all other tree heights were visually estimated by reference to the measured tree. LCBH was defined here as the lowest height of live foliage and DCBH as the lowest height of dead branches, dead foliage, and lichen visually estimated to sustain vertical fire propagation. Both LCBH and DCBH were measured using a tape if possible, or otherwise visually estimated. Visual estimation of base heights was used when the tape had reached the horizontal plane of the base height from an unobstructed location, in instances when there was a vertical obstruction. In this study, we define crown base height (CBH) as a combination of live and dead crown heights, where live crown base heights were included for live trees, and dead crown base heights for dead trees.
The status of host overstory trees was also assessed. Defoliation was visually estimated as the percentage per branch of absent needles compared to the undefoliated state, then averaged for the entire tree. While this gives a robust estimate of crown foliar fuel load, it differs from the FIDS’ method of measurement (i.e., percentage of new foliage lost), and may provide a higher estimate of defoliation. The health of each tree was assessed following an existing classification system [19] and categorized as either: (i) “Affected” including all dead trees (i.e., stages 3, 4, 6, 7), topped trees (i.e., stage 2), and trees experiencing top-kill (i.e., stage 2); (ii) “Dead” including all dead (i.e., stages 3, 4, 6, 7) and topped trees (i.e., stage 2); and (iii) “Top-kill” trees including only those experiencing top-kill (i.e., stage 2). The categories were not mutually exclusive. The occurrence of suspended woody debris (SWD), fallen branches or upper stems caught in lower stand branches, was recorded for each host tree at the five sites per defoliation zone measured in July.
Measurement of the surface region was important to understand the lower section of the vertical fuel continuum. Downed woody debris height (DWDH) and the maximum height of the herbaceous plant matter were measured at 3-m intervals along the first 15 m of each 30-m transect. DWDH was defined here as the height above ground of the highest branch, bole or foliage that had fallen to the ground. A count of downed woody debris with a diameter of 7.0 cm or greater that crossed the transect was recorded following the line-intersect method [20]. Pieces assessed as sound (i.e., class 1,2) were recorded [19].

2.4. Statistical Methods

The experimental design was stratified, with balanced, random sampling within strata. Data analysis involved comparison of mean forest structural characteristics among treatment groups (i.e., defoliation zones) to determine if any significant differences existed. A one-way analysis of variance (ANOVA) and then a Tukey’s post-hoc test were used to compare differences in means for the following variables: host overstory tree composition and dominant tree age obtained from FRI data. Yet some variables were not normally distributed and did not have equal variance. For these variables (i.e., stand density, defoliation extent, occurrence of affected trees, occurrence of suspended woody debris, down woody debris height, vertical forest structure, and the overlap of key forest components) a non-parametric one-way comparison of means was performed using the Kruskal-Wallis rank sum test. A post-hoc, pairwise comparison using the Wilcoxon rank sum test was used to test for differences among means. To describe the occurrence of a trend categorically, contingency tables were created and tested with a Fisher’s exact test (labelled as “Fisher’s test”).
Linear regression was used to test for any significant trend with increased duration of defoliation. Dependent variables tested by regression described vertical forest structure and the overlap of key forest components. These dependent variables were normally distributed and of equal variance, and included: (a) host overstory to host understory crown overlap (host overstory CBH − host understory H); (b) host overstory and host understory crown to downed woody debris overlap (host overstory CBH − host understory H + host understory CBH − DWDH); (c) host overstory to downed woody debris overlap (host overstory CBH − DWDH); and d) host understory to downed woody debris overlap (host understory DCBH − DWDH). The independent variable was years of continuous defoliation.

3. Results

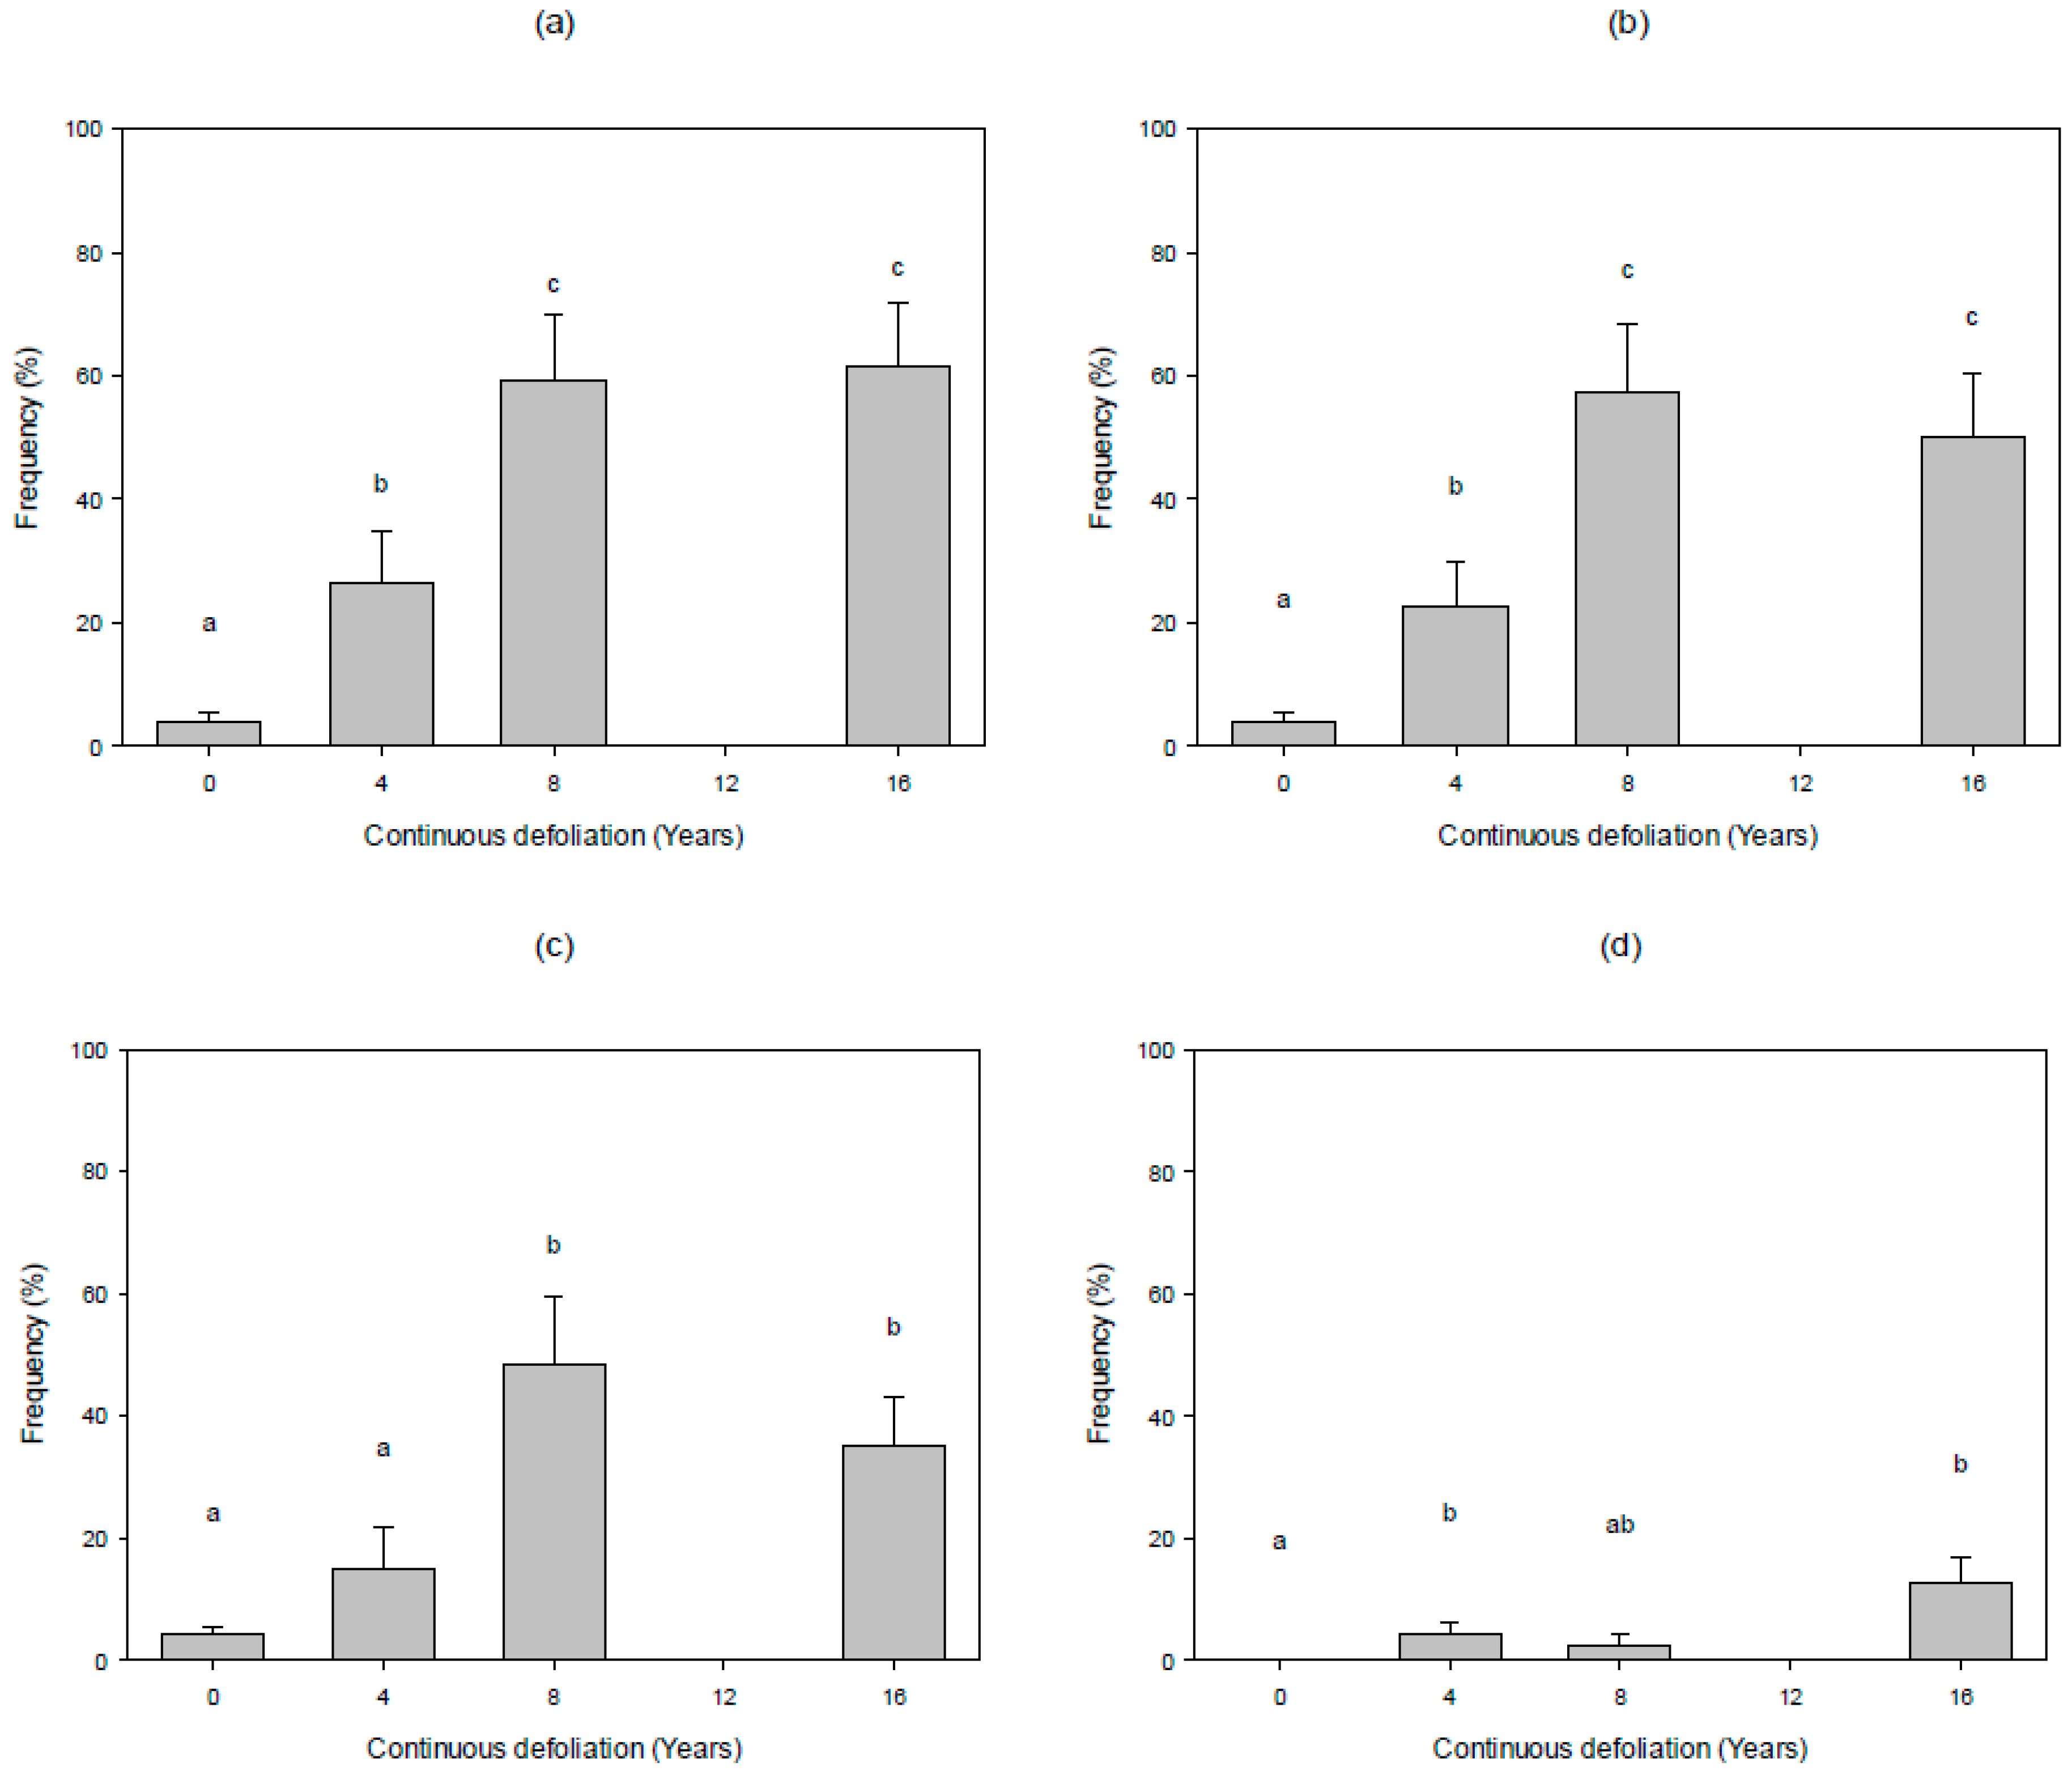
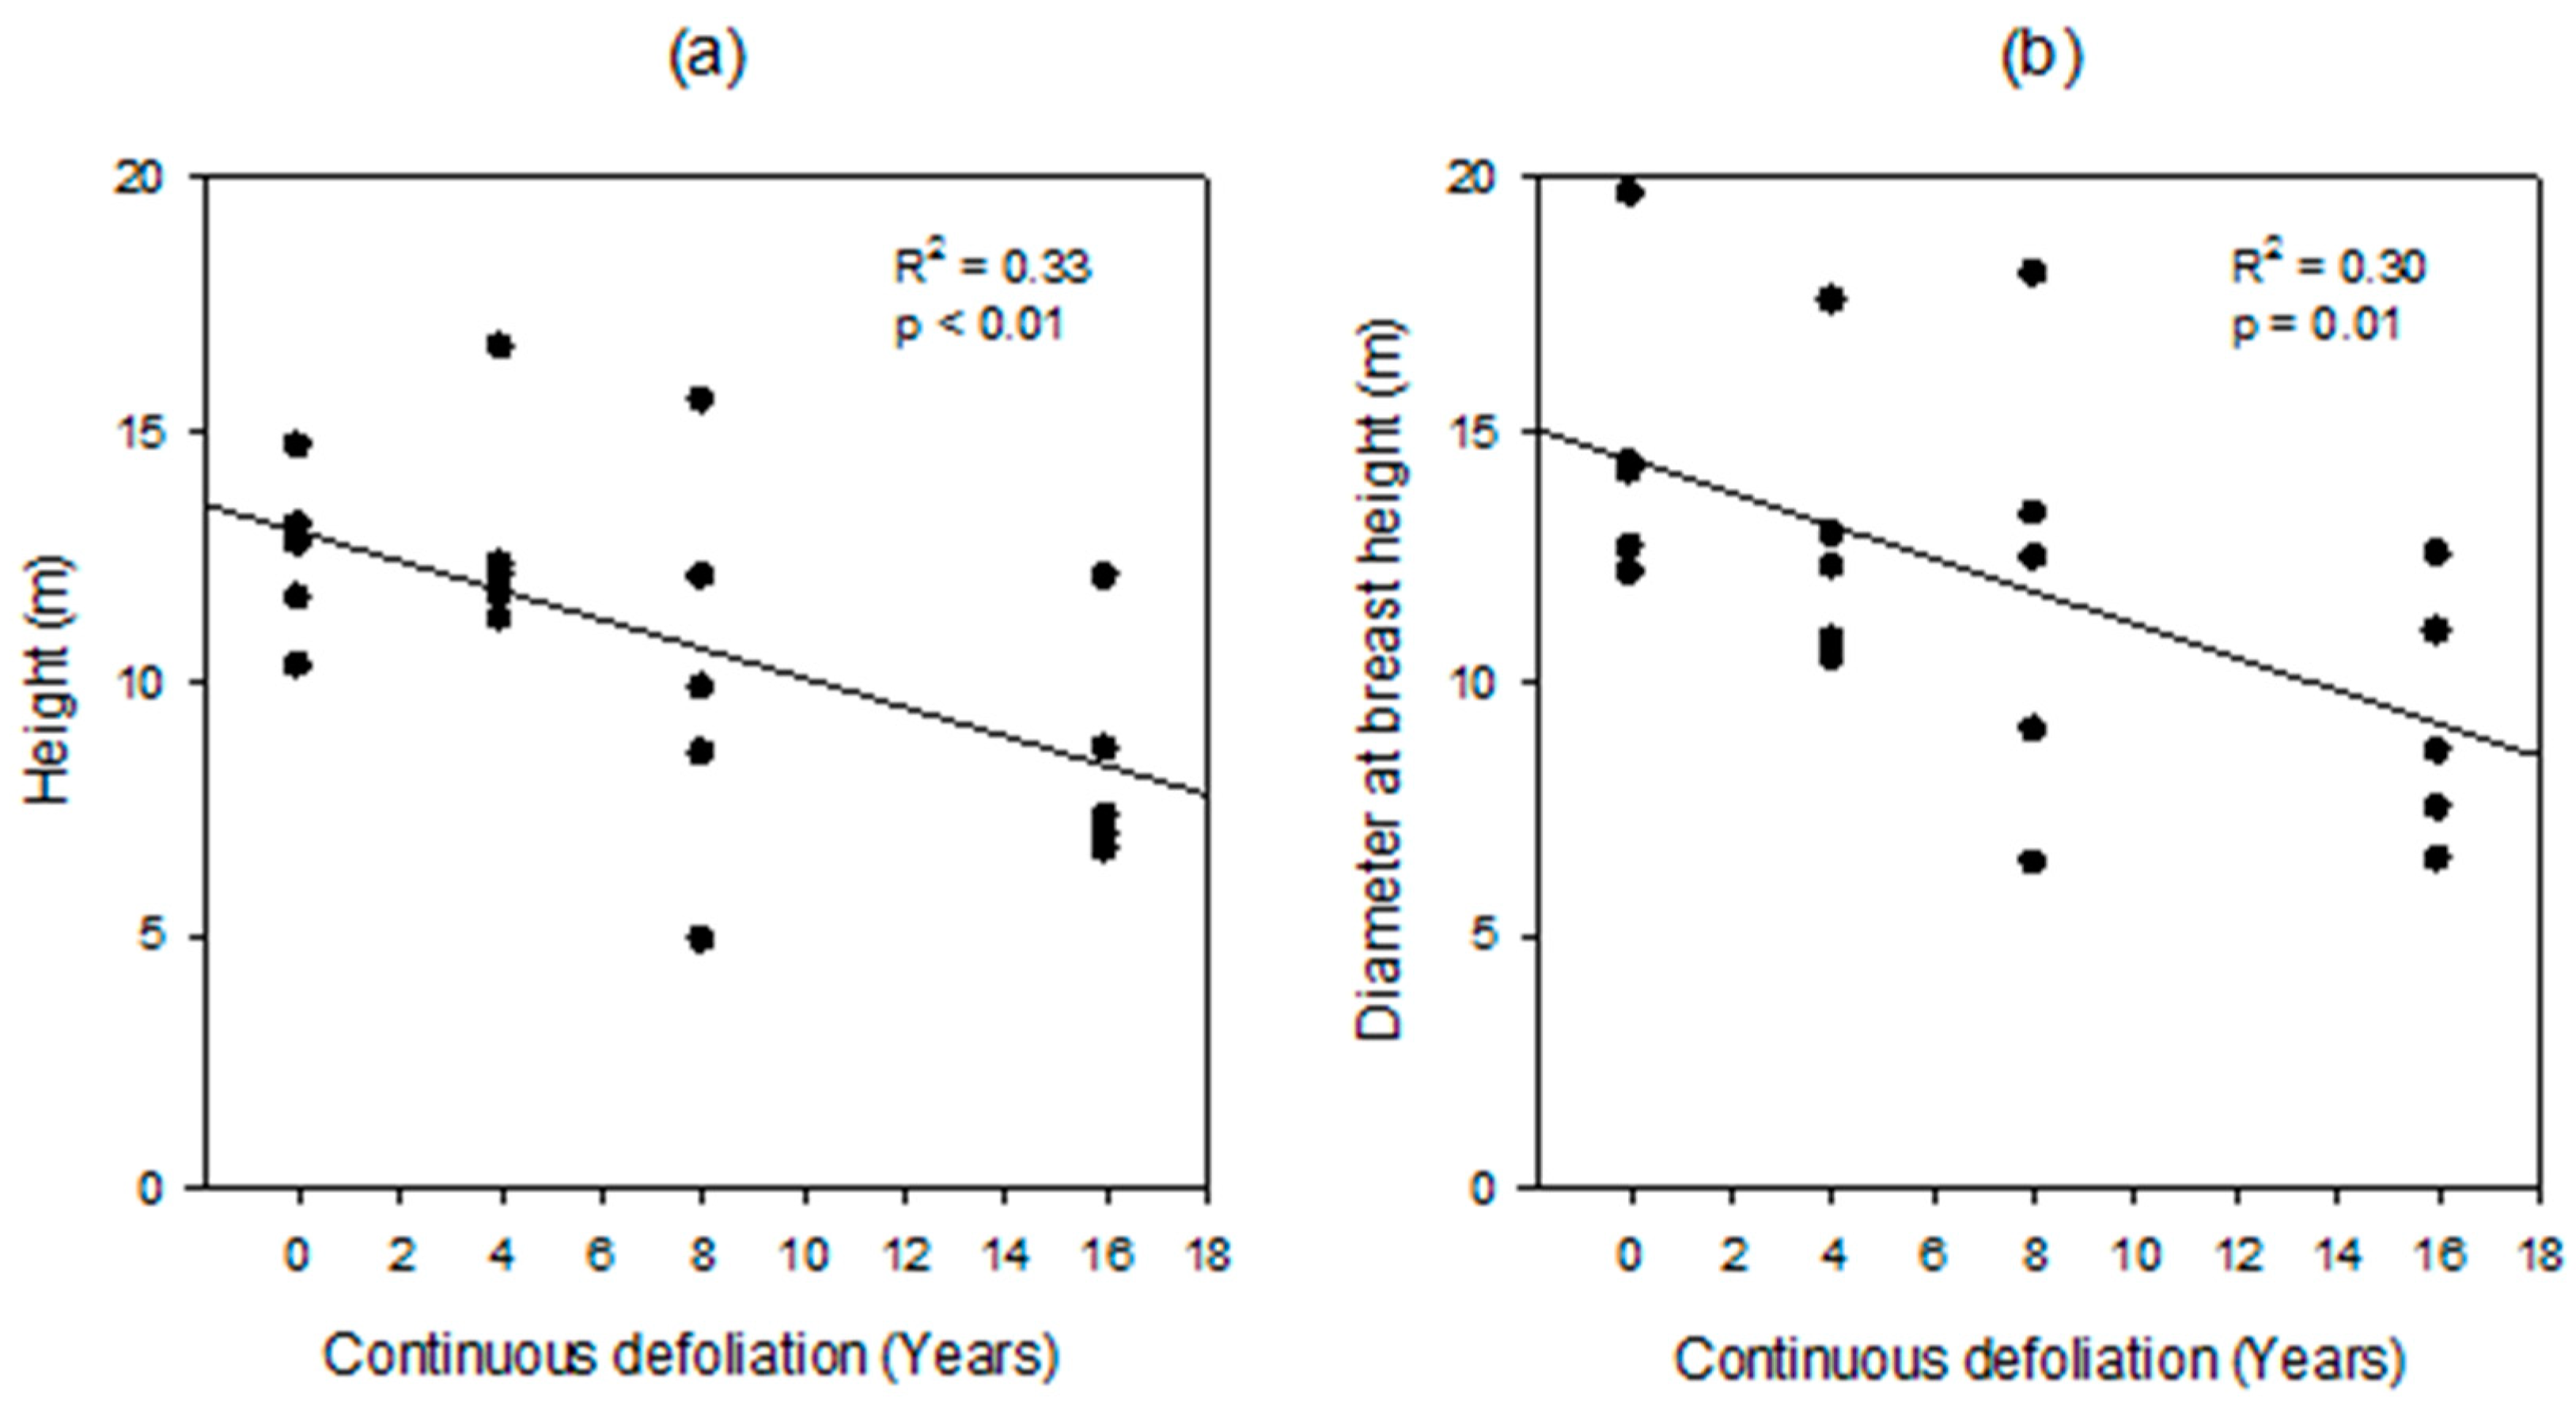
3.1. Forest Characteristics and Defoliation Duration

FRI data collected in 1989 showed general stand characteristics for the study sites, three years prior to the start of the most recent period of spruce budworm defoliation. Host overstory species composition did not significantly differ among defoliation zones (F3,16 = 1.149, p = 0.640). However, sites that later endured four years of continuous defoliation consisted of a significantly lower composition of balsam fir (Kruskal-Wallis H: 10.480, df: 3, n: 5, p = 0.013) than those that endured sixteen years. The zone of four years of continuous defoliation was also significantly greater in age than zones of eight and sixteen years of continuous defoliation (Kruskal-Wallis H: 15.387, df: 3, n: 5, p = 0.002 and Wilcoxon rank sum test; p < 0.05). Stocking did not significantly differ among defoliation zones (Kruskal-Wallis H: 4.075, df: 3, n: 5, p = 0.253). Dominant tree height prior to sixteen years of continuous defoliation was significantly less than eight years (F3,16 = 3.255, p = 0.049 and Tukey’s post-hoc test; p < 0.05).
Post-defoliation, stands were of similar density and dominated by host tree species (Table 2). Mean stand density and associated standard error of the mean (SEM) was 3321 stems/ha ± 103 stems/ha with a minimum of 50% host overstory composition. While the balsam fir component of host overstory trees varied among defoliation zones (Kruskal-Wallis H: 8.368, df: 7, p = 0.039), the overall density of balsam fir trees in each defoliation zone was not significantly different and averaged 1680 stems/ha ± 371 stems/ha (SEM). Independent (i.e., July) and pooled (i.e., May and July) stand densities were not significantly different (Kruskal-Wallis H: 6.69, df: 7, p = 0.46). Host understory trees were primarily balsam fir and to a lesser extent, white spruce. Mean host understory density was 903 (±174) stems per hectare, 2348 (±1947) stems per hectare, 1844 (±425) stems per hectare and 3624 (±854) stems per hectare in the zones of zero, four, eight and sixteen years of continuous defoliation, respectively.
The severity of spruce budworm defoliation and impact to stand structure tended to increase with duration of defoliation. Defoliation was greater in zones of four, eight and sixteen years of continuous defoliation than zero years (18% ± 3% SEM), with 50% ± 4% SEM, 52% ± 5% SEM, 63% ± 4% SEM respectively (Kruskal-Wallis H: 71.930, df: 3, n: 60, p < 0.001 and Wilcoxon rank sum test; p < 0.05) with zone sixteen showing the greatest defoliation (Wilcoxon rank sum test; p < 0.05). The occurrence of trees showing symptoms of spruce budworm defoliation (i.e., affected trees) tended to increase to eight years of continuous defoliation (Figure 2) and was significantly greater than after zero and four years (Kruskal-Wallis H: 22.194, df: 3, n: 10, p < 0.001 and Wilcoxon rank sum test; p < 0.05). The percentage of dead and topped trees followed a similar trend (Dead Kruskal-Wallis H: 21.305, df: 3, n: 10, p < 0.001, Wilcoxon rank sum test; p < 0.05 and Topped Kruskal-Wallis H: 20.929, df: 3, n: 10, p < 0.001 and Wilcoxon rank sum test; p < 0.05). Top-kill peaked after sixteen years of continuous defoliation, and was significantly greater than after zero and four years (Kruskal-Wallis H: 11.98, df: 3, n: 10, p < 0.01 and Wilcoxon rank sum test; p < 0.05).
A spike in suspended and downed woody debris reflected the occurrence of dead and topped trees. The quantity of suspended woody debris after sixteen years was significantly different from all other years in both the host overstory and host understory (Overstory Kruskal-Wallis H: 9.78, df: 3, n: 5, p = 0.02, Wilcoxon rank sum test; p < 0.05 and Understory Kruskal-Wallis H: 11.95, df: 3, n: 5, p < 0.01, Wilcoxon rank sum test; p < 0.05). The height of downed woody debris was significantly greater after eight and sixteen years than zero years (Kruskal-Wallis H: 22.169, df: 3, n: 25, p < 0.001, Wilcoxon rank sum test; p < 0.05; Figure 3) and surpassed the height of the herbaceous layer after four and eight years (Kruskal-Wallis H: 11.22, df: 3, n: 25, p = 0.01, Wilcoxon rank sum test; p < 0.05).

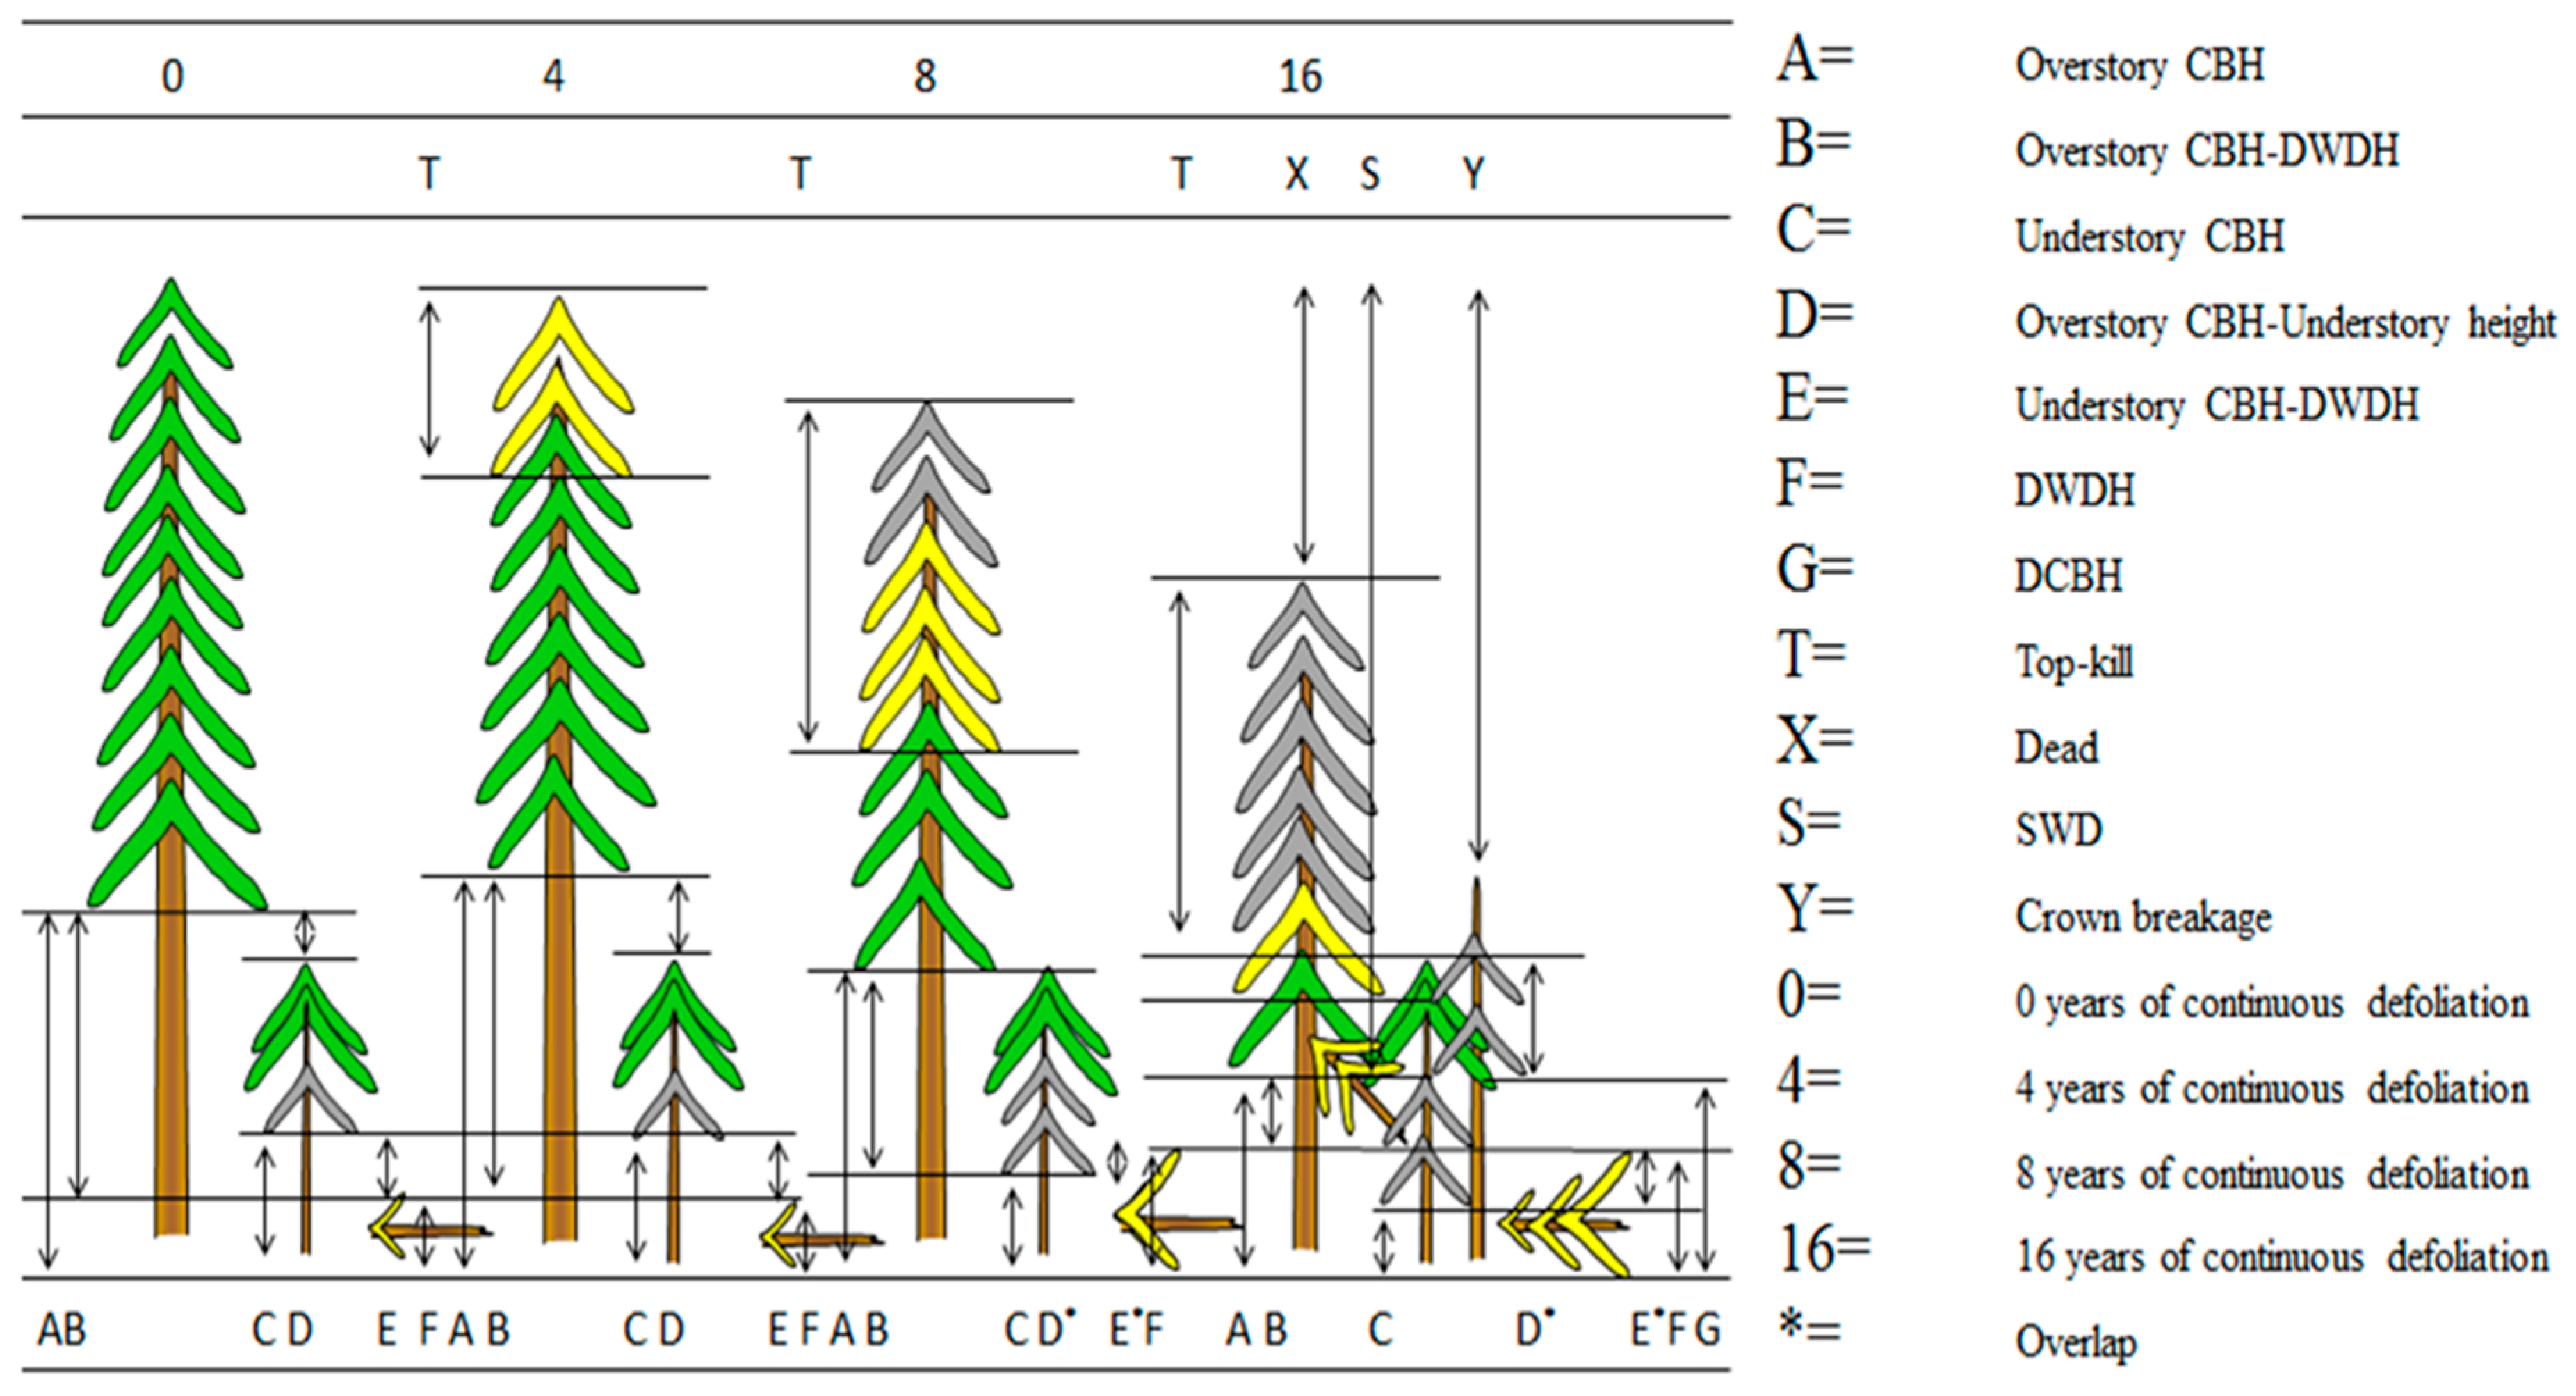
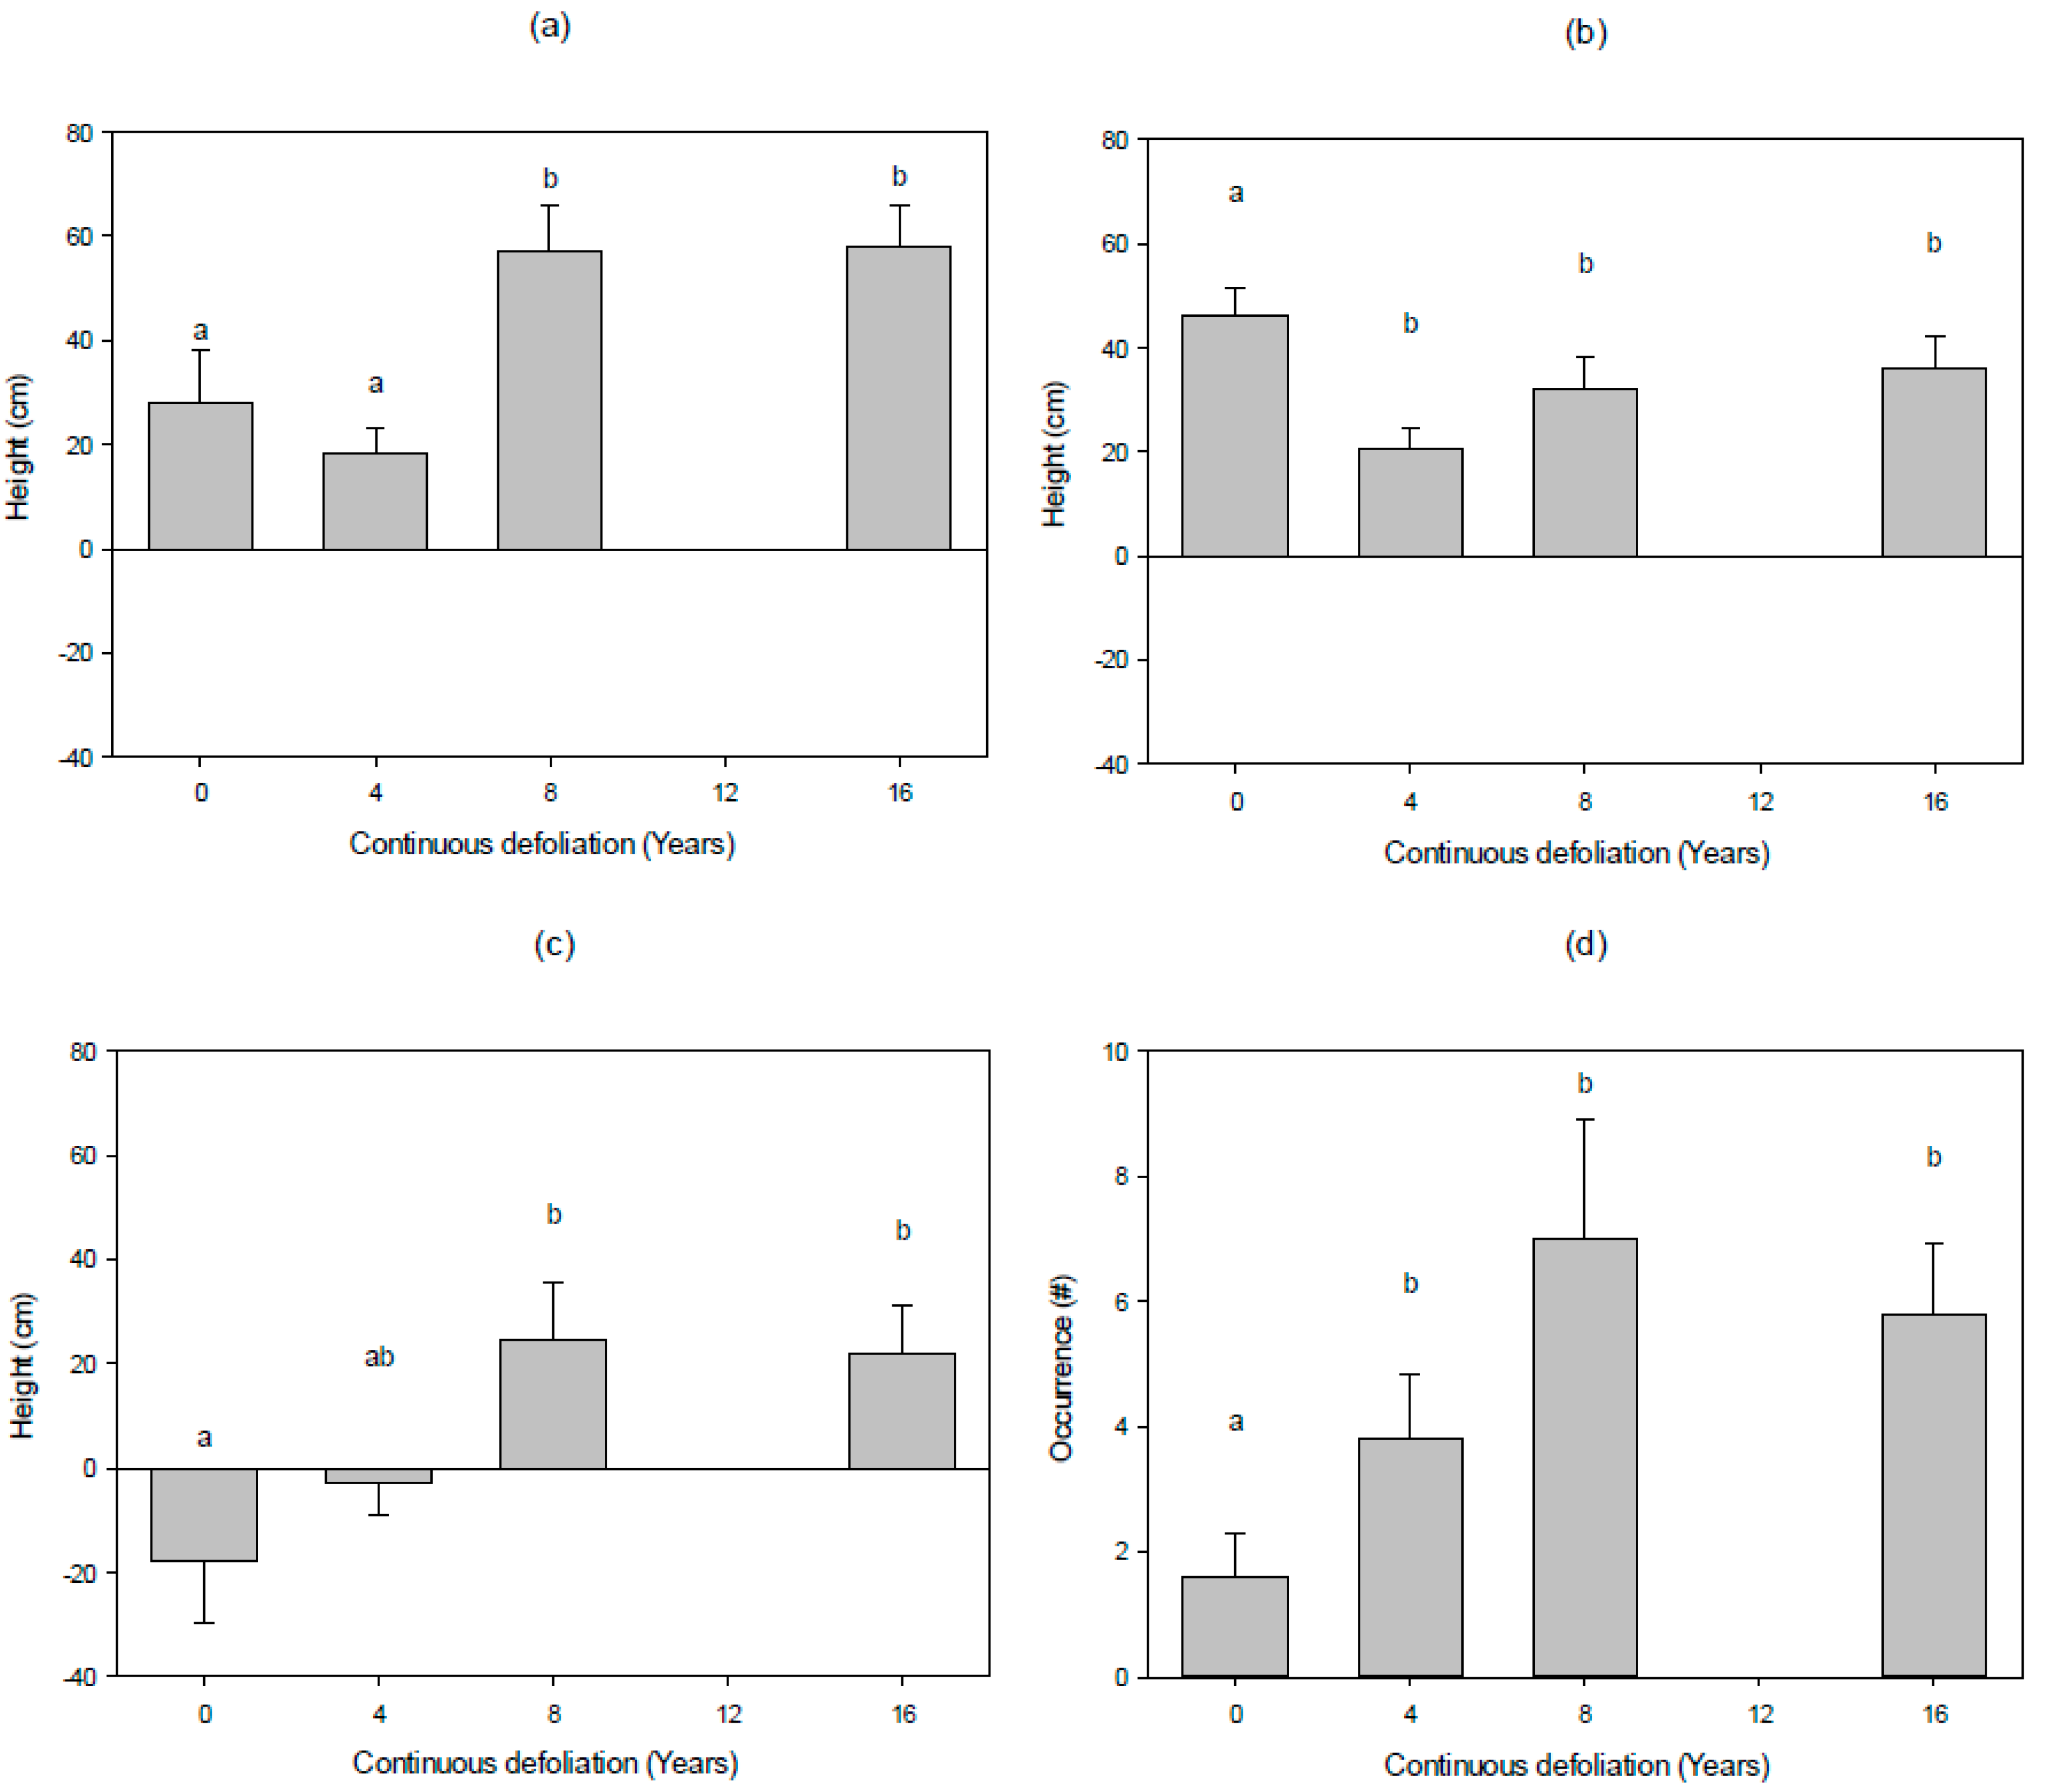
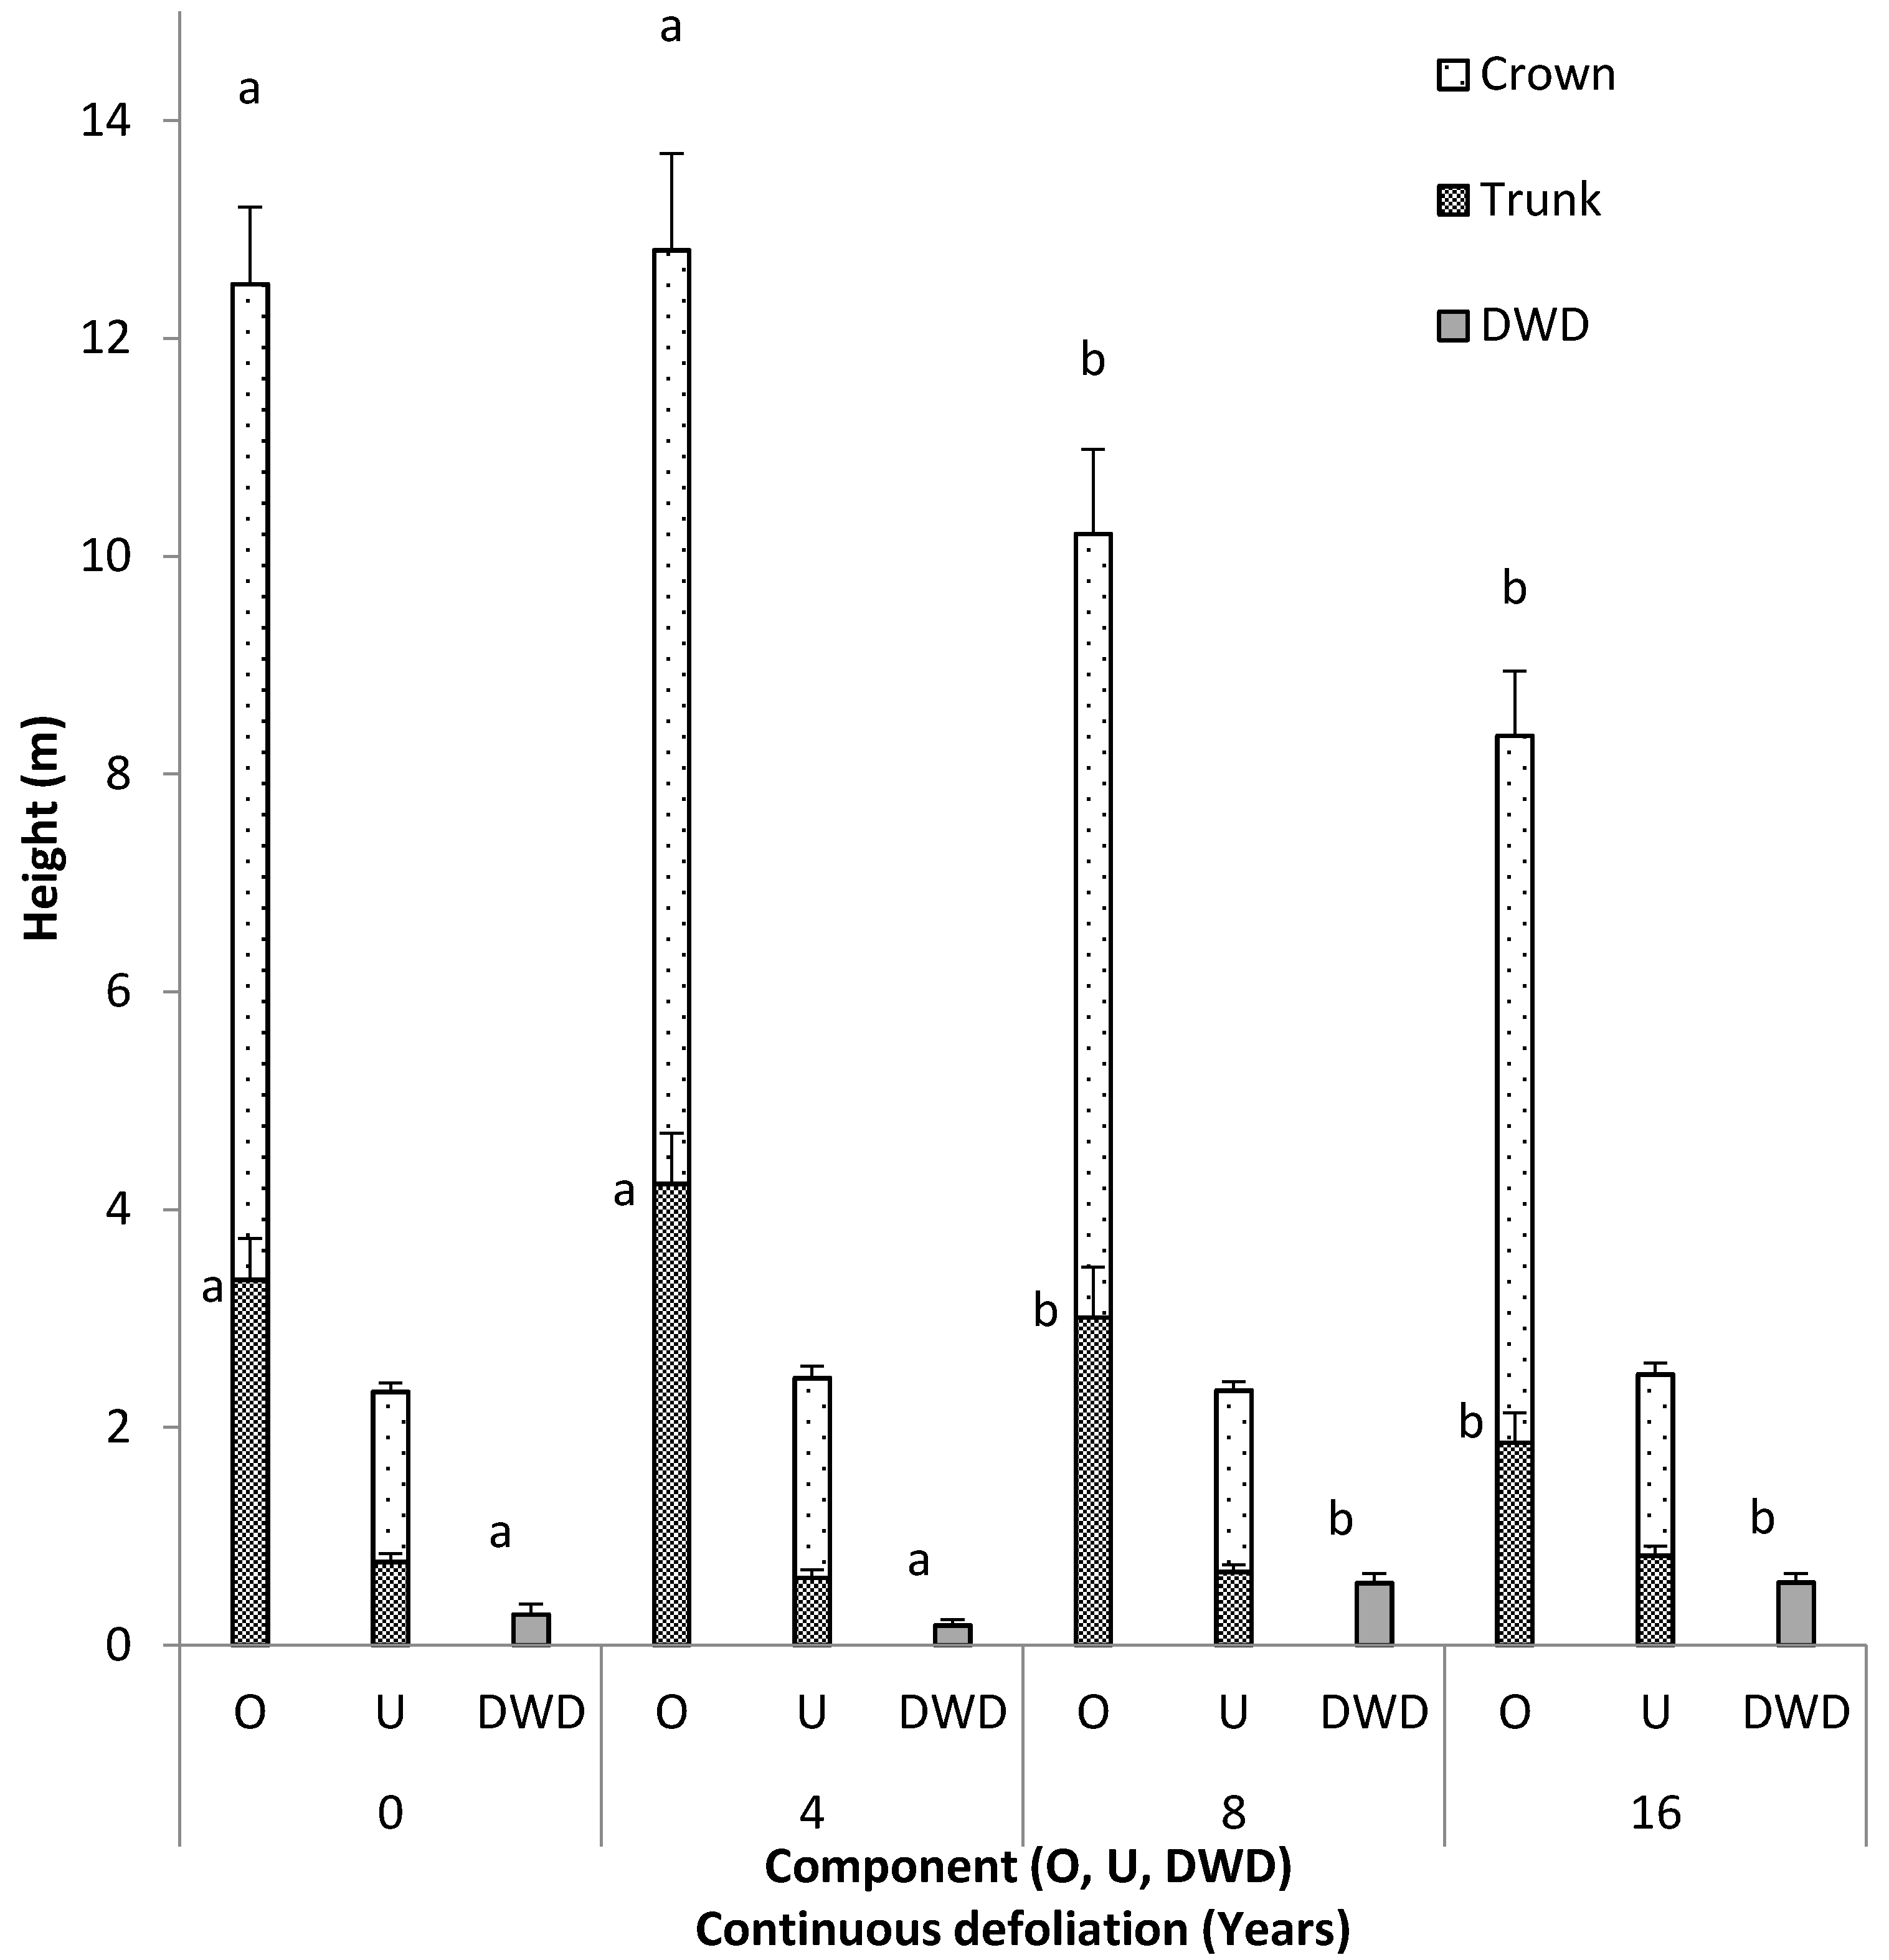
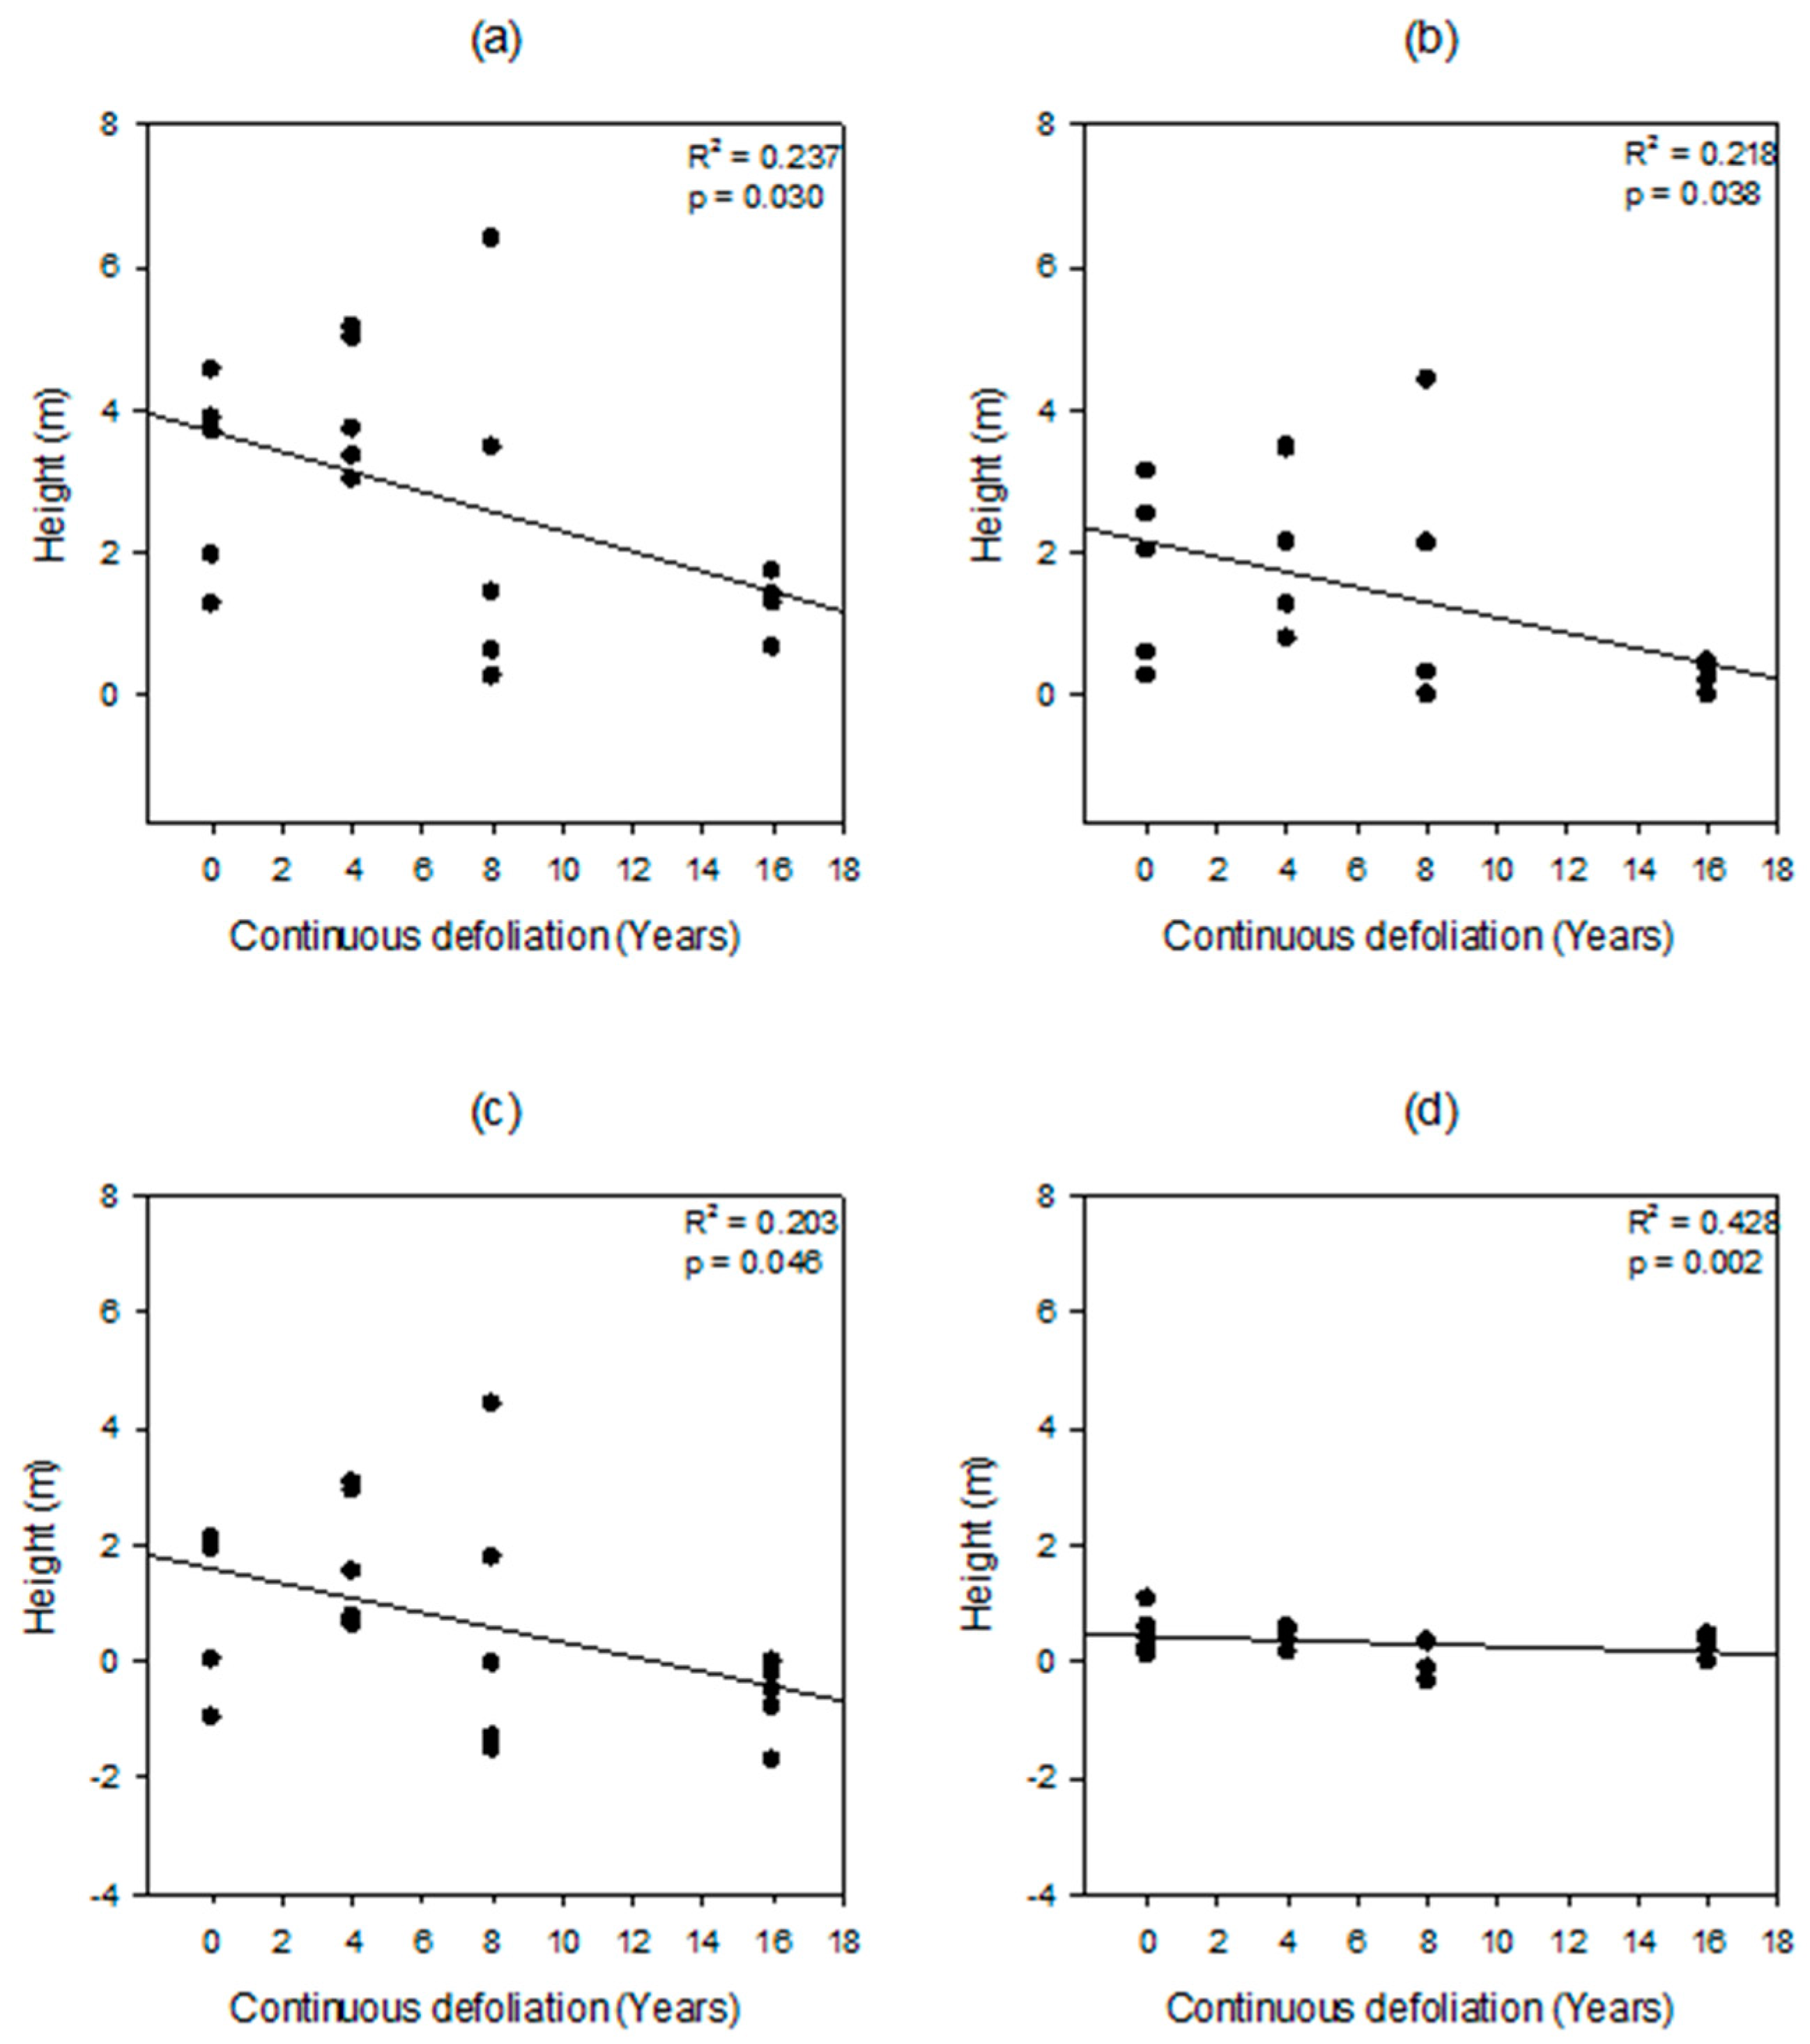
3.2. Vertical Fuel Continuity

Aspects of vertical forest structure responded to variation in defoliation duration (Figure 4). Defoliation duration significantly predicted the observed decrease in host overstory height (R2 = 0.33, F3,17 = 8.84, p < 0.01) and diameter at breast height (R2 = 0.30, F3,17 = 7.81, p = 0.01). After eight and sixteen years, top height and crown base height were significantly lower than after zero and four years (Kruskal-Wallis H: 21.469, df: 3, n: 60, p < 0.001, Wilcoxon rank sum test; p < 0.05 and Kruskal-Wallis H: 24.351, df: 3, n: 60, p < 0.001, Wilcoxon rank sum test; p < 0.05, respectively). There was no significant difference in host understory heights.
Vertical fuel continuity among defoliation zones was assessed by determining the overlap of key stand components (Figure 5). The gap between host overstory and host understory crowns decreased with increasing years of defoliation such that after sixteen years of continuous defoliation, the vertical components overlapped. Overlap of host overstory and host understory crowns (i.e., the ladder region) occurred in all sites (Fisher’s test p < 0.01) and in 49 of 60 quadrants (Fisher’s test p < 0.001) after sixteen years. The gap between host tree crowns and downed woody debris was smaller after eight and sixteen years of continuous defoliation than zero and four years for both the host overstory (Kruskal-Wallis H: 38.003, df: 3, n: 60, p < 0.001, Wilcoxon rank sum test; p < 0.05) and host understory (Kruskal-Wallis H: 19.951, df: 3, n: 60, p < 0.001, Wilcoxon rank sum test; p < 0.05). Host understory dead crowns overlapped downed woody debris height after eight and sixteen years of defoliation (Kruskal-Wallis H: 122.202, df: 3, n: 60, p < 0.001, Wilcoxon rank sum test; p < 0.05). These results were supported by regression analysis (Table 3 and Figure 6).

4. Discussion

4.1. Forest Characteristics and Defoliation Duration

Tree mortality can be expected to begin after four to five years of moderate–severe spruce budworm defoliation, but will vary with forest composition and age [6]. After the onset of spruce budworm defoliation, stressed trees begin to experience crown breakage and windthrow, and the amount of freshly fallen, woody debris begins to accumulate above normal background levels [10]. We observed such accumulation of downed woody debris as the frequency of stressed, dying and dead trees increased with the duration of defoliation. This suggests that spruce budworm defoliation drove stand breakdown.
The accumulation of downed woody debris has implications for surface fire intensity. In our study, downed woody debris with a diameter ≥ 7.0 cm was used as a surrogate for understanding, in a relative sense, the amount of finer branch woody debris present (i.e., the material < 1.0 cm in diameter that would be consumed in flaming) for each defoliation zone. The build-up of downed woody debris in the larger size class (i.e., ≥7.0 cm) with the duration of defoliation suggests a greater presence of fuels consumed in flaming. Such an increase in available surface fuel loads would increase surface fire intensity [15]. However, it is important to be cautious here as smaller-diameter fuels may accumulate faster and decompose sooner than larger diameter fuels. As has been shown, the rapid decomposition of finer branch woody debris may limit any increase in the likelihood of fire despite the gradual accumulation of larger-diameter fuels following spruce budworm-caused stand mortality in wet regions of eastern Canada [21]. Thus, varying rates of decomposition can limit the accuracy of this relative comparison.
As a result of crown breakage and mortality, downed woody debris increased in both quantity and height with the duration of defoliation. After eight years of defoliation, downed woody debris height surpassed that of the herbaceous layer. This is important because the high-moisture leaves of the herbaceous layer may have a dampening effect on crown fire initiation. In a previous study, such a phenomenon was suggested as a possible contributing factor in the limited crowning observed during summer months for spruce budworm-defoliated stands [10]. However, when downed woody debris surpasses the herbaceous layer, as we observed, the dampening effect may be overcome.
The increase in suspended woody debris with the increase in the duration of continuous defoliation may also be attributed to the stand degradation caused by defoliation. Dispersing spruce budworm moths have been found to vertically drop from the horizontal air column [22]. Therefore, trees that reach higher into the canopy may be easy targets for oviposition by dispersing moths, making the upper canopy a likely site of oviposition. The abundance of eggs and the close proximity to present-year needles [23] may also make the upper canopy a favored feeding area for larvae. The preference for spruce budworm to defoliate mature, and taller, host trees [5] may have opened the canopy through defoliation, crown breakage, and the mortality of taller trees. Such an opening could promote the recruitment of immature, shade-tolerant spruce and balsam fir that were suppressed in the understory prior to disturbance [24,25], and explain the dense layer of immature host overstory trees (3–9 cm in DBH) and host understory trees (3624 stems per hectare) observed after 16 years of continuous defoliation. This layer may have also offered greater opportunity for the suspension of woody debris with a net-like effect as crown breakage progressed. The spike in suspended woody debris after 16 years of defoliation may also have been due to the greater composition of younger balsam fir and white spruce initially present, whose branches may have caught the falling trees, crowns, and branches of the mature generation that stood above.

4.2. Vertical Fuel Continuity

The accumulation of biomass in the surface and ladder fuel regions of a forest has implications for the transfer of fire from the surface to the crown region [15]. Greater fuel loads on the surface support higher energy surface fires, and consequently longer flames that are able to reach higher and approach the canopy [15]. While the increase in fuel quantity may have an even greater effect on fire behaviour, fuels above the surface help propagate surface flames upward towards the canopy, but at relatively lower energy levels. A continuous connection of fuel from the surface to the ladder to the crown region of a forest would therefore facilitate the climb of lower energy flames. Where overlaps occur (e.g., the host understory dead crown sat below the high point of downed woody debris), continuity will be enhanced, and where gaps occur (e.g., the host understory dead crown sat above the high point of downed woody debris), continuity will be reduced.
Fuel continuity increased with the duration of continuous defoliation. After 16 years, host overstory crowns overlapped host understory crowns, and host understory dead crowns overlapped downed woody debris. The reduced tendency for individual trees to shed their lowest branches as stands open and the recruitment of younger trees into the developing overstory gaps as crown breakage progresses may have contributed to the reduction in both host overstory height and crown base height. The defoliation of larger host trees likely deposited increased downed woody debris in close proximity and likely increased the probability that under these trees the downed woody debris height was greater than the height of the herbaceous layer. The combined effect here would suggest an increase in the probability that a surface fire would reach the crown of the larger host trees where additional continuity exists.
Previous study has found that large fires (>200 ha) were more likely to occur during a window of opportunity three to nine years following the cessation of spruce budworm defoliation, without regard to the length of the defoliation period [11]. The data in our study were gathered four and three years following the end of defoliation periods lasting zero, four, eight and sixteen years, which aligns closely with the beginning of the proposed ‘window of opportunity’ [11]. The increase in the parameters measured (i.e., vertical continuity) with progressive annual defoliation suggests that consideration of defoliation length may provide further resolution to these findings. More specifically, stand breakdown, surface fuel accumulation and vertical continuity were greater after sixteen years than four years of continuous defoliation. While the likelihood of large fires may increase three years after any length of defoliation, the likelihood of large fires occurring within the window of opportunity may be greater if the period of defoliation is longer. Determining the impact of the parameters measured here on the likelihood that a surface fire will transition to a crown fire presents a valuable area of further investigation.

4.3. Limitations

This was an unplanned ‘silvicultural experiment’. We were unable to direct where and when the treatment (i.e., budworm defoliation) was applied, so some initial zone differences are to be expected. We were also unable to measure the same stands/trees prior to and after defoliation (over the 20-year period from 1989 to 2011), and therefore we cannot be certain that the changes in structure were due only to spruce budworm defoliation, and not also to, for example, site quality or host tree age. We believe that using the FRI data for our initial measurement of pre-defoliation (1989) site quality and stand age amplified any apparent differences among the zones, and that the difference would have been much less if we were able to make pre-defoliation measurements in 1989.
The scope of this study was to compare differences in forest structure among defoliation zones, while also limiting the variation of forest characteristics prior to defoliation. Hence, the primary criterion used to select the sample sites was ‘years of moderate–severe continuous defoliation’, according to the FIDS defoliation maps. The five sites selected within each zone of continuous defoliation were otherwise randomly selected with several constraints including: a minimum host tree composition of 20% and a minimum dominant or co-dominant tree age of 50 years, as defined by the FRI data collected in 1989.
The FRI is an effective tool to describe general stand characteristics. For example, described metrics (e.g., stand height and age) pertain to the dominant and co-dominant trees of the leading species in the stand, averaged over the stand. However, in the boreal mixedwood forest investigated here, host trees were not necessarily the dominant or co-dominant species, and the structural metrics in Table 1 do not necessarily describe the structural characteristics of the host trees in the stand (i.e., those trees defoliated by spruce budworm). Nonetheless, the FRI data were still used to estimate stands that were similar in structure prior to defoliation because, given the resources of this study, it was not feasible to measure the forest structure of sites in both 1989 (pre-defoliation) and 2011 (post-defoliation), nor ensure those sites would endure spruce budworm defoliation. Given that it was not possible to measure the same sites before and after defoliation, it could be true that to some extent the observed differences among defoliation zones (e.g., stand height and vertical fuel continuity) existed prior to defoliation. This may suggest, for example, that vertical fuel continuity, as shown in Figure 4, Figure 5 and Figure 6, is greater in stands that later experience longer durations of defoliation.
It has long been recognized that spruce budworm preferentially attacks over-mature, dominant and co-dominant host trees and that, consequently, outbreaks can have major impacts on stand ages and tree heights of the host species [26]. In fact, our measurements suggest structural changes that would reduce tree height and stand age. Differences in stand structure were particularly evident in sites defoliated continuously for eight and sixteen years compared to those defoliated for zero and four years. For example, significant differences were found in the occurrence of top-killed, topped and dead host overstory trees, host overstory tree height, and downed woody debris height. These characteristics are related in that as the tallest trees die or lose their tops after top-kill, stand height declines and downed woody debris increases. Given such observations, we believe that the duration of spruce budworm defoliation does increase stand breakdown and vertical fuel continuity, as detailed in this study.

5. Conclusions

Vertical fuel continuity increased with the duration of defoliation. Further investigation into the changes in vertical forest structure by continuous spruce budworm defoliation, specifically those associated with crown fire initiation and spread probability, will advance a more mechanistic and causal understanding of the process underlying the patterns revealed by landscape-scale analyses of the interaction between spruce budworm and crown fire [11,13]. Surface, ladder, and crown fuel properties measured in this study should be compared with those of other studies (i.e., [10]), and if possible, combined with an estimate of the impact of vertical fuel continuity on crown fire. This will provide further insight into landscape-scale trends regarding the likelihood of large fires in forest following spruce budworm defoliation [11,13].

Author Contributions

G.A.W., R.A.F., S.M.S. and M.-J.F. conceived and designed the experiments; G.A.W. performed the experiments; G.A.W., R.A.F. and M.-J.F. analyzed the data; G.A.W. wrote the paper.

Acknowledgments

Sincere thank you to Mike Wotton, Brian Stocks, Jean-Noel Candau, and Bill DeGroot for valuable consultation. Thank you to the CFS (Ron Fournier) and the OMNR (Taylor Scarr) for providing historical spruce budworm data. We also thank the Ontario Ministry of Natural Resources CRA (SPA 90198 and 90170) for financial support. We would like to dedicate this paper to acknowledge the substantial contribution made by the late Jan Volney to the study of spruce budworm outbreaks.

Conflicts of Interest

The authors declare no conflict of interest.

References

  1. Candau, J.; Fleming, R.; Hopkin, A. Spatiotemporal patterns of large-scale defoliation caused by the spruce budworm in Ontario since 1941. Can. J. For. Res. 1998, 28, 1733–1741. [Google Scholar] [CrossRef]
  2. Fleming, R.A. Climate change and insect disturbance regimes in Canada’s boreal forests. World Resour. Rev. 2000, 12, 520–554. [Google Scholar]
  3. Volney, W.J.; Fleming, R. Climate change and impacts of boreal forest insects. Agric. Ecosyst. Environ. 2000, 82, 283–294. [Google Scholar] [CrossRef]
  4. Brassard, B.; Chen, H. Stand structural dynamics of North American boreal forests. Crit. Rev. Plant. Sci. 2006, 25, 115–137. [Google Scholar] [CrossRef]
  5. MacLean, D.A. Effects of spruce budworm outbreaks on the productivity and stability of balsam fir forests. For. Chron. 1984, 60, 273–279. [Google Scholar] [CrossRef]
  6. MacLean, D.A. Vulnerability of fir-spruce stands during uncontrolled spruce budworm outbreaks: A review and discussion. For. Chron. 1980, 56, 213–221. [Google Scholar] [CrossRef]
  7. Taylor, S.; MacLean, D. Legacy of insect defoliators: Increased wind-related mortality two decades after a spruce budworm outbreak. For. Sci. 2009, 55, 256–267. [Google Scholar]
  8. Menning, K.; Stephens, S. Fire climbing in the forest: A semiqualitative approach to assessing ladder fuel hazards. West. J. Appl. For. 2007, 22, 88–93. [Google Scholar]
  9. Taylor, S.; MacLean, D. Dead wood dynamics in declining balsam fir and spruce stands in New Brunswick, Canada. Can. J. For. Res. 2007, 37, 750–762. [Google Scholar] [CrossRef]
  10. Stocks, B.J. Fire potential in the spruce budworm-damaged forests of Ontario. For. Chron. 1987, 63, 8–14. [Google Scholar] [CrossRef]
  11. Fleming, R.; Candau, J.; McAlpine, R. Landscape-scale analysis of interaction between insect defoliation and forest fire in central Canada. Clim. Chang. 2002, 55, 251–272. [Google Scholar] [CrossRef]
  12. James, P.M.; Robert, L.E.; Wotton, B.M.; Martell, D.L.; Fleming, R.A. Lagged cumulative spruce budworm defoliation affects the risk of fire ignition in Ontario, Canada. Ecol. Appl. 2017, 27, 532–544. [Google Scholar] [CrossRef] [PubMed]
  13. Candau, J.; Fleming, R.; Wang, X. Ecoregional patterns of spruce budworm-wildfire interactions in central Canada’s forests. Forests 2018, 9, 137. [Google Scholar] [CrossRef]
  14. Stocks, B.J. The extent and impact of forest fires in northern circumpolar countries. In Global Biomass Burning: Atmospheric, Climatic, and Biospheric Implications; Levine, J.S., Ed.; MIT Press: Cambridge, MA, USA, 1991; pp. 197–202. [Google Scholar]
  15. Van Wagner, C.E. Conditions for the start and spread of crown fire. Can. J. For. Res. 1977, 7, 23–34. [Google Scholar] [CrossRef]
  16. Scarr, T.; Ryall, K.; Hodge, P. (Eds.) Forest Health Conditions in Ontario, 2011; Queen’s Printer for Ontario: Sault Ste. Marie, ON, Canada, 2012; pp. 1–100. [Google Scholar]
  17. Lavoie, N.; Alexander, M.; Macdonald, S. Photo guide for qualitatively assessing the characteristics of forest fuels in a jack pine—Black spruce chronosequence in the Northwest Territories. Nat. Res. Can. 2010, 1–51. Available online: http://cfs.nrcan.gc.ca/publications/download-pdf/31785 (accessed on 19 April 2013).
  18. Cottam, G.; Curtis, J. The use of distance measures in phytosociological sampling. Ecology 1956, 37, 451–460. [Google Scholar] [CrossRef]
  19. Maser, C.; Anderson, R.G.; Cromack, K.; Williams, J.T.; Martin, R.E. Dead and down woody material. In Wildlife Habitats in Managed Forests: The Blue Mountains of Oregon and Washington; Thomas, J.W., Ed.; USDA: Portland, OR, USA, 1979; Volume 553, pp. 78–95. [Google Scholar]
  20. Van Wagner, C.E. The line intersect method in forest fuel sampling. For. Sci. 1968, 14, 20–26. [Google Scholar]
  21. Péch, G. Fire hazard in budworm-killed balsam fir stands on Cape Breton Highlands. For. Chron. 1993, 69, 178–186. [Google Scholar] [CrossRef]
  22. Greenbank, D.O.; Schaefer, G.W.; Rainey, R.C. Spruce budworm (Lepidoptera: Tortricidae) moth flight and dispersal: New understanding from canopy observations, radar, and aircraft. Mem. Entomol. Soc. Can. 1980, 110, 1–49. [Google Scholar] [CrossRef]
  23. Fleming, R.; Piene, H. Spruce budworm defoliation and growth loss in young balsam fir: Cohort models of needlefall schedules for spaced trees. For. Sci. 1992, 38, 287–304. [Google Scholar]
  24. Bergeron, Y. Species and stand dynamics in the mixed woods of Quebec’s southern boreal forest. Ecology 2000, 81, 1500–1516. [Google Scholar] [CrossRef]
  25. Bouchard, M.; Kneeshaw, D.; Bergeron, Y. Mortality and stand renewal patterns following the last spruce budworm outbreak in mixed forests of western Quebec. For. Ecol. Manag. 2005, 204, 297–313. [Google Scholar] [CrossRef]
  26. MacLean, D.A. Impact of insect outbreaks on tree mortality, productivity, and stand development. Can. Entomol. 2015, 148, S138–S159. [Google Scholar] [CrossRef]
Figure 1. Schematic representation of vertical forest characteristics in boreal forest defoliated by spruce budworm. Represented are host overstory and understory crown base height (CBH), host understory height, top-kill, crown breakage, dead crown base height (DCBH), downed woody debris height (DWDH), suspended woody debris (SWD) and related vertical spacing. Note: The length of top-kill (T) was not measured in this study.
Forests 09 00256 g001
Figure 2. Mean percentage of host overstory trees (n = 10) with given trait by years of continuous spruce budworm defoliation from 1993–2008 in boreal mixedwood forest near Warren, Ontario: (a) Affected (all dead trees, topped trees and trees experiencing top-kill); (b) Dead (all dead trees); (c) Topped (all topped trees); and (d) Top-kill. Among treatments, means with the same letters were not significantly different (Wilcoxon rank sum test; p < 0.05). Error bars show standard error of the mean.
Forests 09 00256 g002
Figure 3. Mean surface biomass height by years of continuous spruce budworm defoliation from 1993–2008 in boreal mixedwood forest near Warren, Ontario: (a) Downed woody debris height (DWDH; n = 25); (b) Herbaceous height (n = 25); (c) Difference between DWDH and herbaceous height (n = 25); and (d) Downed woody debris (DWD) occurrence ≥ 7.0 cm (n = 5). Means with the same letters among treatments were not significantly different (Wilcoxon rank sum test; p < 0.05). Error bars show standard error of the mean.
Forests 09 00256 g003
Figure 4. Linear regression of host overstory tree structure (dependent variables) by years of continuous spruce budworm defoliation (independent variable) from 1993–2008 in boreal mixedwood forest near Warren, Ontario: (a) Host tree height (Ht); and (b) Diameter at breast height (DBH). Linear regression showed years of continuous defoliation significantly predicted host tree height (R2 = 0.33, F3,17 = 8.84, p < 0.01) and diameter at breast height (R2 = 0.30, F3,17 = 7.81, p = 0.01). The equations of the regression lines were Ht = −0.29 (Continuous defoliation) +13.00 and DBH = −0.33 (Continuous defoliation) +14.41, respectively. The coefficient estimates with SEM for host tree height and diameter at breast height were −0.29 ± 0.10, 13.00 ± 0.89 and −0.33 ± 0.12, 14.41 ± 1.07, respectively.
Forests 09 00256 g004
Figure 5. Vertical forest structure showing mean top height (top of crown component; n = 60), crown base height (bottom of crown component and top of trunk component; n = 60), downed woody debris height (DWDH; n = 25) by years of continuous spruce budworm defoliation from 1993–2008 in boreal mixedwood forest near Warren, Ontario for host overstory (O) trees, host understory (U) trees and downed woody debris (DWD). Among treatments, means with the same letters were not significantly different (Wilcoxon rank sum test; p < 0.05). Error bars show standard error of the mean. Note: Eight to sixteen years on x-axis is eight years.
Forests 09 00256 g005
Figure 6. The distance between selected vertical stand components (dependent variables) by years of continuous spruce budworm defoliation (independent variable) from 1993–2008 in boreal mixedwood forest near Warren, Ontario: (a) Host overstory crown and downed woody debris (Overstory CBH − DWDH); (b) Host overstory crown, host understory crown and downed woody debris (Overstory CBH − Understory H + Understory CBH − DWDH); (c) Host overstory and understory crowns (Overstory CBH − Understory H); and (d) Host understory dead crown and downed woody debris (Understory DCBH − DWDH). For all four categories of number of years of continuous defoliation, n = 5.
Forests 09 00256 g006
Table 1. Geographic locations and Forest Resource Inventory (FRI) data pertaining to the 20 sites inventoried in July 2011. Sites were located within boreal mixedwood forest continuously defoliated by spruce budworm for 0, 4, 8, and 16 years from 1993–2008. FRI data for these sites were collected in 1989 by the Ontario Ministry of Natural Resources (OMNR), three years prior to the start of the defoliation period. Stocking is a relative measure of stand density against the reference level for the dominant and co-dominant species. Height and Age pertain to the dominant and co-dominant trees of the leading species in the stand, averaged over the stand. The reported value of a given metric is represented by Value, while standard error of the mean is represented by SEM. Host trees include balsam fir, white spruce, and black spruce.
JulyForest Resource Inventory Data (1989)
LocationStructureComposition
Continuous DefoliationSiteCoordinateHeight (m)Age (Years)Stocking (0–1)Host (%)
(Years)(#)N (°)W (°)ValueSEMValueSEMValueSEMValueSEM
0146 29 52.999979 09 39.501221900.820
0246 32 25.968979 09 09.1302191100.740
0346 32 26.264179 08 48.257415900.580
0446 33 53.628879 09 29.513714900.750
0546 33 50.313279 09 34.800111950.730
Mean16±295±40.7±0.044±10
4646 47 49.623379 48 08.4162131100.950
4746 37 35.616179 48 04.3366131500.520
4846 45 36.455879 48 25.0054111030.420
4946 44 40.700879 49 16.873316950.730
41046 44 35.720579 49 09.575116950.730
Mean14±1111±100.6±0.130±5
81146 37 58.887980 00 18.517222850.830
81246 37 18.018680 00 38.820521800.050
81346 37 02.866880 00 26.141320800.830
81446 35 50.807980 00 26.702713650.760
81546 35 34.884780 00 32.967315620.930
Mean18±274±50.6±0.240±6
161646 30 32.779780 16 03.115613750.650
161746 29 50.538080 15 14.16647500.560
161846 30 34.493480 16 09.863313700.570
161946 30 50.494880 16 03.589313750.650
162046 31 56.093780 76 04.396514700.520
Mean12±168±50.5±0.050±8
Table 2. Overstory tree (DBH ≥ 3 cm) density and composition in zones of boreal mixedwood forest continuously defoliated by spruce budworm for zero, four, eight and sixteen years from 1993–2008 near Warren, Ontario. Forest characteristics were measured at five sites within each defoliation zone in May 2011. The same measurements were repeated at independent sites in July 2011. The pooled data (i.e., ten sites per defoliation zone) are shown separately from the data collected in July 2011. Standard error of the mean is represented by SEM. Host trees include balsam fir, white spruce and black spruce.
Continuous DefoliationnDensity (Stems/ha)Composition (%)
(Years)(# of Sites)OverallSEMHostSEMBalsam FirSEM
(of Total)(of Total)(of Host)(of Host)
Data from July 2011
053142±70272±3193±3
452664±41251±2957±12
852847±33794±2448±16
1654630±28090±4067±18
Pooled data from May and July 2011
0103203±72072±37--
4103242±74459±33--
8102895±39294±53--
16103793±105687±48--
Table 3. Estimated linear model parameters of the space between measured stand structural components (dependent variables) by years of continuous spruce budworm defoliation (independent variable) from 1993–2008 in boreal mixedwood forest near Warren, Ontario: Host overstory crown and downed woody debris (Overstory CBH − DWDH); host overstory crown, host understory crown and downed woody debris (Overstory CBH − Understory H + Understory CBH − DWDH); host overstory and understory crowns (Overstory CBH − Understory H); and host understory dead crown base and downed woody debris (Understory DCBH − DWDH). Standard error of the mean is represented by SEM.
Dependent VariableParameterEstimateR2SEMt statp
Overstory CBH − DWDH (m)Intercept3.6980.2370.5446.803<0.001
Overstory CBH − DWDH (m)Slope−0.1400.059−2.3640.030
Overstory CBH − Understory H + Understory CBH - DWDH (m)Intercept2.1530.2180.4384.916<0.001
Overstory CBH − Understory H + Understory CBH - DWDH (m)Slope−0.1070.048−2.2400.038
Overstory CBH − Understory H (m)Intercept1.5940.2030.5412.9480.009
Overstory CBH − Understory H (m)Slope−0.1260.059−2.1400.046
Understory DCBH − DWDH (m)Intercept−0.0370.4280.075−0.4990.624
Understory DCBH − DWDH (m)Slope−0.0300.008−3.6690.002

