Article

Deforestation-Induced Fragmentation Increases Forest Fire Occurrence in Central Brazilian Amazonia

by
Celso H. L. Silva Junior
1,*,
Luiz E. O. C. Aragão
1,2,
Marisa G. Fonseca
1,
Catherine T. Almeida
1,
Laura B. Vedovato
1,2 and
Liana O. Anderson
3
1
Tropical Ecosystems and Environmental Sciences Laboratory (TREES), Remote Sensing Division, National Institute for Space Research-INPE, São José dos Campos 12227-010, SP, Brazil
2
College of Life and Environmental Sciences, University of Exeter, Exeter EX4 4RJ, UK
3
National Center for Monitoring and Early Warning of Natural Disasters-CEMADEN, São José dos Campos 12247-016, SP, Brazil
*
Author to whom correspondence should be addressed.
Forests 2018, 9(6), 305; https://doi.org/10.3390/f9060305
Submission received: 22 January 2018 / Revised: 25 April 2018 / Accepted: 1 May 2018 / Published: 1 June 2018
(This article belongs to the Special Issue Wildland Fire, Forest Dynamics, and Their Interactions)

Abstract

:
Amazonia is home to more than half of the world’s remaining tropical forests, playing a key role as reservoirs of carbon and biodiversity. However, whether at a slower or faster pace, continued deforestation causes forest fragmentation in this region. Thus, understanding the relationship between forest fragmentation and fire incidence and intensity in this region is critical. Here, we use MODIS Active Fire Product (MCD14ML, Collection 6) as a proxy of forest fire incidence and intensity (measured as Fire Radiative Power—FRP), and the Brazilian official Land-use and Land-cover Map to understand the relationship among deforestation, fragmentation, and forest fire on a deforestation frontier in the Brazilian Amazonia. Our results showed that forest fire incidence and intensity vary with levels of habitat loss and forest fragmentation. About 95% of active fires and the most intense ones (FRP > 500 megawatts) were found in the first kilometre from the edges in forest areas. Changes made in 2012 in the Brazilian main law regulating the conservation of forests within private properties reduced the obligation to recover illegally deforested areas, thus allowing for the maintenance of fragmented areas in the Brazilian Amazonia. Our results reinforce the need to guarantee low levels of fragmentation in the Brazilian Amazonia in order to avoid the degradation of its forests by fire and the related carbon emissions.

Graphical Abstract

1. Introduction

Tropical forests are globally important reservoirs of carbon (C) and biodiversity [1,2,3]. Vegetation in this region stores between 350–600 Pg C [3,4,5,6,7], while the atmosphere stores about 750 Pg C [8]. The loss of these C stocks due to deforestation and forest degradation is estimated to be approximately 1.1 Pg C·year−1 [9,10,11]. Amazonia, specifically, is home to more than half of the world’s remaining rainforest areas [12]. However, in the Brazilian Amazonia, intense land-use and land-cover changes and forest degradation threaten the forest structure, biodiversity, and ecological functions [13].
The intense occupation of Brazilian Amazonia from the 70s [14], aiming to expand agricultural and livestock activities and to increase the wood supply, besides a general lack of enforcement of environmental laws, caused the dramatic increase of deforestation rates, reaching a peak of 27,772 km2 in 2004 [15,16]. After 2005, a steep decrease in deforestation rates was observed, which can be attributed to a combination of factors, including governmental enforcement of environmental laws, restrictions on access to credit, expansion of protected areas, and civil society interventions in the soy and beef supply chains [16]. Nonetheless, the deforestation rate increased markedly in 2015 and 2016 [15] (24% and 27% in relation to the previous year, respectively), raising concerns that the recent weakening of environmental-protection policies could be already reversing the Brazilian progress in reducing the Amazonian forest destruction.
Whether at a slower or faster pace, continued deforestation cumulatively causes forest habitat loss, altering habitat configuration, such as the change in spatial arrangement of the remaining habitat through forest fragmentation. Metrics of habitat configuration, such as the number and mean size of forest patches and edge length covary with habitat amount. Understanding these relationships is important to correctly interpret the effects of habitat fragmentation on tropical forests [17]. Following Farhig (2003) [18], the mean patch size of remaining forests is expected to linearly decrease with the reduction in habitat amount, while both the number of patches and the total edge are expected to rise up to a certain threshold of habitat loss and then decrease with increasing deforestation.
Forest edges resulting from landscape fragmentation are highly fire-prone due to increased dryness, higher fuel load compared to forest interior and proximity to ignition sources from adjacent management areas [19,20,21,22,23,24]. Fragmentation and its resulting edge effects may act synergistically with the ongoing large-scale changes in climate and fire regimes, threatening the Amazonian forest ecological integrity [13,25].
Much of the literature on the effects of habitat loss and changes in habitat configuration has focused on biodiversity maintenance and population persistence. Studies concerning the effect of habitat loss and configuration on forest fires incidence and intensity at the landscape scale are rare in the Brazilian Amazonia, especially in active deforestation frontiers, where the interactions between deforestation, forest fragmentation and fire are evident. In other regions of the Amazon Basin, some authors have demonstrated a positive response of fire incidence and intensity to increased fragmentation and forest edges in the landscape [20,21,22,26,27].
In Brazil, the Forest Code (Federal Law 12.727/2012) is the main national law that is regulating the conservation of forests within private properties [28]. This law determines that, within the Amazon Biome, at least 80% of each rural property should not be deforested in order to ensure the sustainable use of natural resources, assisting in the conservation and rehabilitation of ecological processes, promoting the conservation of biodiversity, as well as the shelter and the protection of wildlife and native flora. The question of whether such a high level of habitat maintenance is necessary to reduce fire incidence in the region, however, has not been directly addressed yet.
To fill this gap, we relate, for the first time, habitat configuration metrics with fire incidence and intensity in an active Brazilian Amazonia deforestation frontier, aiming to identify the relationships between forest fragmentation and fire on the landscape scale. To achieve this, we address the following question: What is the relationship between habitat loss and measures of habitat configuration, and their implications for fire incidence and intensity in a central Amazonian landscape?

2. Study Area

Our study site is located in the northern region of Novo Progresso municipality, State of Pará, Central Brazilian Amazonia, with an area of 30,000 km2 (3 × 10⁶ ha) (Figure 1), which approximately corresponds to the area of Belgium. This region is known as a frontier of deforestation because of high rates of deforestation in the last 10 years. The vegetation is predominantly composed of the Dense Ombrophilous Forest, with trees that can reach heights up to 50 m [29].
The initial occupation of this area was associated with governmental settlement projects and the construction of road infrastructure, mainly the construction of BR-163 highway [30]. During the 70s and 80s, a spontaneous colonization phenomenon occurred in the region, which was characterized by the occupation of land by small subsistence farmers and gold miners [30]. There are three main deforestation patterns that are present in the study area (i) fishbone, associated with settlements, (ii) rectangular patches, related to large rural properties, and (iii) stem of the rose pattern that is associated with mining areas, mainly in BR-163 [31].

3. Datasets

3.1. Forest Cover Map

Land-use and land-cover data were obtained from the Amazonia Land-use Land-cover Monitoring Project (TerraClass Project/INPE) [32]. We used data for the year 2014, which corresponds to the last year of available mapping.
The TerraClass Project data are the result of a combination of deforestation data from the Brazilian Amazonia Deforestation Monitoring Project (PRODES/INPE) [15] and the land use classification based on orbital images from Landsat, Terra/Aqua, and SPOT-5 satellites.
We regrouped the original classes of the TerraClass Project into two new classes: Forest Cover and Deforested Areas (Table 1). In order to eliminate natural edges in the analyses, we jointed the areas of Cerrado (Brazilian Savannas) and water bodies to the Forest Cover class.

3.2. Active Fire Data

Active fire data were obtained for the period between January and December 2014 from the Fire Information for Resource Management System (FIRMS). These data are derived from the MODIS Active Fire Product (MCD14ML, Collection 6) [33], adjusted to 1 km of spatial resolution. To generate the product, a contextual algorithm compares the daily data of the medium and thermal infrared bands with reference data (without thermal anomalies). Subsequently, false detections are rejected by examining the brightness temperature of the neighbouring pixels [34].
Fire Radiative Power (FRP) values are considered to be an indicator of fire intensity (given in Megawatts or MW) and they are commonly related to the amount of biomass that was consumed during the fire, where the higher the FRP value, the greater is the amount of biomass consumed [35].
During 2014, the number of detected active fires (N = 35,873) in Pará State was near the average from 1999 to 2017 (N = 32,602) [36] and the year presented a normal climatology (Figure S1) [37].

4. Methods

4.1. Landscape, Fire Incidence and Fire Intensity Metrics

Firstly, we use the forest cover map to calculate landscape metrics using the LecoS plug-in (version 2.0.7, Landscape Ecology Statistics, University of Évora, Évora, Portugal) [38] implemented in the QGIS software (version 2.18, Long-term Release (LTR), QGIS Development Team, https://qgis.org/en/site/) [39]. These metrics and its modifications are commonly used in the literature for analysis that is related to forest fires [26,40] and are based from the Fragstats software (University of Massachusetts, Amherst, MA, USA) [41].
For our analysis, we used 300 grid cells of 10 km by 10 km. This spatial resolution satisfactorily captures the different patterns of fragmentation in our study area. According to Saito et al. [42] the size of the cells do not statistically affect the results of the landscape metrics, and the user then chooses the size of the cells based on the phenomenon and scale analysed. The following metrics were adopted (Table 2): (1) Habitat Loss (percentage of deforestation), (2) Edges Proportion, (3) Number of Forest Patches, and (4) Mean Forest Patch Area.
Then, for each cell, two metrics were calculated for the active fire data. The first metric was the Fire Density (FD, as a proxy of fire incidence), which corresponds to the cumulative number of active fires in 2014 that occurred within forest areas in each cell divided by the total forest in that cell. The second metric was the FRP Mean (as a proxy of fire intensity), which was calculated by averaging the FRP values of active fires that were falling within the forest areas in each cell.

4.2. Statistical Analyzes

To evaluate the relationship among the variables (Fire Density, FRP Mean, and landscape metrics), we fitted curves using LOESS Regression (Locally Weighted Scatterplot Smoothing—LOESS), which is a form of local regression model [43,44]. This method is a non-parametric strategy for fitting a smooth curve to data, where noisy data values, sparse data points, or weak interrelationships interfere with your ability to see a line of best fit [45]. We used the span 0.75 (default setting) in LOESS Regression analyses.
In order to verify the existence of significant differences in the incidence and the intensity of fire as a function of the landscape metrics, we used the Kruskal-Wallis non-parametric test. This test is equivalent to Analysis of Variance (ANOVA), which compares three or more groups to test the hypothesis that they have the same distribution [46,47,48]. To identify how the analysed variables differ, a paired posthoc test was performed. To perform the posthoc test, we use the Fisher’s least significant difference criterion with Bonferroni adjustment methods correction [49]. For all of the tests, the significance level of 95% (p-value < 0.05) was adopted.
We use the R software (version 3.4.4, https://www.r-project.org/) for all analysis [50]. For LOESS Regression, we use the “loess” native function [51]. In the Kruskal-Wallis test, we use the “agricolae” package [52].
We also separated and quantified active fires and the respective FRP values at three edge distances (1 km, 2 km, and greater than 2 km), both within forest areas (hereafter referred as edge of forest cover) and out of forest areas (hereafter referred as edge of deforested areas). Additionally, we calculated the percentage of active fires per FRP intervals, as suggested by Armenteras et al. [26]: ≤50 MW, 50 to ≤500 MW, 500 to ≤1000 MW, and >1000 MW.

5. Results

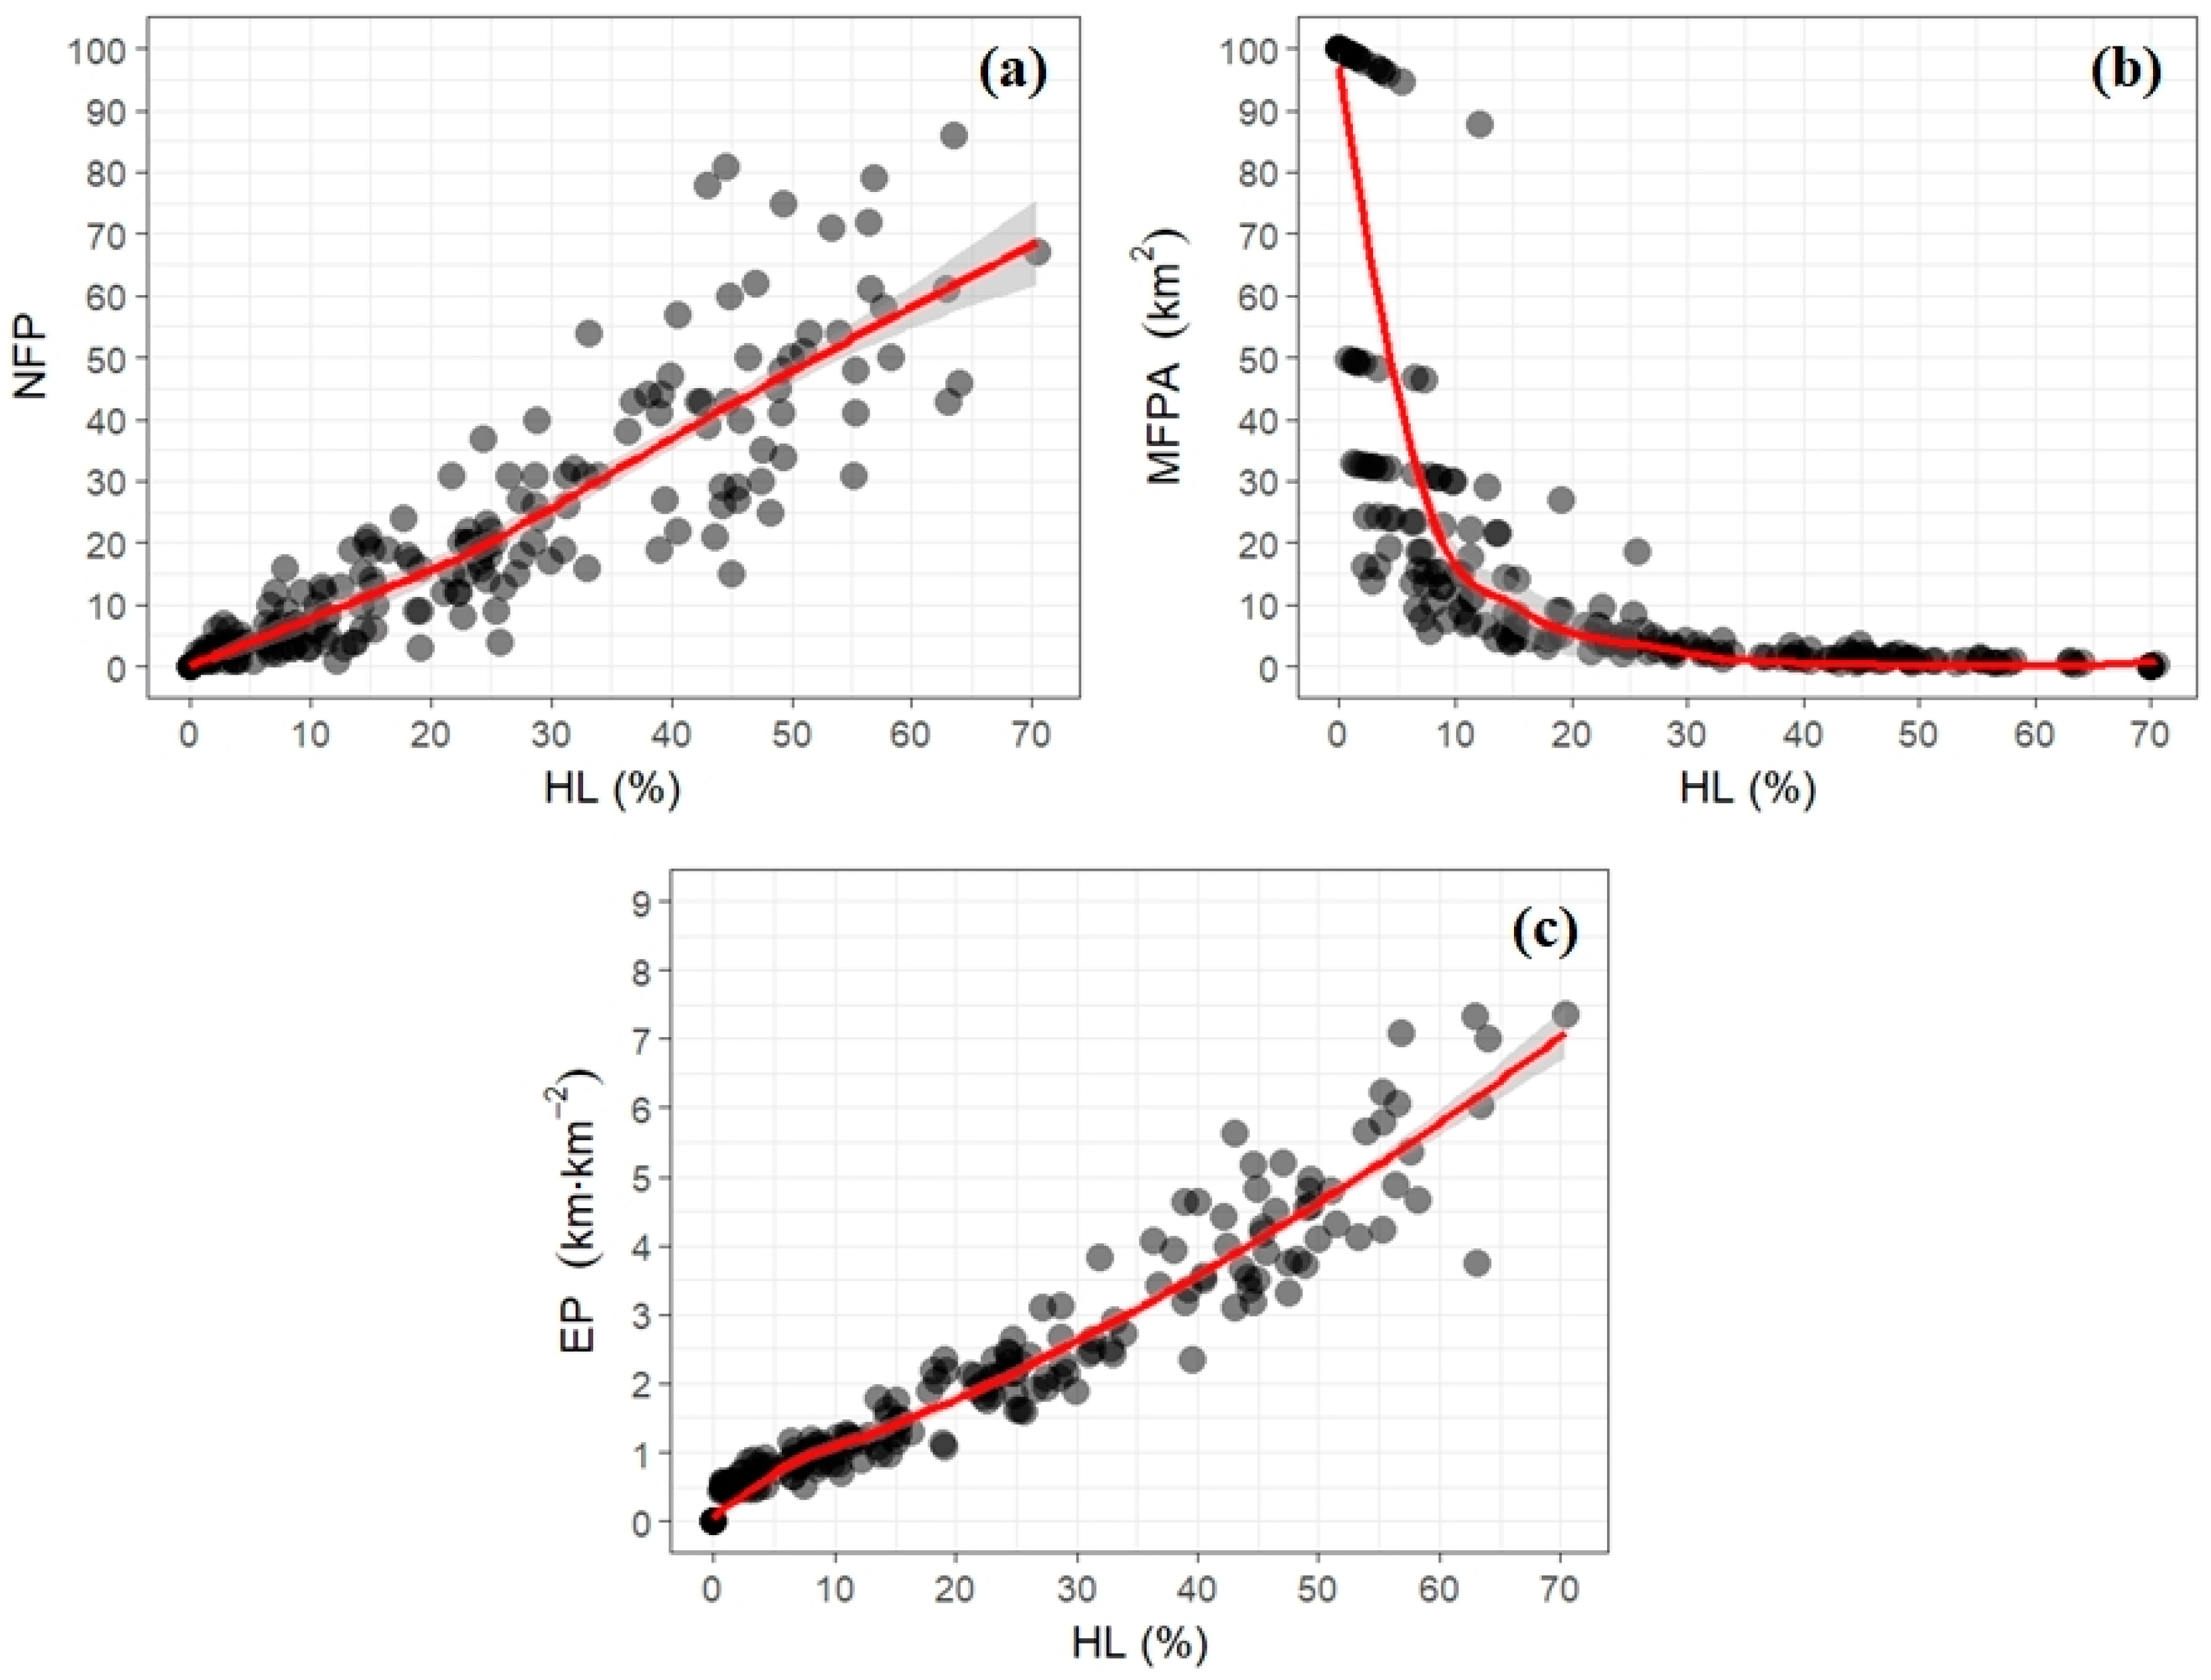
5.1. Relationship between Habitat Loss and Measures of Habitat Configuration

Our results showed that the analysed landscape metrics exhibited different relationships with habitat loss (HL, Figure 2). The number of forest patches (NFP), as well as its variance, increases with HL until it reaches 70%, which is the maximum level of deforestation within a grid cell that is found in the study area (Figure 2a). The mean forest patch area (MFPA) decreases sharply between 0 and 10% of HL and continues to decrease smoothly from about 10% to 70% of HL, with a lower variance in the larger HL values (Figure 2b). Similarly to NFP, EP and its variance increase with HL, mostly from 20% of HL onwards (Figure 2c).
The Kruskal-Wallis (KW) test showed that the NFP (KW = 196.04; p-value < 0.05; Figure S2a) and the EP (KW = 205.07; p-value < 0.05; Figure S2c) were significantly lower only in the interval between 0–20% of HL, while the MFPA (KW = 201.38; p-value < 0.05; Figure S2b) was significantly higher in the same interval.

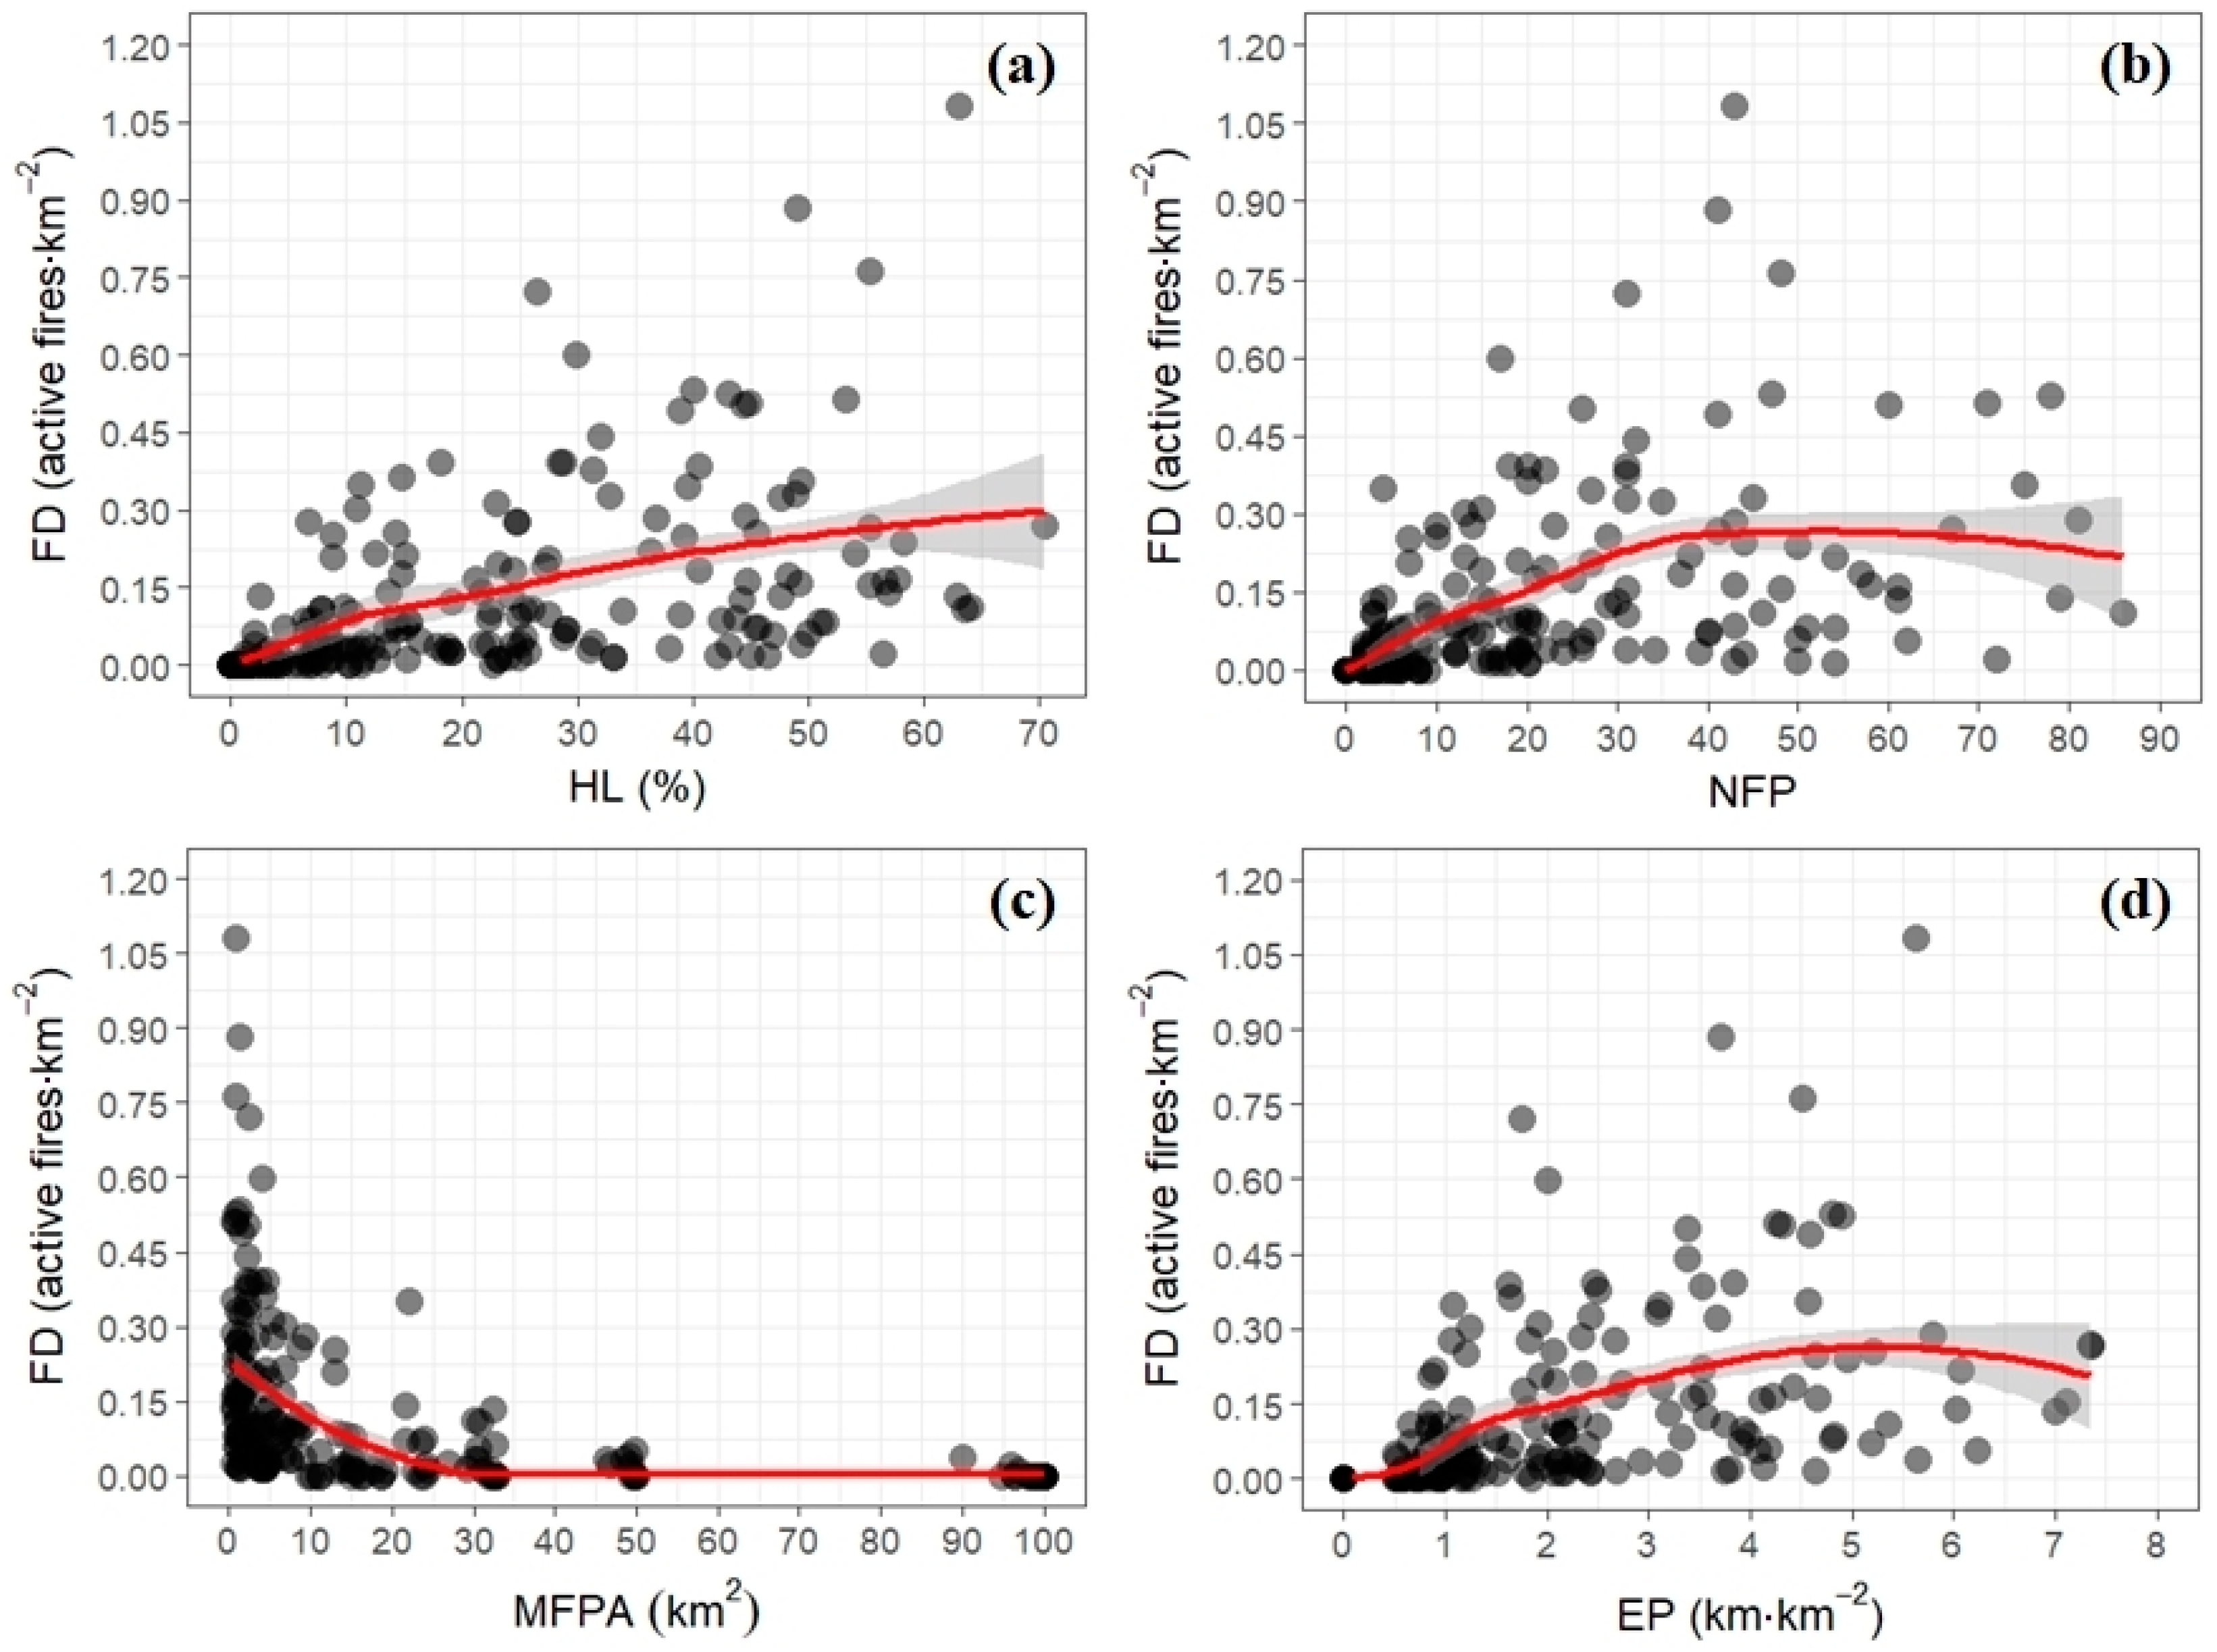
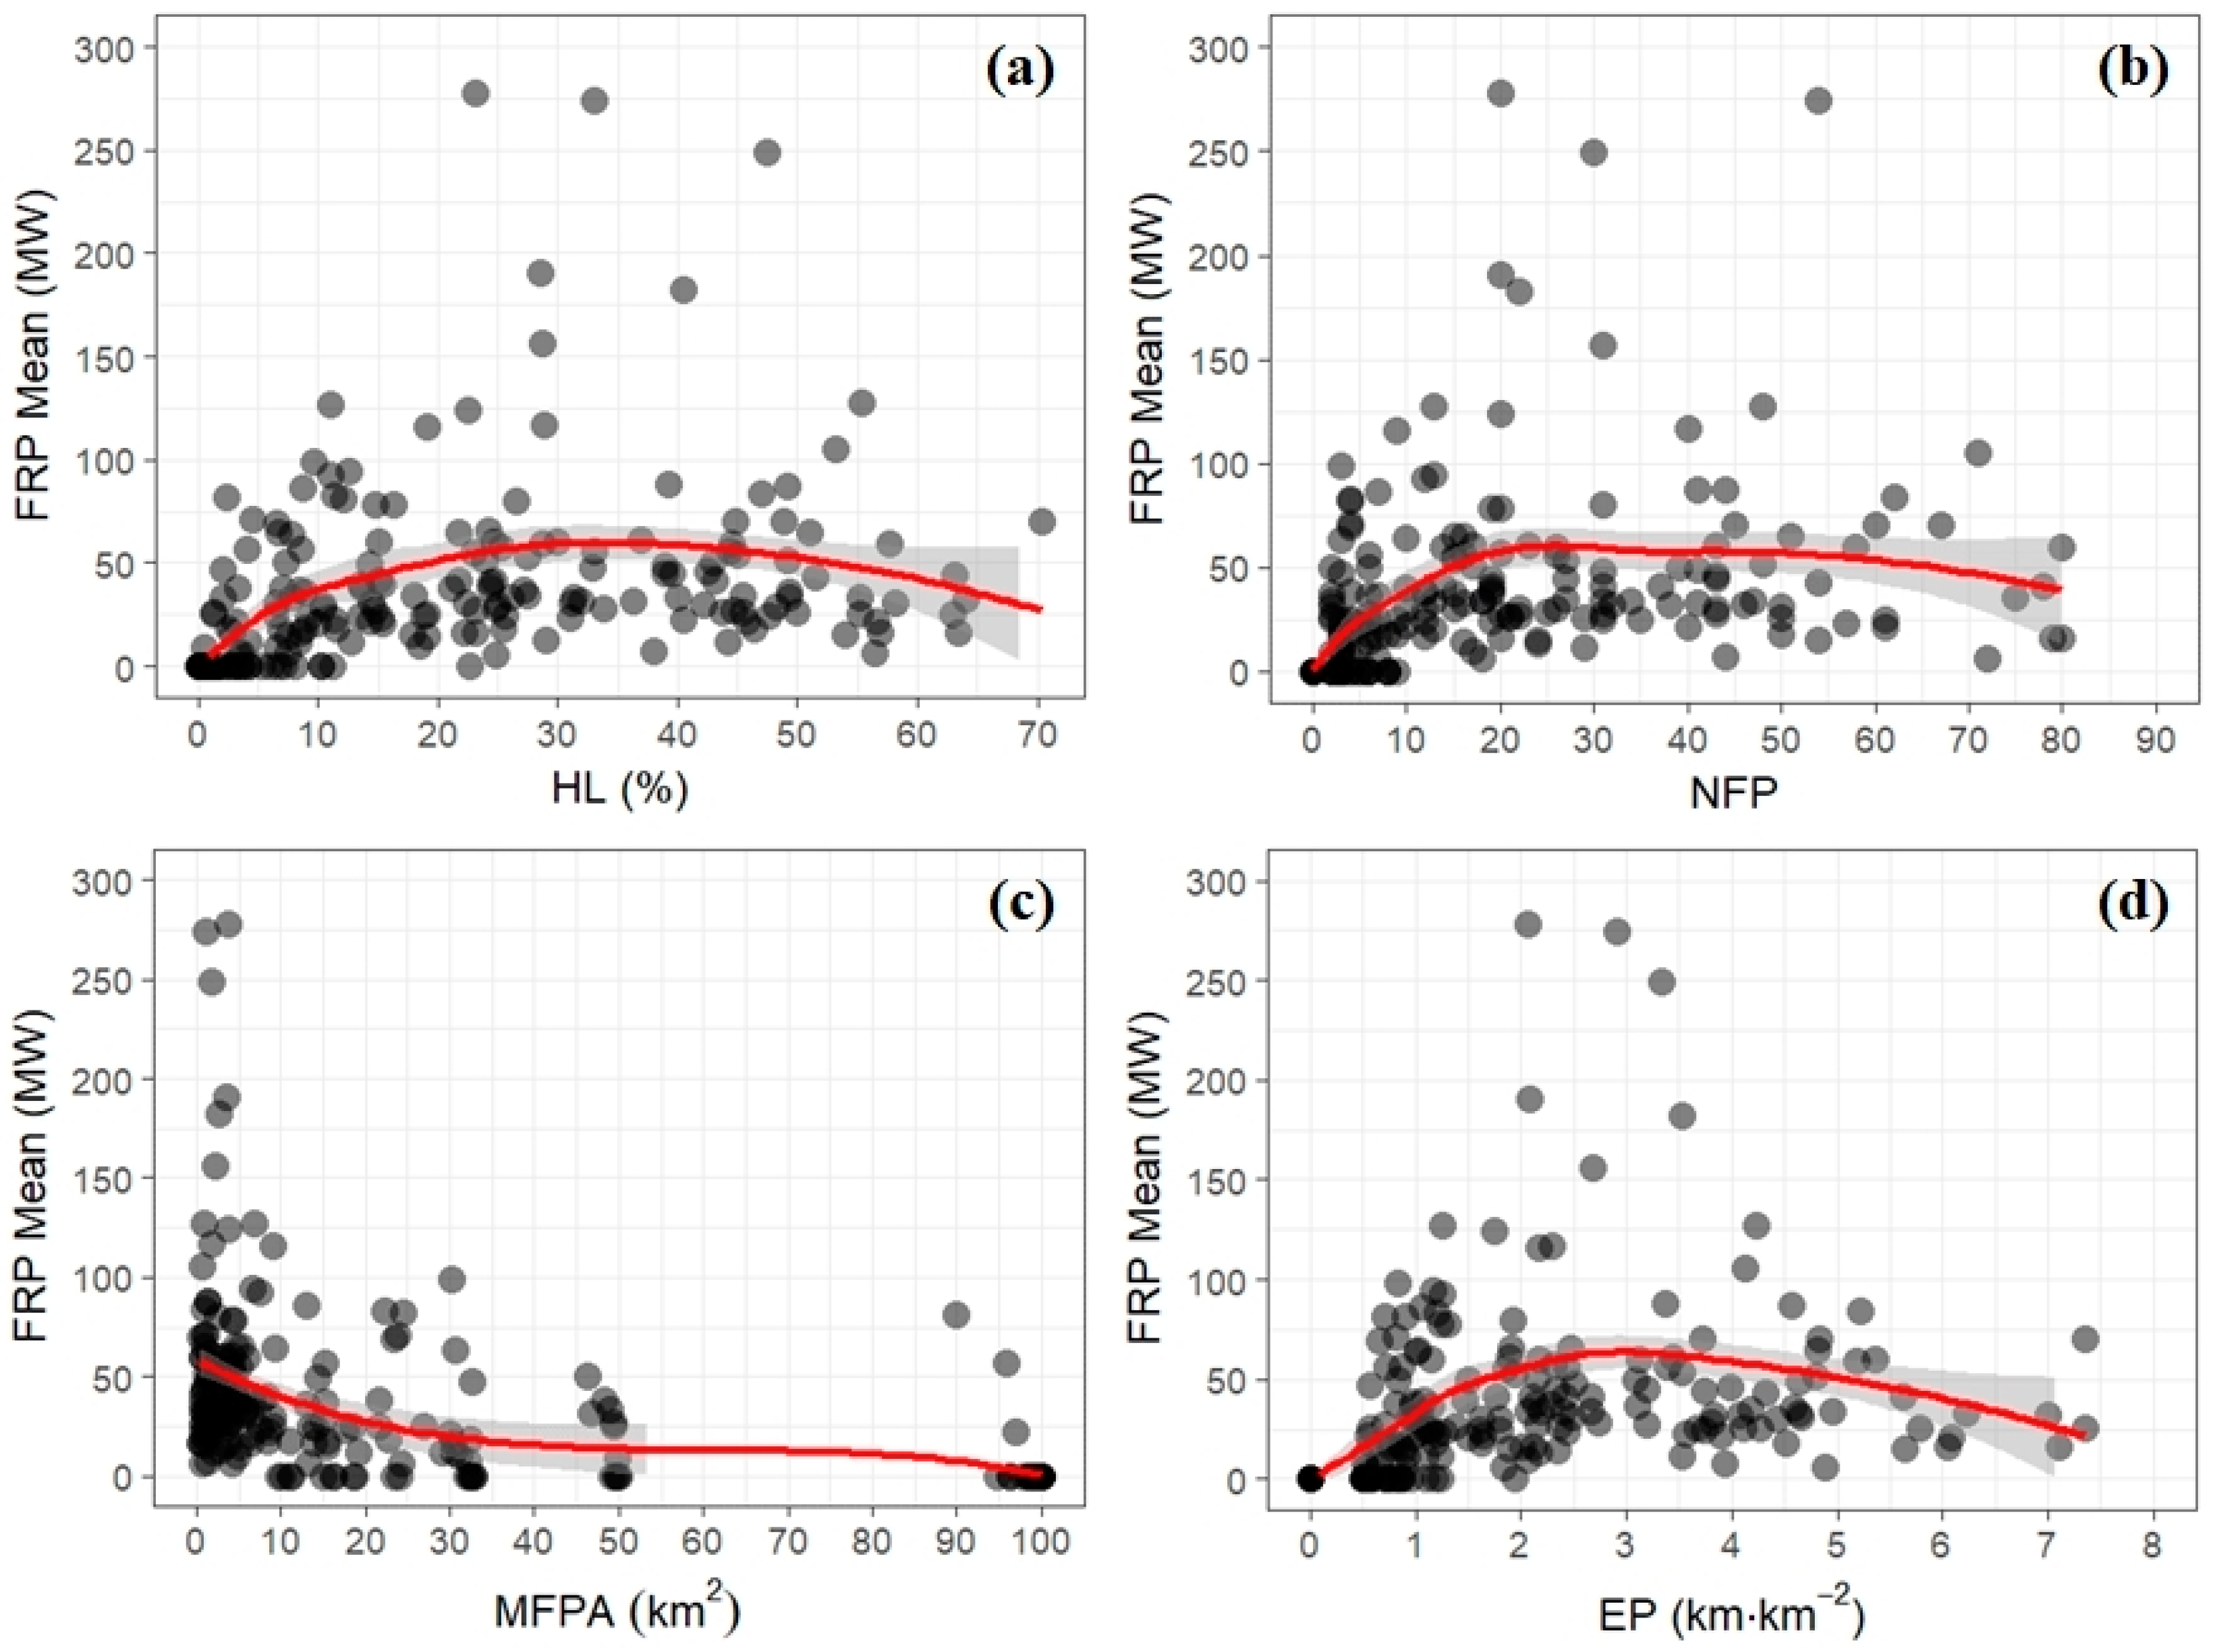
5.2. Relationship between Habitat Configuration and Fire Incidence and Intensity

Fire density (FD) increased with habitat loss (HL), with greater variability in the higher levels of deforestation (Figure 3a). Furthermore, the FD increased until NFP reaches ~35 per grid cell, and then stabilized (Figure 3b). The FD decreased sharply up to 25 km2 of MFPA, tending to zero after that. On the other hand, the FD increased up to 5 km·km−2 of EP, after which it plateaus.
The Kruskal-Wallis (KW) test showed that FD was significantly lower only in the interval between 0–10% of the HL (KW = 191.76; p-value < 0.05; Figure S3a), between 0–10 NFP (KW = 180.68; p-value < 0.05; Figure S3b), between 90–100 km2 of MFPA (KW = 224.86; p-value < 0.05; Figure S3c), and finally, between 0–1 km·km−2 of EP (KW = 166.82; p-value < 0.05; Figure S3d).
The fragmentation effect on the fire intensity, as measured by the Mean FRP, is presented in Figure 4. The Mean FRP increased until ~35% of HL and then decreased until the higher registered levels of HL (Figure 4a). The Mean FRP increased with the increase in the NFP up to 25, but decreased smoothly from about 25 to 80 forest patches (Figure 4b). A tendency of decrease in the Mean FRP was registered as the MFPA increases up to 50 km2. On the other hand, the Mean FRP increased with the increase of the EP up to 3 km·m−2, with a subsequent decrease up to 7.5 km·km−2.
The Kruskal-Wallis test indicated that forest fire intensity (measured as mean FRP) was significantly lower at the lowest levels of fragmentation: 0–10% of HL (KW = 162.90; p-value < 0.05; Figure S4a), between 0–10 NFP (KW = 145.49; p-value < 0.05; Figure S4b), between 90–100 km2 of MFPA (KW = 204.28; p-value < 0.05; Figure S4c) and between 0–1 km·km−2 of EP (KW = 121.89; p-value < 0.05; Figure S4d).
Most of the active fires detected were located within 1 km from the forest edges (Table 3), corresponding to 95% and 98% of fires occurring in forest and deforested areas, respectively.
Most active fires were classified as low intensity (FRP less than 50 MW), representing between 70% and 90% of the total of active fires analysed for each edge distance (Table 4). Between 10 and 28% of the total active fires were in the 50–500 MW intensity category. The few observed higher intensities of active fires (FRP greater than 500 MW) were located in the first kilometre from the forest edges only. Corroborating the previous evidence, the Kruskal-Wallis test showed a significant difference between the FRP values for the different edge distances in the forest areas (KW = 6.95; p-value < 0.05; Figure S5a), where the highest FRP values were only observed in the first kilometre from the forest edges. For the deforested areas, no significant difference was observed (KW = 2.99; p-value > 0.05; Figure S5b).

6. Discussion

6.1. Relationship between Habitat Loss and Measures of Habitat Configuration

Due to the complexity of anthropic actions in the Amazon region, deforestation occurs in different patterns, resulting in different spatial configurations of patches and forest edges [18,31,53]. Here, we show that in Central Amazonia, the NFP increases as deforestation progresses to levels that are up to 70% of HL. The increasing number of forest patches and its variability with increasing habitat loss is similar to the one found by Oliveira Filho and Metzger [54] for the “fishbone” fragmentation pattern. This relationship was also found by Villard and Metzger [17] in simulated landscapes. Although the maximum HL that was observed in our study area was 70%, the NFP should necessarily decrease at some point as deforestation approaches the 100% level. According to the literature review that was carried out by Fahrig [18], the number of forest patches is expected to increase up to a certain degree of deforestation (~80% of habitat loss), and decrease in the lower levels of habitat amount.
The non-linear relationship between the MFPA and HL that was found in our study area differed from the one that was previously presented by Fahrig [18] in a global study (meta-analysis) for real landscapes. However, the pattern found here is similar to that documented by Oliveira Filho and Metzger [54] in real and simulated landscapes in the Brazilian Amazonia. According to Oliveira Filho and Metzger [54], this response pattern is usually associated with the “fishbone” fragmentation pattern and small settlements, as they produce small patches that are close to each other, which is similar to our study area.
The theoretical model proposed by Fahrig [18] describes a significant increase in the total edges up to 50% of habitat removal level, tending progressively to zero after this threshold. However, in our study area, there was no reduction in EP up to at least 70% of HL, indicating a greater inflection point than that observed by Fahrig [18]. The same pattern was observed by Numata et al. [55] when analysing the forest fragmentation in old deforestation frontiers in the state of Rondônia (Brazilian Amazonia) with different patterns and levels of deforestation, and by Laurance et al. [56] when simulating the deforestation scenario for the same state. This pattern occurs over time as the habitat loss progresses to intermediate levels, increasing the number of forest patches, and consequently the density of forest edges. On the other hand, when forest removal approaches 100%, the number of forest patches and total area are reduced dramatically, resulting in a lower edge density in the landscape [18,57].

6.2. Relationship between Habitat Configuration and Fire Incidence and Intensity

Our results suggest that the landscape structure partly explains the variation of fire incidence and intensity in forest areas, which is similar to the results that were found by Armenteras et al. [25] in the Colombian Amazon. More fragmented landscapes, with smaller patches and a greater proportion of edges, tend to be more vulnerable to fire than landscapes with continuous and intact forests. The effect of fragmentation on the incidence and intensity of fire that was observed here is likely a result of changes in the original structural configuration of the forest, which changes the mass and energy balance. Fragmented forests tend to be drier than a continuous forest cover, due to the lower humidity retention, higher temperature, and the greater exposure to dry air masses and winds [58]. This dry condition causes a higher tree mortality (generally large trees) [59], resulting in a large amount of fuel load available (dead biomass), which increases the susceptibility of forest to fire [60].
Although fragmentation makes forests more susceptible to fire, the occurrence of fire is conditioned to the presence of ignition sources. In Amazonia, these sources are mostly associated with the escape of fire from newly deforested areas (Appendix A, Figure A1b), or from the management of agricultural and pasture areas (Figure A1c) [23,61,62]. This explains the observed variation in fire occurrence and intensity at different levels of landscape fragmentation in our results. This issue becomes even clearer when we observe that over than 95% of the active fires that occurred in the first kilometre from the edge, in both forested and deforested areas, indicating the escape of fires into forests. We verified that fire penetrates forest areas up to a distance of 3 km, which corroborates other studies that were carried out in the Amazon region [20,22,26,27,63]. All active fires of higher intensity (FRP above 500 MW) occurred in the first kilometre in the forest areas, with a significant difference when compared to the other edge distances. This can be explained by the greater amount of fuel available, due to the high rate of trees mortality that is closer to the forest edges [59].
The great variability in the incidence and intensity of fire observed at different levels of fragmentation in our results are likely related to the combined existence of ignition sources and fuel availability in the landscape. Conversely, it is important to note that our results are based on a year that is considered to be normal from the point of view of the amount of rainfall (Figure S1b). Thus, the effects of fragmentation on fire incidence and intensity can be more significant during drought years [25,37], thus increasing carbon emissions into the atmosphere [37,64]. This scenario is worrying since the occurrence of extreme droughts events have become increasingly frequent in Amazonia, and fire occurrence is predicted to increase in the region due to climate and land use change synergies [65,66,67].

6.3. Implications of the Effect of Fragmentation on Fire Occurrence in Amazonia for the Brazilian Forest Code

Land use regulation is a critical component of forest governance and conservation strategies [68]. In Brazil, the Brazilian Forest Code (BFC) is the main law for regulating land use with the objective of conserving native vegetation. Two instruments of this legislation are highlighted, the first is the Legal Reserve (LR), which requires the maintenance of at least 80% of intact forest areas on private properties in the Amazon biome; and, the other is the Permanent Preservation Area (PPA), which includes both Riparian Preservation Areas (RPA) that protect riverside forest buffers and Hilltop Preservation Areas in high elevations and steep slopes [69].
Our results showed that forest removal values limited by 20% guarantee a smaller number of patches (0–20 patches per 100 km−2) with larger average areas (90–100 km2) and a lower proportion of forest edges (0–2 km·km−2) in relation to higher levels of habitat loss. This HL threshold coincides with values where the incidence and intensity of fire are significantly smaller when compared to the other levels of HL. The susceptibility of the landscape to forest fires clearly increases with greater HL. Therefore, maintaining native vegetation in at least 80% of the rural properties area, as prescribed in the LR definition for the Amazon biome, allow for low levels of fire incidence, even if the ignition sources are present. Regions with a lower proportion of forest cover are clearly more susceptible to forest degradation due to fire, unless appropriate prevention and management techniques are applied.
In 2012, the BFC was reviewed, and based on our results we argue that some of the current BFC rules for LR and PPA areas can contribute to increasing fire incidence and intensity in the Amazon region, since they substituted some instruments established in the previous version of the law. The most worrying from a conservation point of view is that “small” properties (from 40 ha to 440 ha depending on the region) were exempted from recovering areas of LR that were deforested illegally before 2008. Furthermore, the vegetation of PPA within a property is now considered to be part of the LR, while before the law’s modification, the PPA and the LR areas were computed separately, as they serve to different conservation purposes. Additionally, the requirements for the restoration of PPA and the maintenance of LR were reduced. The LR requirement for 80% intact forest was reduced to 50% when (1) the proportion of conservation areas and indigenous territories within Amazonian municipalities is equal to or higher than 50% or (2) conservation areas and indigenous territories represent 65% of the state territory. These legal modifications together reduced the country’s “forest debt” by 58% [69], which may allow for the maintenance of the fragmentation of Amazonian landscapes, keeping them susceptible to the occurrence of fire, as we demonstrated in our results.
Another legal modification allowed the rural owner who has forest liabilities to compensate for it in other properties that were located anywhere in the same biome. Given the vast extent of Brazilian biomes, this implies that an owner may compensate for an illegally deforested area by restoring another over 3000 km away. Such restoration effort, if undertaken in a region where forest cover is already well preserved, would not recover the landscape structure and local environmental services where it is needed most. Thus, the displacement of restoration efforts from highly fragmented to more preserved areas would make the former regions more susceptible to the incidence of fire.
According to the BFC, economic exploitation is allowed in the LR areas, including the collection of non-timber forest products (fruits, vines, leaves, and seeds) and the commercial and non-commercial selective extraction of wood. The sustainable economic exploitation of the forest is important for the rural owner as a source of income, thus avoiding the deforestation of the LR areas. However, good forest management practices should be applied. Selective logging can increase the forest susceptibility to fire [70] due the canopy damage [71,72,73,74], which allows for the penetration of solar radiation, raising the temperature, and decreasing the humidity within the forest. These microclimate changes that are associated with the greater amount of dead biomass are caused mainly by the logging operations [75], thus resulting in more severe fires [76,77].
This whole context is worrisome since the main sources of fire ignition in the Amazonia are related to the management of adjacent agricultural and livestock areas. The flexibilization of the Forest Code in comparison to its predecessor allowed for the maintenance of extensive fragmented areas, mainly in the region of the deforestation arc, where there are intense anthropic activities [53], and therefore abundant ignition sources.

7. Conclusions

We conclude that the susceptibility of the landscape to forest fires increases at the beginning of the deforestation process. In general, our results reinforce the need to guarantee low levels of fragmentation in the Brazilian Amazonia in order to avoid the degradation of its forests by fire and the related carbon emissions [37,64]. Future work could examine whether the relations that were found here are kept or modified during extreme drought events.
The reduction of forest liabilities resulting from the last modification of the forest code increases the probability of occurrence of forest degradation by fire since it allows the existence of areas with less than 80% of forest cover, contributing to the maintenance of high levels of fragmentation.
We anticipate that forest degradation by fire will continue to increase in the region, especially in light of the mentioned environmental law relaxation and its synergistic effects with climate change. All of this can affect efforts to Reduce Emissions from Deforestation and Forest Degradation (REDD). Therefore, actions to prevent and manage forest fires are necessary, mostly for the properties where forest liabilities exist and are compensated in other regions.

Supplementary Materials

The following are available online at https://www.mdpi.com/1999-4907/9/6/305/s1, Figure S1: (a) Seasonal rainfall pattern (the vertical black lines are the standard deviations). (b) Normalized rainfall anomalies (1998-2014), Figure S2: Boxplot of the habitat loss (HL) intervals for the number of forest patches, mean of forest patches areas and edges proportion. Figure S3: Boxplot of the fire density for the habitat loss intervals, number of forest patches, mean of forest patches areas and edges proportion. Figure S4: Boxplot of the Fire Radiative Power (FRP) for the habitat loss intervals number of forest patches, mean of forest patches areas and edges proportion. Figure S5: Boxplot of Fire Radiative Power (FRP) for different distances from the edges in forest areas and in deforested areas.

Author Contributions

C.H.L.S.J. and L.E.O.C.A. led in the design of the experiment. C.H.L.S.J. performed data analysis. C.H.L.S.J., L.E.O.C.A., M.G.F., C.T.A., L.B.V. and L.O.A. interpreted the results. C.H.L.S.J., M.G.F. and C.T.A. wrote the paper with significant contributions from all authors.

Acknowledgments

We gratefully acknowledge the Brazilian Federal Agency for Support and Evaluation of Graduate Education (CAPES) and National Council for Scientific and Technological Development (CNPq) agencies for providing research fellowships and support this work (CAPES Post-doctoral fellowship to M.G.F, CNPq-305054/2016-3, CNPq-458022/2013-6 and CNPq-300504/2016-0). L.O.A. acknowledge the productivity scholarship from CNPq (CNPq-309247/2016-0).

Conflicts of Interest

The authors declare no conflict of interest.

Appendix A

Figure A1. Graphic summary of the main results found in this paper. (a) Intact forest, with controlled microclimate, less penetration of solar radiation and action of the winds; (b) Deforested forest, resulting in a changed microclimate (higher temperature and lower humidity due to greater penetrability of solar radiation and wind action) and higher mortality rate of trees near the edges, resulting in a greater amount of available fuel material; (c) Fragmented forest, more susceptible to the occurrence of fire (more intense near the forest edge) due to the edge effect and fire escape from the agriculture and livestock management areas.
Forests 09 00305 g0a1

References

  1. Sullivan, M.J.P.; Talbot, J.; Lewis, S.L.; Phillips, O.L.; Qie, L.; Begne, S.K.; Chave, J.; Cuni-Sanchez, A.; Hubau, W.; Lopez-Gonzalez, G.; et al. Diversity and carbon storage across the tropical forest biome. Sci. Rep. 2017, 7, 39102. [Google Scholar] [CrossRef] [PubMed] [Green Version]
  2. Bonan, G.B. Forests and Climate Change: Forcings, Feedbacks, and the Climate Benefits of Forests. Science 2008, 320, 1444–1449. [Google Scholar] [CrossRef] [PubMed] [Green Version]
  3. Baccini, A.; Goetz, S.J.; Walker, W.S.; Laporte, N.T.; Sun, M.; Sulla-Menashe, D.; Hackler, J.; Beck, P.S.A.; Dubayah, R.; Friedl, M.A.; et al. Estimated carbon dioxide emissions from tropical deforestation improved by carbon-density maps. Nat. Clim. Chang. 2012, 2, 182–185. [Google Scholar] [CrossRef]
  4. Houghton, R.A.; Hall, F.; Goetz, S.J. Importance of biomass in the global carbon cycle. J. Geophys. Res. Biogeosci. 2009, 114. [Google Scholar] [CrossRef] [Green Version]
  5. Pan, Y.; Birdsey, R.A.; Fang, J.; Houghton, R.; Kauppi, P.E.; Kurz, W.A.; Phillips, O.L.; Shvidenko, A.; Lewis, S.L.; Canadell, J.G.; et al. A Large and Persistent Carbon Sink in the World’s Forests. Science 2011, 333, 988–993. [Google Scholar] [CrossRef] [PubMed]
  6. Ciais, P.; Sabine, C.; Bala, G.; Bopp, L.; Brovkin, V.; Canadell, J.; Chhabra, A.; Defries, R.; Galloway, J.; Heimann, M.; et al. Carbon and Other Biogeochemical Cycles. In Climate Change 2013—The Physical Science Basis; Intergovernmental Panel on Climate Change, Ed.; Cambridge University Press: Cambridge, UK, 2013; Volume 9781107057, pp. 465–570. ISBN 9781107415324. [Google Scholar]
  7. Saatchi, S.S.; Harris, N.L.; Brown, S.; Lefsky, M.; Mitchard, E.T.A; Salas, W.; Zutta, B.R.; Buermann, W.; Lewis, S.L.; Hagen, S.; et al. Benchmark map of forest carbon stocks in tropical regions across three continents. Proc. Natl. Acad. Sci. USA 2011, 108, 9899–9904. [Google Scholar] [CrossRef] [PubMed] [Green Version]
  8. Grace, J. Understanding and managing the global carbon cycle. J. Ecol. 2004, 92, 189–202. [Google Scholar] [CrossRef] [Green Version]
  9. Grace, J.; Mitchard, E.; Gloor, E. Perturbations in the carbon budget of the tropics. Glob. Chang. Biol. 2014, 3238–3255. [Google Scholar] [CrossRef] [Green Version]
  10. Malhi, Y. The carbon balance of tropical forest regions, 1990–2005. Curr. Opin. Environ. Sustain. 2010, 2, 237–244. [Google Scholar] [CrossRef]
  11. Houghton, R.A.; House, J.I.; Pongratz, J.; van der Werf, G.R.; DeFries, R.S.; Hansen, M.C.; Le Quéré, C.; Ramankutty, N. Carbon emissions from land use and land-cover change. Biogeosciences 2012, 9, 5125–5142. [Google Scholar] [CrossRef] [Green Version]
  12. Capobianco, J.P.R. Biodiversidade na Amazônia Brasileira: Avaliação e Ações Prioritárias Para a Conservação, Uso sustentável e Repartição de Benefícios; Instituto Socioambiental: São Paulo, Brazil, 2001; ISBN 8574480525. [Google Scholar]
  13. Coe, M.T.; Marthews, T.R.; Costa, M.H.; Galbraith, D.R.; Greenglass, N.L.; Imbuzeiro, H.M.A; Levine, N.M.; Malhi, Y.; Moorcroft, P.R.; Muza, M.N.; et al. Deforestation and climate feedbacks threaten the ecological integrity of south-southeastern Amazonia. Philos. Trans. R. Soc. Lond. B Biol. Sci. 2013, 368, 20120155. [Google Scholar] [CrossRef] [PubMed]
  14. Fearnside, P.M. Desmatamento na Amazônia brasileira: História, índices e conseqüências. Megadiversidade 2005, 1, 113–123. [Google Scholar] [CrossRef]
  15. Instituto Nacional de Pesquisas Espaciais. Monitoramento da Floresta Amazônica Brasileira por Satélite. Available online: http://www.obt.inpe.br/prodes/ (accessed on 1 January 2018).
  16. Nepstad, D.; McGrath, D.; Stickler, C.; Alencar, A.; Azevedo, A.; Swette, B.; Bezerra, T.; DiGiano, M.; Shimada, J.; da Motta, R.S.; et al. Slowing Amazon deforestation through public policy and interventions in beef and soy supply chains. Science 2014, 344, 1118–1123. [Google Scholar] [CrossRef] [PubMed]
  17. Villard, M.-A.; Metzger, J.P. Beyond the fragmentation debate: A conceptual model to predict when habitat configuration really matters. J. Appl. Ecol. 2014, 51, 309–318. [Google Scholar] [CrossRef]
  18. Fahrig, L. Effects of Habitat Fragmentation on Biodiversity. Annu. Rev. Ecol. Evol. Syst. 2003, 34, 487–515. [Google Scholar] [CrossRef]
  19. Laurance, W.F.; Williamson, G.B. Positive Feedbacks among Forest Fragmentation, Drought, and Climate Change in the Amazon. Conserv. Biol. 2001, 15, 1529–1535. [Google Scholar] [CrossRef] [Green Version]
  20. Cochrane, M.A. Synergistic interactions between habitat fragmentation and fire in evergreen tropical forests. Conserv. Biol. 2001, 15, 1515–1521. [Google Scholar] [CrossRef]
  21. Alencar, A.A.C.; Solórzano, L.A.; Nepstad, D.C. Modeling forest understory fires in an Eastern Amazonian Landscape. Ecol. Appl. 2004, 14, 139–149. [Google Scholar] [CrossRef]
  22. Cochrane, M.A.; Laurance, W.F. Fire as a large-scale edge effect in Amazonian forests. J. Trop. Ecol. 2002, 18, 311–325. [Google Scholar] [CrossRef]
  23. Cano-Crespo, A.; Oliveira, P.J.C.; Boit, A.; Cardoso, M.; Thonicke, K. Forest edge burning in the Brazilian Amazon promoted by escaping fires from managed pastures. J. Geophys. Res. Biogeosci. 2015, 120, 2095–2107. [Google Scholar] [CrossRef]
  24. Aragão, L.E.O.C.; Shimabukuro, Y.E. The incidence of fire in Amazonian forests with implications for REDD. Science 2010, 328, 1275–1278. [Google Scholar] [CrossRef] [PubMed]
  25. Aragão, L.E.O.C.; Malhi, Y.; Roman-Cuesta, R.M.; Saatchi, S.; Anderson, L.O.; Shimabukuro, Y.E. Spatial patterns and fire response of recent Amazonian droughts. Geophys. Res. Lett. 2007, 34, L07701. [Google Scholar] [CrossRef]
  26. Armenteras, D.; González, T.M.; Retana, J. Forest fragmentation and edge influence on fire occurrence and intensity under different management types in Amazon forests. Biol. Conserv. 2013, 159, 73–79. [Google Scholar] [CrossRef]
  27. Armenteras, D.; Barreto, J.S.; Tabor, K.; Molowny-Horas, R.; Retana, J. Changing patterns of fire occurrence in proximity to forest edges, roads and rivers between NW Amazonian countries. Biogeosciences 2017, 14, 2755–2765. [Google Scholar] [CrossRef] [Green Version]
  28. LEI No. 12.727, DE 17 DE OUTUBRO DE 2012. Available online: http://www.planalto.gov.br/ccivil_03/_ato2011-2014/2012/lei/l12727.htm (accessed on 10 January 2018).
  29. Vieira, S.; de Camargo, P.B.; Selhorst, D.; da Silva, R.; Hutyra, L.; Chambers, J.Q.; Brown, I.F.; Higuchi, N.; dos Santos, J.; Wofsy, S.C.; et al. Forest structure and carbon dynamics in Amazonian tropical rain forests. Oecologia 2004, 140, 468–479. [Google Scholar] [CrossRef] [PubMed] [Green Version]
  30. Pinheiro, T.F.; Escada, M.I.S.; Valeriano, D.M.; Hostert, P.; Gollnow, F.; Müller, H. Forest Degradation Associated with Logging Frontier Expansion in the Amazon: The BR-163 Region in Southwestern Pará, Brazil. Earth Interact. 2016, 20, 1–26. [Google Scholar] [CrossRef]
  31. Arima, E.Y.; Walker, R.T.; Perz, S.; Souza, C. Explaining the fragmentation in the Brazilian Amazonian forest. J. Land Use Sci. 2016, 11, 257–277. [Google Scholar] [CrossRef]
  32. De Almeida, C.A.; Coutinho, A.C.; Esquerdo, J.C.D.M.; Adami, M.; Venturi, A.; Diniz, C.G.; Dessay, N.; Durieux, L.; Gomes, A.R. High spatial resolution land use and land cover mapping of the Brazilian Legal Amazon in 2008 using Landsat-5/TM and MODIS data. Acta Amaz. 2016, 46, 291–302. [Google Scholar] [CrossRef] [Green Version]
  33. Giglio, L.; Schroeder, W.; Justice, C.O. The collection 6 MODIS active fire detection algorithm and fire products. Remote Sens. Environ. 2016, 178, 31–41. [Google Scholar] [CrossRef]
  34. Giglio, L.; Descloitres, J.; Justice, C.O.; Kaufman, Y.J. An Enhanced Contextual Fire Detection Algorithm for MODIS. Remote Sens. Environ. 2003, 87, 273–282. [Google Scholar] [CrossRef]
  35. Wooster, M.J.; Roberts, G.; Perry, G.L.W.; Kaufman, Y.J. Retrieval of biomass combustion rates and totals from fire radiative power observations: FRP derivation and calibration relationships between biomass consumption and fire radiative energy release. J. Geophys. Res. 2005, 110, D24311. [Google Scholar] [CrossRef]
  36. Instituto Nacional de Pesquisas Espaciais. Monitoramento de Queimadas. Available online: http://www.inpe.br/queimadas/portal (accessed on 1 January 2018).
  37. Aragão, L.E.O.C.; Anderson, L.O.; Fonseca, M.G.; Rosan, T.M.; Vedovato, L.B.; Wagner, F.H.; Silva, C.V.J.; Silva Junior, C.H.L.; Arai, E.; Aguiar, A.P.; et al. 21st Century drought-related fires counteract the decline of Amazon deforestation carbon emissions. Nat. Commun. 2018, 9, 536. [Google Scholar] [CrossRef] [PubMed]
  38. Jung, M. LecoS—A python plugin for automated landscape ecology analysis. Ecol. Inform. 2016, 31, 18–21. [Google Scholar] [CrossRef]
  39. QGIS Development Team. QGIS Geographic Information System. Available online: http://qgis.osgeo.org (accessed on 22 June 2016).
  40. Hayes, J.J.; Robeson, S.M. Relationships between fire severity and post-fire landscape pattern following a large mixed-severity fire in the Valle Vidal, New Mexico, USA. For. Ecol. Manag. 2011, 261, 1392–1400. [Google Scholar] [CrossRef]
  41. McGarigal, K. Fragstats Help. Available online: http://www.umass.edu/landeco/research/fragstats/documents/fragstats.help.4.2.pdf (accessed on 21 April 2015).
  42. Saito, É.A.; Fonseca, L.M.G.; Escada, M.I.S.; Korting, T.S. Efeitos da mudança de escala em padrões de desmatamento na Amazônia. Rev. Bras. Cartogr. 2011, 63, 401–414. [Google Scholar]
  43. Cleveland, W.S.; Grosse, E.; Shyu, W.M. Local regression models. In Statistical Models in S; Chambers, J.M., Hastie, T.J., Eds.; Chapman and Hall: New York, NY, USA, 1992; pp. 309–376. [Google Scholar]
  44. Cleveland, W.S.; Loader, C. Smoothing by Local Regression: Principles and Methods. In Statistical Theory and Computational Aspects of Smoothing; Härdle, W., Schimek, M.G., Eds.; Physica-Verlag: Heidelberg, Germany, 1996. [Google Scholar]
  45. Tate, N.J.; Brunsdon, C.; Charlton, M.; Fotheringham, A.S.; Jarvis, C.H. Smoothing/filtering LiDAR digital surface models. Experiments with loess regression and discrete wavelets. J. Geogr. Syst. 2005, 7, 273–290. [Google Scholar] [CrossRef] [Green Version]
  46. Gibbons, J.D.; Chakraborti, S. Nonparametric Statistical Inference. In International Encyclopedia of Statistical Science; Lovric, M., Ed.; Springer: Berlin/Heidelberg, Germany, 2011; pp. 977–979. [Google Scholar]
  47. Hettmansperger, T.P.; McKean, J.W. Robust Nonparametric Statistical Methods, 2nd ed.; CRC Press: Boca Raton, FL, USA, 2010; ISBN 9781439809082. [Google Scholar]
  48. Bonnini, S.; Corain, L.; Marozzi, M.; Salmaso, L. Nonparametric Hypothesis Testing. In Wiley Series in Probability and Statistics; John Wiley & Sons: Chichester, UK, 2014; ISBN 9781118763490. [Google Scholar]
  49. Conover, W.J. Practical Nonparametric Statistics, 3rd ed.; John Wiley & Sons: ‎Hoboken, NJ, USA, 1999; ISBN 978-0471160687. [Google Scholar]
  50. R Core Team. R: A Language and Environment for Statistical Computing. Available online: Https://www.r-project.org/ (accessed on 1 January 2018).
  51. Ripley, B.D. Local Polynomial Regression Fitting. Available online: http://stat.ethz.ch/R-manual/R-devel/library/stats/html/loess.html (accessed on 1 January 2018).
  52. De Mendiburu, F. Statistical Procedures for Agricultural Research. Available online: https://cran.r-project.org/web/packages/agricolae/agricolae.pdf (accessed on 1 January 2017).
  53. Vedovato, L.B.; Fonseca, M.G.; Arai, E.; Anderson, L.O.; Aragão, L.E.O.C. The extent of 2014 forest fragmentation in the Brazilian Amazon. Reg. Environ. Chang. 2016, 16, 2485–2490. [Google Scholar] [CrossRef]
  54. De Filho, F.J.B.O.; Metzger, J.P. Thresholds in landscape structure for three common deforestation patterns in the Brazilian Amazon. Landsc. Ecol. 2006, 21, 1061–1073. [Google Scholar] [CrossRef]
  55. Numata, I.; Cochrane, M.A.; Roberts, D.A.; Soares, J.V.; Souza, C.M.; Sales, M.H. Biomass collapse and carbon emissions from forest fragmentation in the Brazilian Amazon. J. Geophys. Res. 2010, 115, G03027. [Google Scholar] [CrossRef]
  56. Laurance, W.F.; Laurance, S.G.; Delamonica, P. Tropical forest fragmentation and greenhouse gas emissions. For. Ecol. Manag. 1998, 110, 173–180. [Google Scholar] [CrossRef]
  57. Liu, Z.; He, C.; Wu, J. The Relationship between Habitat Loss and Fragmentation during Urbanization: An Empirical Evaluation from 16 World Cities. PLoS ONE 2016, 11, e0154613. [Google Scholar] [CrossRef] [PubMed]
  58. Cochrane, M.A.; Laurance, W.F. Synergisms among Fire, Land Use, and Climate Change in the Amazon. AMBIO A J. Hum. Environ. 2008, 37, 522–527. [Google Scholar] [CrossRef] [Green Version]
  59. Laurance, W.F.; Camargo, J.L.C.; Fearnside, P.M.; Lovejoy, T.E.; Williamson, G.B.; Mesquita, R.C.G.; Meyer, C.F.J.; Bobrowiec, P.E.D.; Laurance, S.G.W. An Amazonian rainforest and its fragments as a laboratory of global change. Biol. Rev. 2018, 93, 223–247. [Google Scholar] [CrossRef] [PubMed]
  60. Berenguer, E.; Ferreira, J.; Gardner, T.A.; Aragão, L.E.O.C.; De Camargo, P.B.; Cerri, C.E.; Durigan, M.; De Oliveira, R.C.; Vieira, I.C.G.; Barlow, J. A large-scale field assessment of carbon stocks in human-modified tropical forests. Glob. Chang. Biol. 2014, 20, 3713–3726. [Google Scholar] [CrossRef] [PubMed] [Green Version]
  61. Aragão, L.E.O.C.; Malhi, Y.; Barbier, N.; Lima, A.A.; Shimabukuro, Y.; Anderson, L.; Saatchi, S. Interactions between rainfall, deforestation and fires during recent years in the Brazilian Amazonia. Philos. Trans. R. Soc. Lond. B Biol. Sci. 2008, 363, 1779–1785. [Google Scholar] [CrossRef] [PubMed] [Green Version]
  62. Rosan, T.M.; Anderson, L.O.; Vedovato, L. Assessing the Origin of Hot Pixels in Extreme Climate Years in the Brazilian Amazon. Rev. Bras. Cartogr. 2017, 69, 731–741. [Google Scholar]
  63. Briant, G.; Gond, V.; Laurance, S.G.W. Habitat fragmentation and the desiccation of forest canopies: A case study from eastern Amazonia. Biol. Conserv. 2010, 143, 2763–2769. [Google Scholar] [CrossRef]
  64. Anderson, L.O.; Aragão, L.E.O.C.; Gloor, M.; Arai, E.; Adami, M.; Saatchi, S.S.; Malhi, Y.; Shimabukuro, Y.E.; Barlow, J.; Berenguer, E.; et al. Disentangling the contribution of multiple land covers to fire-mediated carbon emissions in Amazonia during the 2010 drought. Glob. Biogeochem. Cycles 2015, 29, 1739–1753. [Google Scholar] [CrossRef] [PubMed] [Green Version]
  65. Marengo, J.A.; Espinoza, J.C. Extreme seasonal droughts and floods in Amazonia: Causes, trends and impacts. Int. J. Climatol. 2016, 36, 1033–1050. [Google Scholar] [CrossRef]
  66. Malhi, Y.; Roberts, J.T.; Betts, R.A.; Killeen, T.J.; Li, W.; Nobre, C.A. Climate Change, Deforestation, and the Fate of the Amazon. Science 2008, 319, 169–172. [Google Scholar] [CrossRef] [PubMed] [Green Version]
  67. Le Page, Y.; Morton, D.; Hartin, C.; Bond-Lamberty, B.; Pereira, J.M.C.; Hurtt, G.; Asrar, G. Synergy between land use and climate change increases future fire risk in Amazon forests. Earth Syst. Dyn. 2017, 8, 1237–1246. [Google Scholar] [CrossRef] [Green Version]
  68. Stickler, C.M.; Nepstad, D.C.; Azevedo, A.A.; McGrath, D.G. Defending public interests in private lands: Compliance, costs and potential environmental consequences of the Brazilian Forest Code in Mato Grosso. Philos. Trans. R. Soc. B Biol. Sci. 2013, 368, 20120160. [Google Scholar] [CrossRef] [PubMed]
  69. Soares-Filho, B.; Rajao, R.; Macedo, M.; Carneiro, A.; Costa, W.; Coe, M.; Rodrigues, H.; Alencar, A. Cracking Brazil’s Forest Code. Science. 2014, 344, 363–364. [Google Scholar] [CrossRef] [PubMed]
  70. Holdsworth, A.R.; Uhl, C. Fire in Amazonian selectively logged rain forest and the potential for fire reduction. Ecol. Appl. 1997, 7, 713–725. [Google Scholar] [CrossRef]
  71. Pereira, R.; Zweede, J.; Asner, G.P.; Keller, M. Forest canopy damage and recovery in reduced-impact and conventional selective logging in eastern Para, Brazil. For. Ecol. Manag. 2002, 168, 77–89. [Google Scholar] [CrossRef]
  72. Asner, G.P.; Broadbent, E.N.; Oliveira, P.J.C.; Keller, M.; Knapp, D.E.; Silva, J.N.M. Condition and fate of logged forests in the Brazilian Amazon. Proc. Natl. Acad. Sci. USA 2006, 103, 12947–12950. [Google Scholar] [CrossRef] [PubMed] [Green Version]
  73. Verissimo, A.; Barreto, P.; Mattos, M.; Tarifa, R.; Uhl, C. Logging impacts and prospects for sustainable forest management in an old Amazonian frontier: The case of Paragominas. For. Ecol. Manag. 1992, 55, 169–199. [Google Scholar] [CrossRef]
  74. Uhl, C.; Vieira, I.C.G. Ecological Impacts of Selective Logging in the Brazilian Amazon: A Case Study from the Paragominas Region of the State of Para. Biotropica 1989, 21, 98. [Google Scholar] [CrossRef]
  75. Uhl, C.; Barreto, P.; Vidal, E.; Amaral, P.; Barros, A.C.; Souza, C.; Johns, J.; Gerwing, J. Natural Resource Management in the Brazilian Amazon. Bioscience 1997, 47, 160–168. [Google Scholar] [CrossRef] [Green Version]
  76. Gerwing, J.J. Degradation of forests through logging and fire in the eastern Brazilian Amazon. For. Ecol. Manag. 2002, 157, 131–141. [Google Scholar] [CrossRef]
  77. Siegert, F.; Ruecker, G.; Hinrichs, A.; Hoffmann, A.A. Increased damage from fires in logged forests during droughts caused by El Niño. Nature 2001, 414, 437–440. [Google Scholar] [CrossRef] [PubMed]
Figure 1. Location map of the study area. On the main map, in green are the old-growth and secondary forest areas, in magenta the productive lands and in purple the burned areas. Composition of Landsat 8 images (Operational Land Imager (OLI) sensor) for the dry season of the year 2014 (RGB composite: Shortwave Infrared 1 in Red, Near Infrared in Green and Red in Blue).
Forests 09 00305 g001
Figure 2. Landscape metrics as a function of Habitat Loss (HL): (a) relationship between Habitat Loss and Number of Forest Patches (NFP); (b) relationship between Habitat Loss and Mean of Forest Patches Areas (MFPA); and, (c) relationship between Habitat Loss and Edges Proportion (EP). Shaded areas represent 95% confidence intervals. The missing confidence intervals in some regions of the graphs are the result of the dispersion in the data at the upper end of the distribution.
Forests 09 00305 g002
Figure 3. Fire Density (FD) as a function of (a) Habitat Loss (HL); (b) Number of Forest Patches (NFP); (c) Mean Forest Patches areas (MFPA); and, (d) Edges Proportion (EP). Shaded areas represent 95% confidence intervals. The missing confidence intervals in some regions of the graphs are the result of the dispersion in the data at the upper end of the distribution.
Forests 09 00305 g003
Figure 4. Mean Fire Radiative Power (FRP) as a function of (a) Habitat Loss; (b) Number of Forest Patches (NFP); (c) Mean of Forest Patches Areas (MFPA); and, (d) Edges Proportion (EP). Shaded areas represent 95% confidence intervals. The missing confidence intervals in some regions of the graphs are the result of the dispersion in the data at the upper end of the distribution.
Forests 09 00305 g004
Table 1. Regroups of the original classes of the Amazonia Land-use Land-cover Monitoring Project (TerraClass Project) to obtain the forest cover map.
Original ClassesNew Classes
Forest, Secondary Forest, Cerrado (Brazilian Savanna) and HydrographyForest Cover
Annual Crops, Urban area, Deforestation in 2014, Mining, Mosaic of Uses, Others, Pasture with exposed soil, Herbaceous Pastures, Shrubby Pasture and Regeneration with PastureDeforested Areas
Table 2. Landscape metrics used and their respective descriptions.
Landscape MetricAbbreviationEquationDescription
Habitat LossHL j = 1 n a i j A × 100 The sum of all deforested areas within a cell, divided by total cell area, and multiplied by 100 (to convert to a percentage). The final unit is given in percentage (%). Where aij is the area (km2) of patch ij, and A is total cell area (km2).
Edges ProportionEP k = 1 n e j k j = 1 n a i j The sum of the lengths of all forest edge segments within a cell, divided by total area of all forest patches. The final unit is given in kilometres of edge per square kilometres of forest (km·km−2). Where eik is the total length (km) of edge in patch i, and aij is the area (km2) of patch ij.
Number of Forest PatchesNFPniThe number of forest patches within a cell (ni).
Mean Forest Patch AreaMFPA j = 1 n a i j n i The mean area of all forest patches in each cell. The final unit is given in square kilometres (km2). Where aij is the area (km2) of patch ij, and ni is the total of patches within a cell.
Table 3. Total of active fires per edge distance.
Class CoverEdge DistanceTotal Number of Active Fires% of the Total
Forest Cover>3 km100.62
2 km664.07
1 km154695.31
Deforested Areas1 km247798.92
2 km271.08
>3 km *00
* No active fires were observed.
Table 4. Percentage of Fire Radiative Power (FRP) per edges distance interval and fire intensity class.
Class CoverEdge DistanceClass of FRP (%)
<50 MW50–500 MW500–1000 MW>1000 MW
Forest Cover>3 km90.0010.0000
2 km75.7624.2400
1 km70.6328.010.970.39
Deforested Areas1 km74.4424.340.930.28
2 km74.0725.9300
>3 km *0000
* No active fires were observed.

