Article

Differences in Leaf Temperature between Lianas and Trees in the Neotropical Canopy

by
J. Antonio Guzmán Q.
,
G. Arturo Sánchez-Azofeifa
* and
Benoit Rivard
Center for Earth Observation Sciences, Department of Earth and Atmospheric Sciences, University of Alberta, Edmonton, AB T6G 2E3, Canada
*
Author to whom correspondence should be addressed.
Forests 2018, 9(6), 307; https://doi.org/10.3390/f9060307
Submission received: 19 April 2018 / Revised: 18 May 2018 / Accepted: 30 May 2018 / Published: 1 June 2018
(This article belongs to the Section Forest Ecophysiology and Biology)

Abstract

:
Leaf temperature (Tleaf) influences photosynthesis and respiration. Currently, there is a growing interest in including lianas in productivity models due to their increasing abundance and their detrimental effects in the carbon stock of tropical ecosystems. Therefore, understanding the differences of Tleaf between lianas and trees is important for future predictions of productivity. Here, we determined the displayed leaf temperature (Td = Tleaf − air temperature) of several species of lianas and their host trees during El Niño-Southern Oscillation (ENSO) and non-ENSO years to evaluate if the presence of lianas affects the Td of their host trees, and if leaves of lianas and their host trees exhibit differences in Td. Our results suggest that close to midday, the presence of lianas does not affect the Td of their host trees; however, lianas tend to have higher values of Td than their hosts across seasons, in both ENSO and non-ENSO years. Although lianas and trees tend to have similar physiological-temperature responses, differences in Td could lead to significant differences in rates of photosynthesis and respiration based on temperature response curves. Future models should thus consider differences in leaf temperature between these two life forms to achieve robust predictions of productivity.

1. Introduction

Variations in leaf temperature (Tleaf) have been considered a factor that can affect the net primary productivity of the biosphere. Most Terrestrial Biosphere Models (TBMs) use kinetic constants of Tleaf dependence to evaluate the response of photosynthesis and respiration in a given ecosystem [1]. However, the increasing effects of global warming and the high diversity of species and ecological strategies pose a challenge to determining with accuracy the Tleaf of different individuals and plant communities. In tree communities of temperate regions, Leuzinger & Körner [2] have found that the presence or absence of certain tree species in the canopy can play a significant role in the control of the forest surface temperature. This control depends in large part on the spatial arrangement and leaf functional traits of such species, such as the stomatal conductance and the capacity of leaf cooling associated with water transpiration [3,4,5]. Currently, there is no concrete evidence of how the spatial arrangement of species can affect the forest surface temperature of a tropical forest; nevertheless, it could be expected that the high diversity of species, life forms, and functional traits produce a highly dynamic surface temperature that could reduce our ability to predict different ecological processes.
Studies have shown several implications of the increasing temperature on ecological processes at different levels. For example, at the leaf level, increases in temperature above the photosynthesis optimum are associated with the decline of CO2 assimilation rates [6,7], stomatal conductance [8], and increases in respiration [9]; trends that can vary widely among species and life forms [7,9,10]. Likewise, at the ecosystem level in tropical forests, climate warming is associated with long-term increases in biomass [11] and the dominance of plants such as lianas [12].
Associated with this later life form, since 2002, studies have reported a notable increase in liana abundance in tropical and temperate environments [13,14,15,16,17]. Likewise, other studies have shown significant detrimental effects of lianas presence on the tree recruitment, growth, survival, and carbon stock [18,19,20]. Together, these trends have cast doubt on the accuracy of some TBMs that predict the carbon cycle [21] highlighting the need to incorporate lianas as a future factor in such models for a better understanding of the ecosystem dynamics. Currently, most of the temperature–response studies that have compared the physiological performance of lianas and trees at the leaf-level suggest that there is no need to make a distinction between the physiological behavior of these life forms in future models [7,9,10,22]. However, the higher interception of light by lianas [23] and the greater competitive advantage of lianas in water use [24] suggests that their Tleaf may differ from that of their host trees, and might also affect Tleaf of their hosts; such differences in Tleaf between these life forms could reduce our ability to predict carbon fluxes in tropical forest canopies accurately.
In this study, we analyze the intra- and inter-specific trends in Tleaf for full-sun exposed leaves of several liana species and four host trees of a neotropical seasonal forest in Panama. We achieved this by using thermography and addressed two hypotheses at the canopy level: (i) the presence of lianas affects the leaf temperature of their host trees (intra-specific trends), and (ii) leaves of lianas and their host trees exhibit differences in leaf temperature (inter-specific trends). These hypotheses were addressed by observing temporal variations during the wet and dry seasons in contrasting El Niño (2015–2016) and La Niña years (2016–2017). Our hypotheses were tested using the displayed leaf temperature (Td) as the difference of Tleaf obtained from the thermal images minus the ambient air temperature (Ta). The Td was estimated as a proxy of Tleaf in order to reduce the effect of the variation of the surrounding Ta during each measurement and perform temporal comparisons.
We hypothesized that leaves of trees with lianas would experience higher values of Td than leaves of trees without lianas. This is based on the negative effects of lianas on trees associated with the ability of lianas to reduce the water availability around their host trees [25]; a process that could affect the heat dissipation by transpiration of leaves of host trees [26]. Likewise, we expect that leaves of lianas would show lower Td in comparison with host tree leaves; due to their ability to grow in drought environments [16] and their greater competitive advantage on the acquisition, regulation, and efficient use of water in comparison with trees [24,27,28,29]. In addition, we hypothesized that during years with little rainfall or few seasons with droughts (La Niña year or dry seasons), leaves of both life forms will show higher values of Td due to the high evaporative demand of the surrounding environment [30]. To address our hypotheses, we used unpublished values of leaf emissivity for each life form to calculate the Tleaf. To show the impact of the differences in Td, and consequently Tleaf, on carbon fluxes between these life forms, we calculated rates of respiration (R) and photosynthesis (P) using equations of temperature-response previously published by Slot et al. [9] and Slot & Winter [7], and our estimations of Tleaf. Our results highlight the fact that lianas are an important biotic factor at the canopy level, that in turn can affect forest temperature. Therefore, their differential expression in Tleaf should be considered for future predictions of forest productivity; that could become a part of the challenge of including lianas in future global vegetation models [31].

2. Materials and Methods

2.1. Study Site

This study was conducted in Parque Natural Metropolitano (PNM, 8°59′39.95″ N, 79°32′34.68″ W, 150 m a.s.l.) that is located west of Panama City on the Pacific coast of the Republic of Panama. This site presents a tropical dry forest with a mean annual temperature of 26.5 °C and annual rainfall average of 1740 mm. In general, the region is characterized by two contrasting seasons: a wet season between May and December when most of the rainfall occurs, and a dry season between January and March (Figure S1). The PNM contains 265 ha of natural forest reserve with an old secondary forest of 80–150 years with tree heights of up to 40 m. This site has a 42 m standing crane with a 51 m long jib with a suspended cage that was used to access the top of the canopy. The crane covers approximately 8000 m2 of forest in which 65 and 20 species of trees and lianas can be found, respectively [32]. Using this crane, we conducted four data collection campaigns: November 2015, February 2016, October 2016, and February 2017 (two in wet and two in dry seasons). The first two campaigns were conducted during a strong El Niño year, while the last two campaigns occurred during a starting La Niña year. A mosaic of the canopy at PNM captured on December 2015 can be observed at http://www.gigapan.com/gigapans/196831.

2.2. Species Selection and Field Design

At the top of the canopy, we selected four of the most abundant tree species that were fully exposed to the sun: Anacardium excelsum (Bertero & Balb. ex Kunth), a late-successional species; Annona spraguei (Saff.), a mid-successional species; Castilla elastica (Liebm.), a mid-successional species; and Luehea seemannii (Triana & Planch), an early-successional species. We took between two and six fusion images (RGB and thermal) at the top of the crown for two or four individuals of each species with lianas and without lianas. The categorization of a tree with or without lianas was based on canopy observations without considering the possible presence of lianas on trees that do not reach the top-crown. The fusion images used in this study were collected with a FLIR T400 thermal infrared camera (FLIR Systems AB, Danderyd, Sweden). Samples from A. spraguei were only collected during an El Niño year due to fact that our sampling trees died after this period. The fusion images were collected with a thermal camera that has a wavelength range between 7.3 and 13 µm, a standard calibration range from −20 to 650 °C, an image of 320 × 240 pixels, and a temperature error of 2% (e.g., 2% of 30 °C = ±0.6 °C). The thermal imagery was acquired between 10:00 a.m. and 12:00 p.m. (Figure S2). The distance between the camera and the target surface in the tree was estimated to be 1.8 m, leading to a nominal spatial resolution of ~26.4 mm per pixel.

2.3. Estimation of the Leaf Temperature

From each thermal image acquired with the FLIR T410, we estimated the Tleaf for the upper-middle region of the leaf blade from five leaves of trees and lianas (in trees with liana infestation). Selected leaves did not have apparent mechanical damage or evidence of herbivore attacks. The estimation of Tleaf from the thermal images was performed using the FLIR Tools 5.12 software (http://www.flir.com/instruments/display/?id=51975). To compute the Tleaf, we used the mean relative air humidity and air temperature (Ta) recorded every 15 min by a meteorological station located at the crane’s structure. These meteorological station data sets were provided by the Physical Monitoring Program of the Smithsonian Tropical Research Institute (STRI). Likewise, we used the same value of Ta as a reflected temperature (or commonly known as background radiance) to compute the Tleaf; due to the fact that high emissivity and closed objects allow accurate temperature measurements in almost any background radiance conditions [33]. In addition, to compute Tleaf, the emissivity of leaves for the four tree species and seven lianas species was estimated in February 2017 using the reference emissivity technique [34] (data unpublished). The calculation of the Tleaf for lianas was performed using the mean value of emissivity (0.983) estimated for this life form, while the calculation for leaves of trees was conducted using the mean value of emissivity determined for each species (A. excelsum = 0.976; A. spraguei = 0.977; C. elastica = 0.976; L. seemannii = 0.980). Following the estimation of Tleaf, we computed the displayed leaf temperature (Td) for each leaf as the difference of TleafTa. For its nature, Td can show positive and negative values, where positive values describe the hottest leaves and negative values the cooler leaves, according to the surrounding environment. As mentioned in the introduction, this calculation was conducted as a parameter that can allow us to reduce the temporal variation of the ambient temperature between seasons and years. These values of Td were used later to perform the statistical comparisons below.

2.4. Estimations of Photosynthesis and Leaf Respiration

We calculated the leaf photosynthesis (P, μmol CO2 m−2 s−1) and leaf dark respiration (R, μmol CO2 m−2 s−1) to show that despite the similar physiological–temperature behavior of these life forms [7], differences in leaf temperature combined with the physiological performance can produce different estimations of productivity for these functional groups at the leaf level. These gas exchange traits were estimated using the equations and parameters published by Slot & Winter [7] (See Equation (1)) and derived from Slot et al. [9] (See Equation (2)) for the species of trees (excluding A. spraguei) and lianas of this study:
P = P opt   ×   e ( T leaf   T opt Ω ) 2
R =   R 25   ×   Q 10 ( T leaf 25 ) / 10
where Popt is the maximum rate of photosynthesis at an optimum temperature (Topt), Ω represents the difference in temperature between Topt and the temperature in which P drops to 37% of its value at Topt, R25 is the leaf respiration at 25 °C, Q10 is the proportional increase in R with a 10 °C temperature rise, and Tleaf is our actual measurements of leaf temperature using thermography. A. spraguei was excluded in this analysis due to the lack of data during the La Niña year. Because we did not identify lianas species, we estimated the gas exchange traits using the mean values reported by [7,9] as a functional group. Likewise, for the case of A. excelsum, we estimated P by the published values for Parque Nacional San Lorenzo, Panama. Using the selected leaves for our second hypothesis, we solved these equations assuming that the kinetic leaf temperature is equal to our estimation of Tleaf. This aims to simulate the productivity at the leaf level based on the surface canopy temperature that it is commonly used by most of the TBMs.
Although studies have reported a significant variation in photosynthesis and respiration performance of lianas and trees between seasons [28], we conducted these calculations assuming a lack of seasonal variation in the physiological behavior. From the values of P and R extracted above, we calculated the normalized differences based on each species of host tree following:
Normalized   P   or   R = P   o r   R   v a l u e P   o r   R   m e a n P   o r   R   s t a n d a r   d e v i a i o n
This latter calculation was implemented to reduce the temporal variation of leaf temperature which can produce erroneous interpretations from the comparisons of P and R across seasons and ENSO years. The resulting values from this normalization are unitless, and the magnitude of their variation can be compared between life forms, seasons, and ENSO years.

2.5. Data Analysis

To address our hypotheses, we used linear mixed-effect models to compare the variability of the Td according to the season, ENSO year, and: (i) the presence of lianas on the Td of trees, or (ii) differences between leaf type (liana and tree) on the Td. To test for the differences of Td between leaf types, we only considered leaves of trees with lianas. On average, more than 240 estimations of Td were used in each analysis. A detailed description of the sample size (number of tree individuals, thermal images, and Td estimations) used in each analysis is shown in Tables S1 and S2. Due to the hierarchical nature of our design, linear mixed-effect models that combine fixed and random components [35] were used to reduce the “random” factors that we cannot control in the field such as micro-climatic variations on leaves or the health of the individuals. Specifically, our model can be described by the following equation:
T d =   α +   β 1 i j + S e a s o n i j + E N S O i j +   β 1 i j × S e a s o n i j + β 1 i j × E N S O i j + S e a s o n i j × E N S O i j + β 1 i j × S e a s o n i j × E N S O i j + a i | j + e i j  
where α represents the intercept, β1 the presence of lianas for our first hypothesis and the leaf type for our second hypothesis, e the unexplained error, and a the random factor which is affected by each thermal image (i) nested within each individual (j). We considered each tree from each campaign of data collection as an independent sample. Likewise, we applied this same analysis to compare the variations of the normalized differences of P and R using these parameters as response variables and β1 as leaf type. These analyses were performed using the nlme package [36] under the open-source statistical software R version 3.3.1 [37]. Box-Cox transformations were performed when the normality of the data was not reached. In all cases, we used the standard error (SE) as a descriptor of the sampling distribution around the mean.

3. Results

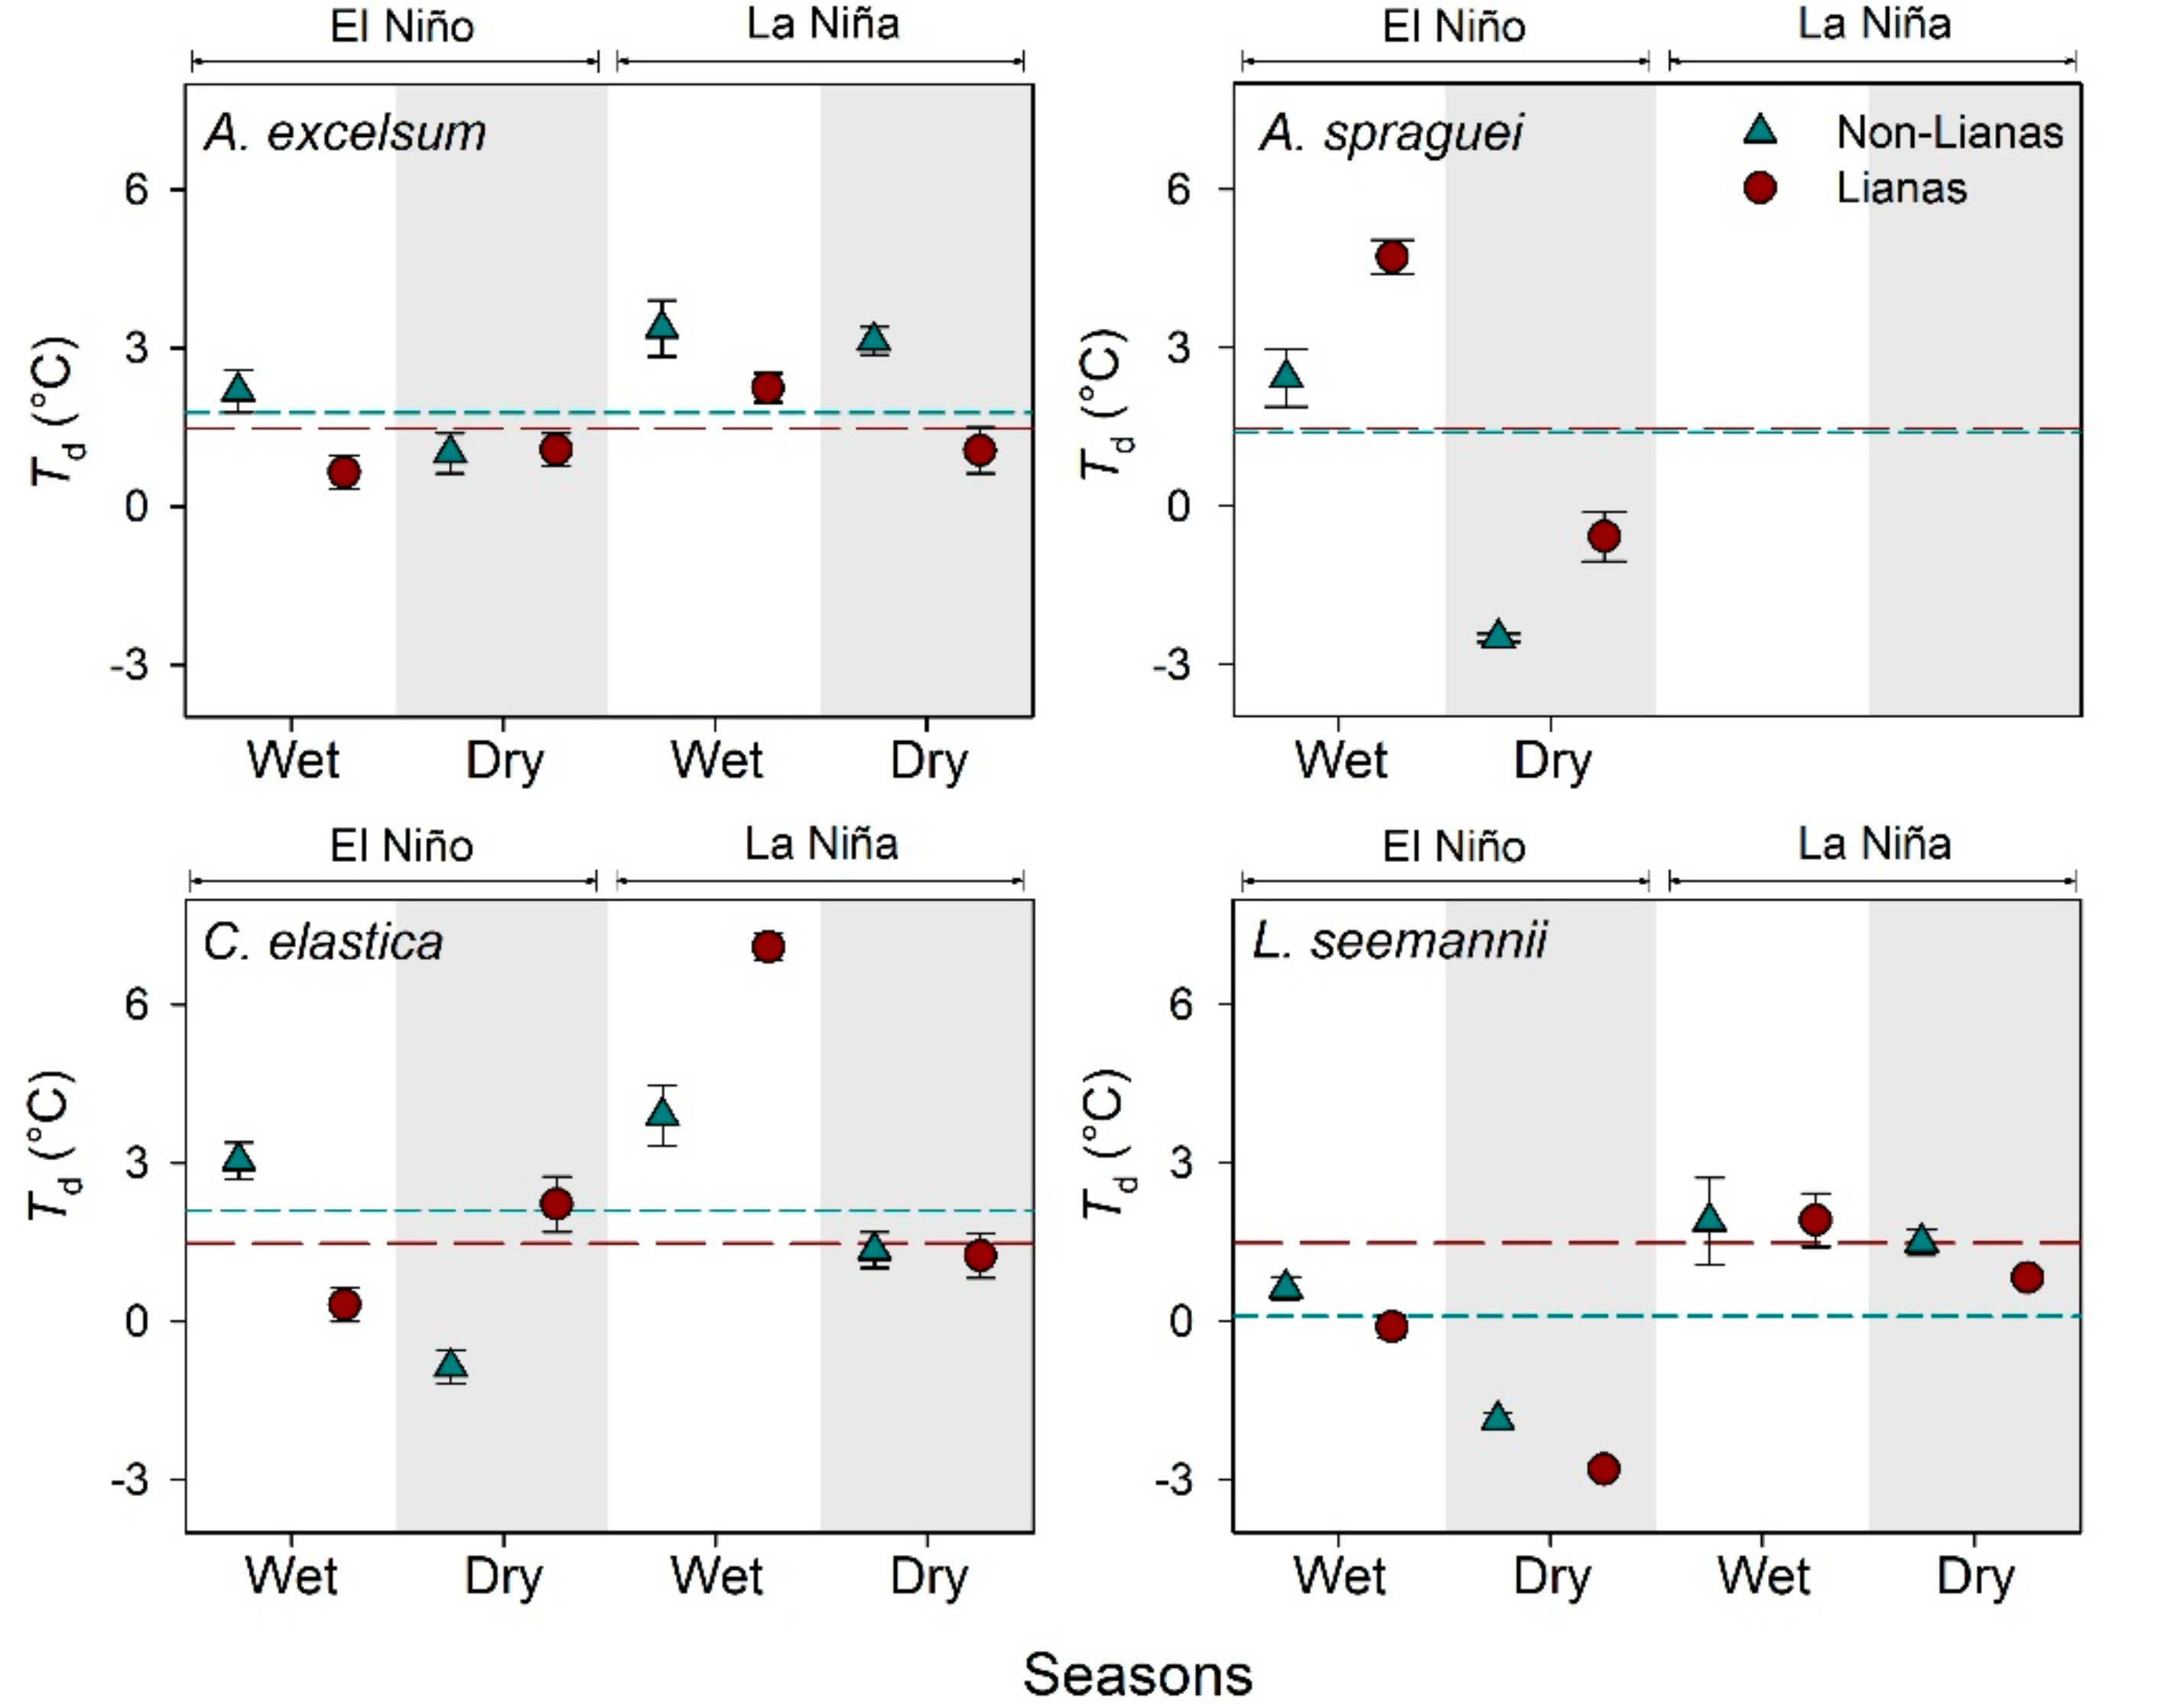
3.1. Leaf Temperature of Trees with and without Lianas

The intra-specific comparison of Td in each of our four tree species between leaves of trees with and without lianas suggests that the presence of lianas does not affect the Td of host trees across seasons or ENSO years during our measurement times (Table 1). In general, tree species with and without lianas showed values of Td in the range of −4.11 °C and 9.91 °C, with mean values close to 1.48 ± 0.09 °C (Figure 1). Regardless of the tree species, season, or ENSO year, trees without lianas showed values of Td of 1.39 °C on average (±0.14), while trees with lianas showed values of Td of 1.57 °C (±0.13). As such, trees with lianas were 12.94% hotter than trees without lianas based on the average value, but this difference was not significant. At the species level, the lowest values of Td (−2.81 ± 0.10 °C) were observed for L. seemannii trees with lianas measured in the dry season of an El Niño year, while trees of C. elastica with lianas showed the highest values of Td (7.10 ± 0.26 °C) in the wet season of the La Niña year. Across seasons and ENSO years, A. excelsum trees without lianas tended to have slightly higher values of Td than trees of the same species with lianas. Conversely, during an El Niño year, trees without lianas of A. spraguei had marginally lower values of Td than trees with lianas; however, both trends are not significant. Trees of L. seemannii and A. excelsum with and without lianas showed the most contrasting—albeit non-significant—trends between years, with leaves during the El Niño year showing lower values of Td than during the La Niña year.

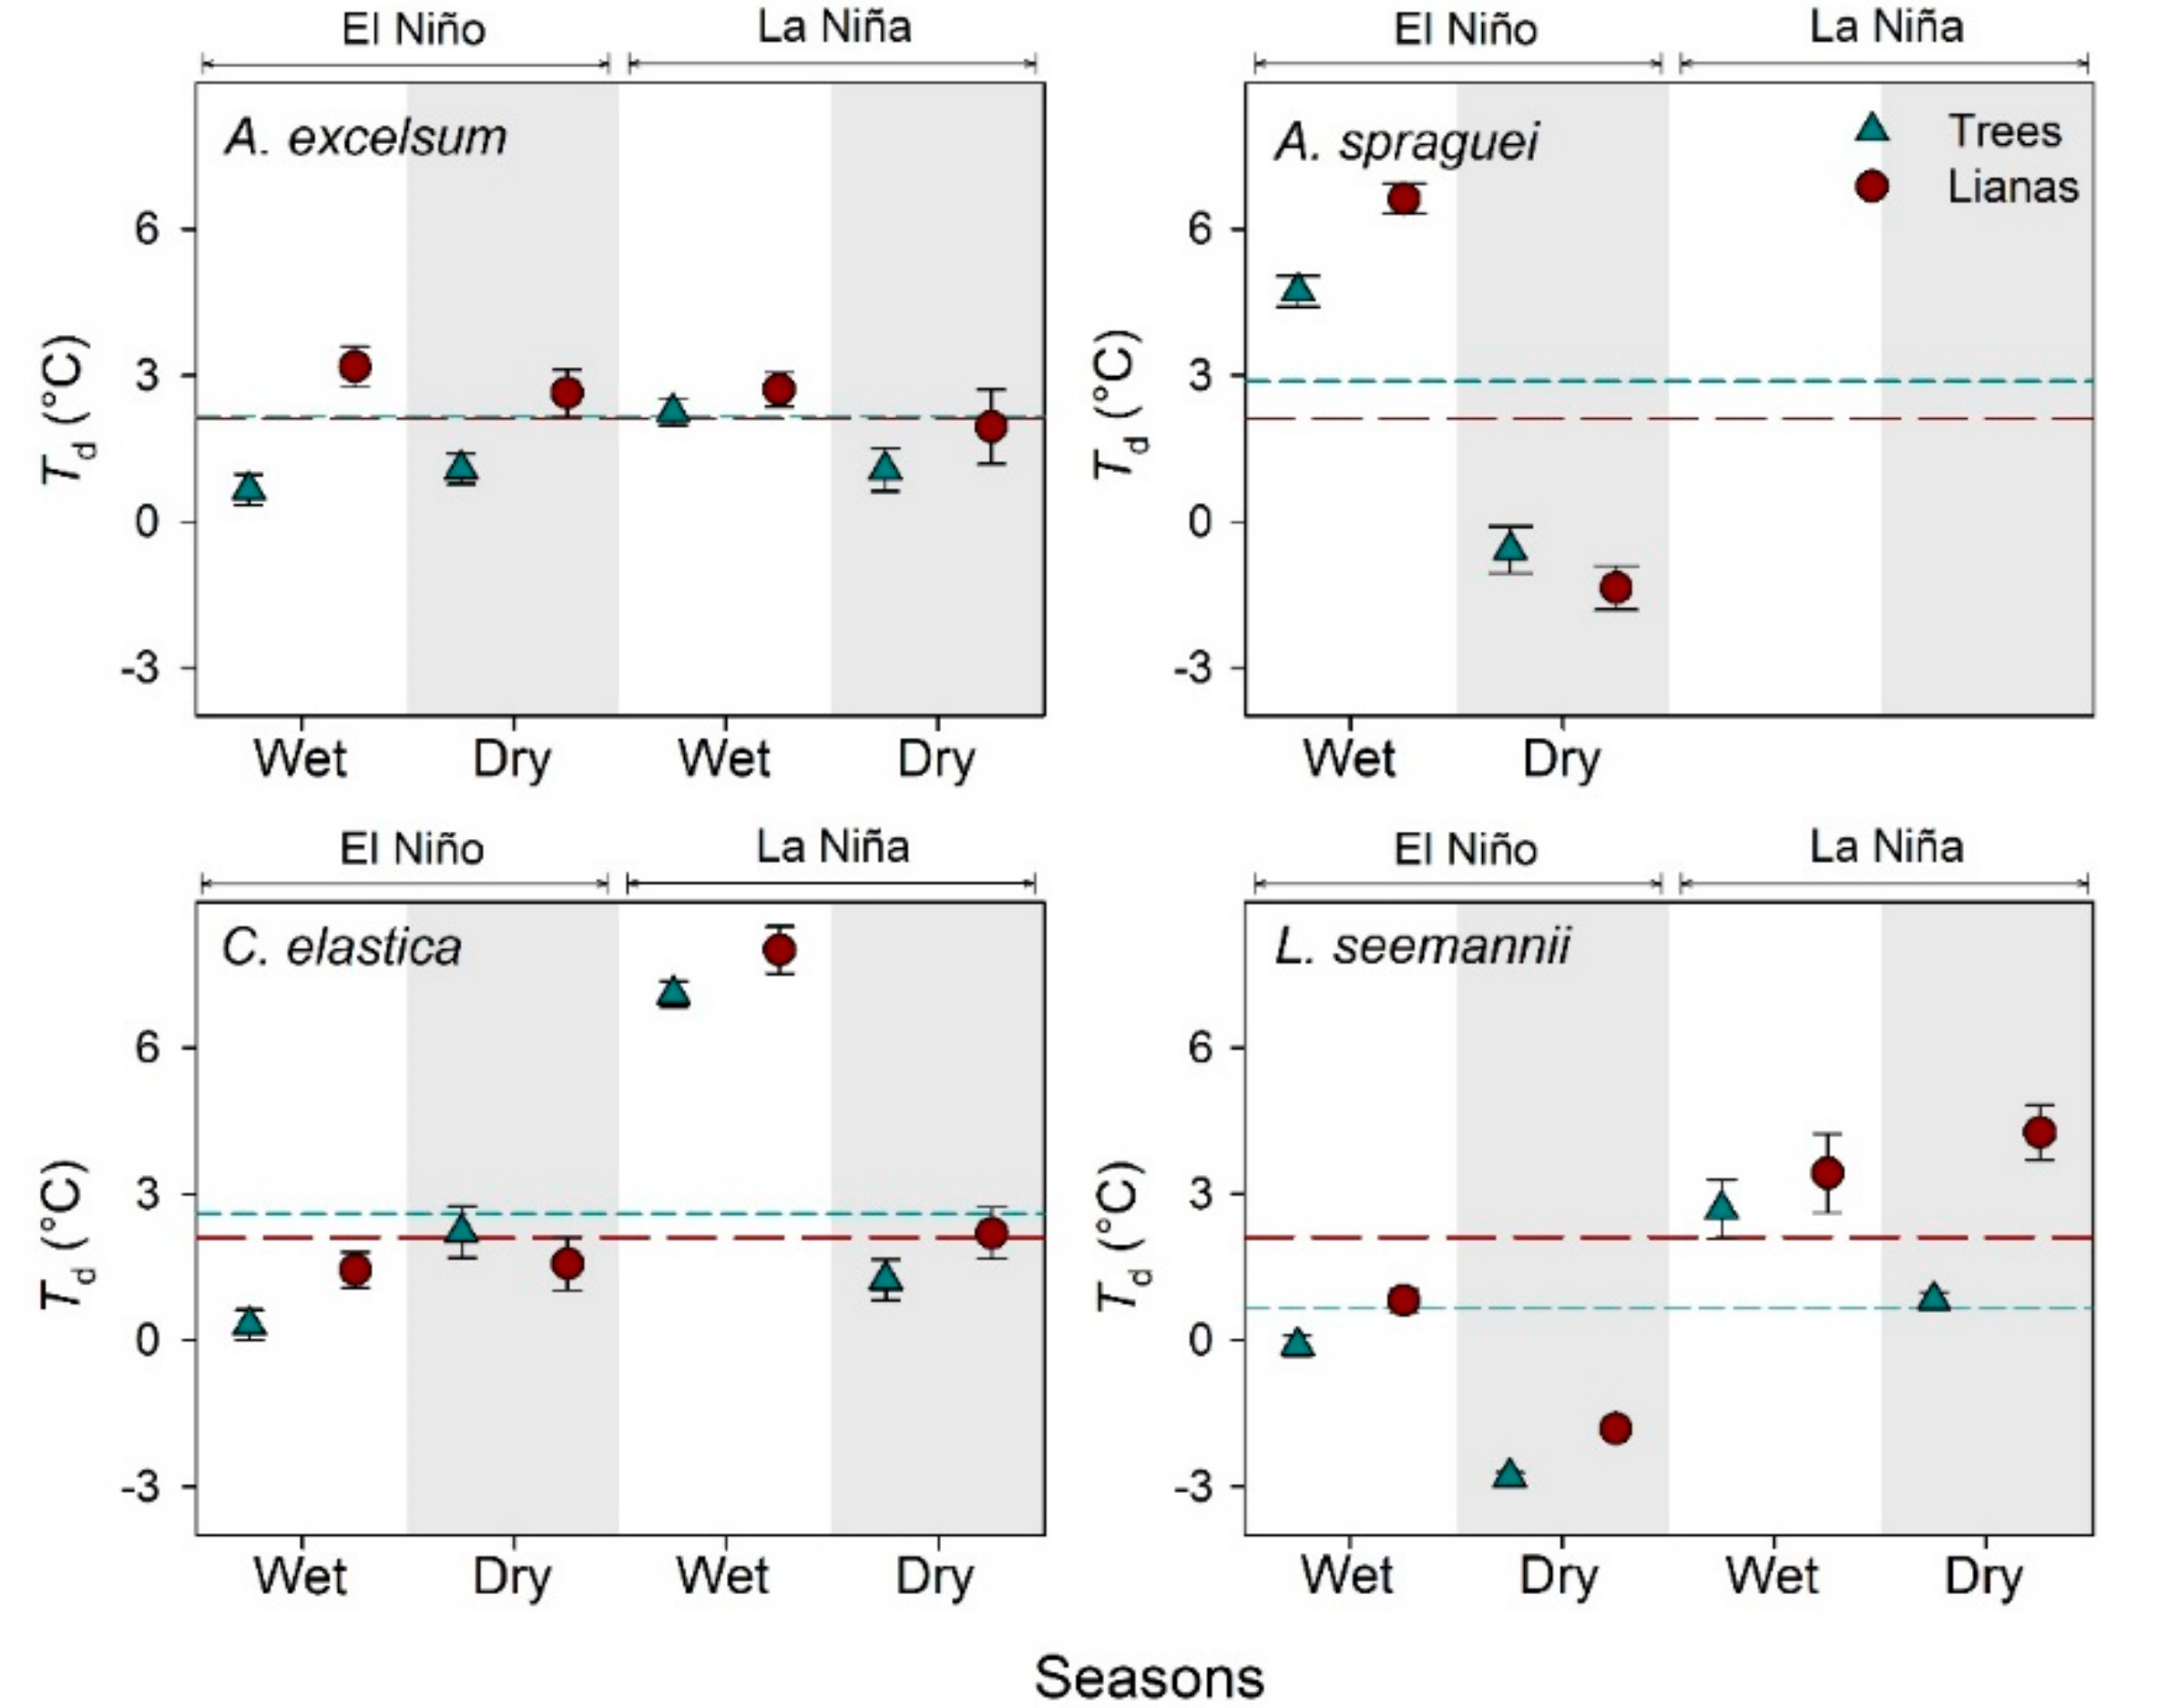
3.2. Leaf Temperature of Lianas and Their Host Trees

The inter-specific comparisons of Td suggest that liana leaves present higher values of Td than leaves of their host trees (Table 2, Figure 2). In general, liana leaves showed Td values in a range of −4.11 °C and 15.45 °C, with mean values close to 2.69 ± 0.17 °C; these values are 93.52% higher than those reported above for leaves of trees without lianas on mean values. This expression of the Td between life forms is significantly affected by the season, where lianas tend to have higher values of Td in the wet season in comparison with the dry season. The difference associated with each host tree suggests that for L. seemannii, leaves of lianas and their host have a significant interaction with ENSO, where leaves of both life forms during La Niña showed higher and contrasting values of Td with respect to an El Niño year. The effect of season, ENSO, and leaf type (tree or liana) was also observed in the host tree of C. elastica (Table 2).

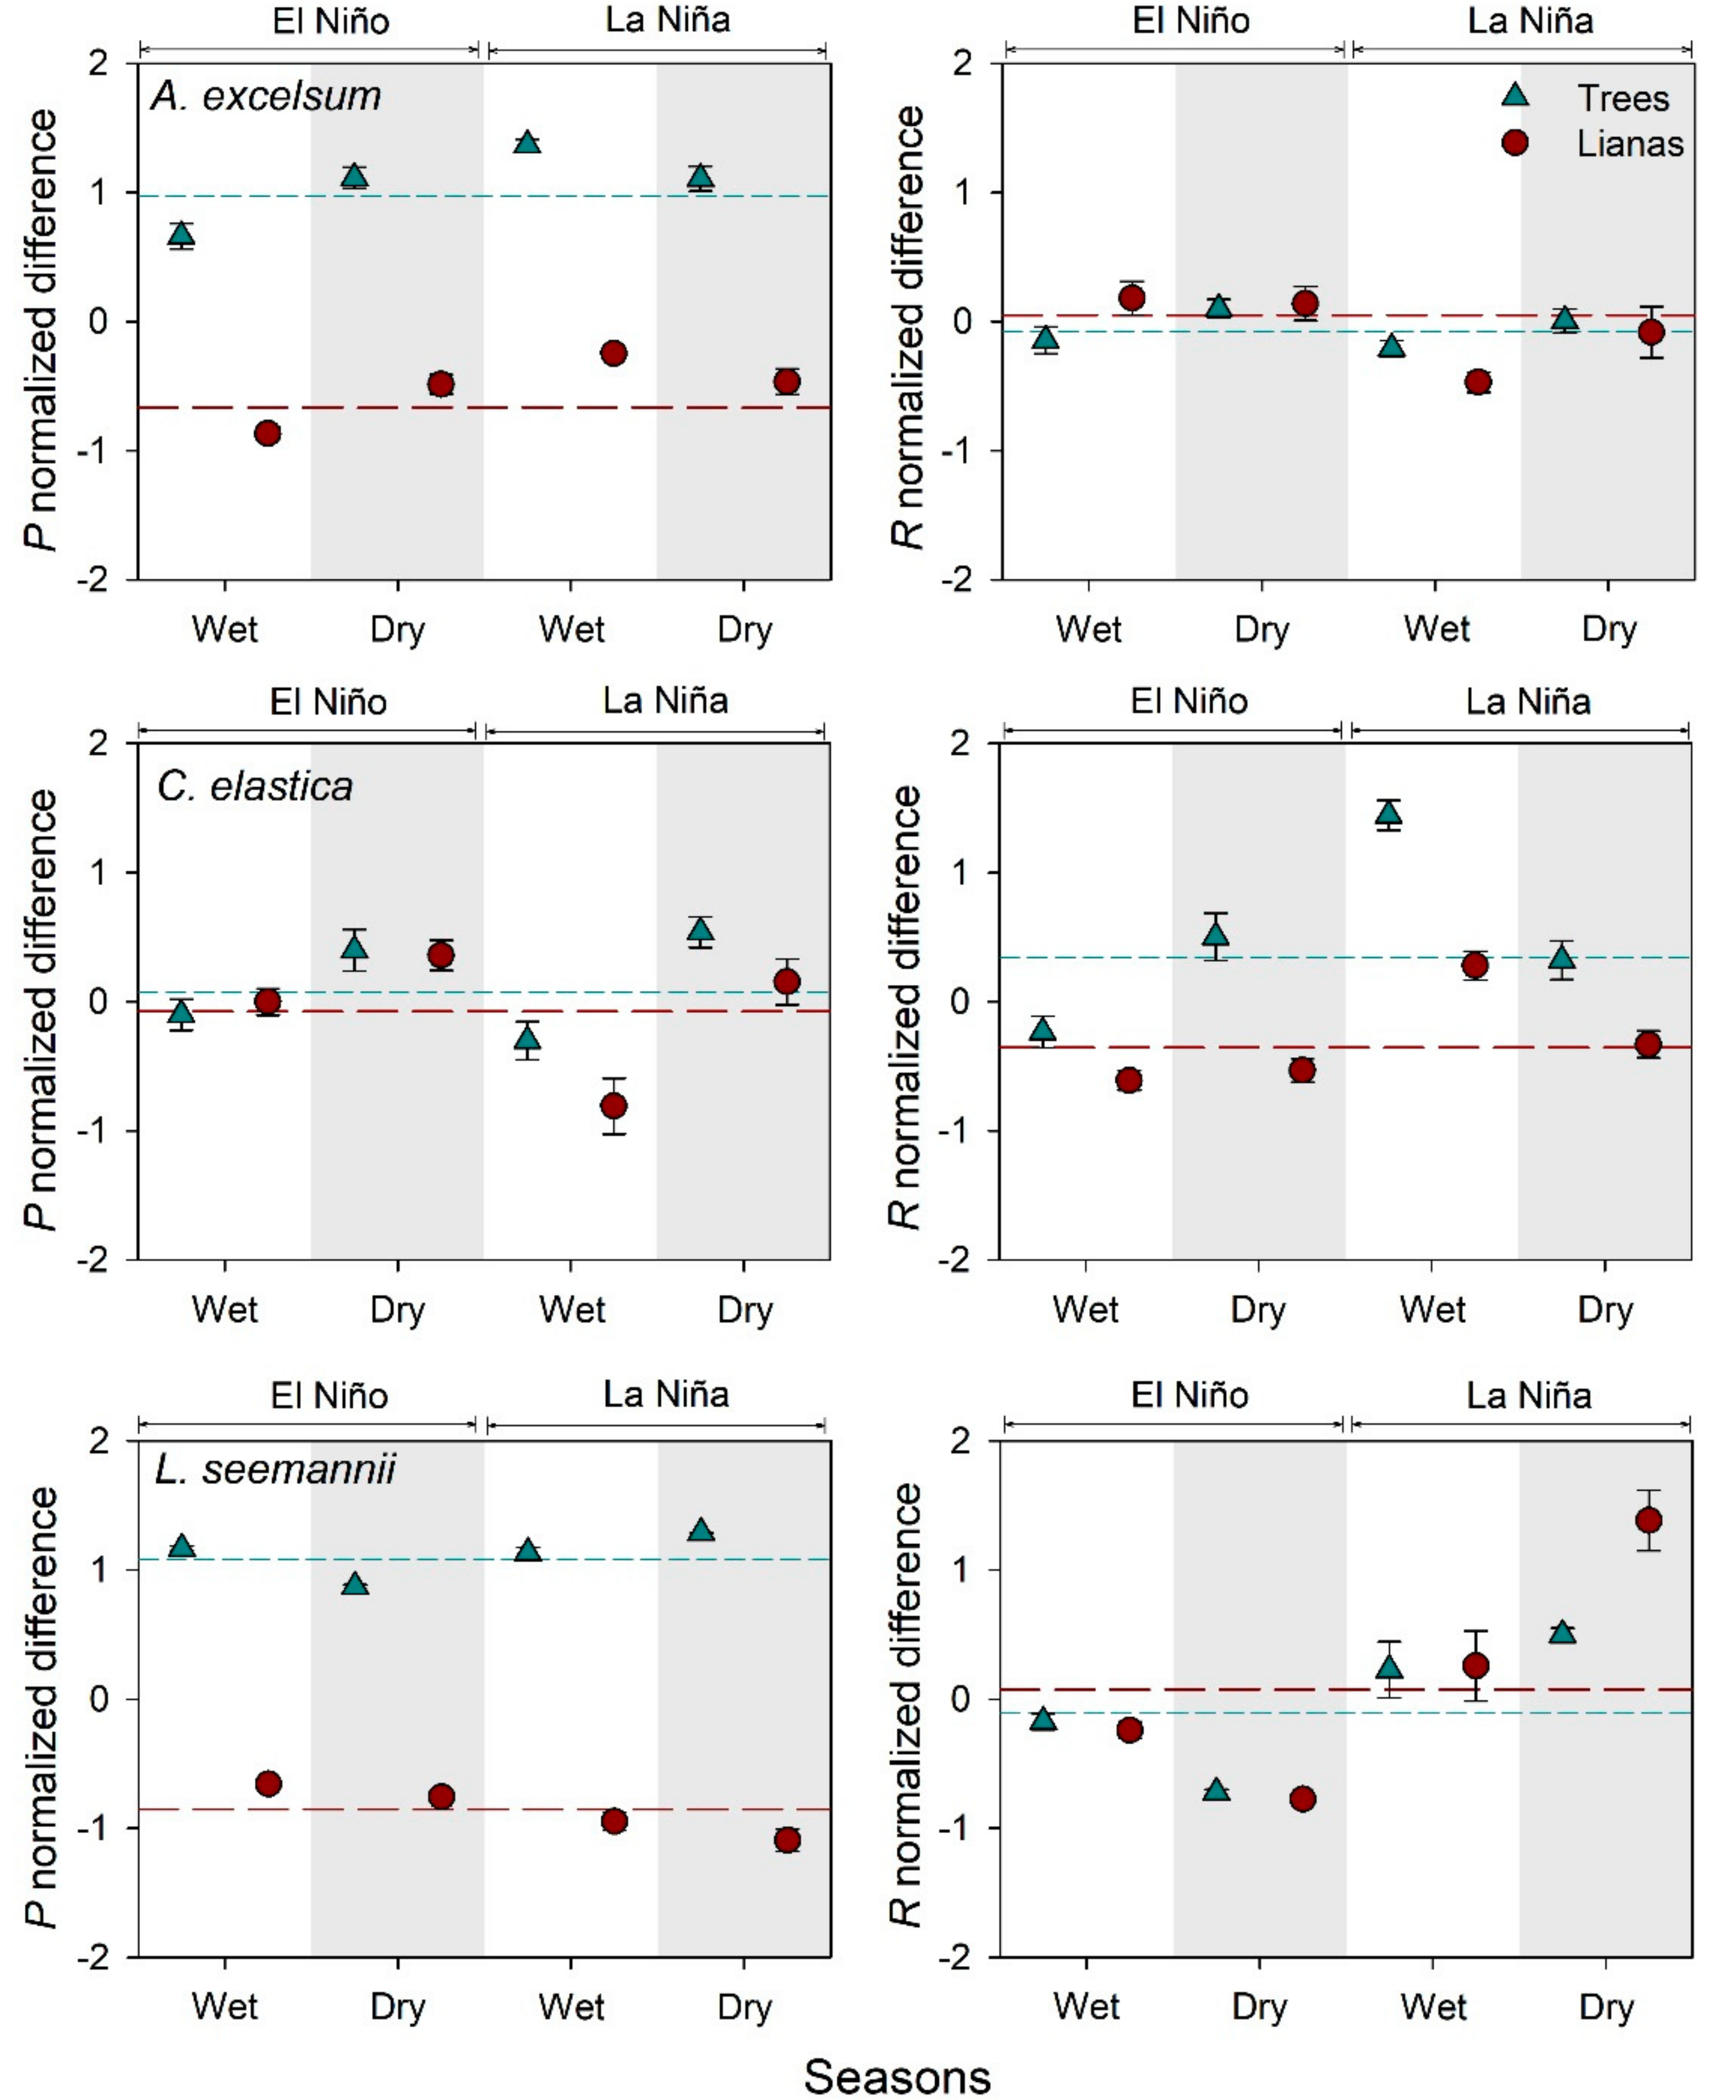
3.3. Comparisons of Photosynthesis and Leaf Respiration between Life Forms

From the predictions of P and R using our estimations of Tleaf, we computed the normalized difference for each host tree in order to conduct a temporal comparison based on life forms, seasons, and ENSO years. Our results suggest that the differences in the expression of Tleaf in combination with the physiological performance of these life forms can produce different estimations of P and R between life forms in all host species, which can be affected (in some cases) by seasons and the ENSO (Table 3, Figure 3). These differences are more pronounced for P than R, for which leaves of lianas exhibit lower rates per unit leaf area than leaves of trees.

4. Discussion

4.1. Leaf Temperature of Trees with and without Lianas

We hypothesized that differences in Td between trees with and without lianas due to the lianas presence could diminish the availability of water—and therefore the heat dissipation by transpiration—of leaves of host trees for water competition. However, we found that the presence of lianas on trees does not seem to affect the temperature of tree leaves. This unexpected observation could either be due to: (i) the lack of direct competition for water that may not reduce the surrounding water availability for trees [38], or (ii) the possible compensation of more assignation of water to fully exposed leaves than leaves covered by lianas for transpiration cooling. It is important to note here that this result is based on four tree species which may not cover the whole spectrum of the liana-trees relationship. For example, Visser et al. [39] suggest that liana infestation can have negative effects on tree population growth rates; however, this effect is more harmful to fast-growing species than slow-growing species. Therefore, we cannot exclude the possibility that lianas could have an effect on leaf temperature on trees of other life history groups, or even other sites. Likewise, it is important to note that in our study, we use the presence and absence of lianas on trees; that is why we consider that the density and extent of lianas on tree crowns may influence that host tree performance and should be examined in the future. On the other hand, the lack of a seasonal or ENSO effect on Td could be related to the fact that trees from old secondary forests such as PNM tend to present similar sap flow during droughts and wet periods, as a result of favorable soil features and roots access to deeper soil water reservoirs [30]. These conditions may contribute to maintaining similar values of Td by transpirational cooling regardless of the season or ENSO year.

4.2. Leaf Temperature of Trees and Lianas

We hypothesized that leaves of lianas might have lower temperatures in comparison with their host tree due to their greater competitive advance on the acquisition, regulation, and efficient use of water as compared with trees. By contrast, our results suggest that liana leaves have considerably higher values of Td than tree leaves. This result reinforces previous observations conducted on few leaves of three species of trees and two species of lianas using thermocouples [40]. Although the aim of this study was not to determinate which biotic drivers can lead to differences in Td between life forms, it is clear that several factors can influence Tleaf, such as leaf size [41], leaf inclination [42], anatomical traits [43], or the presence of photo-protection pigments. Although we do not have direct measurements of leaf inclination associated with our Td estimations, perhaps the leaf angle distribution of liana leaves on the canopy facing the sun more directly may contribute to the highest Td. As Rey-Sánchez et al. [44] pointed out, leaves that are facing the sun more directly have been shown to have higher solar irradiation that strongly affects the Tleaf. On the other hand, the higher values of Td of lianas could be related to the stomatal control. A recent study conducted in a botanical garden in China suggests that lianas tend to have earlier stomatal closure in comparison to trees to reduce the water transpiration close to noon [45]. If this pattern occurs at the forest canopy of the PNM, it is expected that lianas would present higher values of temperature associated with the physiological regulation, which could be detected using thermography [46]. Moreover, the different Td between life forms could be associated with the highest concentration of photo-protection pigments in trees in comparison with lianas [47]. Currently, there is strong evidence that the presence of pho-protection pigments is associated with the efficiency of thermal dissipation of the excess of energy from light stress environments such as the canopies [48,49]. Therefore, it could be expected that such differences in photo-protection pigments between life forms influence the efficiency of thermal dissipation and the Td.

4.3. Effect of the Temperature on Photosynthesis and Respiration of Lianas And Trees

Although lianas have a similar physiological–temperature response compared to trees [7,9,22], higher displayed temperatures of lianas would have significant implications for future TBMs. Specifically, in a future scenario of modeling in which there is a lack of seasonal variation in the physiological behavior of leaves and the differences in leaf temperature between these life forms are not taken into consideration, predictions of productivity of lianas could be underestimated in comparison to trees, mainly regarding photosynthesis. Although our calculations of gas exchange are based on Tleaf at noon, differences in Tleaf through the day could have a major role in diurnal courses of productivity between life forms. A daily course of Tleaf of leaves of lianas and trees has been reported by Sánchez-Azofeifa et al. [40], suggesting that liana leaves had higher overall temperatures than tree leaves. The Sánchez-Azofeifa et al. [40] and our trends of Tleaf between life forms, together with their physiological sensitivity to the temperature, may lead to different expectations of productivity of lianas and trees. Therefore, future models should thus consider differences in leaf thermo-regulation between these life forms in order to achieve robust predictions of productivity.

5. Conclusions

Currently, there is a strong need to understand the variations of abiotic factors that can affect the forest productivity [1]. Like Slot & Winter [7] pointed out, in the absence of a solid understanding of the abiotic controls such as temperature over physiological processes, future predictions of productivity will remain speculative. We have shown that the presence of lianas may not affect the leaf temperature of their host trees; however, lianas leaves tend to have higher values of temperature than their host trees. Our results highlight this difference in the expression of the temperature of lianas as an important biotic factor at the canopy level that can influence the forest temperature; therefore, their differential expression may have a significant weight in future predictions of forest productivity. We consider that future studies should explore the spatial variability of liana leaf temperature between forest strata such as in trees [44], and determine which drivers contribute to the differences in Td. Likewise, the differential expression of leaf temperature between life forms should be considered for future studies in order to predict the productivity of ecosystems. In addition, studies should explore this differential expression of leaf temperature in other regions such as wet forest, where species present lower thermal optima of photosynthesis [7], in order to know if the magnitude and direction of our findings vary among environments.

Supplementary Materials

The following are available online at https://www.mdpi.com/1999-4907/9/6/307/s1, Figure S1. Monthly total precipitation and average monthly temperature during wet and dry seasons in contrasting ENSO years at Parque Natural Metropolitano, Panama; Figure S2. Mean values of temperature (red lines) and relative humidity (blue lines) during the days of data collection according to the meteorological station on the crane at Parque Natural Metropolitano, Panama; Table S1. Number of trees (NT), thermal infrared images collected (TIR), and leaves selected (LS) to address the first hypothesis during the wet and dry season in contrasting ENSO years at the canopy of Parque Natural Metropolitano, Panama; Table S2. Number of host trees (HT), thermal infrared images collected (TIR), and leaves selected (LS) to address the second hypothesis during the wet and dry season in contrasting ENSO years at the canopy of Parque Natural Metropolitano, Panama.

Author Contributions

G.A.S.-A. conceived and designed the field data collection at the crane. J.A.G.Q. processed and analyzed the data and drafted the manuscript. G.A.S.-A. and B.R. helped with the interpretation and revision of the manuscript. All authors read and approved the manuscript.

Funding

This work was carried out with the aid of a grant from the Inter-American Institute for Global Change Research (IAI) Collaborative Research Network (CRN3-025), the support from the National Science and Engineering Research Council of Canada (NSERC) Discovery Grant program, and the Smithsonian Tropical Research Institute Support to Associate Researchers. JAG is a Vanier Scholar supported by the NSERC.

Acknowledgments

We thank S. Joseph Wright for previous discussions of the experimental design. Likewise, we are grateful to Edwin Andrades for operating the canopy crane. We thank Martijn Slot, who provided valuable comments and recommendations on early versions of this manuscript. We also want to thank to the reviewers for their comments on the paper, as these comments led us to improve our manuscript. We acknowledge the support of STRI from the Physical Monitoring Program for the data sets provided.

Conflicts of Interest

The authors declare no conflict of interest. The founding sponsors had no role in the design of the study; in the collection, analyses, or interpretation of data; in the writing of the manuscript, and in the decision to publish the results.

References

  1. Rogers, A.; Medlyn, B.E.; Dukes, J.S.; Bonan, G.; von Caemmerer, S.; Dietze, M.C.; Kattge, J.; Leakey, A.D.B.; Mercado, L.M.; Niinemets, Ü.; et al. A roadmap for improving the representation of photosynthesis in Earth system models. New Phytol. 2017, 213, 22–42. [Google Scholar] [CrossRef] [PubMed]
  2. Leuzinger, S.; Körner, C. Tree species diversity affects canopy leaf temperatures in a mature temperate forest. Agric. For. Meteorol. 2007, 146, 29–37. [Google Scholar] [CrossRef]
  3. Jones, H.G. Use of thermography for quantitative studies of spatial and temporal variation of stomatal conductance over leaf surfaces. Plant Cell Environ. 1999, 22, 1043–1055. [Google Scholar] [CrossRef] [Green Version]
  4. Dai, Y.; Dickinson, R.E.; Wang, Y.-P. A two-big-leaf model for canopy temperature, photosynthesis, and stomatal conductance. J. Clim. 2004, 17, 2281–2299. [Google Scholar] [CrossRef]
  5. Meinzer, F.C.; Andrade, J.L.; Goldstein, G.; Holbrook, N.M.; Cavelier, J.; Jackson, P. Control of transpiration from the upper canopy of a tropical forest: The role of stomatal, boundary layer and hydraulic architecture components. Plant Cell Environ. 1997, 20, 1242–1252. [Google Scholar] [CrossRef]
  6. Vargas, G.; Cordero, R.A. Photosynthetic responses to temperature of two tropical rainforest tree species from Costa Rica. Trees 2013, 27, 1261–1270. [Google Scholar] [CrossRef]
  7. Slot, M.; Winter, K. In situ temperature response of photosynthesis of 42 tree and liana species in the canopy of two Panamanian lowland tropical forests with contrasting rainfall regimes. New Phytol. 2017, 214, 1103–1117. [Google Scholar] [CrossRef] [PubMed]
  8. Slot, M.; Garcia, M.N.; Winter, K. Temperature response of CO2 exchange in three tropical tree species. Funct. Plant Biol. 2016, 43, 468–478. [Google Scholar] [CrossRef]
  9. Slot, M.; Wright, S.J.; Kitajima, K. Foliar respiration and its temperature sensitivity in trees and lianas: In situ measurements in the upper canopy of a tropical forest. Tree Physiol. 2013, 33, 505–515. [Google Scholar] [CrossRef] [PubMed]
  10. Slot, M.; Rey-Sánchez, C.; Winter, K.; Kitajima, K. Trait-based scaling of temperature-dependent foliar respiration in a species-rich tropical forest canopy. Funct. Ecol. 2014, 28, 1074–1086. [Google Scholar] [CrossRef] [Green Version]
  11. Lin, D.; Xia, J.; Wan, S. Climate warming and biomass accumulation of terrestrial plants: A meta-analysis. New Phytol. 2010, 188, 187–198. [Google Scholar] [CrossRef] [PubMed]
  12. Durán, S.M.; Sánchez-Azofeifa, G.A.; Rios, R.S.; Gianoli, E. The relative importance of climate, stand variables and liana abundance for carbon storage in tropical forests. Glob. Ecol. Biogeogr. 2015, 24, 939–949. [Google Scholar] [CrossRef]
  13. DeWalt, S.J.; Chave, J. Structure and biomass of four lowland Neotropical forests. Biotropica 2004, 36, 7–19. [Google Scholar] [CrossRef]
  14. Londré, R.; Schnitzer, S. The distribution of lianas and their change in abundance in temperate forests over the past 45 years. Ecology 2006, 87, 2973–2978. [Google Scholar] [CrossRef]
  15. Phillips, O.L.; Vasquez Martinez, R.; Arroyo, L.; Baker, T.R.; Killeen, T.; Lewis, S.L.; Malhi, Y.; Monteagudo Mendoza, A.; Neill, D.; Nunez Vargas, P.; et al. Increasing dominance of large lianas in Amazonian forests. Nature 2002, 418, 770–774. [Google Scholar] [CrossRef] [PubMed] [Green Version]
  16. Schnitzer, S. A mechanistic explanation for global patterns of liana abundance and distribution. Am. Nat. 2005, 166, 262–276. [Google Scholar] [CrossRef] [PubMed]
  17. Schnitzer, S. Increasing liana abundance in neotropical forests: Causes and consequences. In Ecology of Lianas; John Wiley & Sons, Ltd.: New York, NY, USA, 2015; pp. 451–464. ISBN 978-1-11-839240-9. [Google Scholar]
  18. Martínez-Izquierdo, L.; García, M.M.; Powers, J.S.; Schnitzer, S.A. Lianas suppress seedling growth and survival of 14 tree species in a Panamanian tropical forest. Ecology 2016, 97, 215–224. [Google Scholar] [CrossRef] [PubMed] [Green Version]
  19. Schnitzer, S.A.; Carson, W.P. Lianas suppress tree regeneration and diversity in treefall gaps. Ecol. Lett. 2010, 13, 849–857. [Google Scholar] [CrossRef] [PubMed] [Green Version]
  20. Durán, S.M.; Gianoli, E. Carbon stocks in tropical forests decrease with liana density. Biol. Lett. 2013, 9, 20130301. [Google Scholar] [CrossRef] [PubMed]
  21. Verbeeck, H.; Kearsley, E. The importance of including lianas in global vegetation models. Proc. Natl. Acad. Sci. USA 2016, 113, E4. [Google Scholar] [CrossRef] [PubMed]
  22. Slot, M.; Rey-Sánchez, C.; Gerber, S.; Lichstein, J.W.; Winter, K.; Kitajima, K. Thermal acclimation of leaf respiration of tropical trees and lianas: Response to experimental canopy warming, and consequences for tropical forest carbon balance. Glob. Chang. Biol. 2014, 20, 2915–2926. [Google Scholar] [CrossRef] [PubMed]
  23. Rodríguez-Ronderos, M.E.; Bohrer, G.; Sanchez-Azofeifa, A.; Powers, J.S.; Schnitzer, S.A. Contribution of lianas to plant area index and canopy structure in a Panamanian forest. Ecology 2016, 97, 3271–3277. [Google Scholar] [CrossRef] [PubMed] [Green Version]
  24. Chen, Y.-J.; Cao, K.-F.; Schnitzer, S.A.; Fan, Z.-X.; Zhang, J.-L.; Bongers, F. Water-use advantage for lianas over trees in tropical seasonal forests. New Phytol. 2015, 205, 128–136. [Google Scholar] [CrossRef] [PubMed]
  25. Ichihashi, R.; Chiu, C.-W.; Komatsu, H.; Kume, T.; Shinohara, Y.; Tateishi, M.; Tsuruta, K.; Otsuki, K. Contribution of lianas to community-level canopy transpiration in a warm-temperate forest. Funct. Ecol. 2017, 31, 1690–1699. [Google Scholar] [CrossRef]
  26. Lin, H.; Chen, Y.; Zhang, H.; Fu, P.; Fan, Z. Stronger cooling effects of transpiration and leaf physical traits of plants from a hot dry habitat than from a hot wet habitat. Funct. Ecol. 2017. [Google Scholar] [CrossRef]
  27. De Guzman, M.E.; Santiago, L.S.; Schnitzer, S.A.; Álvarez-Cansino, L. Trade-offs between water transport capacity and drought resistance in neotropical canopy liana and tree species. Tree Physiol. 2016, 1–11. [Google Scholar] [CrossRef] [PubMed]
  28. Cai, Z.-Q.; Schnitzer, S.A.; Bongers, F. Seasonal differences in leaf-level physiology give lianas a competitive advantage over trees in a tropical seasonal forest. Oecologia 2009, 161, 25–33. [Google Scholar] [CrossRef] [PubMed] [Green Version]
  29. Zhu, S.-D.; Cao, K.-F. Hydraulic properties and photosynthetic rates in co-occurring lianas and trees in a seasonal tropical rainforest in southwestern China. Plant Ecol. 2009, 204, 295–304. [Google Scholar] [CrossRef]
  30. Bretfeld, M.; Ewers, B.E.; Hall, J.S. Plant water use responses along secondary forest succession during the 2015–2016 El Niño drought in Panama. New Phytol. 2018. [Google Scholar] [CrossRef] [PubMed]
  31. Schnitzer, S.A.; van der Heijden, G.M.F.; Powers, J.S. Reply to Verbeeck and Kearsley: Addressing the challenges of including lianas in global vegetation models. Proc. Natl. Acad. Sci. USA 2016, 113, E5–E6. [Google Scholar] [CrossRef] [PubMed]
  32. Avalos, G.; Mulkey, S.S. Seasonal changes in liana cover in the upper canopy of a neotropical dry forest. Biotropica 1999, 31, 186–192. [Google Scholar] [CrossRef]
  33. Usamentiaga, R.; Venegas, P.; Guerediaga, J.; Vega, L.; Molleda, J.; Bulnes, F.G. Infrared thermography for temperature measurement and non-destructive testing. Sensors 2014, 14, 12305–12348. [Google Scholar] [CrossRef] [PubMed]
  34. López, A.; Molina-Aiz, F.D.; Valera, D.L.; Peña, A. Determining the emissivity of the leaves of nine horticultural crops by means of infrared thermography. Sci. Hortic. (Amsterdam) 2012, 137, 49–58. [Google Scholar] [CrossRef]
  35. Zuur, A.F.; Ieno, E.N.; Walker, N.J.; Saveliev, A.A.; Smith, G.M. Mixed Effects Models and Extensions in Ecology with R; Springer Science and Business Media: New York, NY, USA, 2009. [Google Scholar]
  36. Pinheiro, J.; Bates, D.; DebRoy, S.; Sarkar, D. R Development Core Team nlme: Linear and Nonlinear Mixed Effects Models. Available online: http://cran.r-project.org/package=nlme (accessed on 30 May 2018).
  37. R Development Core Team. R: A language and environment for statistical computing. R Found. Stat. Comput. 2017, 1, 409. [Google Scholar]
  38. De Deurwaerder, H.; Hervé-Fernández, P.; Stahl, C.; Burban, B.; Petronelli, P.; Hoffman, B.; Bonal, D.; Boeckx, P.; Verbeeck, H. Liana and tree below-ground water competition—evidence for water resource partitioning during the dry season. Tree Physiol. 2018. [Google Scholar] [CrossRef] [PubMed]
  39. Visser, M.D.; Schnitzer, S.A.; Muller-Landau, H.C.; Jongejans, E.; de Kroon, H.; Comita, L.S.; Hubbell, S.P.; Wright, S.J. Tree species vary widely in their tolerance for liana infestation: A case study of differential host response to generalist parasites. J. Ecol. 2018, 106, 781–794. [Google Scholar] [CrossRef]
  40. Sánchez-Azofeifa, G.A.; Rankine, C.; do Espirito Santo, M.M.; Fatland, R.; Garcia, M. Wireless sensing networks for environmental monitoring: Two case studies from tropical forests. In Proceedings of the IEEE Seventh International Conference on e-Science, Stockholm, Sweden, 5–8 December 2011; pp. 70–76. [Google Scholar]
  41. Leigh, A.; Sevanto, S.; Close, J.D.; Nicotra, A.B. The influence of leaf size and shape on leaf thermal dynamics: Does theory hold up under natural conditions? Plant Cell Environ. 2017, 40, 237–248. [Google Scholar] [CrossRef] [PubMed]
  42. Medina, E.; Sobrado, M.; Herrera, R. Significance of leaf orientation for leaf temperature in an amazonian sclerophyll vegetation. Radiat. Environ. Biophys. 1978, 15, 131–140. [Google Scholar] [CrossRef] [PubMed]
  43. Pérez-Estrada, L.B.; Cano-Santana, Z.; Oyama, K. Variation in leaf trichomes of Wigandia urens: Environmental factors and physiological consequences. Tree Physiol. 2000, 20, 629–632. [Google Scholar] [CrossRef] [PubMed]
  44. Rey-Sánchez, A.C.; Slot, M.; Posada, J.M.; Kitajima, K. Spatial and seasonal variation in leaf temperature within the canopy of a tropical forest. Clim. Res. 2016, 71, 75–89. [Google Scholar] [CrossRef]
  45. Chen, Y.-J.; Schnitzer, S.A.; Zhang, Y.-J.; Fan, Z.-X.; Goldstein, G.; Tomlinson, K.W.; Lin, H.; Zhang, J.-L.; Cao, K.-F. Physiological regulation and efficient xylem water transport regulate diurnal water and carbon balances of tropical lianas. Funct. Ecol. 2017, 31, 306–317. [Google Scholar] [CrossRef]
  46. Prytz, G.; Futsaether, C.M.; Johnsson, A. Thermography studies of the spatial and temporal variability in stomatal conductance of Avena leaves during stable and oscillatory transpiration. New Phytol. 2003, 158, 249–258. [Google Scholar] [CrossRef] [Green Version]
  47. Sánchez-Azofeifa, G.A.; Castro, K.; Wright, S.J.; Gamon, J.; Kalacska, M.; Rivard, B.; Schnitzer, S.A.; Feng, J.L. Differences in leaf traits, leaf internal structure, and spectral reflectance between two communities of lianas and trees: Implications for remote sensing in tropical environments. Remote Sens. Environ. 2009, 113, 2076–2088. [Google Scholar] [CrossRef] [Green Version]
  48. Demmig-Adams, B.; Adams, W.W. Photoprotection and other responses of plants to high light stress. Annu. Rev. Plant Physiol. Plant Mol. Biol. 1992, 43, 599–626. [Google Scholar] [CrossRef]
  49. Demmig-Adams, B. Survey of thermal energy dissipation and pigment composition in sun and shade leaves. Plant Cell Physiol. 1998, 39, 474–482. [Google Scholar] [CrossRef]
Figure 1. Displayed leaf temperature (Td) of tropical tree leaves with and without lianas during the wet and dry season in contrasting ENSO years at the canopy of Parque Natural Metropolitano, Panama. Each point represents the mean (±SE). Short dashed lines represent the mean of displayed leaf temperature per tree, while long dashed lines represent the mean of all samples.
Forests 09 00307 g001
Figure 2. Displayed leaf temperature (Td) of lianas and their host tree in four tree species during the wet and dry season in contrasting ENSO years at the canopy of Parque Natural Metropolitano, Panama. Each point represents the mean (±SE). Short dashed lines represent the mean of displayed leaf temperature per host tree, while long dashed lines represent the mean of all samples.
Forests 09 00307 g002
Figure 3. Normalized differences of predictions of photosynthesis (P) and leaf dark respiration (R) of leaves of trees and lianas on four host species during the wet and dry season in contrasting ENSO years. Each point represents the mean (±SE). Short dashed lines represent the mean for trees, while long dashed lines represent the mean for lianas.
Forests 09 00307 g003
Table 1. Effect of the liana presence, season, ENSO year, and their interaction on the displayed leaf temperature of tropical trees. Values represent F-ratios and values in parentheses describe the degree of freedoms; no statistical significance was found.
FactorsSpecies
A. excelsumA. spragueiC. elasticaL. seemannii
Presence0.902.270.011.88
(1, 14)(1, 13)(1, 13)(1, 7)
Season0.019.072.112.13
(1, 14)(1, 13)(1, 13)(1, 7)
ENSO1.56-4.475.37
(1, 14)(1, 13)(1, 7)
Presence*Season0.010.020.600.01
(1, 14)(1, 13)(1, 13)(1, 7)
Presence*ENSO0.02-0.090.01
(1, 14)(1, 13)(1, 7)
Season*ENSO0.02-1.142.45
(1, 14)(1, 13)(1, 7)
Presence*Season*ENSO0.25-3.550.12
(1, 14)(1, 13)(1, 7)
Table 2. Effect of the leaf type (tree or liana leaf), season, ENSO, and their interaction on the displayed temperature of leaves of/on host tropical trees. Values represent F-ratios, values in parentheses describe the degree of freedoms, and the asterisks represent the significance: * p < 0.05; ** p < 0.01, *** p < 0.001.
FactorsSpecies
A. excelsumA. spragueiC. elasticaL. seemannii
Type22.22 ***12.96 ***10.04 **192.32 ***
(1, 7)(1, 2)(1, 6)(1, 4)
Season0.029.060.401.12
(1, 7)(1, 2)(1, 6)(1, 4)
ENSO0.15-2.461.87
(1, 7)(1, 6)(1, 4)
Type*Season13.60 ***32.49 ***5.92 *16.22 ***
(1, 7)(1, 2)(1, 6)(1, 4)
Type*ENSO0.69-2.407.32 **
(1, 7)(1, 6)(1, 4)
Season*ENSO0.01-2.462.40
(1, 7)(1, 6)(1, 4)
Type*Season*ENSO1.09-11.88 ***0.44
(1, 7)(1, 6)(1, 4)
Table 3. Effect of the leaf type (tree or liana leaf), season, ENSO, and their interaction on the normalized difference of photosynthesis and leaf respiration of the values predicted. Values represent F-ratios, values in parentheses describe the degree of freedoms, and the asterisks represent the significance: * p < 0.05; ** p < 0.01, *** p < 0.001.
FactorsSpecies or host tree
PhotosynthesisRespiration
A. excelsumC. elasticaL. seemanniiA. excelsumC. elasticaL. seemannii
Type1133.01 ***11.42 ***3432.71 ***18.45 ***420.99 ***4.56 *
(1, 7)(1, 6)(1, 4)(1, 7)(1, 6)(1, 4)
Season0.491.032.490.050.010.02
(1, 7)(1, 6)(1, 4)(1, 7)(1, 6)(1, 4)
ENSO0.970.373.390.091.510.19
(1, 7)(1, 6)(1, 4)(1, 7)(1, 6)(1, 4)
Type*Season12.33 ***0.190.0313.85 ***5.43 *0.15
(1, 7)(1, 6)(1, 4)(1, 7)(1, 6)(1, 4)
Type*ENSO5.86 *3.87 *86.23 ***0.570.9939.76 ***
(1, 7)(1, 6)(1, 4)(1, 7)(1, 6)(1, 4)
Season*ENSO1.690.410.340.171.292.71
(1, 7)(1, 6)(1, 4)(1, 7)(1, 6)(1, 4)
Type*Season*ENSO4.97 *0.0110.61 **0.8720.99 ***0.17
(1, 7)(1, 6)(1, 4)(1, 7)(1, 6)(1, 4)

