Article

Cumulative Drought Stress Leads to a Loss of Growth Resilience and Explains Higher Mortality in Planted than in Naturally Regenerated Pinus pinaster Stands

by
Rafael M. Navarro-Cerrillo
1,*,
Carlos Rodriguez-Vallejo
1,
Emidio Silveiro
1,
Antonio Hortal
1,
Guillermo Palacios-Rodríguez
1,
Joaquín Duque-Lazo
1 and
J. Julio Camarero
2
1
Depto. Ingeniería Forestal, Laboratorio de Selvicultura, Dendrocronología y Cambio Climático, DendrodatLab-ERSAF, Universidad de Córdoba, Campus de Rabanales, Crta. IV, km. 396, 14071 Córdoba, Spain
2
Instituto Pirenaico de Ecología (IPE-CSIC), Av. Nuestra Señora de la Victoria 16, 22700 Jaca, Spain
*
Author to whom correspondence should be addressed.
Forests 2018, 9(6), 358; https://doi.org/10.3390/f9060358
Submission received: 22 March 2018 / Revised: 3 May 2018 / Accepted: 10 May 2018 / Published: 15 June 2018
(This article belongs to the Special Issue Tree-Ring Records of Climatic Impacts on Forests)

Abstract

:
The assessment of the long-term impacts of drought on tree growth decline using tree-ring analyses may be used to test if plantations are more vulnerable to warming after successive droughts, leading to a “cumulative stress” effect. We selected 76 Pinus pinaster trees (declining and non-declining trees), and basal area increments over the last 20 years (BAI20) were calculated to build the chronologies for the stand types and vigor classes. Resistance, recovery and resilience indices were calculated. Pearson correlations, analyses and Partial Least-Squares regression were used to analyze the relationships among the response and environmental variables. We found a negative and significant relationship between mean temperature for May and June of the current year and growth in the naturally regenerated stands. This negative effect on growth under warm spring conditions was more noticeable in plantations than in naturally regenerated stands. A negative trend along time was found for the resilience index in planted stands. Evapotranspiration, maximum temperature and annual radiation showed significant and negative correlations with the growth of declining trees from planted stands, indicating they are susceptible to drought stress. Declining trees in planted stands showed a loss of growth resilience, specifically a negative trend after successive droughts.

1. Introduction

The future climate is expected to be characterized by increasing temperatures and a higher frequency of extreme climatic events (e.g., dry spells) which will alter the functions of forests [1]. For instance, aridification trends will negatively impact tree growth and increase mortality rates as evidenced in many die-off episodes [2]. These episodes have been characterized by abrupt growth decline and increased mortality rates particularly affecting pine plantations in drought-prone areas [3,4,5]. The assessment of the long-term impacts of drought on tree growth decline using tree-ring analyses has shown that plantations may be more vulnerable to warming-related drought stress than comparable naturally regenerated forests [6].
Tree plantations represent ca. 7% of the total forested area worldwide, and in the Mediterranean Basin they account for 10% of the total forest cover [7]. In this region, massive pine reforestations were carried out, mainly during the 20th century, to protect the soil against erosion, to restore watersheds and to increase forest productivity, thus producing very homogeneous stands of pioneer pine species which are susceptible to drought-induced die-off [4]. Pine plantations have been notably affected by drought causing canopy dieback, a decline in productivity and wood production and widespread mortality events [3,4,8,9,10]. The growth of Mediterranean pines is mainly constrained by water shortage during the growing season (spring) and in the previous winter [11,12,13,14,15]. Drought and heat stress have been associated with episodic canopy dieback or die-off in several pine species [16,17,18,19]. However, we lack a good understanding of the long-term interactions between stand structure, i.e., by comparing naturally regenerated vs. planted stands, and climate stress regarding pine growth. This retrospective analysis would allow characterization of how the stand structure modulates climate-growth relationships and affects mortality and drought-triggered die-off [20,21].
In naturally regenerated forests, trees grow more rapidly because of increased growing space compared to dense and more regularly structured plantations [6]. If plantations show a more pronounced vulnerability to drought stress, we would expect that they also have lower growth resilience after drought than naturally regenerated stands growing under similar climatic and edaphic conditions. Dendrochronology can be used to determine if die-off and mortality events affecting these plantations are a consequence of a loss in growth resilience after successive droughts leading to a “cumulative stress” effect [9]. Tree vulnerability may be exacerbated by such drought stress which may reduce growth resiliency via perturbations of tree hydraulic functioning [22] or by reducing carbon reserves below critical thresholds [23]. Also, post-drought recovery may be compromised by resource availability, which thus determines subsequent growth rates and leads to drought legacies [24].
Recent research has identified common climatic responses for maritime pine (Pinus pinaster Ait.) naturally regenerated populations in their southernmost European limit [25], but we lack information on post-drought resilience in naturally regenerated vs. planted stands of this widely planted species. In this context, a primary goal of this study was to develop tree-ring records of P. pinaster growth in planted and naturally regenerated stands to assess their vulnerability to drought stress. Specifically, this study addressed the following questions: (i) how sensitive is the radial-growth rate of naturally regenerated and planted P. pinaster stands to recurrent droughts in terms of resilience capacity? and (ii) what are the most relevant structural factors affecting the drought-related mortality risk? We hypothesize that plantations will show lower growth resilience than naturally regenerated stands. We also aim to provide new perspectives on the importance of growth resilience in terms of its influence on the management of Mediterranean pine populations facing climate change.

2. Materials and Methods

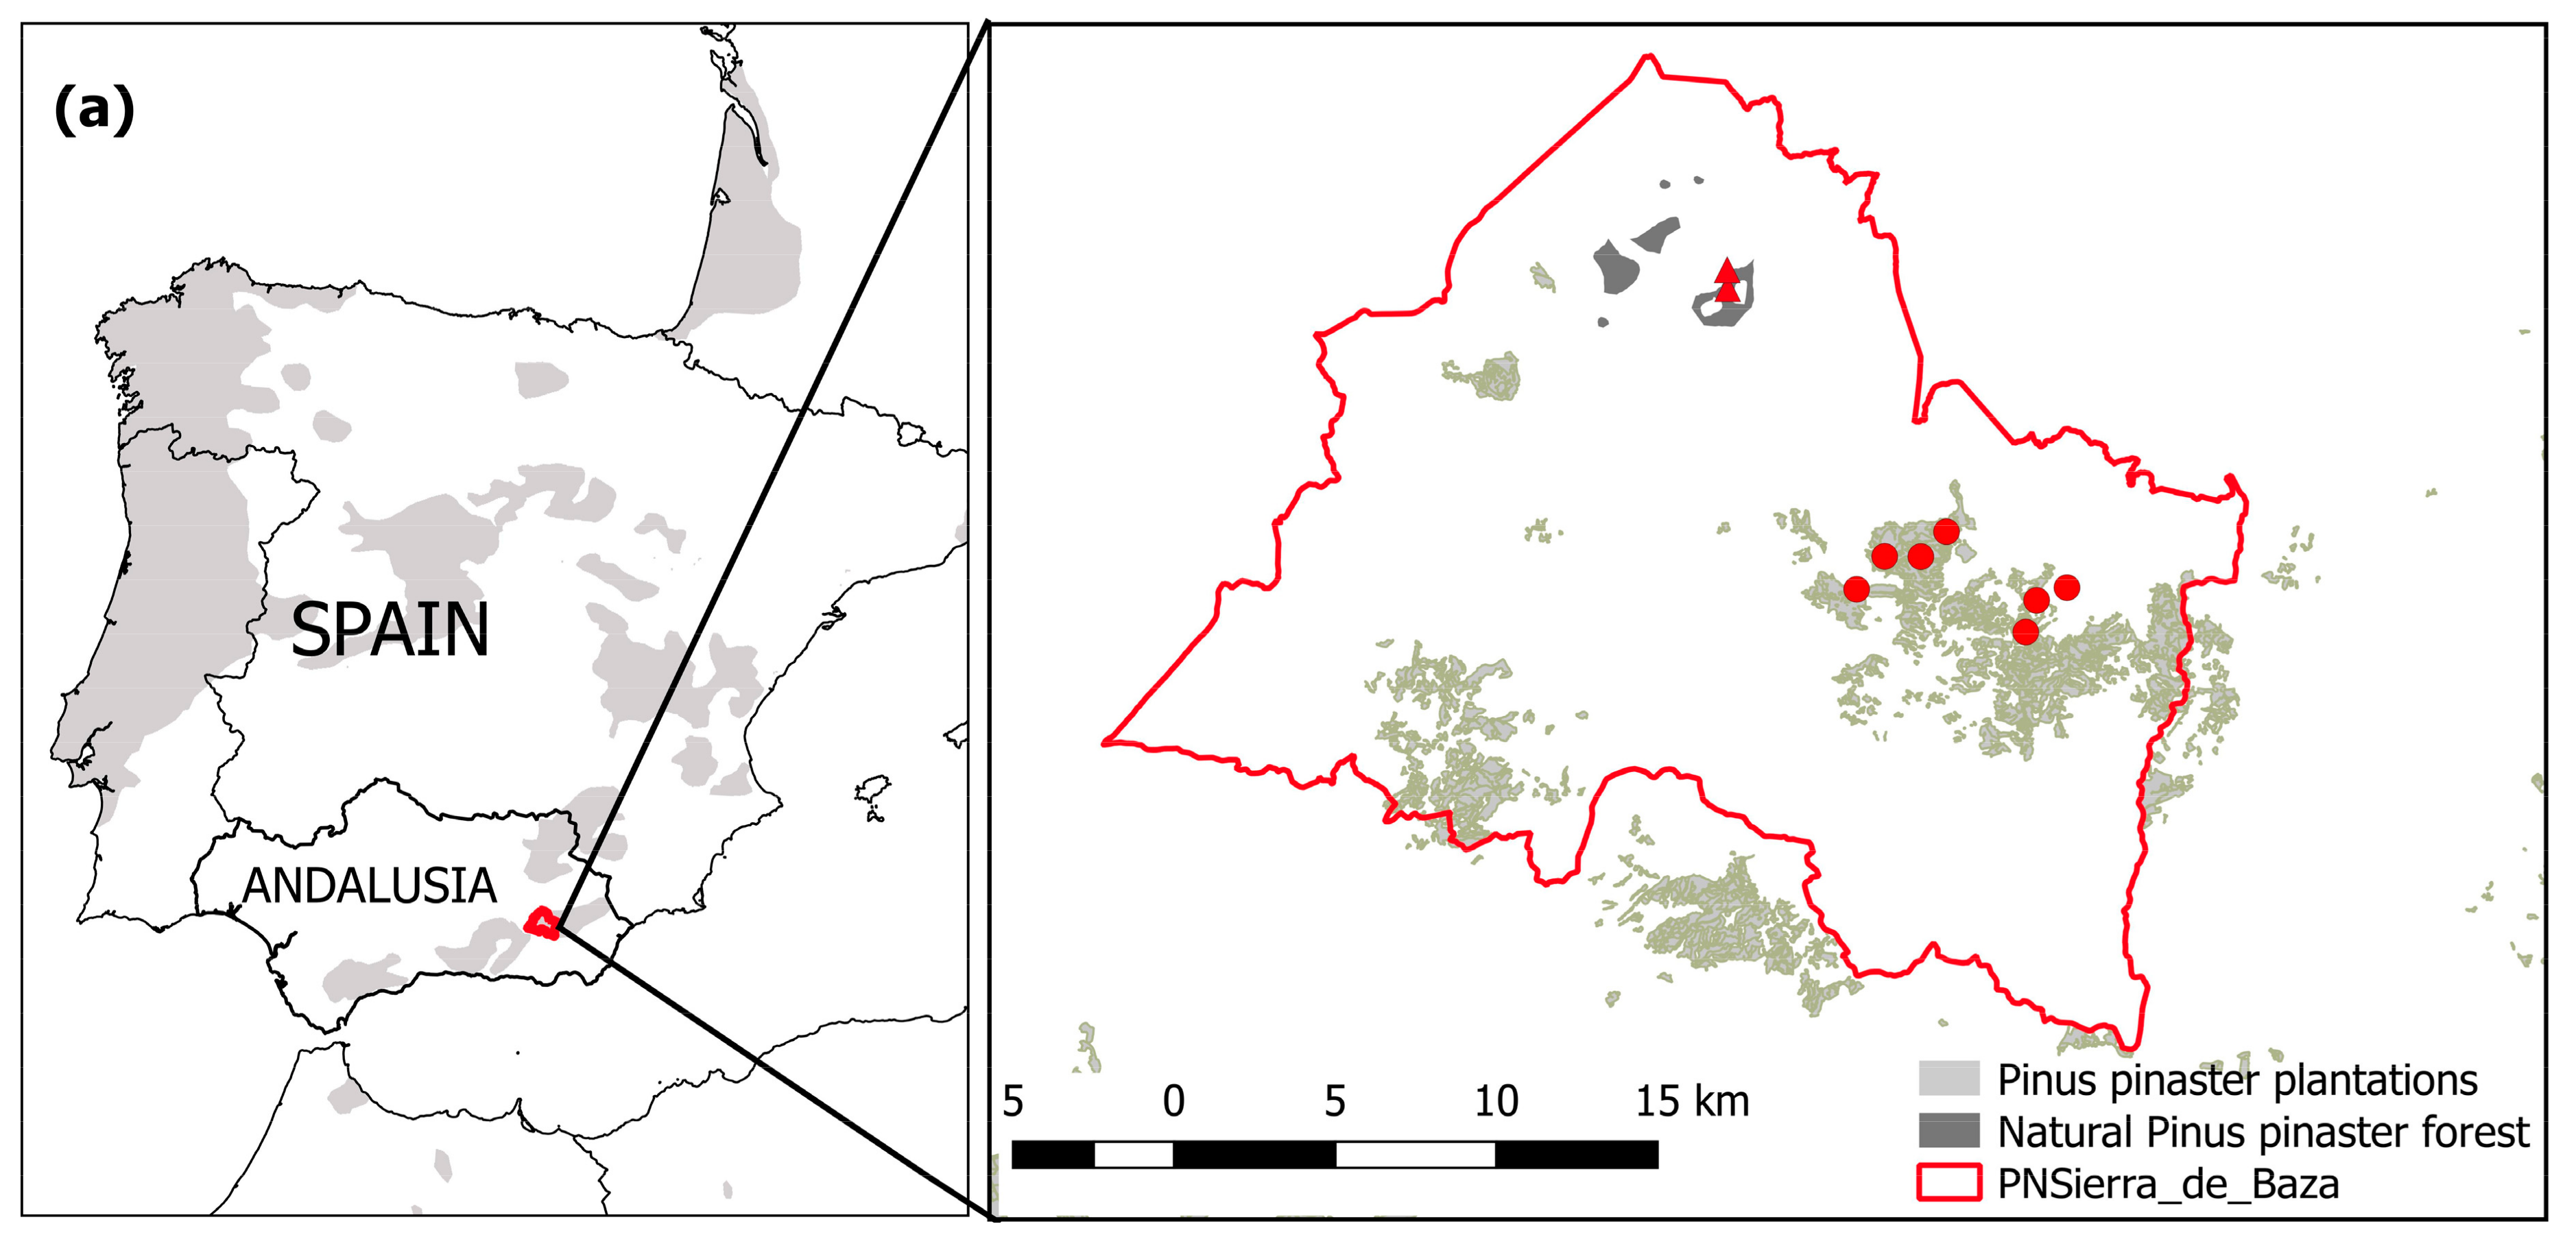
2.1. Study Sites and Tree Species

We included data from two types of forests located in Sierra de Baza (Granada, southeastern Spain): naturally regenerated forests (hereafter abbreviated as F stands, 37°24′44″ N; 2°49′18″ W, 1380 m a.s.l.), and planted forests (hereafter abbreviated as P stands, 37°20′28″ N; 2°45′38″ W, 1340 m a.s.l.; see Figure 1; Table 1).
The F and P stands have a mean density of 400 and 750 trees ha−1, respectively. In this area, low soil water-holding capacity cause soil dryness and increase tree mortality that is concentrated at lower elevations and on sunny southwestern slopes. The study stands show diverse mortality intensities in response to the droughts in the 2010s (Figure 1b) but share similar physiographic and lithological characteristics. At each site, trees were considered non-declining or declining on the basis of the percentage defoliation, with 60% as the threshold using the approach proposed by the ICP-Forests [26], which consists of a visual evaluation of the crown with regard to leaf loss and color. To avoid subjectivity in the visual evaluation of defoliation, all measurements were performed by the same person. The climate in the study area is thermo-Mediterranean with average annual rainfall of 363 mm, a mean temperature of 15.2 °C, and hot (mean maximum summer temperature is 26.3 °C) and dry summers (summer precipitation is 8.2 mm) (climate data correspond to Baza station, 37°33′52″ N, 2°46′03″ W, 814 m). The soils are formed on phyllites and quartzites with the most abundant soil types being leptosols and regosols on dolomites in naturally regenerated forests, and entisols and inceptisols on limestones in plantations. Slopes are steep (~25–35%). A mixture of P. pinaster and Juniperus communis L. is characteristic of the F sites (Table 1), whereas the P sites are pure pine stands.
Maritime pine (Pinus pinaster) is a conifer widely distributed in the Western Mediterranean Basin where it grows over a broad range of elevations, climates, soils and water availabilities, from oceanic to semi-arid climatic conditions [26]. It is considered a drought-avoiding species [27]. Dendrochronology has been used to study this species because of its sensitivity in response to climate stress and its relatively high longevity [15,17,25,27,28,29].

2.2. Field Sampling

We selected dominant trees belonging to a wide range of age classes in naturally regenerated stands and a uniform age (36–40 years) in plantations, and measured their diameter at breast height (DBH) and tree height (Table 1). We sampled two sites (n = 36 trees) located in F stands and seven sites (n = 40 trees) located in P stands. At each site we sampled pairs of living or non-declining trees (hereafter ND trees) showing a crown cover greater than 60% and declining (crown cover < 60%) or recently dead (hereafter D trees) trees that were similar in DBH, height and micro topographical position. Sampled trees were located at least 20 m apart from each other across a rectangular area of 1 ha. Two cores were extracted at 1.3 m height, using a Pressler increment borer from each pair of ND and D trees in the naturally regenerated forests (18 pairs) and plantations (20 pairs) (Table 2). All dead trees had outer ring dates that overlapped or pre-dated the 2015 drought.

2.3. Tree-Ring Methods

In the laboratory, the wood samples were air dried and carefully polished with successively finer sandpaper until the tree rings were visible [30]. Visual cross-dating of samples was conducted before measuring the tree-ring widths to the nearest 0.001 mm using a LINTAB measuring device (Rinntech, Heidelberg, Germany). The cross dating was verified statistically using the COFECHA program [31]. A few sampled cores could not be cross-dated, and they were excluded from subsequent analyses (see Table 2).
Basal area increments (BAI) were calculated from raw tree-ring widths (TRWs) to obtain a more meaningful parameter of tree growth. Four chronologies or mean series of ring-width indices (RWIs) were built for the two sites and vigor classes. The chronologies were obtained by removing the long-term biological trends in radial growth as trees age and stems enlarge. Tree-ring widths were converted into growth indices with stable mean and variance, by dividing the observed values by the values expected based on negative exponential functions fitted to the TRWs. Autoregressive modeling was performed to remove temporal autocorrelation and to generate residual RWIs at the individual tree level. Finally, a biweight robust mean was used to compute the mean residual chronologies of the RWIs for each stand and tree-vigor class. The chronologies were characterized using the following statistics [32]: mean tree-ring width; basal area increments of the last 20 years (BAI20); first-order autocorrelation of tree-ring width (AR1); and the mean sensitivity (MS) of residual RWIs.

2.4. Climatic Data

The availability of data from a weather station close to the study site is limited due to the length of the observation period and gaps in local climatic data. Therefore, we used 0.25°-gridded monthly data for mean temperature and total precipitation available for the period 1954–2016 from the E-OBS data set [33]. These climatic data were used to quantify trends in annual climatic variables and to assess the climate-growth relationships considering monthly variables (mean, maximum and minimum temperatures, precipitation). We obtained the July Standardized Precipitation-Evapotranspiration Index at 6- (SPEI6) to 12-month-long scales (SPEI12) available at 0.5° spatial resolution to evaluate drought severity [34]. Negative SPEI values correspond to water deficit and would be related to a decline in growth, whereas positive SPEI values indicate wet conditions which should correspond to enhanced growth. The SPEI was used to select the four most intense droughts in the study area for the period 1975–2016 (Figure 1).

2.5. Growth Resilience Indices

Three climate indices (CR) were calculated for each stand type and tree group, according to [35]:
  • The resistance index (CRT): this index quantifies the growth of the tree during the drought (Dr) with respect to the previous growth (PreDr):
    (CRT = Dr/PreDr)
  • The recovery index (CRS): this is the response of the growth after the drought (PostDr) compared with Dr:
    (CRS = PostDr/Dr)
  • The resilience index (CRC): this is the ratio of the growth values after (PostDr) and before (PreDr) the drought:
    (CRC = PostDr/PreDr)
Higher values of CRT, CRS and CRc indicate greater growth resistance, resilience, and recovery, respectively. These indices were calculated using BAI data and considering four major droughts selected using SPEI data: 1995, 1999, 2005 and 2011. The pre- and post-drought periods were 3 years long to avoid drought overlap and because growth has been shown to recover to normal values after this period [36].

2.6. Statistical Analyses

To quantify the growth responses to climate and drought, we calculated Pearson correlations using residual chronologies as predictands and monthly climatic variables and SPEI as predictors. Growth indices and monthly climatic series were correlated from the previous August until October in the year of the following tree-ring formation [37]. Correlations were obtained for the common period 1975–2016.
We assessed differences in the three resilience indices (CRT, CRS and CRc) calculated for the four selected droughts (1995, 1999, 2005 and 2011) and the growth (BAI20) of ND vs. D trees across the two stand types using Students’ t test for independent samples and analyses of variance (ANOVAs). Prior to statistical analysis, we examined all indices for normality and homoscedasticity. When the variables were not normal, the data were subjected to a Box-Cox transformation [38]. Differences among treatments were considered significant at a level of p = 0.05.
We performed all analyses using R software version 3.4.0. The dplR and Treeclim libraries were used to calculate tree-ring statistics and climate-growth correlations in the R statistical package [39], and the lm, and glm libraries [40] were used for ANOVAs and Students’ t test.

2.7. Environmental and Silvicultural Variables Related to Tree Death

To assess the influence of the site and silvicultural conditions on declining and non-declining trees according to the stand type, we obtained bioclimatic variables at a spatial resolution of 200 m × 200 m compiled from the Andalusia Environmental Data Network (REDIAM, available from https://www.rediam). We considered 45 environmental variables (climatic, topographic, and edaphic variables) as potential predictors of the level of decline (Table S1, Supplementary Material). These variables were chosen based on their eco-physiological relevance to the tree drought response [41]. Digital Elevation Model (5-m spatial resolution) data were also obtained from the REDIAM, and used to generate topographical variables (elevation, slope and aspect) in ARC GIS version 9.2 (ESRI, Redlands, CA, USA). In addition to the environmental variables, silvicultural variables were also included to account for forest structure at the site level: tree height (m), DBH (cm), basal area (m2 ha−1), and tree age (year), obtained by counting tree rings.
We used sparse Partial Least-Squares regression (PLS) [42] to analyze the relationships between the response variables (BAI and climatic indices) and level of decline with the environmental and silvicultural variables of each stand. We chose this approach because PLS supports smaller sample sizes that are smaller than covariance-based structural equation modelling techniques [43]. The predictor matrix was composed of 45 variables whilst the response matrix was composed of BAI20 and the climatic indices. The projected matrices were represented in a Correlation Circle to evaluate the association between the stand types (defined by the response variables) and single site characteristics (the predictor matrix). The spls package was used [42] for PLS analyses.

3. Results

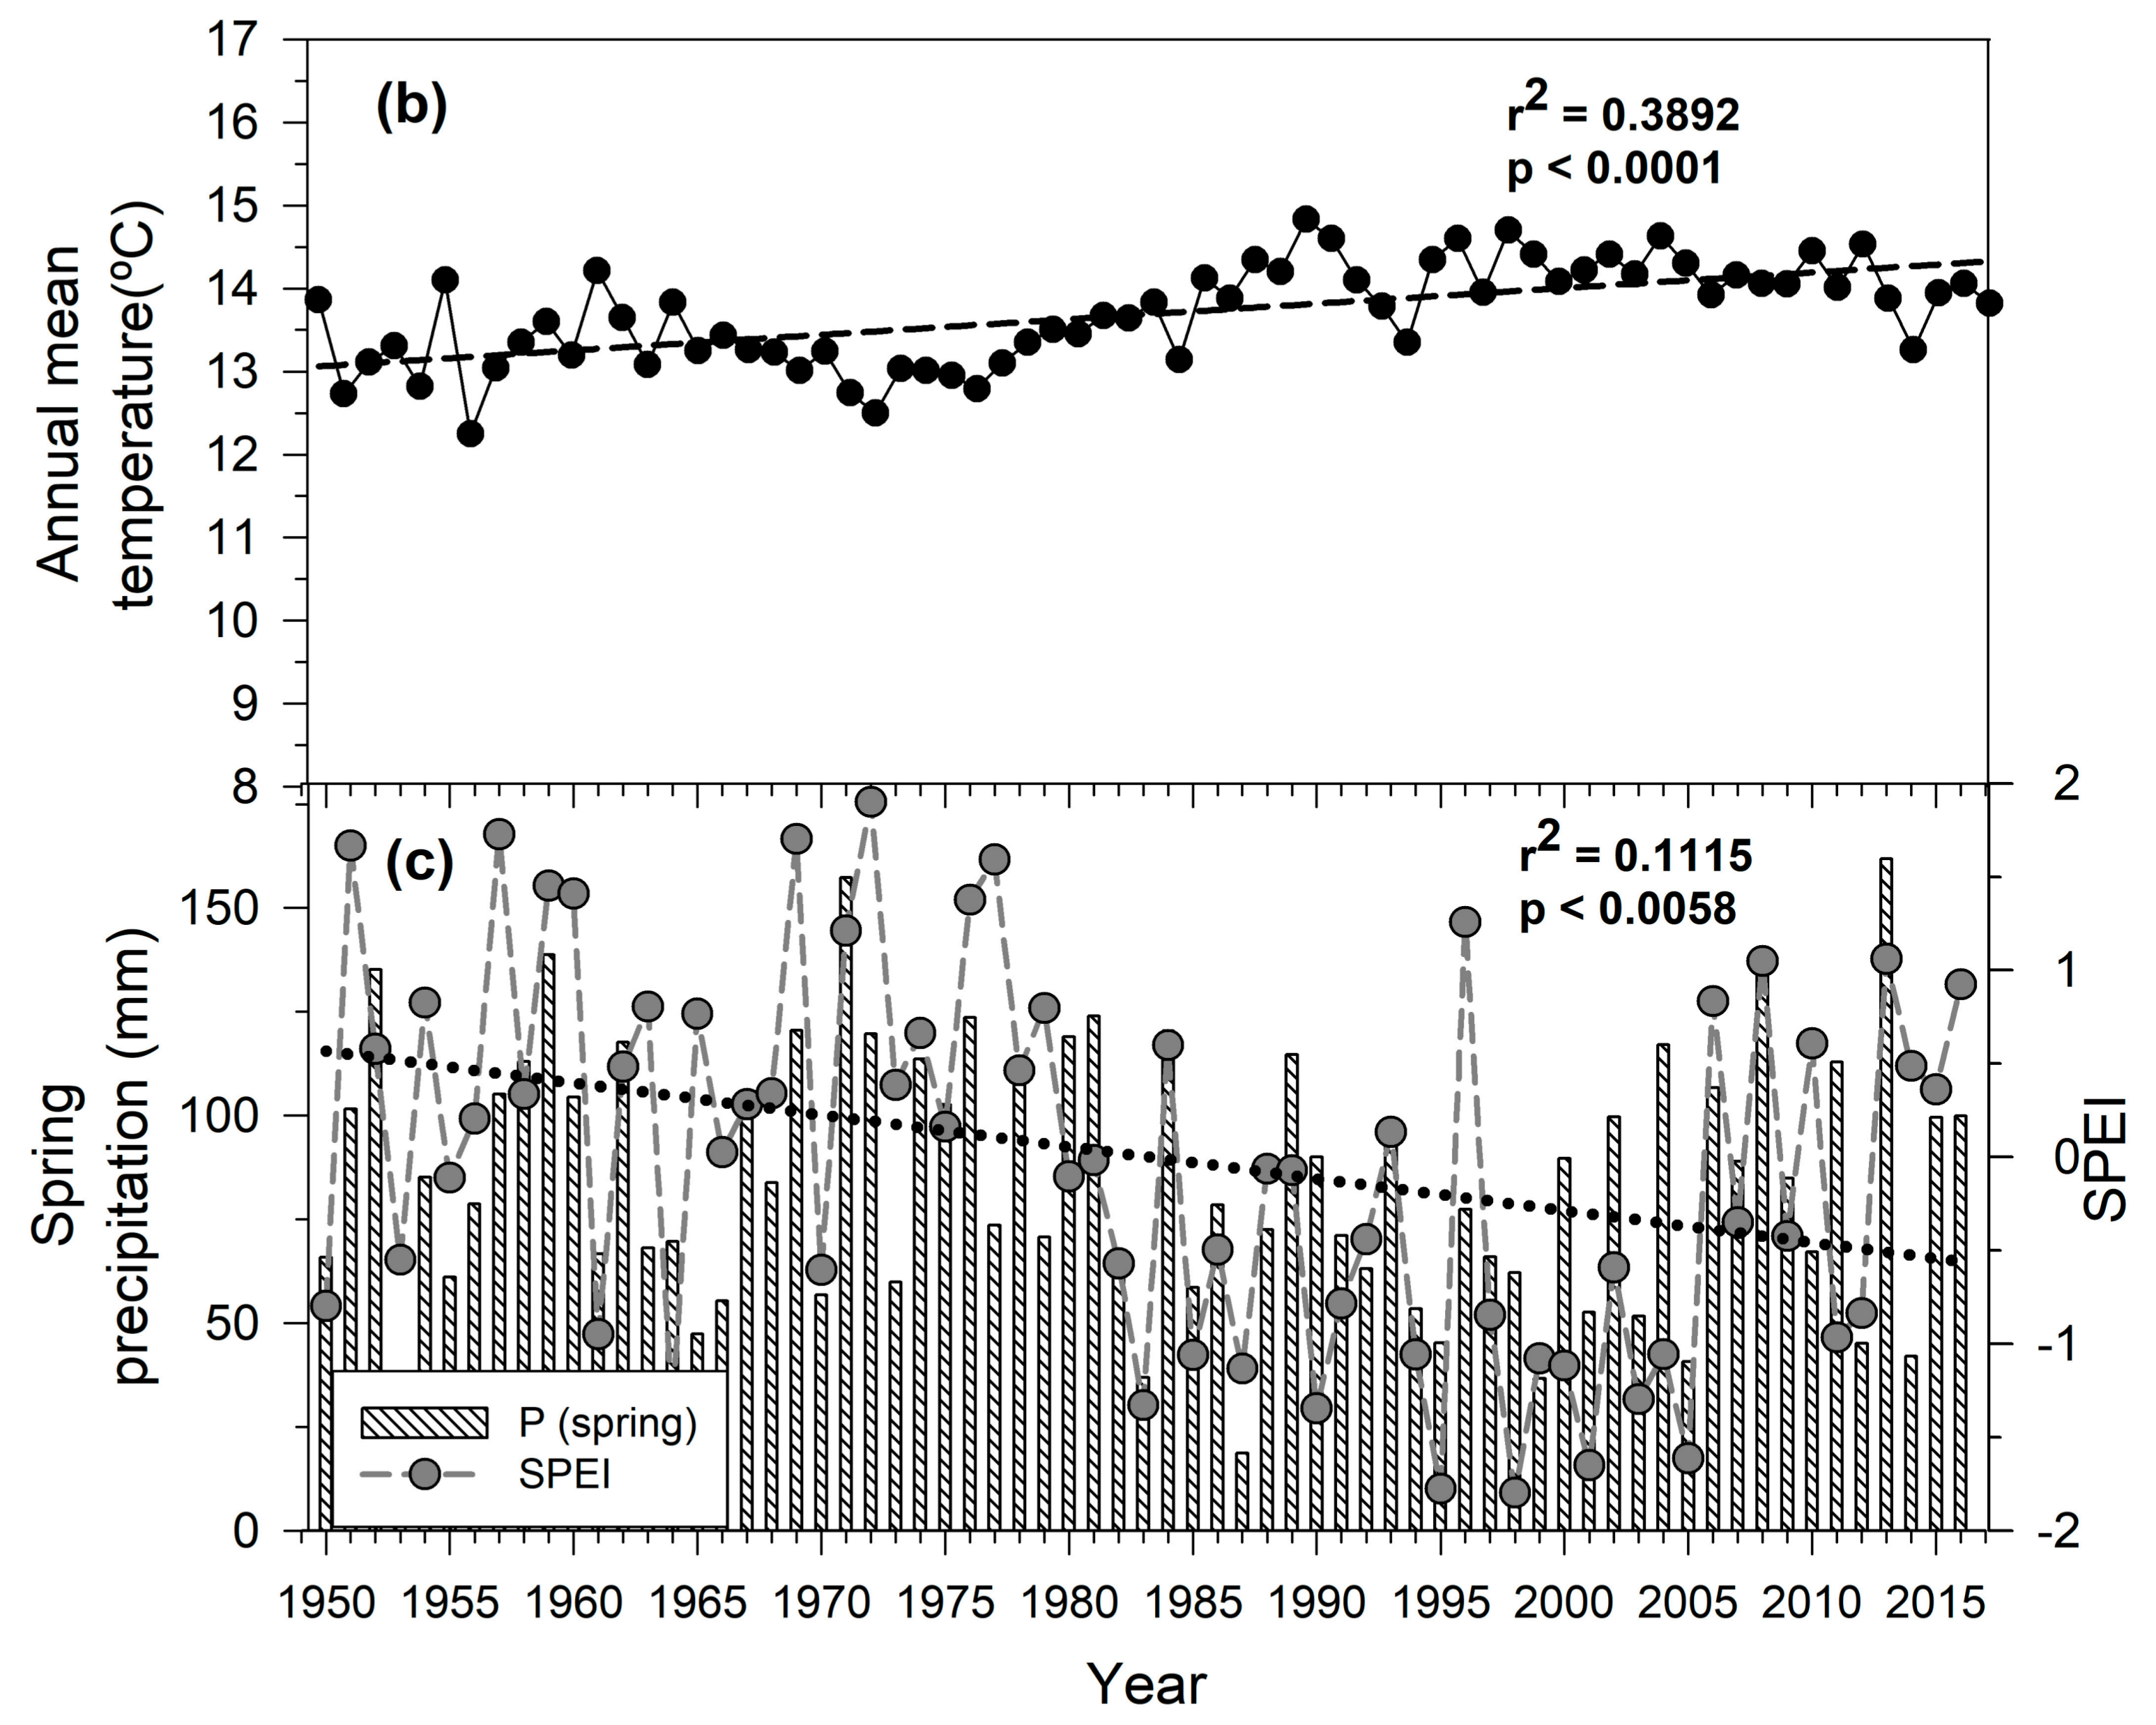
3.1. Regional Climatic Variability

We found a significant increase in annual mean temperature during the 20th century (Figure 1a), with a “break point” around 1978 after which warming accelerated when compared with previous decades. A significant reduction in annual precipitation was observed with a strong variability between decades and years and wet periods (1950s, 1970s) alternating with dry decades (1980s, 1990s, 2000s). After the 1980s, spring annual precipitation decreased rapidly (Figure 1a). Additionally, a long-term trend was detected in the SPEI index with increasing aridity during the second half of the 20th century as compared with the first half (Figure 1b).

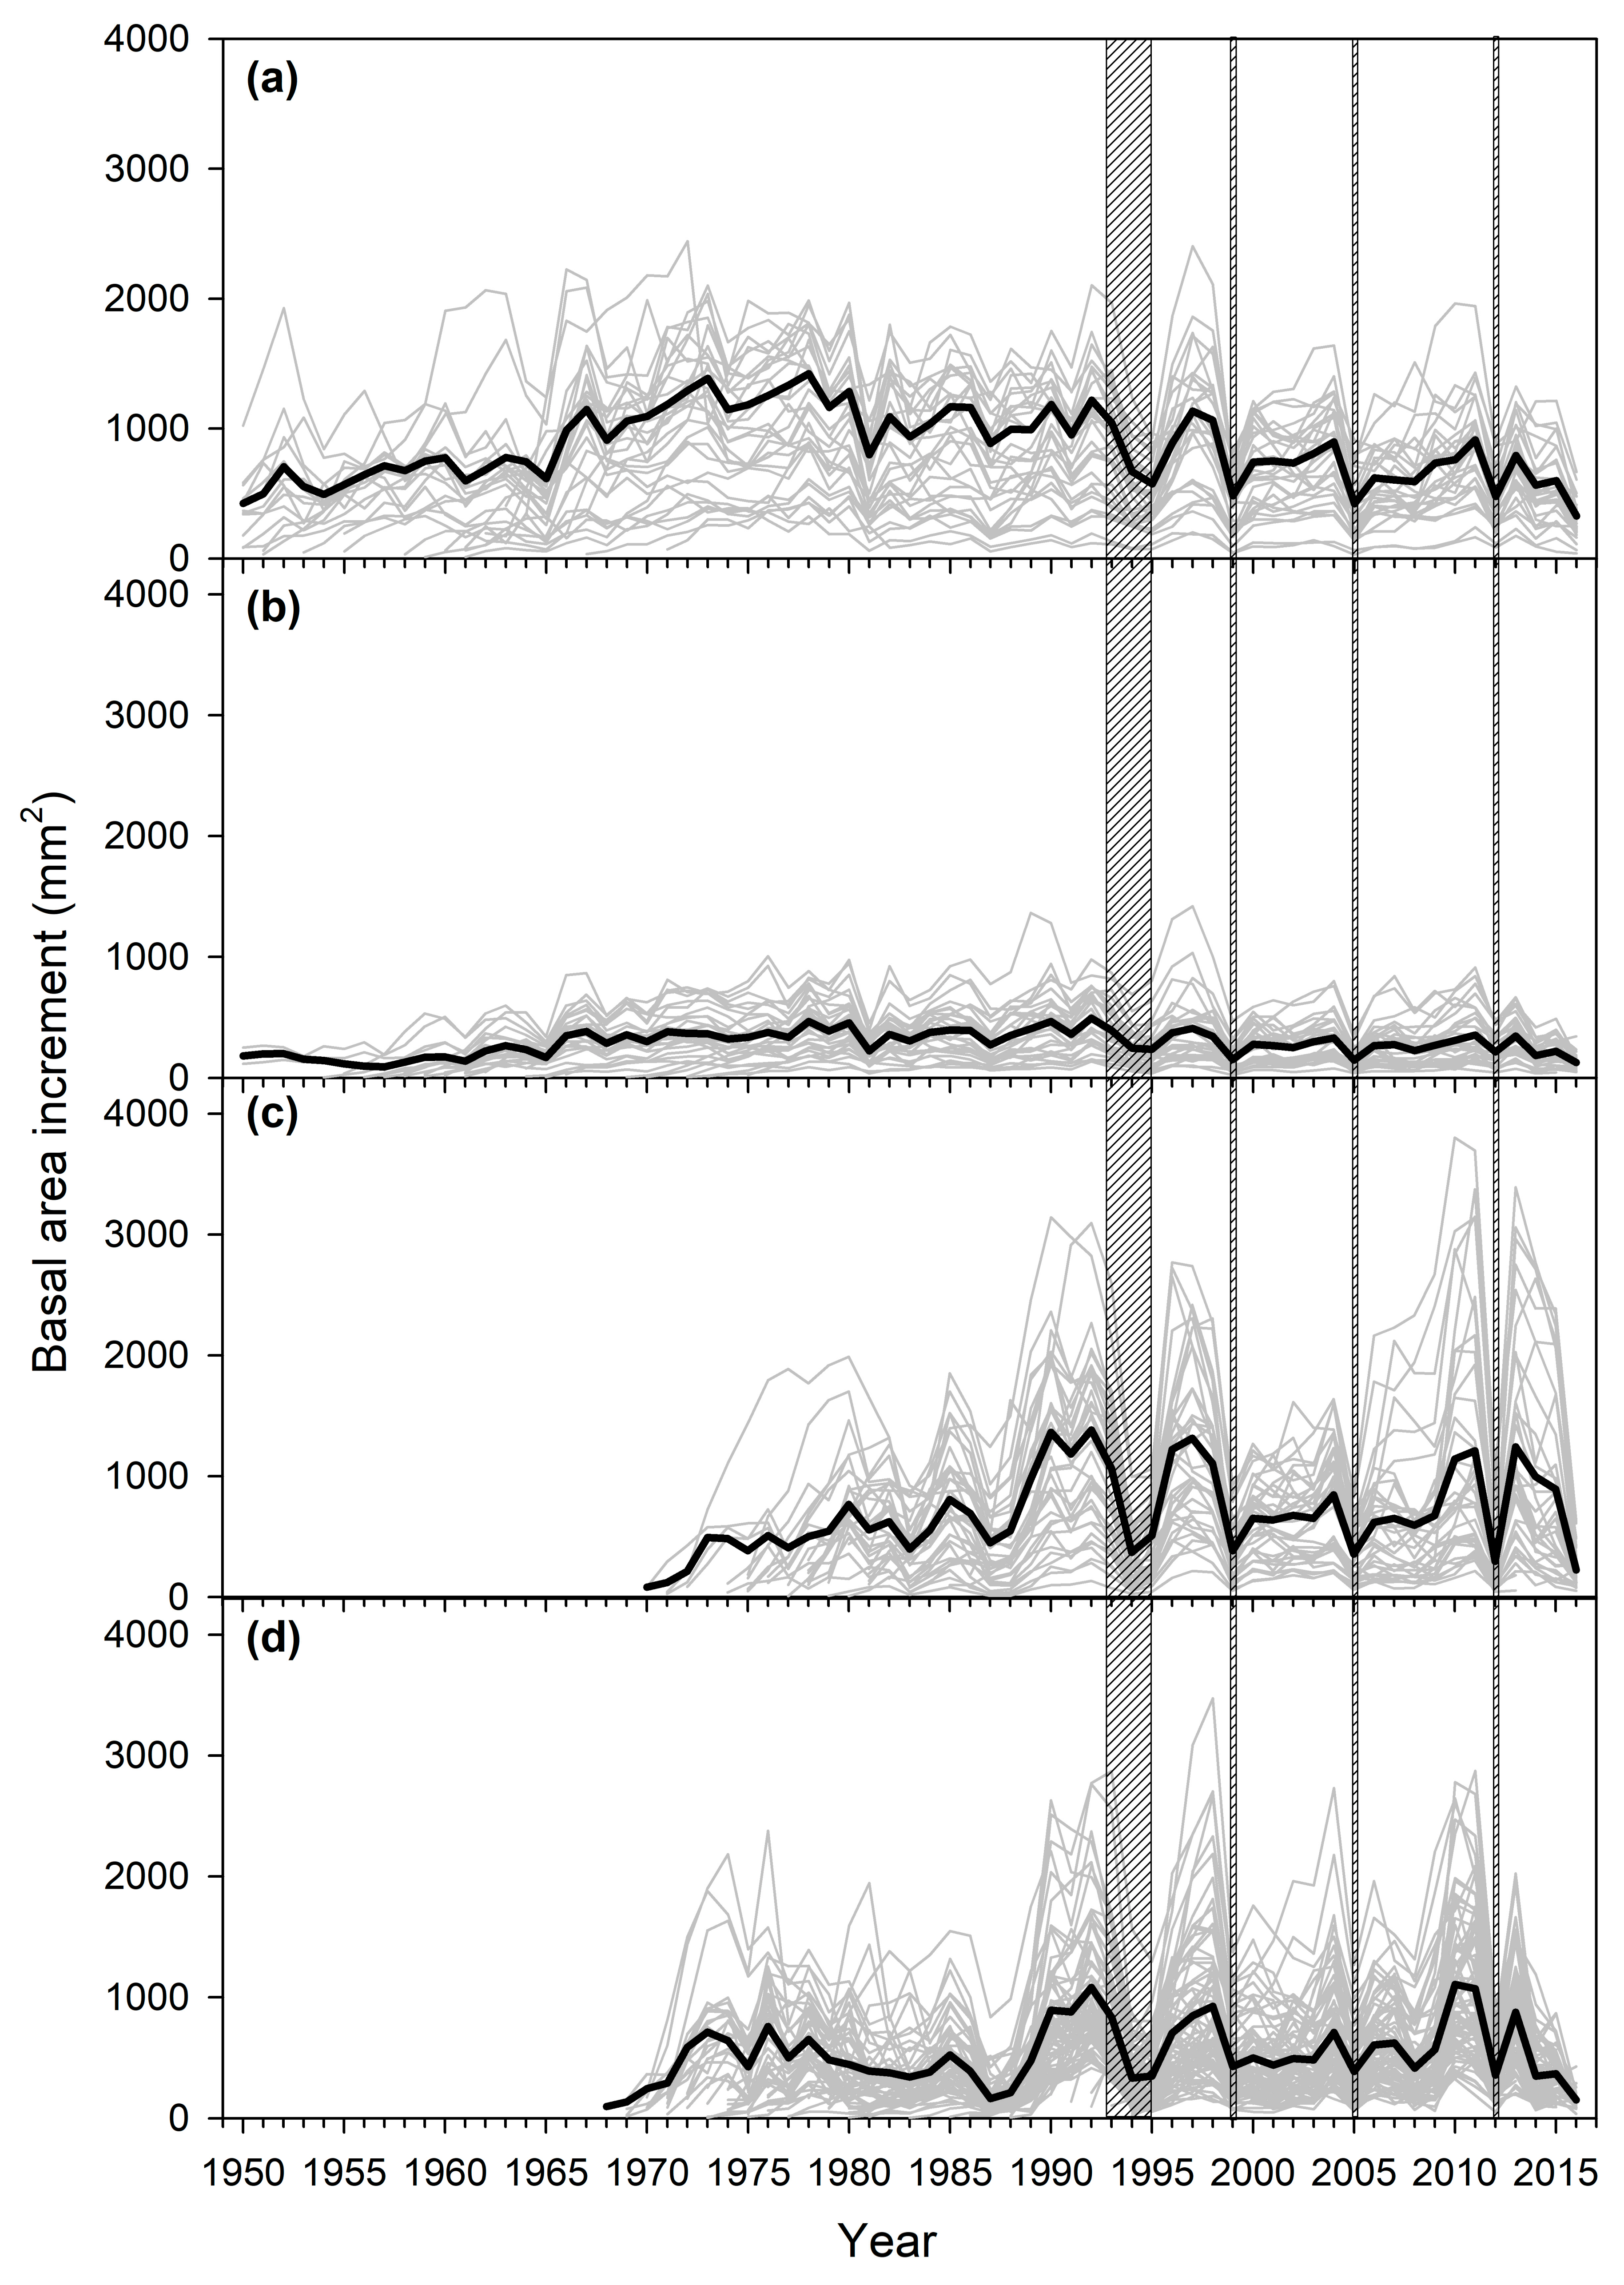
3.2. Mortality and Growth Patterns

Site-level mortality (for trees with DBH > 10 cm) for P. pinaster after the 2010s drought was higher in plantations (75%) than in naturally regenerated forests (40%). The longest tree-ring series dated back to 1930 and 1969 in naturally regenerated and planted stands, respectively (Figure 2, Table 2). The mean TRW for the common period (1975–2016) was higher in planted than in naturally regenerated stands, but differences in TRW or BAI20 between ND and D trees were more significant (p < 0.001) for naturally regenerated than for planted (p < 0.05) stands (Table 2). The variation in growth was similar for all stand types with noticeable growth reductions in 1990–1995, 1999, 2005 and 2012 (corresponding to dry periods), and growth increases in 1992, 1997, 2010 and 2013 (Figure 2).
The first-order autocorrelation was the highest in the F-ND trees, suggesting an elevated year-to-year persistence in the growth of the naturally regenerated stands, whereas the mean sensitivity was the lowest in the P-D trees, indicating a lower year-to-year variability in growth there than in the other sites.

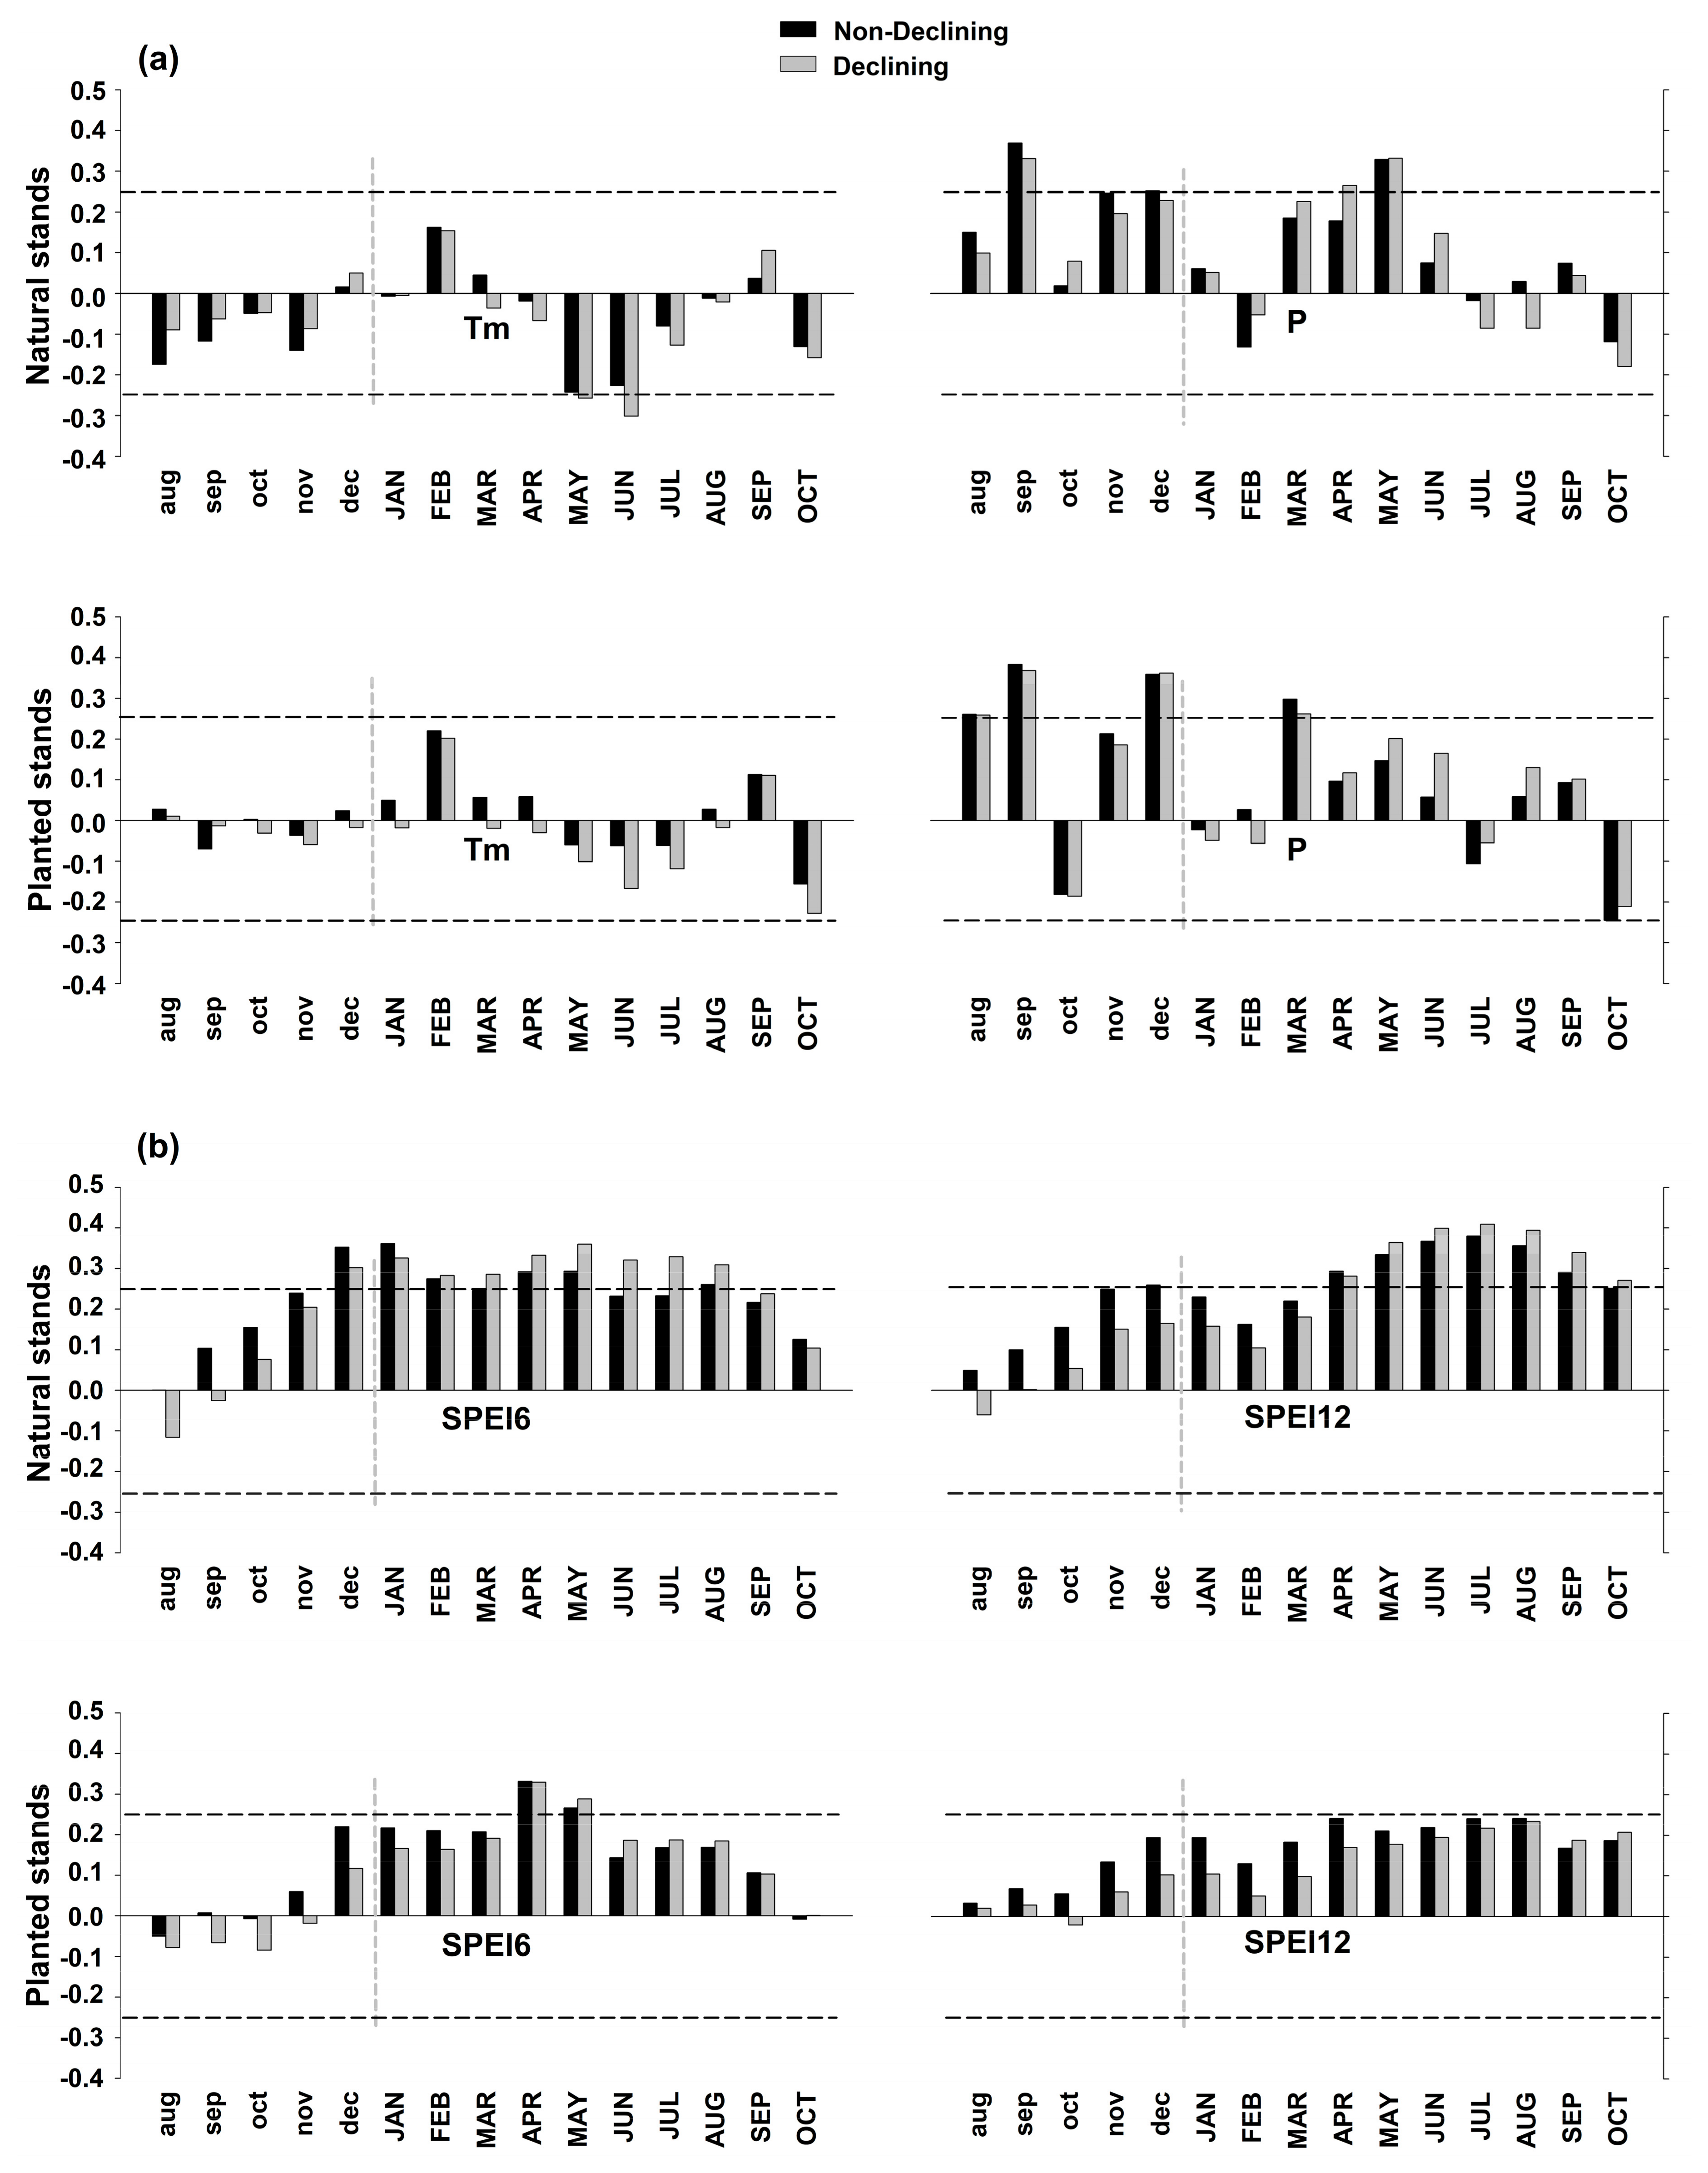
3.3. Climate-Growth Relationships

These analyses revealed a significant association between growth (RWIs) and climate for all stand types but with different magnitudes (Figure 3a). We found a negative and significant relationship with mean temperature for the current May and June in the naturally regenerated stands (Figure 3a), this association being caused by a negative growth response to high May maximum temperatures, particularly in D trees (Figure S1, Supplementary Material). Under warm spring conditions this negative effect was more noticeable in plantations than in naturally regenerated stands. In all stand types, significant precipitation-growth correlations were also found for the previous autumn and winter (September, December), but they were again more marked in plantations than in naturally regenerated stands (Figure 3). In naturally regenerated stands, significant correlations were also observed between growth and current April-May precipitation, particularly in D trees, whilst trees from naturally regenerated stands particularly ND trees responded to March precipitation.
In naturally regenerated stands, the strongest growth responses to the drought index were found for D trees and when considering the May and July SPEI6 and SPEI12 indices, respectively (Figure 3b). In these stands, ND trees responded to the winter (December–January) SPEI6 values. The trees in planted stands showed a lower response to the drought indices (SPEI6 and SPEI12) with the only significant associations being for the April SPEI6 and when considering both tree types.

3.4. Post-Drought Resilience Indices

The mean growth (BAI20) mainly differed between trees of different vigor (Table 3). The stand type and tree vigor interacted significantly, affecting the CRC of the 1995, 1999 and 2012 droughts, the CRT of the 1999 and 2005 droughts and the CRS of the 2012 drought (Table 3). A negative trend with time was found for the CRS index in planted stands (Figure 4). The CRC index was higher in planted than in naturally regenerated stands for most of the droughts considered due to the effect of ND trees.

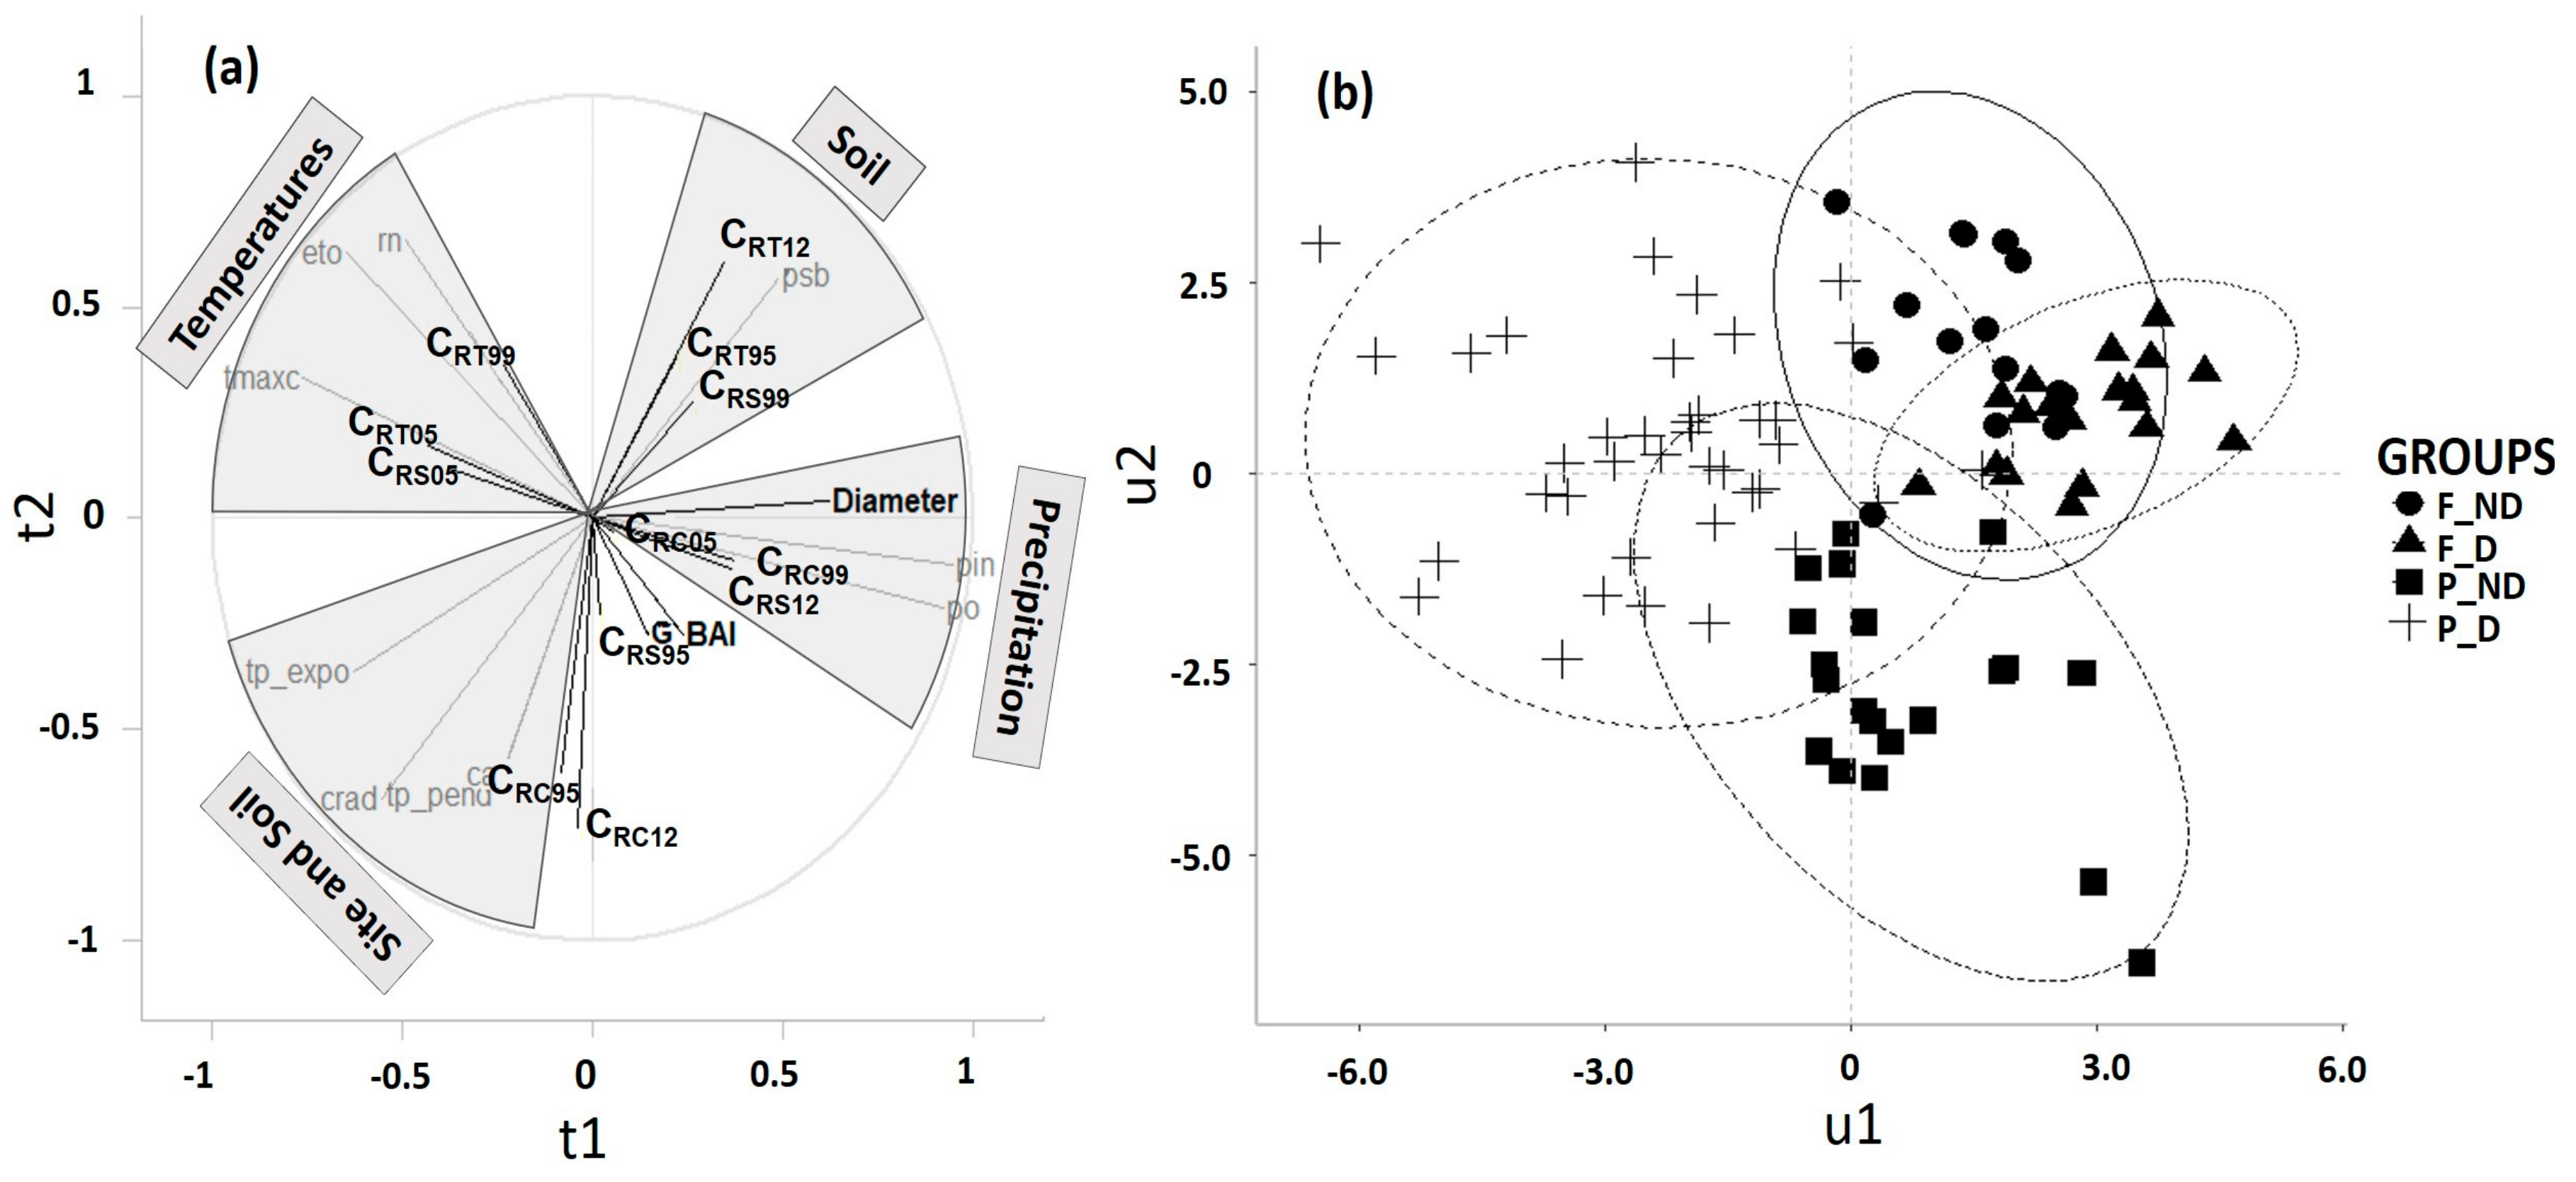
3.5. Environmental and Silvicultural Drivers of Stand Responses to Drought

Following a sparsity test of the predictor matrix, the stand types were found to be related to 10 variables, which allowed separation of the four stand types studied (Figure 5). Declining naturally regenerated stands were related to seasonal winter and autumn precipitation, whereas non-declining naturally regenerated stands showed highly significant correlations with soil fertility (percent base saturation). On the other axis, evapotranspiration, maximum temperature and annual radiation showed highly significant correlations with the growth of declining trees from planted stands. High values of soil water retention capacity, related to aspect and slope, were correlated with the growth of non-declining trees in planted stands.

4. Discussion

This study provides useful information for the analysis of the climate sensitivity of Pinus pinaster stands and the resilience shown by this species when exposed to extreme drought events as a function of stand origin and environmental site conditions. As hypothesized, declining trees in planted stands showed a loss of growth resilience, specifically a negative trend in the post-drought recovery (CRC), after successive droughts (Table 3, Figure 4). This loss of resilience may reflect the poor vigor of these trees, which responded to recurrent droughts by showing a reduction in growth rates and by needle shedding. These symptoms may portend widespread tree mortality, as has been observed in other drought-prone pine plantations [10]. Therefore, our results confirm an increased sensitivity of planted P. pinaster stands to drought which suggests that they will become increasingly vulnerable to drought-triggered tree mortality in the coming decades [17]. However, our observations indicated that climate-associated tree mortality is happening not only in planted but also in naturally regenerated stands, suggesting that future dry spells and heat waves may be common underlying drivers of dieback and mortality events in these marginal forests [44].

4.1. Climate- and Drought-Growth Relationships in Planted and Naturally Regenerated Stands

Several dendrochronological studies have used Pinus pinaster to detect the effect of climatic conditions on growth, but most of them dealt with naturally regenerated forests [25,28,29,45,46,47,48,49,50]. Here, we fill this gap by comparing the climate-growth associations of naturally regenerated and planted stands subjected to similar regional climatic conditions.
Warming-induced drought stress negatively affected both planted and naturally regenerated stands, and most of the periods of growth reduction correspond to droughts documented in southern Spain [51,52]. However, the response to spring drought (April-May) was at short time scales in planted stands, whereas naturally regenerated stands responded more strongly and mostly to medium-term drought stress (Table 2, Figure 2). Non-declining P. pinaster trees had higher growth rates (BAI) than declining trees, with sharp drops during dry years (1990–1995, 1998, 2005 and 2012). The recent growth reduction (BAI20) observed in declining vs. non-declining trees differed between naturally regenerated (−62%) and planted stands (−23%) (Table 2), suggesting that predisposing factors (tree-to-tree competition, low soil water availability, etc.) may have suppressed the growth of declining trees in naturally regenerated stands (Figure 2b) before the studied droughts triggered the mortality episode.
Our analyses agree with previous studies on drought-induced mortality, indicating that climate-growth responses to climate depend on previous tree growth since declining trees show lower growth rates [4,53], although other studies have shown higher growth rates for declining or recently-dead trees prior to drought occurrence [18,28,54]. Low growth rates were caused by warming-induced drought stress; specifically, water deficit in spring, as documented in other Iberian pine forests [15]. However, tree age and size may influence the low-growth periods of P. pinaster in complex ways [45], although the naturally regenerated and planted trees had similar size (DBH) and age within each stand type.
Maritime pine (P. pinaster) is considered a drought-avoiding tree species which may adapt to drought by diverse physiological responses (e.g., changing its hydraulic architecture, reducing xylem susceptibility to cavitation, or increasing water-use efficiency by rapid stomata closure, [26]). The physiological responses may be connected to the different growth responses we detected in the different stands. The reduction in growth of declining trees seems to be related to water-deficit stress which constraints meristem activity, reduces carbon uptake, and increases the vulnerability to xylem embolism in xeric sites, increasing the chance of tree death [23]. Low growth is linked to changes in the hydraulic architecture, including its capacitance, these being related to a reduction in water transport and carbohydrates synthesis [55]. Non-declining stands, in contrast, have a more balanced growth, which gives rise to more stable hydraulic structures and, therefore, they are less prone to xylem embolism and drought-induced mortality [56]. Our findings indicate that trees showing lower radial growth under better climatic conditions also tend to have a lower capacity to withstand drought and may be more likely to die.
In the case of planted stands, differences among trees with respect to their level of decline may be modulated by competition, genetic differences, and the effect of soil preparation when planting. High tree density may reduce root growth and crown development which would be unfavorable under severe water deficits [53]. Additionally, the plantations of this study possibly originate from seeds of provenances poorly adapted to the drought stress characteristic of semi-arid southeastern Spain [57]. Finally, and although the plantations were installed mainly at low-quality sites, the characteristics of these soils were strongly modified by the soil preparation work, so, the growth responses to climatic stress may be tightly conditioned by local site conditions [58]. All these factors may produce a loss of vigor in individual trees, and thus an increased vulnerability to drought events and other stress factors such as pests [59,60]. In this area, extensive tree damage has been also associated also with the Maritime Pine Bast Scale (Matsucoccus feytaudi; R.M. Navarro, pers. observ.).
The climate-growth relationships differed between naturally regenerated and planted stands. Naturally regenerated stands showed a positive response to wet conditions during the previous autumn and winter and during the current spring and summer, whereas they showed a negative response to warm spring (April–May) conditions (Figure 3). In contrast, growth in planted stands was enhanced by wet conditions in the previous autumn (September) and winter (December) and in the current early spring (March). Our findings echo those observed previously for the study species in Spain [17,25,28,49], namely, a positive correlation between radial growth and cool-wet spring conditions which can stimulate cambial dynamics, thereby resulting in increased production of earlywood and enhanced growth. On the contrary, warm-dry spring conditions may reduce growth through exhaustion of soil-water reserves before the summer dry season [15,29].
Declining trees from naturally regenerated stands showed the most pronounced sensitivity to long-term (12 month) summer drought stress, possibly because the trees in planted stands were less responsive and their growth was much suppressed (Figure 3). These results are in agreement with previous studies on the limitations of the tree growth by drought stress [12]. Recurrent droughts starting in the 1990s affect the months when Mediterranean pines have their maximum cambial activity, namely, between April and June [15]. Drought stress can be exacerbated by the high temperatures and low precipitation in the study site, one of the driest locations for P. pinaster in the Iberian Peninsula [25]. These results are supported by the sensitive response of the naturally regenerated stands to precipitation, probably because they are located in the soils of better quality [41]—as the environmental analyses showed (Figure 5). By contrast, the low sensitivity to climate of the planted stands indicates that their growth is conditioned more by non-climatic factors, such as the alteration of soil conditions as a result of soil preparation during plantation whose legacy effects last for several decades [61]—or intense tree-to-tree competition, leading to suppressed growth [9].

4.2. Response of the Resilience Indices of Pine to Droughts

The resilience indices were able to capture the drought impacts on P. pinaster growth and to identify the time scale of tree growth recovery after droughts. During the four studied droughts (1994–1995, 1999, 2005 and 2012), naturally regenerated stands had, in general, higher values of the resistance (CRT) and resilience (CRS) indices than planted stands (Figure 4). Besides, planted stands exhibited the highest values of the recovery (CRC) index, in the 1994–1995 and 2012 droughts. The lower resistance these planted stands could reflect reduced vigor [35], which is consistent with the well-documented, age-related decline of growth in this species [45] and the often-disproportionate mortality of plantations relative to naturally regenerated forests [8]. However, the downward trend of the recovery (CRC) and resilience (CRS) in planted stands is a relevant finding; it indicates a cumulative effect of droughts on the capacity of these stands to respond to consecutive droughts, particularly in the case of CRC and the declining trees. Contrastingly, we found a better resistance and resilience in naturally regenerated stands, indicating that they may be less vulnerable to drought due to a combination of microsite quality and intrinsic factors such as physiological state and genetics. Nevertheless, their ability to recover their pre-drought growth levels is not necessarily higher than that of planted stands [35].
These findings suggest that climate warming and drought stress especially affect the tree growth, vitality, and mortality rates of planted stands, as found in other drought-prone regions [6]. This vulnerability may be due to competition, related to high tree density, and the use of genetic provenances with poor ability to withstand droughts [57]. The susceptibility to drought can also indicate the negative effect of environmental factors acting in the long-term (e.g., aridification) on tree growth and vigor and/or the effect of repeated drought events over time [33], which resulted in abrupt mortality events after extremely dry and warm years (e.g., 2012, 2016).
Overall, planted stands were less resistant and non-declining trees had higher levels of growth recovery. Naturally regenerated stands showed greater values of resistance, suggesting that micro-site conditions play important roles on the growth responses to drought.

4.3. Responses of Growth and Climatic Indices to the Environment and Stand Structure

Seasonal precipitation variables (winter and autumn) were the most important factors related to the growth of declining trees from naturally regenerated stands. However, the growth of non-declining trees from these stands was related to the percent base saturation, a proxy of soil fertility, which may be related to improved soil water uptake (Figure 5). Thus, a deep and fertile soil helps to mitigate the negative effects of drought on tree growth and improves the resistance of trees, particularly in naturally regenerated stands [58] as explained before. These stands occur at sites with gentle slopes and more developed soils, with higher water-holding capacity than those of the planted stands. Evapotranspiration, maximum temperature, and annual radiation were the key climatic variables related to the growth of declining trees from planted stands which confirms that the growth of these trees was constrained by low water availability and high water demand. This is likely a consequence of the presence of declining planted stands on less developed and steeper soils, such as south-facing slopes on limestone substrates with low water-holding capacity [62]. In contrast, high values of water retention capacity—related to aspect and slope—were correlated with the growth of non-declining trees from planted stands, which are located at sites with a higher soil water retention capacity where the negative impacts of drought on growth are buffered [63]. Therefore, the negative impacts of drought on tree growth are largely modulated by the environmental site conditions, although the lack of fine-scale environmental and soil data at the tree level prevents a better understanding of the influence of silvicultural/neighbourhood variables on individual growth.

5. Conclusions

We have illustrated the negative effects of warming-related drought stress on the growth, vigor, and survival of P. pinaster trees, particularly those in plantations. Temperature-induced drought stress and diminishing spring precipitation appear to be increasingly limiting for P. pinaster growth in planted stands and to a lower extent in naturally regenerated stands. In both cases, a progressive and extended reduction of growth has been observed in consecutive drought events during the 1990s, 2000s and 2010s—which weakened trees, leading to recent peaks in mortality. Declining trees in planted stands are vulnerable to drought stress because they have lost resilience capacity after successive drought episodes. Plantations show difficulties in adapting to dry spells—which may threaten some of these stands situated in semi-arid regions, triggering dieback and widespread mortality. However, site-specific variables (slope, aspect, soil type, tree density, genetic origin) may buffer the negative effects of drought on growth and help to prevent severe mortality episodes in plantations. Growth resilience growth indices may be useful for the early detection of forest dieback in Mediterranean pine plantations. P. pinaster drought stress response and resistance are complex biological processes that need to be analyzed at a local scale. We use a dendrochronological approach to address drought stresses encountered by naturally regenerated and plantations forests and to predict how silvicultural alternatives may contribute to stand acclimation and the design of strategies to mitigate the impacts of drought on plantations (e.g., thinning treatments).

Supplementary Materials

The following are available online at https://www.mdpi.com/1999-4907/9/6/358/s1, Table S1: Predictors variables used for Principal Component Analysis for Pinus pinaster according to forest type and declining level. Figure S1: Basal Area Increment chronologies of Pinus pinaster from Sierra de Baza (South Spain): (a) Non-declining natural forests; (b) Declining natural forests (c) Non-declining plantations; (b) Declining plantations. The vertical lines correspond to marker droughts years 1990–1995, 1999, 2005, 2012 (dashed lines). Figure S2. Pearson correlation coefficients obtained by comparing radial growth (ring-width indices) and monthly climatic data (Tmax: Mean maximum temperature; Tmin: Mean minimum temperature, 1954–2016) for non-declining (black bars) and declining (grey bars) Pinus pinaster in natural stands (upper plots) and in planted stands (lower plots). Monthly climatic data from previous year is abbreviated by lower case letter and from current year by capital letter, where the current year is the year of tree-ring formation. Bars with asterisks are significant values (p < 0.05).

Author Contributions

R.M.N.-C. and J.D.-L. planned and designed the research. R.M.N.-C., C.R.-V., J.D.-L, A.H. and G.P.-R. conducted fieldwork and performed dendrochronological experiments. R.M.N.-C., C.R.-V., G.P.-R. and J.J.C. contributed to data elaboration and analysis. R.M.N.-C., C.R.-V., G.P.-R. and J.J.C. wrote the manuscript, with contributions by all authors.

Acknowledgments

This project was funded through the INIA-RTA (RTA2014-00005-00-00) and ESPECTRAMED (CGL2017-86161-R) projects. We also acknowledge the financial and institutional support of the University of Cordoba-Campus de Excelencia CEIA3. We thank the “Consejería de Medioambiente y Ordenación del Territorio” (Junta de Andalucía), the “RED SEDA NETWORK” and “REDIAM” (Junta de Andalucía) for providing field work and data support. We also thank Javier Cobos for his valuable comments at the beginning of this work, and Francisco Javier Ruíz Gómez, Rafael Sánchez de la Cuesta, the ERSAF group and, particularly, the staff of the Dendrochronology, Silviculture and Climate Change Laboratory at Cordoba University, for their assistance during this research.

Conflicts of Interest

The authors declare no conflicts of interest.

References

  1. IPCC. Climate Change 2013: The Physical Science Basis. Contribution of Working Group I to the Fifth Assessment Report of the Intergovernmental Panel on Climate Change; Stocker, T.F., Qin, D., Plattner, G.-K., Tignor, M., Allen, S.K., Boschung, J., Nauels, A., Xia, Y., Bex, V., Midgley, P.M., Eds.; Cambridge University Press: Cambridge, UK; New York, NY, USA, 2013.
  2. Allen, C.D.; Macalady, A.K.; Chenchouni, H.; Bachelet, D.; McDowell, N.; Vennetier, M.; Kitzberger, T.; Rigling, A.; Breshears, D.D.; Hogg, E.H.; et al. A global overview of drought and heat-induced tree mortality reveals emerging climate change risks for forests. For. Ecol. Manag. 2010, 259, 660–684. [Google Scholar] [CrossRef]
  3. Sánchez-Salguero, R.; Navarro-Cerrillo, R.M.; Swetnam, T.W.; Zavala, M.A. Is drought the main decline factor at the rear edge of Europe? The case of southern Iberian pine plantations. For. Ecol. Manag. 2012, 271, 158–169. [Google Scholar] [CrossRef]
  4. Sánchez-Salguero, R.; Navarro-Cerrillo, R.M.; Camarero, J.J.; Fernández-Cancio, Á. Selective drought-induced decline of pine species in southeastern Spain. Clim. Chang. 2012, 113, 767–785. [Google Scholar] [CrossRef]
  5. Zhu, J.J.; Fan, Z.P.; Zeng, D.H.; Jiang, F.Q.; Matsuzaki, T. Comparison of stand structure and growth between artificial and naturally regenerated forests of Pinus sylvestiris var. mongolica on sandy land. J. For. Res. 2003, 14, 103–111. [Google Scholar] [CrossRef]
  6. Song, L.; Li, M.; Zhu, J.; Zhang, J. Comparisons of radial growth and tree-ring cellulose δ13C for Pinus sylvestris var. mongolica in naturally regenerated and plantation forests on sandy lands. J. For. Res. 2017, 22, 160–168. [Google Scholar] [CrossRef]
  7. FAO Global Forest Resources Assessment 2010; FAO: Rome, Italy, 2010.
  8. Navarro Cerrillo, R.M.; Varo, M.A.; Lanjeri, S.; Hernandez Clemente, R. Cartografía de defoliación en los pinares de pino silvestre (Pinus sylvestris L.) y pino salgareño (Pinus nigra Arnold.) en la Sierra de los Filabres. Rev. Ecosistemas 2007, 16. [Google Scholar] [CrossRef]
  9. Dorman, M.; Perevolotsky, A.; Sarris, D.; Svoray, T. The effect of rainfall and competition intensity on forest response to drought: Lessons learned from a dry extreme. Oecologia 2015, 177, 1025–1038. [Google Scholar] [CrossRef] [PubMed]
  10. De la Serrana, R.G.; Vilagrosa, A.; Alloza, J.A. Pine mortality in southeast Spain after an extreme dry and warm year: Interactions among drought stress, carbohydrates and bark beetle attack. Trees 2015, 29, 1791–1804. [Google Scholar] [CrossRef]
  11. Andreu, L.; Gutiérrez, E.; Macias, M.; Ribas, M.; Bosch, O.; Camarero, J.J. Climate increases regional tree-growth variability in Iberian pine forests. Glob. Chang. Biol. 2007, 13, 804–815. [Google Scholar] [CrossRef]
  12. Pasho, E.; Camarero, J.J.; de Luis, M.; Vicente-Serrano, S.M. Impacts of drought at different time scales on forest growth across a wide climatic gradient in north-eastern Spain. Agric. For. Meteorol. 2011, 151, 1800–1811. [Google Scholar] [CrossRef]
  13. Christopoulou, A.; Fulé, P.Z.; Andriopoulos, P.; Sarris, D.; Arianoutsou, M. Dendrochronology-based fire history of Pinus nigra forests in Mount Taygetos, Southern Greece. For. Ecol. Manag. 2013, 293, 132–139. [Google Scholar] [CrossRef]
  14. De Luis, M.; Čufar, K.; Filippo, A.D.; Novak, K.; Papadopoulos, A.; Piovesan, G.; Rathgeber, C.B.K.; Raventós, J.; Saz, M.A.; Smith, K.T. Plasticity in Dendroclimatic Response across the Distribution Range of Aleppo Pine (Pinus halepensis). PLoS ONE 2013, 8, e83550. [Google Scholar] [CrossRef] [PubMed]
  15. Camarero, J.J.; Manzanedo, R.D.; Sanchez-Salguero, R.; Navarro-Cerrillo, R.M. Growth response to climate and drought change along an aridity gradient in the southernmost Pinus nigra relict forests. Ann. For. Sci. 2013, 70, 769–780. [Google Scholar] [CrossRef]
  16. Carnicer, J.; Coll, M.; Ninyerola, M.; Pons, X.; Sánchez, G.; Peñuelas, J. Widespread crown condition decline, food web disruption, and amplified tree mortality with increased climate change-type drought. Proc. Natl. Acad. Sci. USA 2011, 108, 1474–1478. [Google Scholar] [CrossRef] [PubMed] [Green Version]
  17. Sánchez-Salguero, R.; Navarro, R.M.; Camarero, J.J.; Fernández-Cancio, Á. Drought-induced growth decline of Aleppo and maritime pine forests in south-eastern Spain. For. Syst. 2010, 19, 458–470. [Google Scholar] [CrossRef]
  18. Herguido, E.; Granda, E.; Benavides, R.; García-Cervigón, A.I.; Camarero, J.J.; Valladares, F. Contrasting growth and mortality responses to climate warming of two pine species in a continental Mediterranean ecosystem. For. Ecol. Manag. 2016, 363, 149–158. [Google Scholar] [CrossRef] [Green Version]
  19. Hereş, A.-M.; Martínez-Vilalta, J.; López, B.C. Growth patterns in relation to drought-induced mortality at two Scots pine (Pinus sylvestris L.) sites in NE Iberian Peninsula. Trees 2012, 26, 621–630. [Google Scholar] [CrossRef]
  20. Bravo-Oviedo, A.; Sterba, H.; del Río, M.; Bravo, F. Competition-induced mortality for Mediterranean Pinus pinaster Ait. and P. sylvestris L. For. Ecol. Manag. 2006, 222, 88–98. [Google Scholar] [CrossRef]
  21. McDowell, N.G.; Beerling, D.J.; Breshears, D.D.; Fisher, R.A.; Raffa, K.F.; Stitt, M. The interdependence of mechanisms underlying climate-driven vegetation mortality. Trends Ecol. Evol. 2011, 26, 523–532. [Google Scholar] [CrossRef] [PubMed]
  22. Anderegg, W.R.L.; Kane, J.M.; Anderegg, L.D.L. Consequences of widespread tree mortality triggered by drought and temperature stress. Nat. Clim. Chang. 2013, 3, 30–36. [Google Scholar] [CrossRef]
  23. Galiano, L.; Martínez-Vilalta, J.; Lloret, F. Carbon reserves and canopy defoliation determine the recovery of Scots pine 4 yr after a drought episode. New Phytol. 2011, 190, 750–759. [Google Scholar] [CrossRef] [PubMed] [Green Version]
  24. Anderegg, W.R.L.; Berry, J.A.; Field, C.B. Linking definitions, mechanisms, and modeling of drought-induced tree death. Trends Plant Sci. 2012, 17, 693–700. [Google Scholar] [CrossRef] [PubMed]
  25. Caminero, L.; Génova, M.; Camarero, J.J.; Sánchez-Salguero, R. Growth responses to climate and drought at the southernmost European limit of Mediterranean Pinus pinaster forests. Dendrochronologia 2018, 48, 20–29. [Google Scholar] [CrossRef]
  26. Corcuera, L.; Gil-Pelegrín, E.; Notivol, E. Differences in hydraulic architecture between mesic and xeric Pinus pinaster populations at the seedling stage. Tree Physiol. 2012, 32, 1442–1457. [Google Scholar] [CrossRef] [PubMed]
  27. Nguyen-Queyrens, A.; Costa, P.; Loustau, D.; Plomion, C. Osmotic adjustment in Pinus pinaster cuttings in response to a soil drying cycle. Ann. For. Sci. 2002, 59, 795–799. [Google Scholar] [CrossRef]
  28. Camarero, J.J.; Gazol, A.; Sangüesa-Barreda, G.; Oliva, J.; Vicente-Serrano, S.M. To die or not to die: Early warnings of tree dieback in response to a severe drought. J. Ecol. 2015, 103, 44–57. [Google Scholar] [CrossRef]
  29. Bogino, S.M.; Bravo, F. Growth response of Pinus pinaster Ait. to climatic variables in central Spanish forests. Ann. For. Sci. 2008, 65, 506. [Google Scholar] [CrossRef]
  30. Smiley, T. An Introduction to Tree-Ring Dating; University of Arizona Press: Tucson, AR, USA, 1968. [Google Scholar]
  31. Grissino-Mayer, H.D. Evaluating Crossdating Accuracy: A Manual and Tutorial for the Computer Program COFECHA. Tree-Ring Res. 2001, 57, 205–221. [Google Scholar]
  32. Fritts, H.C. Tree Rings and Climate; Academic Press: London, UK, 2001. [Google Scholar]
  33. Haylock, M.R.; Hofstra, N.; Klein-Tank, A.; Klok, E.J.; Jones, P.D.; New, M. A European daily high-resolution gridded data set of surface temperature and precipitation for 1950–2006. J. Geophys. Res. Atmos. 2008, 113, D20. [Google Scholar] [CrossRef]
  34. Vicente-Serrano, S.M.; Beguería, S.; López-Moreno, J.I. A Multiscalar Drought Index Sensitive to Global Warming: The Standardized Precipitation Evapotranspiration Index. J. Clim. 2009, 23, 1696–1718. [Google Scholar] [CrossRef]
  35. Lloret, F.; Keeling, E.G.; Sala, A. Components of tree resilience: effects of successive low-growth episodes in old ponderosa pine forests. Oikos 2011, 120, 1909–1920. [Google Scholar] [CrossRef]
  36. Anderegg, W.R.L.; Hicke, J.A.; Fisher, R.A.; Allen, C.D.; Aukema, J.; Bentz, B.; Hood, S.; Lichstein, J.W.; Macalady, A.K.; McDowell, N.; et al. Tree mortality from drought, insects, and their interactions in a changing climate. New Phytol. 2015, 208, 674–683. [Google Scholar] [CrossRef] [PubMed] [Green Version]
  37. Richter, K.; Eckstein, D.; Holmes, R.L. The Dendrochronological Signal of Pine Trees (Pinus spp.) in Spain. Tree-Ring Bull. 1991, 51, 1–13. [Google Scholar]
  38. Sokal, R.R.; Rohlf, F.J. Biometry: The Principles and Practice of Statistics; W.H. Free Company: New York, NY, USA, 1995. [Google Scholar]
  39. Zang, C.; Biondi, F. Dendroclimatic calibration in R: The bootRes package for response and correlation function analysis. Dendrochronologia 2013, 31, 68–74. [Google Scholar] [CrossRef]
  40. R Development Core Team. A Language and Environment for Statistical Computing; R Foundation for Statistical Computing: Vienna, Austria, 2014. [Google Scholar]
  41. Gandullo, J.M.; Sánchez Palomares, O. Estaciones Ecológicas de los Pinares Españoles; ICONA: Madrid, Spain, 1994. [Google Scholar]
  42. Chung, D.; Chun, H.; Keles, S. An Introduction to the ‘spls’ Package; Version 1.0; R Foundation for Statistical Computing: Vienna, Austria, 2012. [Google Scholar]
  43. Hair, J.F.; Ringle, C.M.; Sarstedt, M. Editorial-Partial Least Squares: The Better Approach to Structural Equation Modeling? Long Range Plan. 2012, 45, 312–319. [Google Scholar] [CrossRef]
  44. Adams, H.D.; Guardiola-Claramonte, M.; Barron-Gafford, G.A.; Villegas, J.C.; Breshears, D.D.; Zou, C.B.; Troch, P.A.; Huxman, T.E. Temperature sensitivity of drought-induced tree mortality portends increased regional die-off under global-change-type drought. Proc. Natl. Acad. Sci. USA 2009, 106, 7063–7066. [Google Scholar] [CrossRef] [PubMed] [Green Version]
  45. Vieira, J.; Campelo, F.; Nabais, C. Age-dependent responses of tree-ring growth and intra-annual density fluctuations of Pinus pinaster to Mediterranean climate. Trees 2009, 23, 257–265. [Google Scholar] [CrossRef]
  46. Rozas, V.; García-González, I.; Zas, R. Climatic control of intra-annual wood density fluctuations of Pinus pinaster in NW Spain. Trees 2011, 25, 443–453. [Google Scholar] [CrossRef] [Green Version]
  47. Candel-Pérez, D.; Linares, J.C.; Viñegla, B.; Lucas-Borja, M.E. Assessing climate–growth relationships under contrasting stands of co-occurring Iberian pines along an altitudinal gradient. For. Ecol. Manag. 2012, 274, 48–57. [Google Scholar] [CrossRef]
  48. Campelo, F.; Vieira, J.; Nabais, C. Tree-ring growth and intra-annual density fluctuations of Pinus pinaster responses to climate: Does size matter? Trees 2013, 27, 763–772. [Google Scholar] [CrossRef]
  49. Génova, M.; Caminero, L.; Dochao, J. Resin tapping in Pinus pinaster: Effects on growth and response function to climate. Eur. J. For. Res. 2014, 133, 323–333. [Google Scholar] [CrossRef]
  50. Kurz-Besson, C.B.; Lousada, J.L.; Gaspar, M.J.; Correia, I.E.; David, T.S.; Soares, P.M.M.; Cardoso, R.M.; Russo, A.; Varino, F.; Mériaux, C.; et al. Effects of Recent Minimum Temperature and Water Deficit Increases on Pinus pinaster Radial Growth and Wood Density in Southern Portugal. Front. Plant Sci. 2016, 7, 1170. [Google Scholar] [CrossRef] [PubMed]
  51. Ruiz Sinoga, J.D.; Garcia Marin, R.; Martinez Murillo, J.F.; Gabarron Galeote, M.A. Precipitation dynamics in southern Spain: trends and cycles. Int. J. Climatol. 2011, 31, 2281–2289. [Google Scholar] [CrossRef]
  52. Spinoni, J.; Naumann, G.; Vogt, J.V.; Barbosa, P. The biggest drought events in Europe from 1950 to 2012. J. Hydrol. Reg. Stud. 2015, 3, 509–524. [Google Scholar] [CrossRef]
  53. Sánchez-Salguero, R.; Camarero, J.J.; Dobbertin, M.; Fernández-Cancio, Á.; Vilà-Cabrera, A.; Manzanedo, R.D.; Zavala, M.A.; Navarro-Cerrillo, R.M. Contrasting vulnerability and resilience to drought-induced decline of densely planted vs. naturally regenerated rear-edge Pinus nigra forests. For. Ecol. Manag. 2013, 310, 956–967. [Google Scholar] [CrossRef]
  54. Gea-Izquierdo, G.; Viguera, B.; Cabrera, M.; Cañellas, I. Drought induced decline could portend widespread pine mortality at the xeric ecotone in managed mediterranean pine-oak woodlands. For. Ecol. Manag. 2014, 320, 70–82. [Google Scholar] [CrossRef]
  55. Tyree, M.T.; Davis, S.D.; Cochard, H. Biophysical Perspectives of Xylem Evolution: Is there a Tradeoff of Hydraulic Efficiency for Vulnerability to Dysfunction? IAWA J. 1994, 15, 335–360. [Google Scholar] [CrossRef]
  56. Martínez-Vilalta, J.; López, B.C.; Loepfe, L.; Lloret, F. Stand- and tree-level determinants of the drought response of Scots pine radial growth. Oecologia 2012, 168, 877–888. [Google Scholar] [CrossRef] [PubMed]
  57. Correia, I.; Almeida, M.H.; Aguiar, A.; Alía, R.; David, T.S.; Pereira, J.S. Variations in growth, survival and carbon isotope composition (δ13C) among Pinus pinaster populations of different geographic origins. Tree Physiol. 2008, 28, 1545–1552. [Google Scholar] [CrossRef] [PubMed]
  58. Prieto-Recio, C.; Martín-García, J.; Bravo, F.; Diez, J.J. Unravelling the associations between climate, soil properties and forest management in Pinus pinaster decline in the Iberian Peninsula. For. Ecol. Manag. 2015, 356, 74–83. [Google Scholar] [CrossRef]
  59. Di Matteo, G.; Voltas, J. Multienvironment Evaluation of Pinus pinaster Provenances: Evidence of Genetic Trade-Offs between Adaptation to Optimal Conditions and Resistance to the Maritime Pine Bast Scale (Matsucoccus feytaudi). For. Sci. 2016, 62, 553–563. [Google Scholar] [CrossRef]
  60. Shanahan, E.; Irvine, K.M.; Thoma, D.; Wilmoth, S.; Ray, A.; Legg, K.; Shovic, H. Whitebark pine mortality related to white pine blister rust, mountain pine beetle outbreak, and water availability. Ecosphere 2016, 7, e01610. [Google Scholar] [CrossRef]
  61. Löf, M.; Dey, D.C.; Navarro, R.M.; Jacobs, D.F. Mechanical site preparation for forest restoration. New For. 2012, 43, 825–848. [Google Scholar] [CrossRef]
  62. Rueda, B.; Rodriguez-Alleres, M.; Varela Tejero, E. Environmental Factors Governing Soil Water Repellency Dynamics in a Pinus Pinaster Plantation in NW Spain. Land Degrad. Dev. 2015, 27, 719–728. [Google Scholar] [CrossRef]
  63. Cerrillo, R.M.N.; Rumbaó, I.C.; Vidaña, A.L.; Pérez, J.L.Q.; Duque-Lazo, J. Integración de datos de inventario y modelos de hábitat para predecir la regeneración de especies leñosas mediterráneas en repoblaciones forestales. Rev. Ecosistemas 2016, 25, 6–21. [Google Scholar] [CrossRef]
Figure 1. (a) Site locations in Sierra de Baza naturally regenerated Park (Granada, Andalusia, southeastern Spain) showing the distribution of Pinus pinaster in the western Mediterranean Basin and sampled plots corresponding to naturally regenerated forests (triangles) and forest plantations (circles); Climate trends considering (b) mean annual temperature, spring precipitation and (c) the July Standardized Precipitation Evapotranspiration Index (SPEI) calculated at 12-month-long scales for the 1950–2016 period. The displayed statistics (r2, p) correspond to annual mean temperature (a = −24.3143 + 0.0192·b) and the SPEI (a = 36.6379 − 0.0185·b).
Forests 09 00358 g001aForests 09 00358 g001b
Figure 2. Basal area increments of non-declining ((a,c)) and declining ((b,d)) Pinus pinaster trees sampled in naturally regenerated forests ((a,b)) or plantations ((c,d)). The grey and black lines show individual and mean values, respectively. The vertical dashed lines correspond to the 1990–1995, 1999, 2005 and 2012 droughts (see Figure 1b).
Forests 09 00358 g002
Figure 3. Pearson correlation coefficients obtained by comparing radial growth (ring-width indices) and monthly climatic data (a), Tm: mean temperature; P: precipitation) (b) drought SPEI index, SPEI 6 and SPEI12 correspond to the SPEI calculated at 6- and 12-month-long scales, respectively) for non-declining (black bars) and declining (gray bars) Pinus pinaster individuals from naturally regenerated (upper plots) and planted stands (lower plots). Monthly climatic variables from the previous and current years are abbreviated by lower and upper-case letters, respectively. Dashed lines are significant values (p < 0.05). Correlations were calculated for the common period 1975–2016.
Forests 09 00358 g003
Figure 4. (a) Resistance (CRT), (b) resilience (CRC), and (c) recovery (CS) growth indices calculated for non-declining (ND trees, black bars) and declining (D trees, gray bars) Pinus pinaster trees in naturally regenerated (left column) and planted (right column) stands, considering four droughts (1994–1995, 1999, 2005 and 2012). Dashed and dotted lines indicate trends, considering all droughts (x axes) for ND and D trees, respectively. Asterisks indicate significant differences between ND and D trees based on Student’s t test, *** p < 0.0001; ** p < 0.001; * p < 0.01 level. The displayed statistics (P) refer to significant (p < 0.05) trends. Values are means ± SD. See Table 3.
Forests 09 00358 g004
Figure 5. Weights plot of Partial Least-Squares regression (PLS). (a) Pearson correlation coefficients (r). Black lines correspond to response variables (resilience indices calculated for the 1995, 1999, 2005 and 2012 droughts) and light gray lines correspond to predictors; (b) Scores of each case in the projected observation matrix (T). Predictors (abbreviation): winter precipitation (pin), autumn precipitation (po), percent base saturation (psb), evapotranspiration (eto), maximum temperature of warmest month (tmaxc), annual radiation (rn), water retention capacity (crad), aspect (t_expo), slope (t_pend), and active limestone (ca). See Table 1 for the stand descriptions and Table S1 (Supplementary Material) for the variables’ abbreviations.
Forests 09 00358 g005
Table 1. Topographical and silvicultural characteristics of the four Pinus pinaster study stands and trees. Values are ranges (slope) or means ± SE.
Stand TypeTree Vigor ClassSite CodeElevation (m)Slope (%)Basal Area (m2 ha−1)Diameter at 1.3 m (cm)Height (m)
Forest (naturally regenerated stand)Non-declining treesF-ND143030–4022.529.7 ± 0.68.3 ± 0.9
Declining treesF-D130020–3019.522.9 ± 0.86.4 ± 0.4
Planted standNon-declining treesP-ND138020–3024.024.07 ± 0.77.9 ± 0.3
P-ND150520-3022.523.76 ± 0.68.3± 0.3
Declining treesP-D128610–2021.022.84± 0.56.2 ± 0.2
P-D134010–2023.520.78± 0.66.4 ± 0.2
P-D133820-3022.021.01± 0.68.8 ± 0.3
P-D125610–2022.524.34± 0.77.7 ± 0.3
P-D123120-3020.024.07± 0.67.1 ± 0.3
Table 2. Dendrochronological statistics of non-declining (ND) and declining (D) Pinus pinaster trees sampled in naturally regenerated and planted stands. Abbreviations: TRW, mean tree-ring width calculated for the common period 1975–2016; BAI20, mean basal area increment in the last 20 years; MS, Mean sensitivity; AC1, first-order autocorrelation. Sites codes are as in Table 1. Values are means ± SE. Different letters indicate significant (p < 0.05) differences within each stand type.
Stand TypeVigor ClassCodeNo. Trees (No. Cores)Age at 1.3 m (years)TimespanTRW (mm)BAI20 (mm2)MSAC1
Naturally regeneratedNDF-ND18 (36)62 ± 31941–20162.04 ± 0.19 b702 ± 46 b0.27 ± 0.010.81 ± 0.01
DF-D18 (30)57 ± 21930–20161.26 ± 0.11 a262 ± 17 a0.30 ± 0.010.76 ± 0.02
PlantedNDP-ND20 (39)39 ± 11970–20162.43 ± 0.30753 ± 72 b0.44 ± 0.010.69 ± 0.01
DP-D20 (40)37 ± 11969–20162.28 ± 0.20578 ± 61 a0.43 ± 0.010.64 ± 0.02
Table 3. Main statistics of the ANOVAs calculated for the resistance (CRT), recovery (CRC) and resilience (CRS) indices and mean growth (BAI20, mean basal area increment calculated for the last 20 years). The ANOVAs compared the three indices for four droughts (1995, 1999, 2005 and 2012) and considering naturally regenerated vs. planted Pinus pinaster stands (factor “stand type”) and non-declining and declining trees (factor “decline”). In each cell, the upper line is the F statistic and the lower line is its significance level (p). The last column shows the comparison of the BAI20 values (see also Table 2). Bold statistics correspond to significant F values (p < 0.05).
Factor1995 Drought1999 Drought2005 Drought2012 DroughtBAI20
CRTCRCCRSCRTCRCCRSCRTCRCCRSCRTCRCCRS
Stand type (S)24.07030.060.280.2015.6415.486.540.153.39112.1140.188.050.56
<0.001<0.010.600.63<0.01<0.010.030.690.07<0.01<0.010.010.46
Decline (D)0.5414.262.629.398.010.4411.150.028.5114.0221.572.87101.43
0.44<0.010.110.010.010.510.010.870.01<0.01<0.010.09<0.01
S*D3.707.180.0220.8336.990.029.451.122.130.0114.028.2436.81
0.060.010.97<0.01<0.010.890.020.290.150.91<0.010.01<0.01

