Article

Plant-Soil Properties Associated with Nitrogen Mineralization: Effect of Conversion of Natural Secondary Forests to Larch Plantations in a Headwater Catchment in Northeast China

1
College of Resources and Environment, Hunan Agricultural University, No. 1 Nongda Road, Changsha 410128, China
2
Institute of Eco-environmental Sciences, Liaoning Shihua University, No.1 Dandong West Road, Fushun 113001, China
*
Author to whom correspondence should be addressed.
Forests 2018, 9(7), 386; https://doi.org/10.3390/f9070386
Submission received: 8 May 2018 / Revised: 22 June 2018 / Accepted: 25 June 2018 / Published: 28 June 2018
(This article belongs to the Special Issue Carbon and Nitrogen in Forest Ecosystems—Series I)

Abstract

:
To understand the relative importance of plant community composition and plant-induced soil properties on N transformations, the soil N mineralization, ammonification and nitrification characteristics of natural secondary forests (Quercus mongolica-Juglans mandshurica forest: QJF, and Quercus mongolica-Populus davidiana forest: QPF) and the adjacent larch plantations (Larix kaempferi forest: LF1 and LF2) were studied during the growing season. All of the forest types showed seasonal dynamics of N mineralization rates. The total cumulative N mineralization was significantly higher in QPF (73.51 kg hm−2) than in LF1 (65.64 kg hm−2) and LF2 (67.51 kg hm−2) (p < 0.05). The total cumulative nitrification from May to November was significantly higher in QJF (65.16 kg hm−2) and QPF (64.87 kg hm−2) than in LF1 (52.62 kg hm−2) and FL2 (54.17 kg hm−2) (p < 0.05). Based on the variation partitioning, independent soil properties were the primary determinants of the N transformations (13.5%). Independent climate conditions explained 5.6% of the variations, while plant variations explained 3.2% of the variations in N transformations. We concluded that different forest types with various plant community compositions have different influences on the litterfall quantity and quality and the nutrient availability, and these differences interact with seasonal climate conditions that in turn drive the differences in N mineralization.

1. Introduction

Nitrogen (N) is an essential element for the growth of organisms and the productivity of forest ecosystems [1]. In headwater catchments, soil N mineralization of organic matter plays an important role in determining soil N availability, primary productivity and N losses from soil to stream, thus contributing to ground water contamination and the pollution of the water environment [1,2,3,4]. Factors affecting the temporal and spatial patterns of soil N dynamics have been well documented [5,6,7]. Numerous previous studies and practices have shown that seasonal changes in N mineralization result in patterns with the highest mineralization rates in the summer and the lowest rates in the winter, which appears to follow seasonal patterns of temperature and precipitation [8,9,10,11]. Soil temperature, moisture, and precipitation patterns are important drivers of soil N transformations, and each of these seasonal climate conditions may have different impacts on various forest types [12]. Forest types with varying plant communities may have different influences on the N cycle due to differences in the physiology, morphology, nutrient requirements, and life histories of various plant species [13,14,15]. There are several approaches of studying the N mineralization for different forest types, but they generally do not consider plant community compositions and species diversity. Conversion of natural forests to plantations often leads to considerable losses of plant species and consequently a reduction in the diversity of litter species compositions and the amount of litter production, which affects soil nutrient availability and N transformation [16]. Larch (Larix kaempferi) plantations are the most widespread forests in northeastern China, but their ecological impacts receive little attention. Therefore, understanding the mechanisms underlying the effects of natural forests converted into plantations on N mineralization of organic matter in headwater catchments is useful for forest management and structure regulation, and can thus help minimize N exports to aquatic ecosystems.
There are three dominant processes between plant communities and soil properties that could explain the mechanisms underlying the effects of natural forests converted into plantations on N mineralization of organic matter. First, changes in plant community composition could influence soil N mineralization via affecting soil nutrient availability, e.g., total nitrogen (TN), soil organic carbon (SOC), C:N ratio, and dissolved organic carbon (DOC), since tree species exhibit differences in the quality of plant material and chemical compounds which significantly affect organic matter input and decomposition. Grime (1998) found that a community dominated by plants with high nitrogen concentrations would likely have positive effects on N mineralization rates [17]. Second, productivity could also influence N mineralization because approximately 50–60% of plant-assimilated N in deciduous forest is annually returned to the soil via litterfall [18]. Denton (1999) and Mikola (2000) found that greater inputs of plant material could increase N mineralization rates because soil microbial biomass and activity have been shown to respond to increased nitrogen and carbon resources [19,20]. Third, plant diversity could also affect N mineralization rates because a more diverse array of plant material entering the soil through leaf litter, fine root production and root turnover could affect N mineralization rates by providing a consistent long-term supply of organic nitrogen as the qualities of plant material decomposed at various rates [21]. These three attributes of the interactions between plant communities and soil processes may simultaneously affect N mineralization. Temperature and precipitation changes are likely to influence N mineralization by altering factors like those discussed above. For example, an increase in temperature can enhance microbial activities and increase the rates of litter decomposition, which, as a result, can change the N mineralization rate. Different plant community compositions have different substrate inputs, soil chemistry and microbial activity, and such differences may contribute unequally to the soil N mineralization; therefore, the N mineralization processes in different forest types are likely to respond differently to seasonal changes in temperature and precipitation.
To understand the relative importance of plant community composition and plant-induced soil property effects of forest conversion on N transformation patterns, organic N mineralization, nitrification and ammonification were investigated in natural secondary forests and the adjacent larch plantations in the headwater catchment of the Taizi River in China. This study aimed to (1) investigate and compare seasonal N mineralization rates under field conditions in natural secondary forests and the adjacent larch plantations; and (2) assess the extent to which N mineralization rates could be explained by the plant-soil properties that are associated with plant community compositions and seasonal climate conditions in temperature and precipitation.

2. Materials and Methods
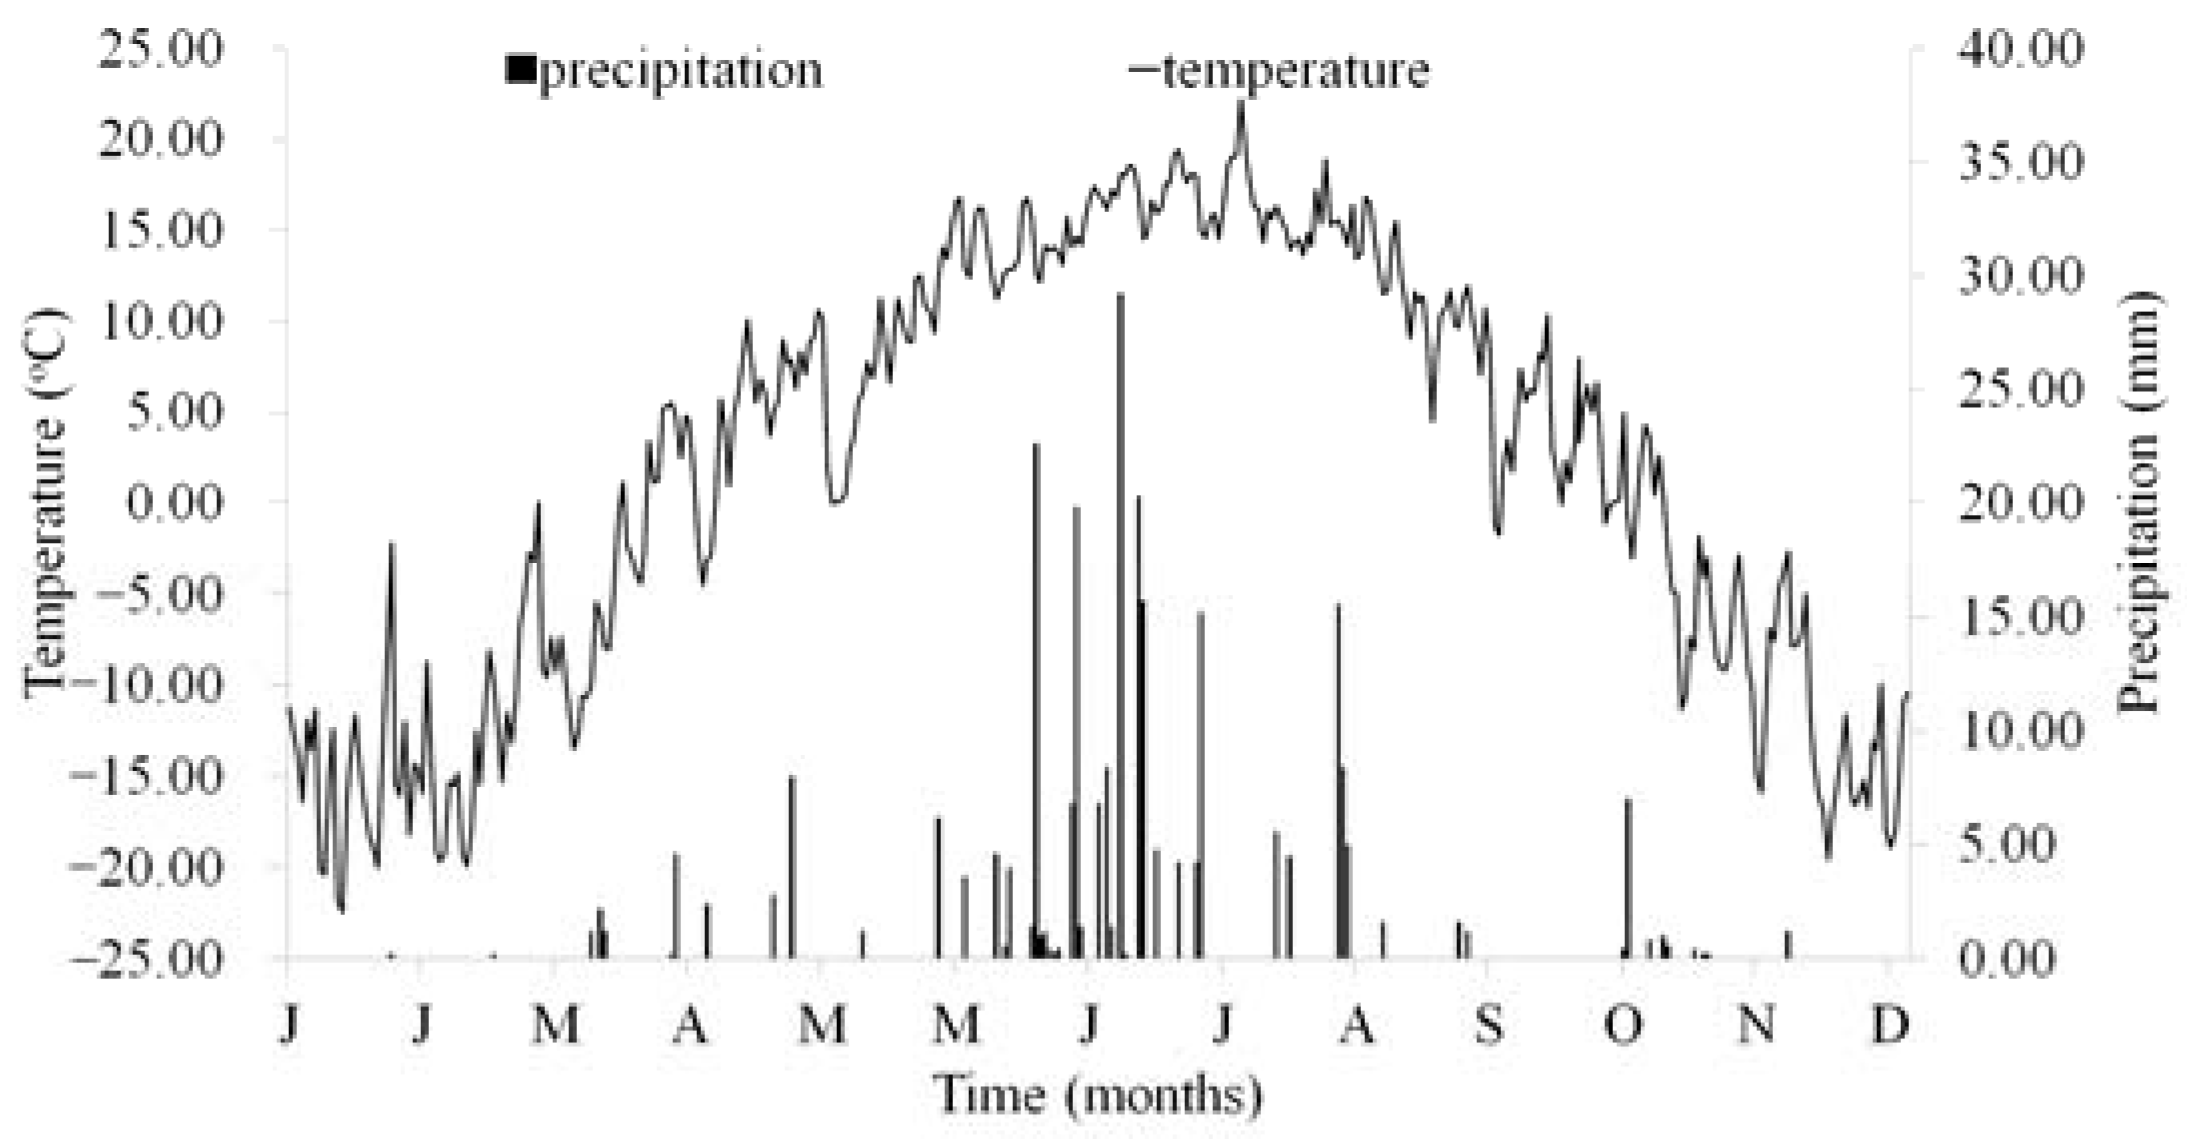
2.1. Study Area

The Laotudingzi National Nature Reserve (124°41′13″–125°05′15″ E; 41°11′11″–41°21′34″ N) is situated in the headwater catchment of the Taizi River in Liaoning Province, China. The area has a temperate monsoon climate, with mean annual temperature of 6.2 °C and a mean annual rainfall of 778 mm, of which 60–65% falls between June and August. During the study period, the temperature and precipitation largely followed this long-term seasonal pattern. Due to the cold weather during the long winter in Northeast China, soil freezing occurred from November to early April. The average growing season is approximately 215 frost-free days. The air temperature and precipitation from January to December 2014 was measured at a weather station close to the experimental site (Figure 1).
The study area had been primarily covered by broadleaf Korean pine forests until the 1930s and thereafter subjected to unregulated timber removal for decades. Massive controlled burns where used in the early 1950s for clearing out the original forest. Since then, the study site has been progressively covered by a naturally regenerated secondary forest. The natural secondary forests consisted of Quercus mongolica, Juglans mandshurica, Populus davidiana, Acer mono Maxim, Phellodendron amurense, Fraxinus mandshurica, Pinus koraiensis, Betula platyphylla and Tilia amurensis. At the beginning of the forest succession, some patches of the natural secondary forests were cleared and replaced by 3-year-old larch (Larix kaempferi) seedlings. The larch plantations contain Larix kaempferi, Phellodendron amurense, Quercus mongolica, Juglans mandshurica and Fraxinus mandshurica.
In this study, two larch plantations sites (LF1 and LF2) and two natural secondary forests (QJF and QPF) were selected. Three independently fixed 20 × 20 m plots were randomly selected at each site. The soil is a typical brown forest soil (classified as Udalfs according to the second edition of USDA soil taxonomy) and with depth 20 to 40 cm. Detailed data on the stands, plots and samples are given in Table 1.

2.2. Variables Assessed

2.2.1. Vegetation Survey

All individual trees ≥1 cm in diameter at breast height (DBH) were tallied and recorded by species name, tree height, DBH and canopy density at each plot. Within each plot three sub-plots of 1 × 1 m were laid for herbs, and the number of species, number of individuals per species and coverage in the three sub-plots were recorded. In each sub-plot, forest floor litter, including leaf litter, senesced branches, and bark were collected. We divided the litter layer into two sub-layers: the L layer (undecomposed litter, consisting of litter with clear recognizable structure lying loosely on the forest floor surface) and the F/H layer (mixture of partly decomposed litters where plant remains are partially decomposed by biological activity but with plant morphology still recognizable and humus without recognizable plant structures and a fine granular morphology) [22]. After litter materials were collected, the above and below ground parts of all herbs were harvested through destructive sampling from these sub-plots. To account for the annual litterfall, three samples were randomly collected in each plot every month using a 0.5 m2 litterfall traps from May to November. Then, all samples were weighed and oven-dried at 65 °C to measure the dry mass and evaporated water content.
The Shannon Weaver Diversity Index was used to measure species diversity [23], and Margalef’s Index was used to estimate species richness [24].
Shannon Weaver Diversity Index (H’):
exp ( H ' ) = i = 1 R p i ln p i
where pi = species proportion, R = total number of species types.
Margalef’s Index (MI):
M I = ( s 1 ) ln N
where S = total number of species, N = total number of individuals.
We estimated the biomass of foliage, branches, stems, roots and total tree using an allometric equation relating each biomass component to the diameter at breast height (DBH), respectively. This allometric equation established by Wang (2006) [25].
log 10 B = a + b ( log 10 D B H )
where B is biomass component, a and b are regression coefficients. The total biomass for trees in each plot was calculated by the biomass of total tree species in the plots.

2.2.2. Soil Sampling and Incubation

The experiment was conducted in May to November 2014 using a modified resin core technique in situ [26,27,28,29], similar to the methods of Raison (1987) [30] and Hübner (1991) [31]. At every experimental site, five sampling points were randomly allocated to the replication plots on the first sampling date of 18 May. After the litter and above-ground vegetation was removed, a PVC tube (12 cm long, 5 cm diameter) sharpened in advance was driven 10 cm into the ground to collect the soil core, which was used to determine the initial NO3-N, NH4+-N and mineral N (NH4+-N and NO3-N) concentrations and other soil properties; another identical tube was driven 12 cm into the ground to confine the soil core, with soil structure undamaged, and then the bottom 2 cm of soil was removed, and a resin bag with 10 g anion and cation exchange resin beads (717# and 732# produced by the Huizhi resin Plant of Shanghai) tied into a nylon stocking was placed in the bottom of the PVC tube. The PVC tube containing the soil core and resin was inserted back into its original position and then incubated in situ for one month. At the end of the incubation period, the soil core and resin were removed to determine NO3-N, NH4+-N and mineral N (NH4+-N and NO3-N) concentrations. This was repeated until the experiment ended on 16 November.

2.2.3. Soil Chemical Properties

The collected tubes and soil samples were stored and extracted within 24 h. The resin bags were washed with distilled water and air-dried. The soil samples were homogenized and sieved through a 2-mm screen. For the determination of the soil mineral N (NH4+-N and NO3-N), the soil was shaken with 2 M KCl for 1 h on a 250-rpm shaking table [32]. For the determination of resin NH4+-N and NO3-N, the resin bags were shaken with 2 M KCl for 12 h on a 250-rpm shaking table and, then the suspension was filtered. The concentrations of NH4+-N and NO3-N in the extracts were determined by colorimetric methods using a segmented flow injection analyser (Skalar Autoanalyzer SAN++, The Netherlands). The soil microbial biomass C (MBC) and soil microbial biomass N (MBN) were determined by a chloroform fumigation-extraction method [33,34]. Extracts from the fumigated and unfumigated soils (25 g fresh soil) were taken with 50 mL 0.5 M L−1 K2SO4 for 30 min and filtered. The organic C and N concentrations in the extracts were measured by a dichromate oxidation method and a K2S2O8 oxidation method, respectively. MBC and MBN were calculated from the differences in the K2SO4-extractable C or N concentration between the fumigated and unfumigated soils divided by the efficiency factors for MBC or MBN (KC = 0.38; KN = 0.45, respectively). K2SO4-extractable DOC value was also used as a proxy for the soil available DOC concentration [35]. The soil samples were air-dried and then used for analyses of the soil pH, TN and SOC. The soil pH was determined with a glass electrode (water:soil = 2.5:1). The SOC was analysed using the H2SO4-K2Cr2O7 oxidation rapid titration method. The TN was measured by the Kjeldahl acid-digestion method. The soil bulk density was measured using the core method. The soil temperature was measured with a thermometer inserted in the soil to a depth of 10 cm.
Nitrogen mineralized was calculated as follows [32]:
N n i t = [ N O 3 N ] s c + [ N O 3 N ] r e s [ N O 3 N ] i n
N a m m = [ N H 4 + N ] s c + [ N H 4 + N ] r e s [ N H 4 + N ] i n
N min = N n i t + N a m m
where Nnit, Namm, and Nmin are the net nitrification, ammonification and N mineralization, respectively; [NO3-N]sc and [NO3-N]in are the mean concentrations of nitrate N in soil core at the end and beginning of each one month incubation period, respectively; [NH4+-N]sc and [NH4+-N]in are the mean concentrations of ammonium N at the end and beginning of incubation period in soil core, respectively; [NO3-N]res and [NH4+-N]res are the mean concentrations of NH4+-N and NO3-N in the resin at the end of the incubation period.

2.3. Statistical Analysis

One way analysis of variance (ANOVA) was performed to test the significance of differences in the forest cover characteristics and soil properties, and the least significant difference values (LSD) were calculated at a significance level of p < 0.05. The N availability and N mineralization data were tested using the repeated measures analysis of variance (RM-ANOVA). The forest types served as between-subject factors, and months were within-subject factors. The Pearson correlation was used to examine the correlations of mineralization rates with the plant community composition. All statistical analyses were performed with SPSS 14.0 (SPSS Inc., Chicago, IL, USA).
Redundancy analysis (RDA) was used to explore the association of N transformations with environmental properties, using the net organic N mineralization, ammonification and nitrification rates as response variables and the environmental factors as explanatory variables. Before the actual analyses, soil N transformations data were analysed using detrended correspondence analysis (DCA) to determine whether linear or unimodal methods would be appropriate in the analyses [36]. As the eigenvalue was 0.111, redundancy analysis (RDA) was applied. We split the environmental dataset into three groups: climate, plant, and soil variables. In order to avoid high multicollinearity in the following analytical steps we removed within-group correlations of |r| > 0.7 (Spearman, p < 0.05) by exclusion of variables. By this procedure, selected variables as well as all uncorrelated variables were included in the final matrices. Climate variables include precipitation and temperature; plant variables include biomass of foliage, stems for trees, litter mass for F+H layer, annual litterfall, H’ for tree layer and H’ for herb layer; soil variables include SOC, DOC, MBC and soil pH. In order to assess the contribution of the three variable groups on N transformation, the variation partitioning method led to the identification of six fractions: independent soil (a), climate (b), plant (c), and joint effects of soil and climate (ab), soil and plant (ac), climate and plant (ac). All multivariate analyses were performed with CANOCO 4.5 [37].

3. Results

3.1. Seasonal Soil Mineral N

NO3-N, NH4+-N and mineral N contents and dynamics are shown in Figure 2. Generally, the NO3-N and mineral N contents in the QJF and QPF plots were higher than those in the LF1 and LF2 plots, and NH4+-N contents in the LF2 plots were higher than the QJF plots (Table 2, Figure 2). The mean NO3-N contents across the month were 8.87, 7.78, 10.73 and 12.46 mg kg−1 in LF1, LF2, QJF and QPF, respectively. The mean NH4+-N contents for the LF1, LF2, QJF and QPF were 5.37, 5.73, 4.01 and 5.25 mg kg−1, respectively, and the mean mineral N contents were 14.1, 13.51, 14.74 and 17.71 mg kg−1, respectively. The concentrations of both mineral N and NO3-N displayed a distinct seasonal pattern, with generally high concentrations in June and July and low concentrations in August and September (Figure 2). In LF1 and LF2 the maximum soil NH4+-N concentration occurred in May, with a second peak value in August. In QJF and QPF, soil NH4+-N concentration was higher in May than other months. The ratio of NO3-N to NH4+-N was approximately 1.79:1 during the growing season, so NO3-N was the dominant form of mineral N.

3.2. Net N Mineralization of Organic Matter

The net nitrification rates were significantly different among the months and forest types, but were not different in forest types × months interaction (Table 2). The net nitrification displayed strong seasonal dynamics, with highest rate during the period from June to July and the lowest rate during the period from October to November in LF2 plots (Table 2, Figure 3). In the LF1, QJF and QPF plots, the highest values of net nitrification were observed in the period from May to June. Furthermore, the net N nitrification rates of the QJF and QPF plots were significantly higher than LF2 plots from May to June, and the QPF plots were significantly higher than LF1 from September to October. The mean net N nitrification rates were 8.77, 9.03, 10.86 and 10.81 mg kg−1 month−1 for LF1, LF2 QJF and QPF, respectively.
The net ammonification rates were significantly different among the months and forest types, and their interactions (Table 2). The net ammonification rate was significantly lower than the rates of nitrification in all of the forest types (p < 0.01, Figure 3). In LF1, LF2 and QPF, the net N ammonification rate significantly increased during the periods of May to August and decreased during August to September. In QJF the net N ammonification rate significantly increased during the periods of May to June and decreased during July to September. The mean net N ammonification rates were 2.17, 1.82, 1.13 and 1.44 mg kg−1 month−1 for LF1, LF2, QJF and QPF, respectively.
The mean net organic N mineralization rates were 10.94, 11.05, 11.25 and 12.25 mg kg−1 month−1 for LF1, LF2, QJF and QPF, respectively. The net N mineralization displayed strong seasonal dynamics; the temporal variations in the net N mineralization rates were similar to those observed for net nitrification, with the highest rates during the period from June to July and the lowest rates during the period from August to September in all the plots (Figure 3). The net N mineralization rates of the LF1, QJF and QPF plots were significantly higher than LF2 plots from May to June, and the LF2 plots were significantly higher than QJF and QPF from July to August, and the LF2 plots were significantly higher than LF1 from September to October.
The total cumulative nitrification from May to November was significantly higher in QJF and QPF than in LF1 and FL2 (p < 0.05, Figure 4a). However, the total cumulative ammonification was lower in QJF and QPF than in LF1 and FL2 (p < 0.05, Figure 4b). The total cumulative organic N mineralization was significantly higher in QPF than in LF1 and FL2 (p < 0.05, Figure 4c), but QJF was not different with other forest types.

3.3. Plant and Soil Properties

Total biomass estimates of trees in LF2, QJF and QPF were statistically higher than LF1 (Table 3, p < 0.05). The biomass recorded in leaves, branches and roots were higher in the QJF than the LF1. The total biomass and below ground biomass for herb layer was not statistically different among forest types (Table 3). Forest floor litter total mass and F+H layer litter mass were highest in the LF2 (p < 0.05), and litter mass in L layer was not statistically different among forest types (Table 3). Annual litterfall mass was higher in the QJF and QPF than the LF1 and LF2 (Table 3, p < 0.05). The H’ and MI were higher in the QJF and QPF than the LF1 and LF2 for tree layer. In herb layer the H’ and MI were higher in QPF than other forest types (Table 3, p < 0.05). The concentrations of SOC were higher in the QJF than the LF2 (Table 4, p < 0.05). The concentrations of TN were higher in the QPF than the LF2 (p < 0.05). The MBC concentrations were higher in QPF and QJF than LF1 and LF2 (Table 4, p < 0.05). The MBC:MBN ratios were higher in QJF than in LF1 and LF2 (Table 4, p < 0.05). The MBN concentrations, C:N ratio, DOC and pH were not statistically different among forest types.

3.4. Relationship of Soil Organic N Mineralization, Ammonification and Nitrification to Climate, Plant and Soil Variables

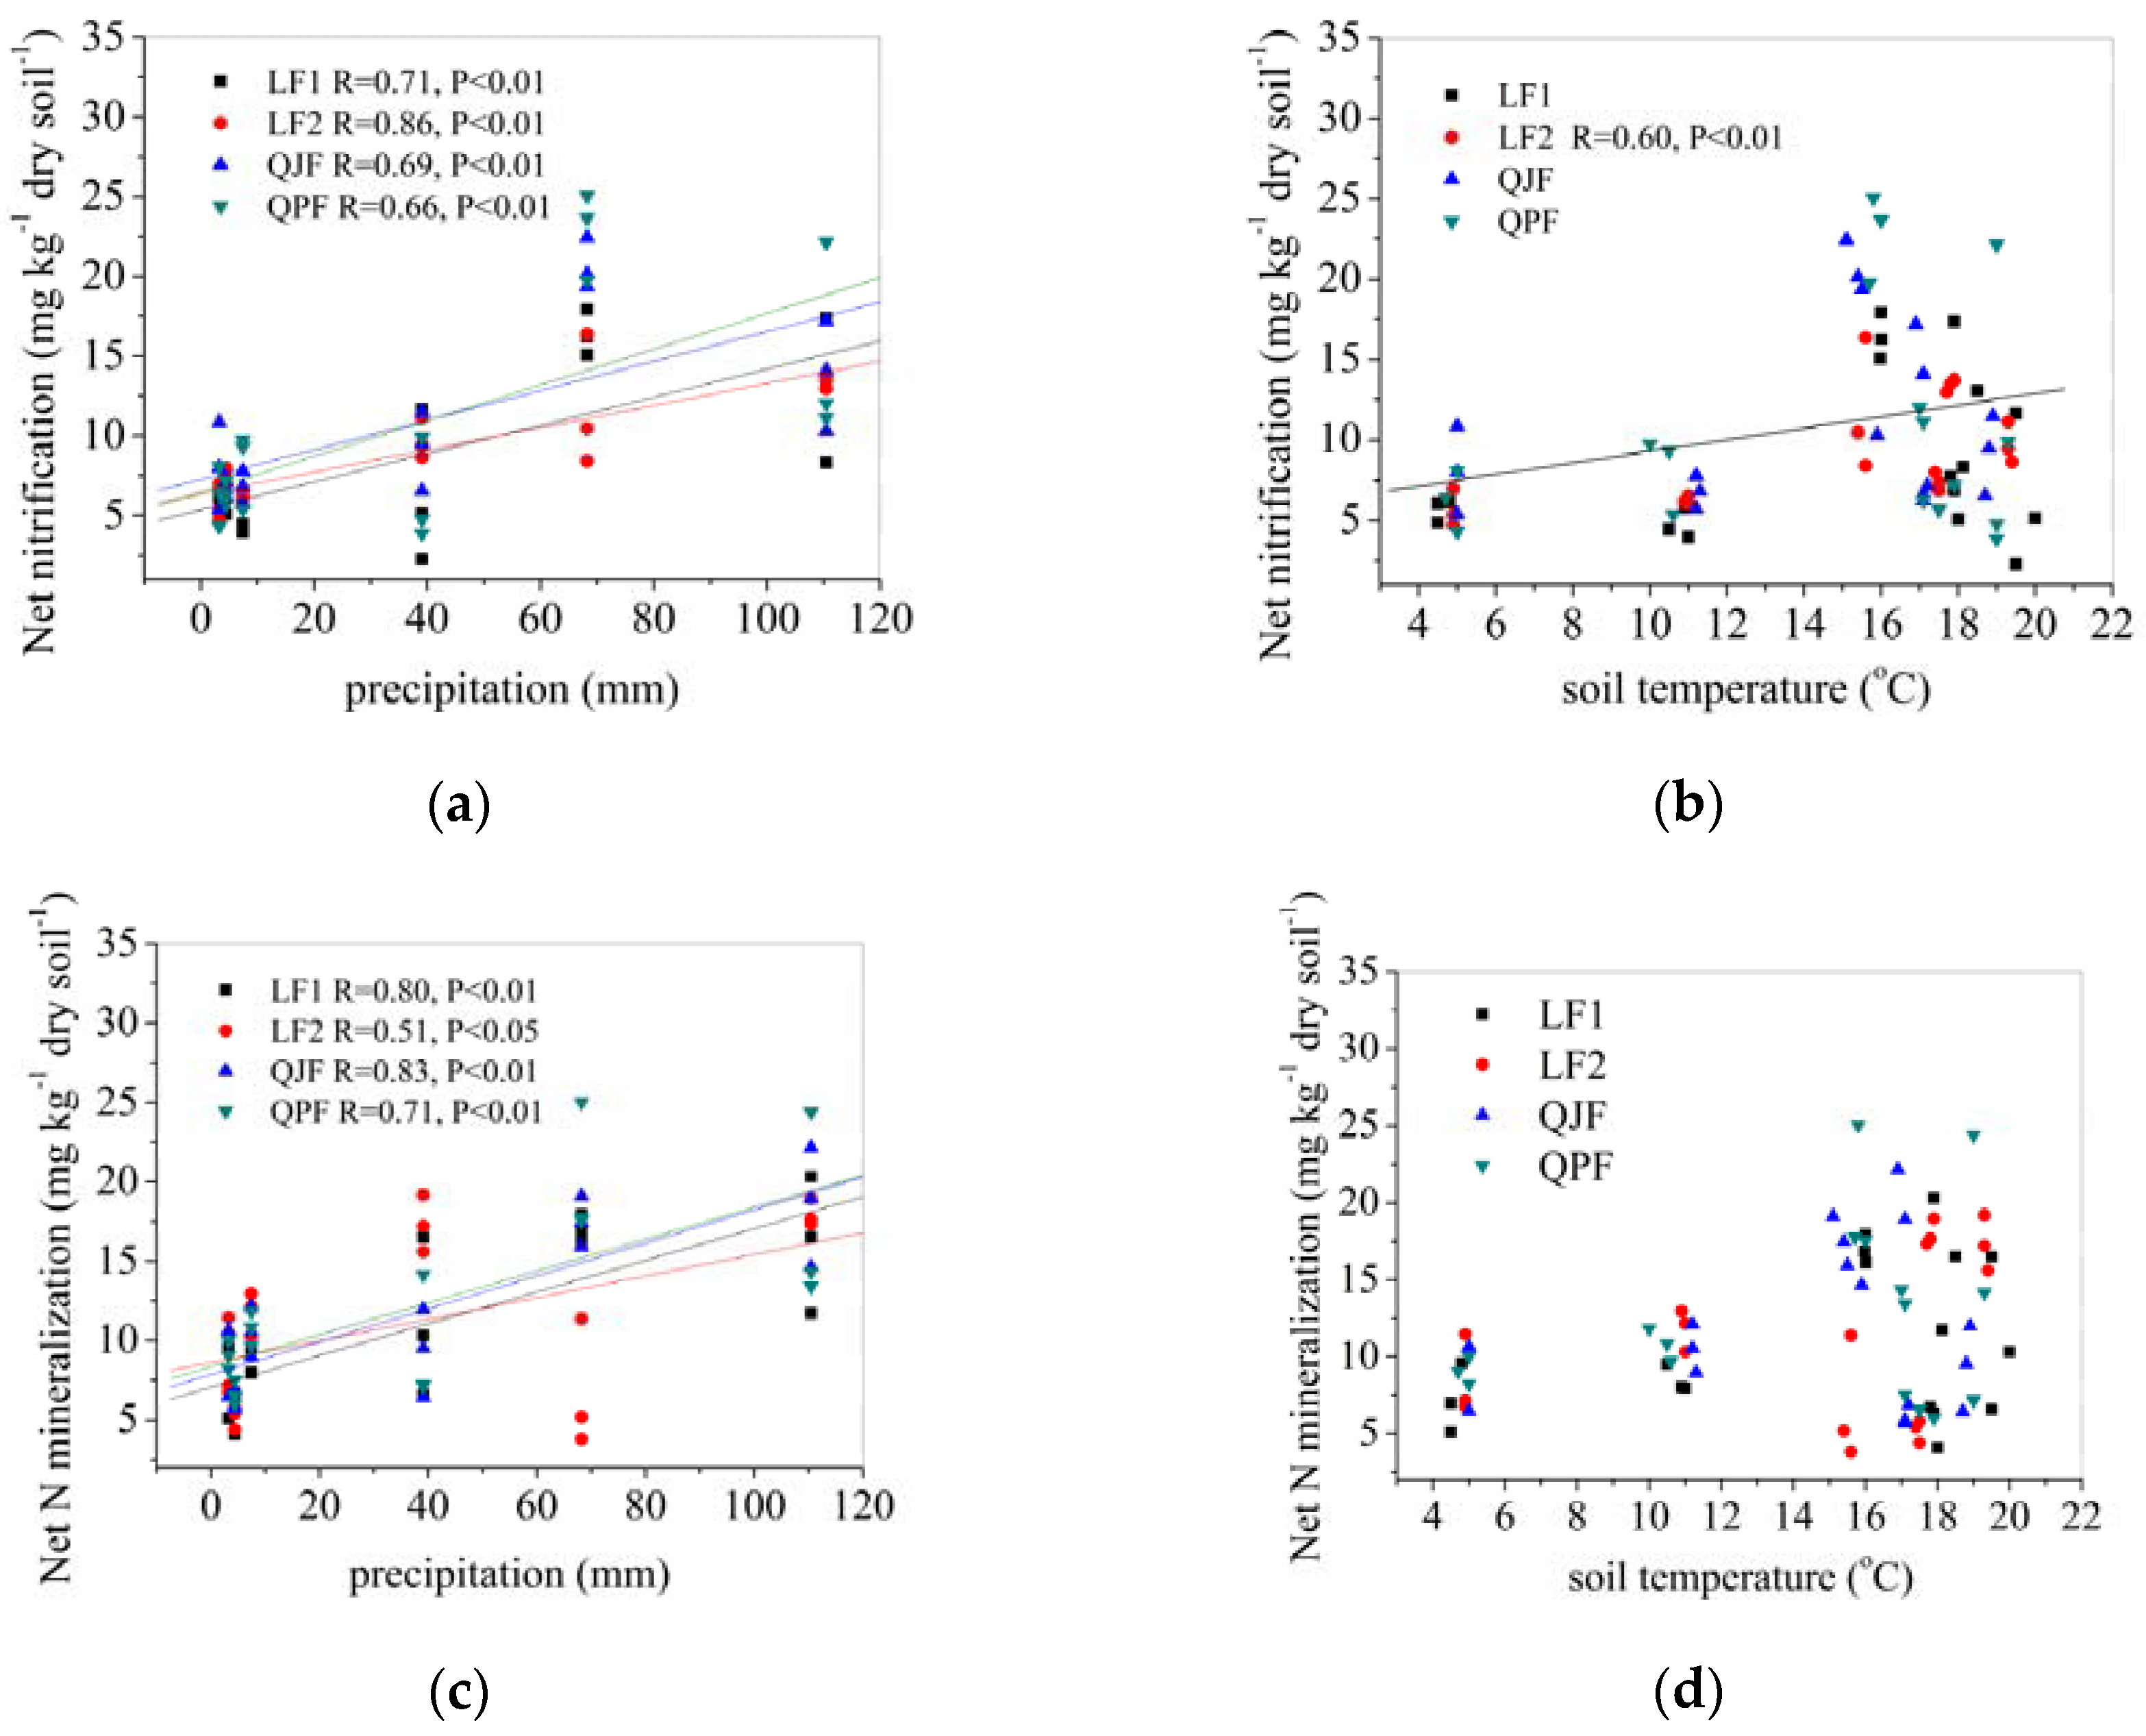
3.4.1. Precipitation and Temperature Effects on Net Organic N Mineralization and Nitrification Rates

The net organic N mineralization and nitrification rates in all of the forest types were positively correlated with the precipitation (Figure 5a,c). The net nitrification rates were significantly and positively correlated with precipitation (Figure 5a, p < 0.01). In addition, the nitrification rates were positively and significantly correlated with the soil temperature in the LF2 (p < 0.01), but not in the LF1, QJF and QPF (Figure 5b). The mineralization rates were significantly and positively correlated with precipitation (Figure 5c, p < 0.01). In contrast, the mineralization rates were not significantly correlated with the soil temperature in any forest (Figure 5d).

3.4.2. Correlations between Soil Properties and Organic N Mineralization, Ammonification and Nitrification

The soil net nitrification rate was significantly and positively correlated with the concentrations of MBC (R = 0.59, p < 0.01), and negatively correlated with soil pH (Figure 6d, R = −0.71, p < 0.01). There was an increasing trend in soil net nitrification rate with SOC (R = 0.41, p < 0.01) and DOC (R = 0.42, p < 0.01) (Figure 6a–d). There was no correlation between the soil net nitrification rate and the TN, MBN and C: N ratio (data not shown). The soil net mineralization rate was significantly and positively correlated with the MBC (Figure 6e, R = 0.51, p < 0.01). The soil net organic mineralization rate was significantly and negatively correlated with soil pH (Figure 6g, R = −0.62, p < 0.01). There was no correlation between the soil net N mineralization and the SOC, TN, MBN and C:N ratio (data not shown).

3.4.3. Relationship between Vegetation Parameters and N Mineralization of Organic Matter

The Pearson correlation was conducted to estimate the relationship between the vegetation parameters and N mineralization of organic matter (Table 5). The results show that soil net nitrification was positively correlated with annual litterfall mass (p < 0.01), total foliage biomass (p < 0.05), branches biomass (p < 0.05), root biomass (p < 0.01), H’ (p < 0.01) and MI (p < 0.01) for tree layer. Net ammonification was negatively correlated with annual litterfall mass (p < 0.01), total foliage biomass (p < 0.05), branches biomass (p < 0.05), H’ (p < 0.05) and MI (p < 0.01) for tree layer. Net organic N mineralization was positively correlated with annual litterfall mass (p < 0.01), total foliage biomass (p < 0.05), H’ (p < 0.01) and MI (p < 0.01) for tree layer and H’ for herb layer (p < 0.05).

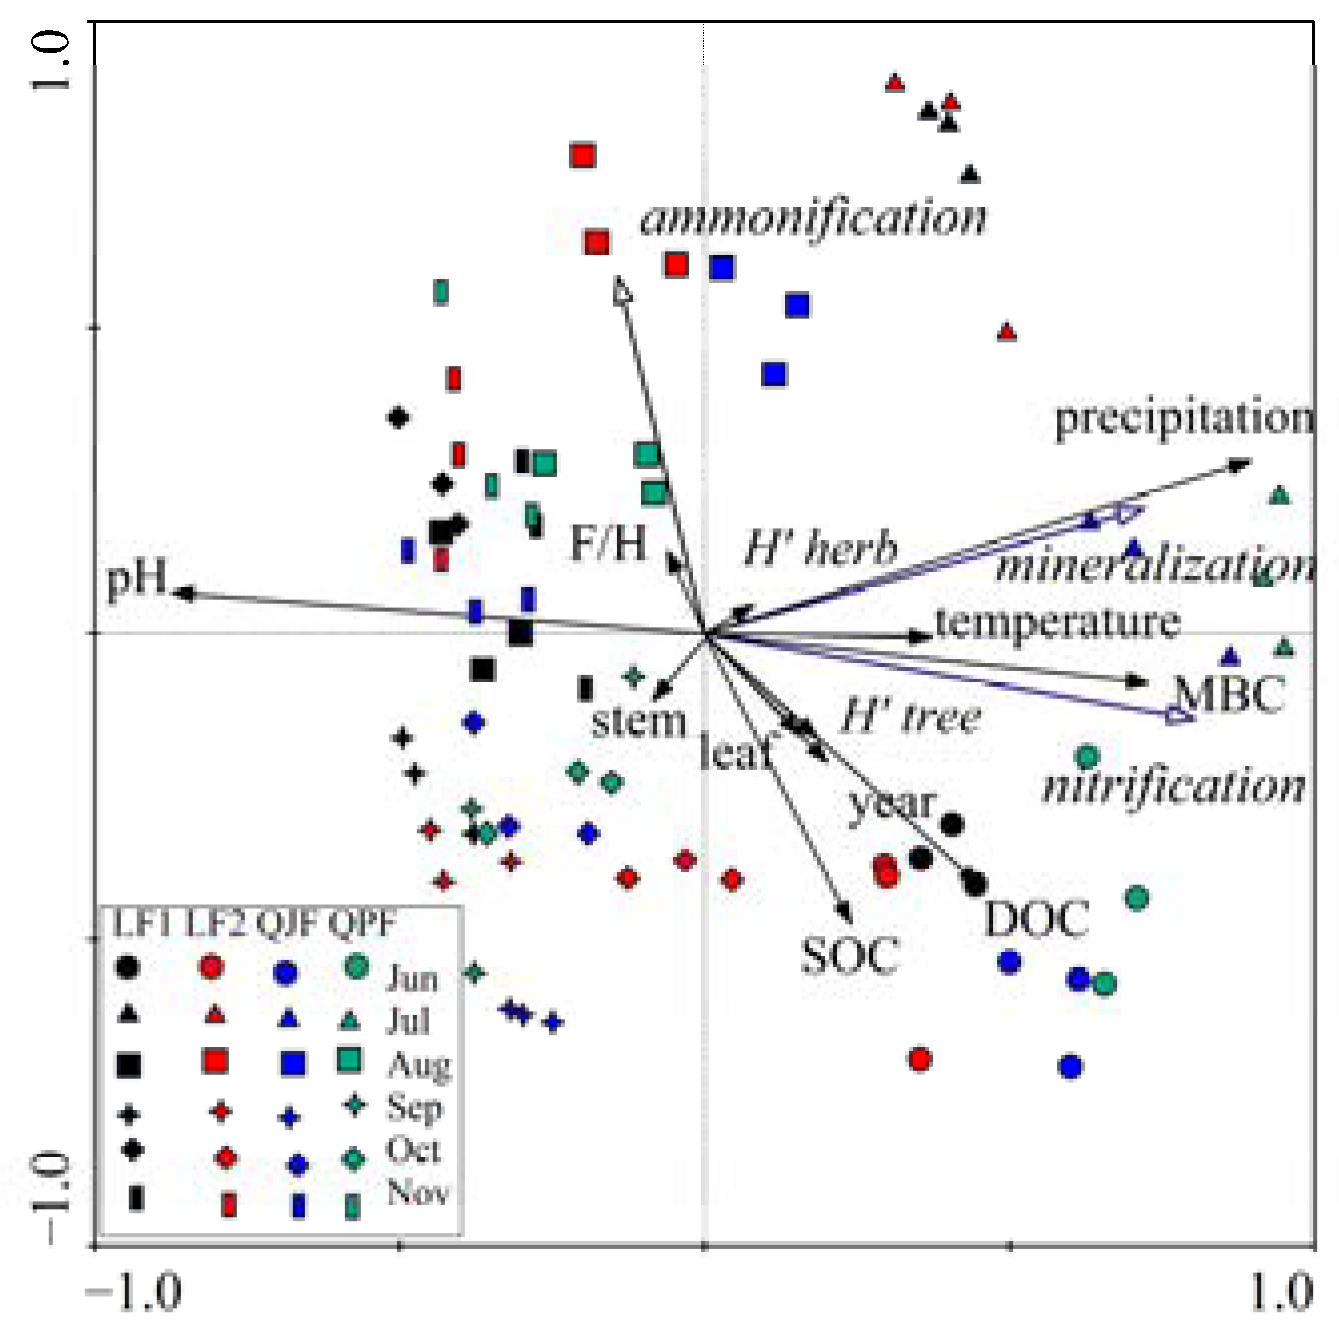
3.5. Multivariate Analysis (Redundancy Analysis)

To investigate possible relationships between N mineralization of organic matter and environmental variables across forest types and seasons, we performed a Redundancy Analysis (RDA), including organic N mineralization, ammonification, nitrification rates, and the relative climate, plant, and soil variables (Figure 7). A total of 57.6% of variations in seasonal net N mineralization, ammonification, nitrification rates were explained by 13 selected environmental variables. The first two RDA axes explained 49.9% and 7.7% of data variations. Soil nitrification rates were affected by the temperature, precipitation, MBC, H’ for tree layer, annual litterfall, total litterfall mass of F + H layer, total foliage and roots biomass for trees, DOC and SOC. Soil N mineralization rates were affected by the temperature, precipitation, MBC and DOC concentration and soil pH. Soil ammonification rates were affected by the total litterfall mass of F + H layer and pH.

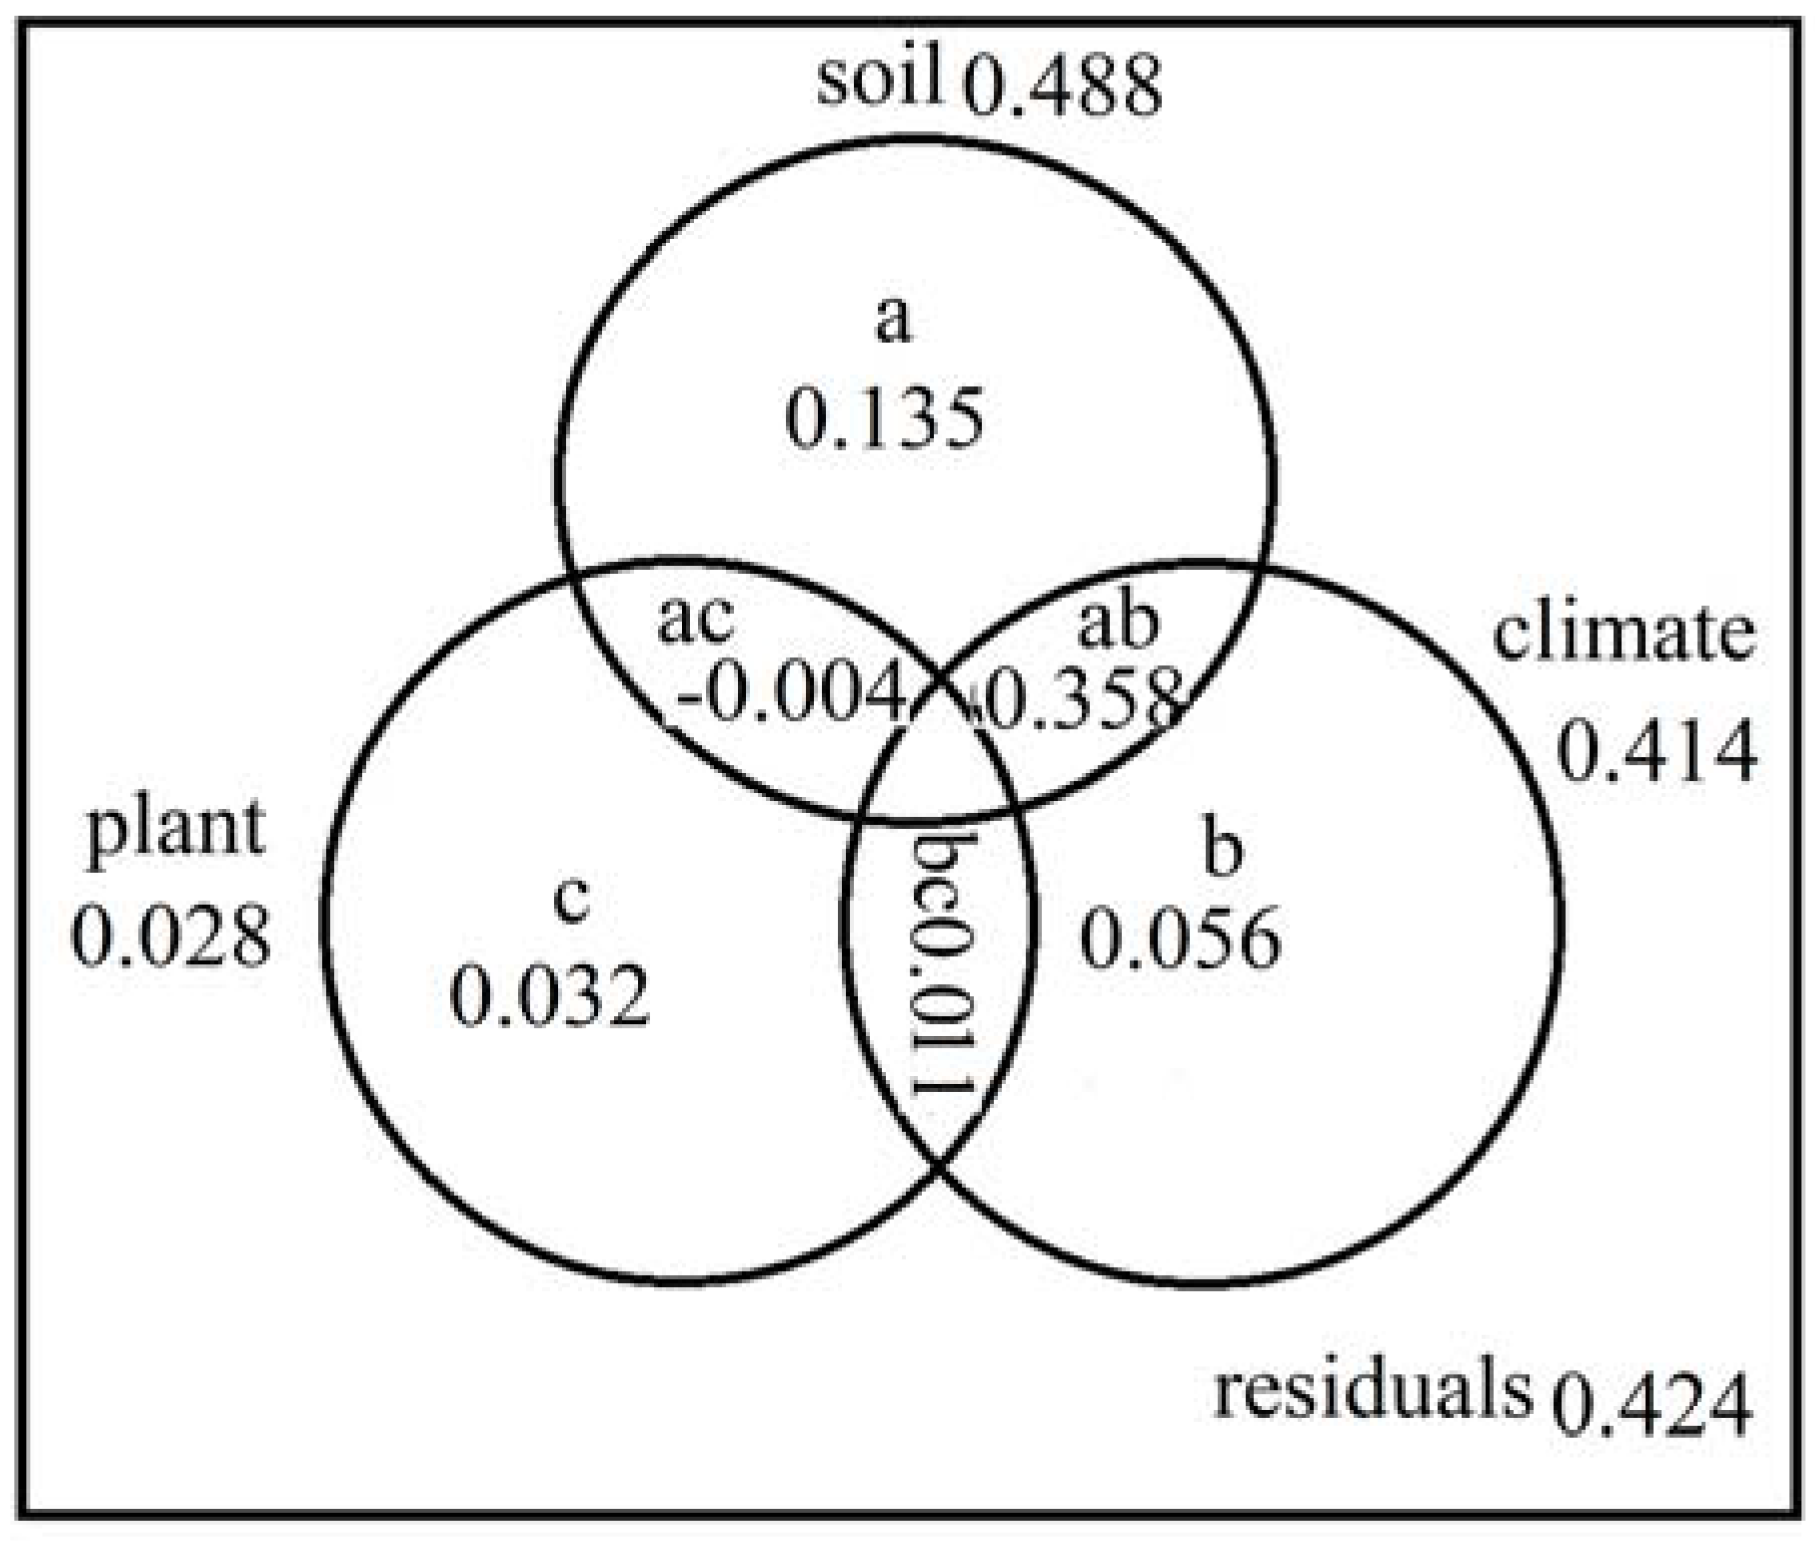
3.6. Variation Partitioning

In order to characterize the relative importance of the broad factors of classification to the soil N mineralization of organic matter in different forest types, variation partitioning was computed independently using climate, soil properties and plant parameters as predictor variables (Figure 8). Results from RDA showed that variables could explain 57.6% of variability in soil N mineralization of organic matter. Both the independent soil (a) and total soil variables (a + ab + ac) accounted for the largest contribution to the variations in soil N mineralization (13.5% and 48.8%), while the independent climatic (b) and total climatic (b + ab + bc) variables were of secondary importance (5.6% and 41.4%). We found 35.8% shared variations of N mineralization explained by soil and/or climatic variables (Figure 7). However, the plant and soil had a negative shared variation of joint fractions (−0.4%).

4. Discussion

The ranges of net N mineralization of organic matter were different among forest types. Here all of the forest types in this study are considered similar in community structure and historical soil conditions. As such, differences in present soil N mineralization patterns may reflect the impacts of the shifts in plant species composition and plant-induced soil properties on N transformation processes [38,39]. Our results indicate that there were considerable variations among forest types in the plant diversity for tree layer, annual litterfall mass, biomass recorded in leaves, branches, stems and roots, and aboveground biomass for herbs. Surface soil properties were also different among forest types in SOC, TN, MBC and MBC: MBN ratio. We suggest that shifts in plant species composition and resulting plant diversity, forest biomass and soil properties are the most probable explanations for the soil N mineralization patterns of natural secondary forest converted into larch plantations.

4.1. The Effects of Plant on N Mineralization

Our results showed that the two natural secondary forests had higher levels of soil nitrification rates than the two larch plantations, while, net ammonification rates were lower in natural secondary forests than in larch plantations, which could be attributed to the following reasons. Firstly, changes of tree species composition could influence the qualities of litterfall, which may significantly alter the available soil nutrients. Previous work has shown that coniferous tree species typically provide a lower quality of litter material (lower N contents and higher C:N ratio) and a slower litter decomposition, which contribute to a poor soil nutrient level [16,40], and consequently reduced the rate of N cycling [41]. In our study sites, the annual litterfall mass were lower in LF1 and LF2 than QJF and QPF, but the forest floor litter mass was not lower, which indicated the litter decomposition rate was slower in in LF1 and LF2 than QJF and QPF. Secondly, conversion of natural secondary forests to plantations could affect forest biomass productions, which influence the quantities of litterfall. Koutika (2014) found that the higher biomass production may increase soil nitrogen through an enhanced production of litter [42]. In our study, the biomass amounts recorded in leaves, branches, and roots were significantly higher in QJF than LF1 and LF2, thus the annual litterfall mass was higher in QJF than in LF1 and LF2. Our result also indicated soil N mineralization and nitrification rates were positively correlated with the foliage biomass, and the annual litterfall mass. These results suggested that the relatively lower quantities and qualities of litter and slower litter decomposition of larch plantations made N mineralization and nitrification rates decrease after conversion from natural secondary forests. Thirdly, N transformations could also be affected by plant diversity. It has been suggested a more diverse array of plant compositions entering the soil through leaf litterfall could enhance nitrification rates by providing a consistent long-term supply of organic nitrogen as the different qualities of plant material break down at different rates over time. In our study, nitrification rate was positively correlated with plant diversity and richness of tree layer. These results are consistent with previous studies [21,43,44] which also detected a positive plant diversity effect on nitrification.

4.2. The Effects of Soil Properties on N Mineralization

As expected, soil properties were closely correlated with soil organic matter mineralization. Previous studies have shown that soils with high nutrient availabilities could have high N mineralization rates [45,46]. As a biological process, soil N mineralization of organic matter is mainly determined by substrate availabilities and microbial activities [47,48]. We observed the net N mineralization and nitrification rate was positively correlated with MBC, and there was an increasing trend in soil net nitrification rate with SOC and DOC. Soil C and N pools provide available substrates and energy to stimulate microbial activity and which increase the N mineralization rates [39,49]. In our study, MBC concentrations were significantly higher in the QJF and QPF than the LF1 and LF2, the SOC concentrations were significantly higher in the QJF than LF2, TN were significantly higher in the QPF than LF2, consequently, the nitrification was higher in the QJF and QPF than the LF1 and LF2, the cumulative mineralization was higher in QPF than the LF1 and LF2. Some studies have shown that soil pH is an important factor of soil N mineralization during conversion of broad-leaved forests to coniferous forests. Plantations with coniferous species can produce acidic leaf litters and root exudation of H+, which in turn lower soil pH and affect micro-fungi activities [50,51]. In our study, soil pH was negatively correlated with net N mineralization and nitrification rate, however, soil pH was not significantly different among forest types, which indicted factors other than pH might have restricted soil N transformation. In this study, we considered the substrate availabilities and microbial activities to be the important factor for N mineralization in organic matter during the forest conversion of natural secondary forests to larch plantations.

4.3. Seasonality Effects on Soil N Transformation Patterns

Seasonal dynamics of temperature and precipitation played an important role in controlling N transformations [11,52]. The present study showed that net nitrification and N mineralization rates were higher from June to July and lower from August to September, whereas the net ammonification rates were higher from July to August and lower from May to June, which can be explained by the seasonal dynamics of temperature and water availability. Soil N mineralization involved biological processes that are moisture and temperature dependent [11,53]. The seasonal changes of temperature and moisture directly control soil microbial activity, which directly influences soil N transformations. In our study, the regression analysis showed that the rates of N mineralization and nitrification had a significantly positive relationship with the precipitation for each forest, while a significant relationship between the net N nitrification and temperature was only found in the LF2. The relationships between the N mineralization rate and precipitation were much stronger than those between the N mineralization rate and temperature, suggesting that precipitation had the major effect on the net N mineralization and nitrification rates in our research region.

4.4. Interaction of Climate, Plant and Soil Variables on N Transformation

In this study, we found a dominant effect of soil properties on N transformations (48.8%). This result is consistent with those of previous studies [10]. Interestingly, the plant variations explained a relatively small fraction in N transformation (2.8%), and the plant and soil had a negative shared variation. This indicated that the interaction effect of plant and soil on N transformation was larger than the summation of independent soil and plant variables. This result can be explained by taking into consideration previous studies wherein plant variables have significant effects on soil properties and which were simultaneously influenced by soil properties, indicating that plant and soil have mutual promoted effects [54]. Climate was also a strong predictor variable of N transformation [8,9]. Many other studies found temperature and precipitation to be the main constraining factors for N transformation [10,11]. In our study, the climate accounted for the secondary contribution to the variations in N mineralization. Overall, these three variations should not be considered mutually exclusive; we may expect each to contribute to the explanation of the potential effects of seasonal dynamics in N mineralization of natural secondary forest converted into larch plantations. In northeast China, plantation/secondary forest landscapes account for the largest proportion of forest areas, and this kind of plantation has been progressively increased throughout the nation. However, we did not study the latitude and longitude, and global climate change effect on N transformation due to limited study sites. Therefore, it is necessary to make a further study on plantation/secondary forest soil N mineralization with a wider study area including latitudinal and longitudinal differences, and varied climatic regions.

5. Conclusions

Our study compared seasonal dynamics of soil N mineralization of organic matter between the natural secondary forests and larch plantations and assessed which could be explained by the plant-soil properties that were associated with forest conversion and seasonal climate conditions. We demonstrated that plant diversity, litterfall quantity and quality and the soil nutrient availability varied considerably during the forest conversion, which made N mineralization different between the natural forests and plantations. Soil properties were the primary determinant of the N mineralization, and climate conditions also contributed to N mineralization significantly, whereas plant variations were a tertiary contribution to N mineralization. Our results indicated that the larch plantations reduced plant diversity, litter quantity and quality and soil fertility as well as N transformation rate.

Author Contributions

Q.W., F.L., X.R. and Z.F. conceived, designed and installed the experiment; Q.W. and Z.F. were responsible for field work; Q.W. performed laboratory and data analysis under F.L. and X.R. supervision; Q.W. and F.L. wrote the manuscript with contributions from the other authors. All authors approved the final version of the manuscript.

Acknowledgments

This work was supported by the Major Science and Technology Program for Water Pollution Control and Treatment (No. 2012ZX07505-001-01), the National Natural Science Foundation of China (No. 41571464, No. 30972418), and the National Key Technology R&D Program of China (No. 2015BAD07B030102), and the Program of Liaoning Education Department (No. 2017LZD005).

Conflicts of Interest

The authors declare no conflict of interest.

References

  1. Pampolino, M.F.; Urushiyama, T.; Hatano, R. Detection of nitrate leaching through bypass flow using pan lysimeter, suction cup, and resin capsule. Soil Sci.Plant Nutr. 2000, 46, 703–711. [Google Scholar] [CrossRef] [Green Version]
  2. Perakis, S.; Hedin, L. Nitrogen loss from unpolluted south american forests mainly via dissolved organic compounds. Nature 2002, 415, 416–419. [Google Scholar] [CrossRef] [PubMed]
  3. Pandey, C.B.; Singh, G.B.; Singh, S.K.; Singh, R.K. Soil nitrogen and microbial biomass carbon dynamics in native forests and derived agricultural land uses in a humid tropical climate of india. Plant Soil 2010, 333, 453–467. [Google Scholar] [CrossRef]
  4. Lupon, A.; Gerber, S.; Sabater, F.; Bernal, S. Climate response of the soil nitrogen cycle in three forest types of a headwater mediterranean catchment: Climate response of soil nitrogen cycle. J. Geophys. Res. Biogeosci. 2015, 120, 2988–2999. [Google Scholar] [CrossRef]
  5. Kelly, C.N.; Schoenholtz, S.H.; Adams, M.B. Soil properties associated with net nitrification following watershed conversion from appalachian hardwoods to norway spruce. Plant Soil 2011, 344, 361–376. [Google Scholar] [CrossRef]
  6. Noe, G.B.; Hupp, C.R.; Rybicki, N.B. Hydrogeomorphology influences soil nitrogen and phosphorus mineralization in floodplain wetlands. Ecosystems 2013, 16, 75–94. [Google Scholar] [CrossRef]
  7. Chen, J.; Xiao, G.; Kuzyakov, Y.; Darrel Jenerette, G.; Ma, Y.; Liu, W.; Wang, Z.; Shen, W. Soil nitrogen transformation responses to seasonal precipitation changes are regulated by changes in functional microbial abundance in a subtropical forest. Biogeosciences 2017, 14, 2513–2525. [Google Scholar] [CrossRef]
  8. Wang, C.; Wan, S.; Xing, X.; Zhang, L.; Han, X. Temperature and soil moisture interactively affected soil net n mineralization in temperate grassland in northern china. Soil Biol. Biochem. 2006, 38, 1101–1110. [Google Scholar] [CrossRef]
  9. Wang, L.; Wang, J.; Huang, J. Net nitrogen mineralization and nitrification in three subtropical forests of southwestern china. Dyn. Soil Dyn. Plant 2008, 2, 33–40. [Google Scholar]
  10. Liu, X.R.; Dong, Y.S.; Ren, J.Q.; Li, S.G. Drivers of soil net nitrogen mineralization in the temperate grasslands in inner mongolia, china. Nutr. Cycl. Agroecosyst. 2010, 87, 59–69. [Google Scholar] [CrossRef]
  11. Hishi, T.; Urakawa, R.; Tashiro, N.; Maeda, Y.; Shibata, H. Seasonality of factors controlling n mineralization rates among slope positions and aspects in cool-temperate deciduous natural forests and larch plantations. Biol. Fertil. Soils 2014, 50, 343–356. [Google Scholar] [CrossRef]
  12. Mylliemngap, W.; Nath, D.; Barik, S.K. Changes in vegetation and nitrogen mineralization during recovery of a montane subtropical broadleaved forest in north-eastern india following anthropogenic disturbance. Ecol. Res. 2016, 31, 21–38. [Google Scholar] [CrossRef]
  13. Chu, H.; Grogan, P. Soil microbial biomass, nutrient availability and nitrogen mineralization potential among vegetation-types in a low arctic tundra landscape. Plant Soil 2010, 329, 411–420. [Google Scholar] [CrossRef]
  14. Trum, F.; Titeux, H.; Ranger, J.; Delvaux, B. Influence of tree species on carbon and nitrogen transformation patterns in forest floor profiles. Ann. For. Sci. 2011, 68, 837–847. [Google Scholar] [CrossRef]
  15. Xiong, Y.; Zeng, H.; Xia, H.; Guo, D. Interactions between leaf litter and soil organic matter on carbon and nitrogen mineralization in six forest litter-soil systems. Plant Soil 2014, 379, 217–229. [Google Scholar] [CrossRef]
  16. Yang, K.; Shi, W.; Zhu, J.J. The impact of secondary forests conversion into larch plantations on soil chemical and microbiological properties. Plant Soil 2013, 368, 535–546. [Google Scholar] [CrossRef]
  17. Grime, J.P. Benefits of plant diversity to ecosystems: Immediate, filter and founder effects. J. Ecol. 1998, 86, 902–910. [Google Scholar] [CrossRef]
  18. Khanna, P.K.; Fortmann, H.; Meesenburg, H.; Eichhorn, J.; Meiwes, K.J. Biomass and element content of foliage and aboveground litterfall on the three long-term experimental beech sites: Dynamics and significance. In Functioning and Management of European Beech Ecosystems; Brumme, R., Khanna, P.K., Eds.; Springer (Berlin Heidelberg): Berlin, Germany, 2009; pp. 183–205. [Google Scholar]
  19. Denton, C.S.; Bardgett, R.D.; Cook, R.; Hobbs, P.J. Low amounts of root herbivory positively influence the rhizosphere microbial community in a temperate grassland soil. Soil Biol. Biochem. 1999, 31, 155–165. [Google Scholar] [CrossRef]
  20. Mikola, J.; Barker, G.; Wardle, D. Linking above-ground and below-ground effects in autotrophic microcosms: Effects of shading and defoliation on plant and soil properties. Oikos 2000, 89, 577–587. [Google Scholar] [CrossRef]
  21. Laughlin, D.C.; Hart, S.C.; Kaye, J.P.; Moore, M.M. Evidence for indirect effects of plant diversity and composition on net nitrification. Plant Soil 2010, 330, 435–445. [Google Scholar] [CrossRef]
  22. Alarcón-Gutiérrez, E.; Floch, C.; Ziarelli, F.; Albrecht, R.; Le Petit, J.; Augur, C.; Criquet, S. Characterization of a mediterranean litter by ¹³c cpmas nmr: Relationships between litter depth, enzyme activities and temperature. Eur. J. Soil Sci. 2008, 59, 486–495. [Google Scholar] [CrossRef]
  23. Shannon, C.E.; Weaver, W. The Mathematical Theory of Communication; University of Illinois Press: Urbana, IL, USA, 1949; Volume 27, p. 177. [Google Scholar]
  24. Margalef, R. Temporal Succession and Spatial Heterogeneity in Phytoplankton; University of California Press: Berkeley, CA, USA, 1958; pp. 323–349. [Google Scholar]
  25. Wang, C. Biomass allometric equations for 10 co-occurring tree species in chinese temperate forests. For. Ecol. Manag. 2006, 222, 9–16. [Google Scholar] [CrossRef]
  26. Bhogal, A.; Hatch, D.J.; Shepherd, M.A.; Jarvis, S.C. Comparison of methodologies for field measurement of net nitrogen mineralisation in arable soils. Plant Soil 1999, 207, 15–28. [Google Scholar] [CrossRef]
  27. Hatch, D.J.; Jarvis, S.C.; Parkinson, R.J.; Lovell, R.D. Combining field incubation with nitrogen-15 labelling to examine nitrogen transformations in low to high intensity grassland management systems. Biol. Fertil. Soils 2000, 30, 492–499. [Google Scholar] [CrossRef]
  28. Hatch, D.J.; Jarvis, S.C.; Parkinson, R.J. Concurrent measurements of net mineralization, nitrification, denitrification and leaching from field incubated soil cores. Biol. Fertil. Soils 1998, 26, 323–330. [Google Scholar] [CrossRef]
  29. Carranca, C.; Oliveira, A.; Pampulha, E.; Torres, M.O. Temporal dynamics of soil nitrogen, carbon and microbial activity in conservative and disturbed fields amended with mature white lupine and oat residues. Geoderma 2009, 151, 50–59. [Google Scholar] [CrossRef]
  30. Raison, R.J.; Connell, M.J.; Khanna, P.K. Methodology for studying fluxes of soil mineral-n in situ. Soil Biol. Biochem. 1987, 19, 521–530. [Google Scholar] [CrossRef]
  31. Hübner, C.; Redl, G.; Wurst, F. In situ methodology for studying n-mineralization in soils using anion exchange resins. Soil Biol. Biochem. 1991, 23, 701–702. [Google Scholar] [CrossRef]
  32. Valenzuela-Solano, C.; Crohn, D.M.; Downer, J.A. Nitrogen mineralization from eucalyptus yardwaste mulch applied to young avocado trees. Biol. Fertil. Soils 2005, 41, 38–45. [Google Scholar] [CrossRef]
  33. Vance, E.D.; Brookes, P.C.; Jenkinson, D.S. An extraction method for measuring soil microbial biomass c. Soil Biol. Biochem. 1987, 19, 703–707. [Google Scholar] [CrossRef]
  34. Cabrera, M.L. Alkaline persulfate oxidation for determining total nitrogen in microbial biomass extracts. Soil Sci. Soc. Am. J. 1993, 57, 1007–1012. [Google Scholar] [CrossRef]
  35. Zeglin, L.H.; Stursova, M.; Sinsabaugh, R.L.; Collins, S.L. Microbial responses to nitrogen addition in three contrasting grassland ecosystems. Oecologia 2007, 154, 349–359. [Google Scholar] [CrossRef] [PubMed]
  36. Lepš, J.; Šmilauer, P. Multivariate Analysis of Ecological Data Using Canoco; Cambridge University Press: Cambridge, UK, 2003; p. 269. [Google Scholar]
  37. Borcard, D.; Legendre, P.; Drapeau, P. Partialling out the spatial component of ecological variation. Ecology 1992, 73, 1045–1055. [Google Scholar] [CrossRef]
  38. Scherer-Lorenzen, M.; Luis Bonilla, J.; Potvin, C. Tree species richness affects litter production and decomposition rates in a tropical biodiversity experiment. Oikos 2007, 116, 2108–2124. [Google Scholar] [CrossRef] [Green Version]
  39. Lu, S.; Zhang, Y.; Chen, C.; Xu, Z.; Guo, X. Plant–soil interaction affects the mineralization of soil organic carbon: Evidence from 73-year-old plantations with three coniferous tree species in subtropical Australia. J. Soils Sediments 2017, 17, 985–995. [Google Scholar] [CrossRef]
  40. Fukushima, K.; Tateno, R.; Tokuchi, N. Soil nitrogen dynamics during stand development after clear-cutting of japanese cedar (cryptomeria japonica) plantations. J. For. Res. 2011, 16, 394. [Google Scholar] [CrossRef] [Green Version]
  41. Burns, D.A.; Murdoch, P.S. Effects of a clearcut on the net rates of nitrification and n mineralization in a northern hardwood forest, catskill mountains, new york, USA. Biogeochemistry 2005, 72, 123–146. [Google Scholar] [CrossRef]
  42. Koutika, LS.; Epron, D.; Bouillet, J.P.; Mareschal, L. Changes in n and c concentrations, soil acidity and p availability in tropical mixed acacia and eucalypt plantations on a nutrient-poor sandy soil. Plant Soil 2014, 379, 205–216. [Google Scholar] [CrossRef]
  43. Mulder, C.; Schouten, A.J.; Hund-Rinke, K.; Breure, A.M. The use of nematodes in ecological soil classification and assessment concepts. Ecotoxicol. Environ. Saf. 2005, 62, 278–289. [Google Scholar] [CrossRef] [PubMed]
  44. Niklaus, P.A.; Kandeler, E.; Leadley, P.W.; Schmid, B.; Tscherko, D.; Körner, C. A link between plant diversity, elevated co2 and soil nitrate. Oecologia 2001, 127, 540–548. [Google Scholar] [CrossRef] [PubMed]
  45. Buckeridge, K.M.; Zufelt, E.; Chu, H.; Grogan, P. Soil nitrogen cycling rates in low arctic shrub tundra are enhanced by litter feedbacks. Plant Soil 2010, 330, 407–421. [Google Scholar] [CrossRef]
  46. Zeng, Y.; Xiang, W.; Deng, X.; Fang, X.; Liu, C.; Peng, C. Soil n forms and gross transformation rates in chinese subtropical forests dominated by different tree species. Plant Soil 2014, 384, 231–242. [Google Scholar] [CrossRef]
  47. Yan, E.R.; Wang, X.H.; Guo, M.; Zhong, Q.; Zhou, W.; Li, Y.F. Temporal patterns of net soil n mineralization and nitrification through secondary succession in the subtropical forests of eastern China. Plant Soil 2009, 320, 181–194. [Google Scholar] [CrossRef]
  48. Hart, S.C.; Stark, J.M.; Davidson, E.A.; Firestone, M.K. Nitrogen mineralization, immobilization, and nitrification. In Methods of Soil Analysis, Part 2; Soil Sci. Society of America, Inc.: Madison, WI, USA, 1994; pp. 985–1019. [Google Scholar]
  49. Taylor, P.G.; Townsend, A. Stoichiometric control of organic carbon-nitrate relationships from soils to the sea. Nature 2010, 464, 1178–1181. [Google Scholar] [CrossRef] [PubMed]
  50. Jongkind, A.G.; Velthorst, E.; Buurman, P. Soil chemical properties under kauri (agathis australis) in the waitakere ranges, new zealand. Geoderma 2007, 141, 320–331. [Google Scholar] [CrossRef]
  51. Johnson, D.W.; Miegroet, H.; Lindberg, S.E.; Harrison, R.; Todd, D.E. Nutrient cycling in red spruce forests of the great smoky mountains. Can. J. For. Res. 2011, 21, 769–787. [Google Scholar] [CrossRef]
  52. Pérez, C.A.; Carmona, M.R.; Aravena, J.C.; Armesto, J.J. Successional changes in soil nitrogen availability, non-symbiotic nitrogen fixation and carbon/nitrogen ratios in southern chilean forest ecosystems. Oecologia 2004, 140, 617–625. [Google Scholar] [CrossRef] [PubMed]
  53. Yan, E.R.; Wang, X.H.; Huang, J.J.; Li, G.Y.; Zhou, W. Decline of soil nitrogen mineralization and nitrification during forest conversion of evergreen broad-leaved forest to plantations in the subtropical area of eastern china. Biogeochemistry 2008, 89, 239–251. [Google Scholar] [CrossRef]
  54. Li, Q.; Wang, X.; Jiang, M.; Wu, Y.; Yang, X.; Liao, C.; Liu, F. How environmental and vegetation factors affect spatial patterns of soil carbon and nitrogen in a subtropical mixed forest in central china. J. Soils Sediments 2017, 17, 2296–2304. [Google Scholar] [CrossRef]
Figure 1. Seasonal dynamics of air temperature and precipitation during 1 year from January to December 2014 in Laotudingzi National Nature Reserve.
Forests 09 00386 g001
Figure 2. Dynamics of NO3-N (a) and NH4+-N (b) and inorganic N (c) concentrations in LF1, LF2, QJF and QPF (means ± SE, n = 3).
Forests 09 00386 g002
Figure 3. Rates of nitrification (a), ammonification (b) and net N mineralization (c) at one-month intervals (means ± SE, n = 3). Different lowercase letters indicate significant differences among forest types; different uppercase letters indicate significant differences among months (adjusted p < 0.05).
Forests 09 00386 g003
Figure 4. Differences of soil total cumulative nitrification (a), ammonification (b) and N mineralization (c) in various forest types from May to November. Different letters indicate significant differences among forest types (adjusted p < 0.05, n = 3).
Forests 09 00386 g004
Figure 5. Correlations for nitrification rates to precipitation (a) and soil temperature (b); correlations for N mineralization rates to precipitation (c) and soil temperature (d); the precipitation was amount of precipitation per one month and soil temperature was the average for one month.
Forests 09 00386 g005
Figure 6. Correlations between net nitrification rates to SOC (a), MBC (b), DOC (c), and pH (d), and correlations between net N mineralization rates to MBC (e), DOC (f), and pH (g); the SOC, TN, MBC, DOC and MBC were determined in the beginning of each one-month incubation period, and the data represent the whole experimental period (from May to November) among forest types (n = 72).
Forests 09 00386 g006
Figure 7. Redundancy analysis using net N transformations data as response variables and climate, plant and soil properties as explanatory variables.
Forests 09 00386 g007
Figure 8. Variation partitioning of N transformations using the matrices of soil variables, plant variables and climate variables. Variables a, b and c denote the independent effects of soil, climate and plant, respectively. Variables ab, ac, bc denote the joint effects of soil and climate, soil and plant, climate and plant, respectively.
Forests 09 00386 g008
Table 1. Main characteristics of LF1, LF2, QJF and QPF stands.
ItemLF1LF2QJFQPF
Representative plantsLarix kaempferiLarix kaempferiQuercus mongolica
Juglans mandshurica
Quercus mongolica
Populus davidiana
Slope (o)18181618
Elevation (m)656684672663
Forest age (a)43434346
No. of tree species381210
Tree density (stems/hm2)150410383312
Canopy density0.60.80.90.9
Diameter at breast height (cm)24.57 ± 5.9824.82 ± 3.7424.53 ± 9.7325.37 ± 8.00
Tree height (m)20.16 ± 2.4420.22 ± 1.5319.00 ± 3.5619.88 ± 3.90
Table 2. Summary of repeated measures ANOVA results on the nitrate N, ammonium N, mineral N, net nitrification rate (Nnit), net ammonium rate (Namm) and net mineralization rate (Nmin).
FactorNO3-NNH4+-NMineral NNnitNammNmin
Forest types54.44 ***30.31 **37.54 ***14.57 **16.86 **4.03
Months94.10 **263.11 ***81.71 **56.26 **164.12 ***88.80 ***
Forest types × Months2.3515.65 ***3.54 **1.0210.30 ***1.08
** p < 0.01, *** p < 0.001.
Table 3. Vegetation properties in different forest types (means ± SE, n = 3).
ItemLF1LF2QJFQPF
Biomass for tree (t/hm2)
Foliage0.71 ± 0.07c2.31 ± 0.43b3.05 ± 0.88a1.96 ± 0.23b
Branches4.87 ± 0.60b16.28 ± 3.31ab34.30 ± 18.5a15.10 ± 2.55ab
Stems31.20 ± 1.27c90.66 ± 8.67a83.43 ± 25.88ab75.70 ± 10.52b
Roots7.29 ± 0.39c21.79 ± 2.69ab25.20 ± 7.87a18.24 ± 2.32b
Total44.06 ± 2.33c131.03 + 15.04a145.98 ± 51.57a111.01 ± 15.29b
Biomass for herb (t/hm2)
Above ground0.93 ± 0.57c1.57 ± 0.21a1.11 ± 0.47b0.96 ± 0.39c
Below ground1.81 ± 0.49a2.36 ± 0.59a2.80 ± 1.04a2.27 ± 0.75a
total2.75 ± 1.06a3.93 ± 0.66a3.91 ± 1.46a3.23 ± 0.99a
Forest floor litter mass (t/hm2)
L layer0.82 ± 0.16a0.87 ± 0.14a0.77 ± 0.18a0.74 ± 0.23a
F+H layer3.73 ± 1.62b4.46 ± 0.92a2.64 ± 0.50b2.42 ± 0.42b
Total4.53 ± 1.76b5.33 ± 1.05a3.14 ± 0.63b3.61 ± 0.64b
Annual litterfall mass (kg/hm2)
30.67 ± 1.53c44.64 ± 9.16b61.33 ± 10.21a62.13 ± 2.64a
H’ and MI for tree layer
H’0.42 ± 0.07d0.89 ± 0.20c1.31 ± 0.03b2.16 ± 0.25a
MI0.53 ± 0.07b0.63 ± 0.27b1.72 ± 0.24a1.76 ± 0.18a
H’ and MI for herb layer
H’2.28 ± 0.13b2.07 ± 0.21b1.99 ± 0.29b2.89 ± 0.54a
MI4.11 ± 0.38ab4.04 ± 0.96b3.9 ± 0.53b4.93 ± 0.42a
Different letters indicate significant differences among forest types (adjusted p < 0.05).
Table 4. Mean soil properties from May to November in different forest types (means ± SE, n = 21).
ItemLF1LF2QJFQPF
SOC (g/kg dry soil)60.69 ± 6.97ab59.17 ± 11.94b66.52 ± 9.04a63.22 ± 5.24ab
TN (g/kg dry soil)4.99 ± 0.70ab4.46 ± 1.02b4.90 ± 1.57ab5.26 ± 0.85a
C: N12.47 ± 2.91a10.35 ± 5.42a10.40 ± 5.33a12.27 ± 1.94a
MBC (mg/kg dry soil)403.79 ± 13.33b406.81 ± 27.18b539.28 ± 47.51a543.83 ± 15.99a
MBN (mg/kg dry soil)167.66 ± 38.29a169.62 ± 38.80a176.52 ± 40.51a183.30 ± 30.83a
MBC: MBN2.54 ± 0.63b2.51 ± 0.52b3.15 ± 0.90a2.97 ± 0.66ab
DOC (mg/kg dry soil)129.24 ± 23.05a138.07 ± 50.85a128.89 ± 43.84a135.15 ± 40.89a
Soil pH6.39 ± 0.24a6.37 ± 0.24a6.67 ± 0.03a6.41 ± 0.31a
Different letters indicate significant differences among forest types (adjusted p < 0.05).
Table 5. Pearson’s correlation coefficients (r) between plant variables and soil N mineralization (n = 12).
ItemAbove GroundBelow GroundLF + HAnnual LiterfallFoliageBranchesStemsRootsH’treeMItreeH’herbMIherb
Nnit−0.090.530.20−0.320.88 **0.68 *0.60 *0.550.63 **0.79 **0.89 **0.270.42
Namm0.26−0.310.150.51−0.79 **−0.61 *−0.59 *−0.38−0.52−0.65 *−0.87 *0.10−0.17
Nmin−0.020.570.41−0.140.74 **0.55 *0.460.510.530.71 **0.72 **0.52 *0.53
* p < 0.05, ** p < 0.01.

