Article

Recent Drought-Induced Vitality Decline of Black Pine (Pinus nigra Arn.) in South-West Hungary—Is This Drought-Resistant Species under Threat by Climate Change?

1
Department of Ecology and Forest Management, Forest Research Institute, 9600 Sárvár, Hungary
2
Faculty of Forestry, University of Sopron, 9400 Sopron, Hungary
3
Bakonyerdő Ltd., 8500 Pápa, Hungary
4
Faculty of Geo-Information Sciences and Earth Observation, University of Twente, 7522 Enschede, The Netherlands
5
Faculty of Agricultural and Environmental Sciences, Szent István University, 2100 Gödöllő, Hungary
*
Authors to whom correspondence should be addressed.
Forests 2018, 9(7), 414; https://doi.org/10.3390/f9070414
Submission received: 12 June 2018 / Revised: 29 June 2018 / Accepted: 3 July 2018 / Published: 10 July 2018
(This article belongs to the Special Issue Remotely Sensing of Drought-Induced Forest Change and Recovery)

Abstract

:
This paper analyses the recent recurring dieback and growth decline of Black pine (P. nigra Arn. var austriaca) in the Keszthely mountains of south-west Hungary, and their relations to water deficits due to droughts. These relations were studied in five stands with low soil water storage capacity for the period 1981–2016. The vitality was assessed using 60 tree-ring samples and changes in remotely sensed vegetation activity indices, i.e., the normalized difference vegetation index (NDVI) and the normalized difference infrared index (NDII). Water deficit was estimated by using meteorological drought indices such the standardized precipitation–evapotranspiration index (SPEI) and the forestry aridity index (FAI), as well as the relative extractable water (REW), calculated by the Brook90 hydrological model. Results revealed a strong dependency of annual tree ring width on the amount of water deficit as measured by all the above estimators, with the highest correlation shown by the summer REW. Droughts also showed a long-term superimposed effect on tree growth. NDII seemed to be more sensitive to drought conditions than NDVI. The robust dependency of tree growth on the summer water availability combined with the projected increasing aridity might lead to decreasing growth of Black pine in Hungary towards the end of the century. We thus argue that the suggestion by several papers that Black pine can be a possible substitute species in the Alpine and Mediterranean region in the future should be revisited.

1. Introduction

Drought has started to occur with increasing frequency and severity in Europe over the last 30 years [1,2]. It could trigger a long-term decrease in forest productivity [3,4,5] or forest decline [6,7,8]. Prolonged and extreme droughts are assumed to be responsible for widespread forest mortality [9,10,11,12]. The growth and vitality of many forests in Hungary have already been negatively affected by several recent droughts, especially the extremely dry years at the beginning of the 2000s that had a negative impact on beech and oak forests [13,14,15].
Black pine (P. nigra Arn.) is generally considered as a drought-tolerant species (more tolerant than Scotch pine, P. sylvestris L.); therefore, several studies mentioned Black pine as a possible substitute species in the Alpine and Mediterranean region in the future [16,17,18,19]. However, recent prolonged water deficits of the extreme drought in 2011–2012 induced a large-scale dieback of Black pine (P. nigra Arn. var. austriaca) in the south-west and to a lesser extent in the north-eastern mountainous area of Hungary. Black pine covers 3.4% of the total forested area [20] and is not a native species in Hungary. It was planted from the second half of the 19th century mainly on sites with shallow soil and poor yield potential to bind the sand in the lowland and cover the bare surfaces in the mountains. The majority (55%) of Black pine stands in Hungary are located on shallow (0–40 cm) soils with sandy texture. Although the drought periods in the 1990s and 2000s had already affected the vitality of Black pine in south-west Hungary evaluated by shoot mortality [21], the drought event in 2011–2012 induced a damage chain, the final phase being a fungal pathogen attack that has led to the mortality of the trees with declined vitality. After the drought period and the subsequent necessary sanitary cutting in the following years, only a few patches of Black pine stands have remained in the Keszthely Mountains [22].
The expected increase in the frequency of extreme drought events in the future [23,24,25] combined with the amplifying effect of poor site conditions might risk the future sustainability of Black pine in this region but also elsewhere in Hungary. These forests, however, provide important ecosystem services by, among others, protecting the soil against wind and water erosion.
Drought metrics for such analyses are usually based on drought indices that are the combination of simple meteorological variables such as the amount of rainfall and air temperature (potential evapotranspiration) for specific time scales (e.g., the standardized precipitation evapotranspiration index (SPEI) [26] or the forestry aridity index (FAI) [27]). In forested ecosystems, however, the amount of soil water content depends not only on abiotic factors (climate and the characteristics of the soil itself), but also on the effect of vegetation on water fluxes (such as rooting depth, leaf area index and stomatal conductance). The daily estimation of the relative extractable water (REW), calculated by the Brook90 daily soil water balance model, considers the effect of canopy is necessary to empirically characterize drought as a period when soil water content falls below a threshold, and negatively affects plant functioning [28,29]. Yet, to our knowledge, few studies, if any, have compared the correlation strength between the growth of Black pine and meteorology-based drought indices completed with soil water balance indicator that explicitly take into account relationships between plant functioning, soil properties, and climate. The aim of this study was to describe the Black pine specific climate-tree-growth relationship and the vitality response of Black pine to droughts. These relations were studied using the combination of dendrochronological information, remote-sensing techniques and drought indices. We also tested the ability of these indices to track growth changes.

2. Materials and Methods
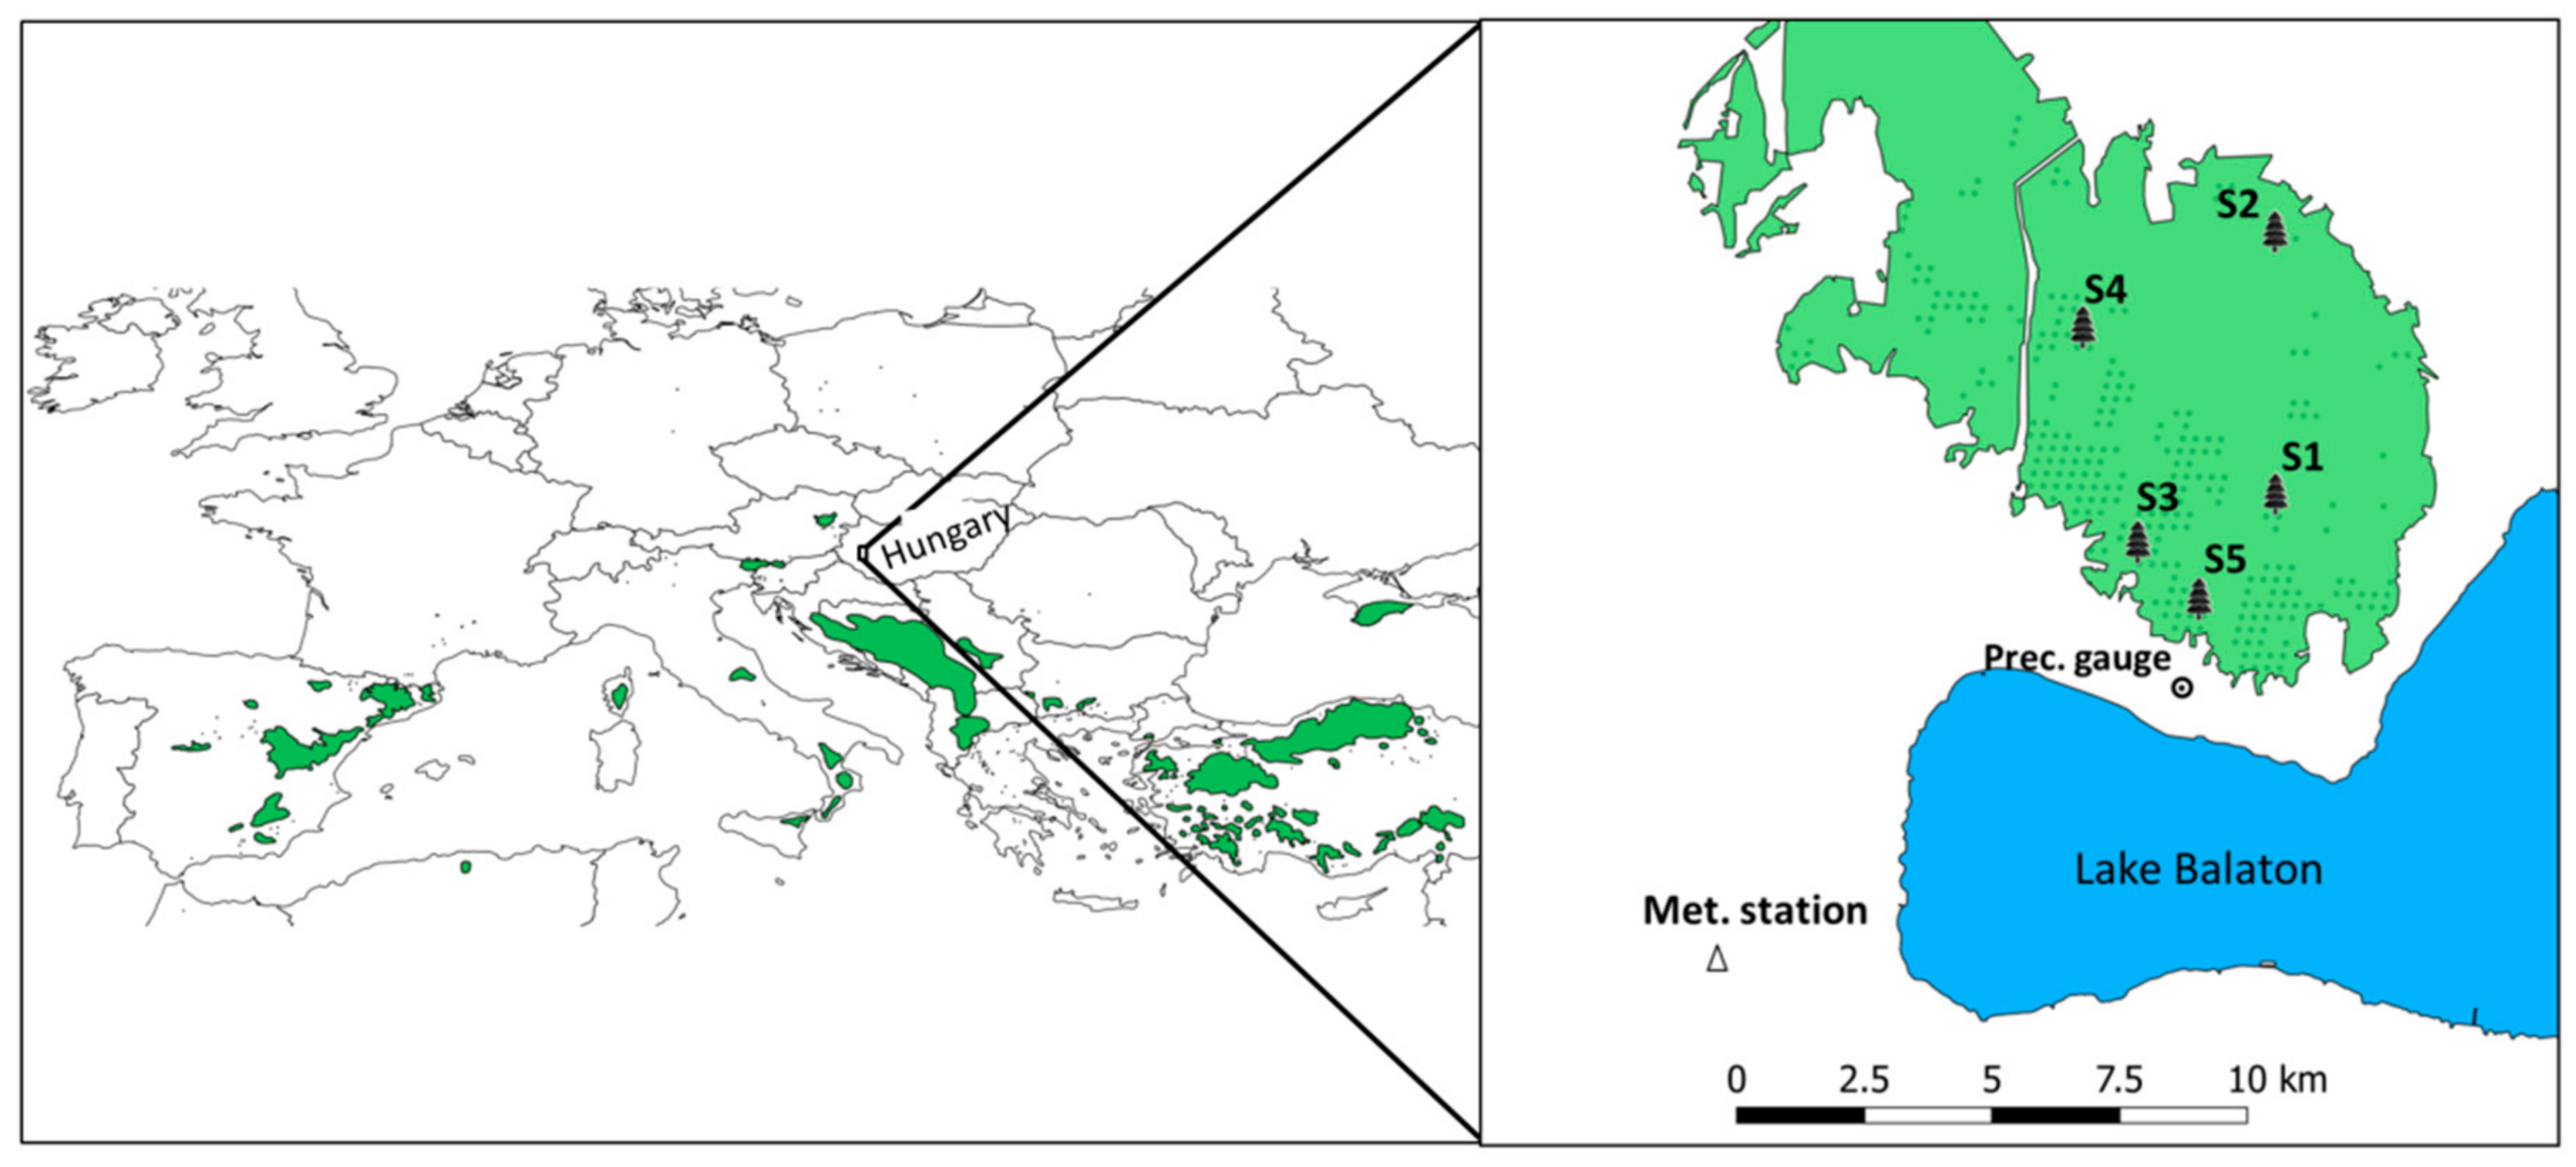
2.1. Study Site

Although Black pine was one of the most dominant tree species in the Keszthely Mountains, by the time the study was started only a few larger patches of Black pine stands remained, mainly in steep north-wards facing slopes due to the drought-induced damage chain following the year 2012. For our analysis, five Black pine sites (50 × 50 m) were selected in the Keszthely Mountains in south-western Hungary (46.83° N, 17.35° E, 200–400 m a.s.l. Figure 1).
The selected plots are located around 5–10 km from each other and can be characterized by similar growing and stand conditions such as shallow rocky soils with relatively little available water storage capacity (none of the sites receive water additional to precipitation), similar in-site soil conditions and high crown closure. Since forest management (e.g., thinning) can have a significant temporary influence on individual trees’ response to climate, we selected sites without any forest management for at least the last three decades that give us confidence that changes in forest management have not influenced the variability of observed changes in radial growth.
The stands are pure and even-aged (between 35 and 55 years) although the trees were affected by drought-induced growth decline and dieback in the past with varying magnitude. Taking into account the middle-aged trees in the samples and the felling age of 85 years in the fourth yield class for Black pine [31] ensured that the trees were still in the rapid growing stage during the analysed period. All selected stands can be considered representative for the region.
The parent material of the area is dolomite and the relief of the terrain is high. The soil of the investigated stands is of Rendzina type, an equivalent of Leptosolin the WRB system [32] with an average rock fraction (>2 mm) of 60% (Table 1.).
Mean annual temperature was 10.8 °C and the mean annual precipitation was 628 mm during the period 1981–2016 in Keszthely (National Climatic Data Center (NCDC) [33]. A warming trend can be observed at a rate of +0.2 °C per decade for the annual temperature since the beginning of the 1980s, while no significant trend was found in the sum of annual precipitation for the same period.
The temporal change of moisture availability expressed by the annual SPEI values showed two main multi-year periods (2000–2003 and 2011–2012) that can be characterised by a significant water deficit (Figure 2).
The standardized mean of the normalized difference vegetation index (NDVI, [35]) of the study sites showed especially low values in August and September 2012, corresponding to a large precipitation anomaly in 2011–2012 (the effect of drought conditions on NDVI appears mostly in late summer [36] (Figure 2) and were accompanied by high annual temperatures). A precipitation anomaly map of this period for the whole country (Figure 3A) clearly shows a substantial annual water deficit.
Although not shown, data for the summers in 2011–2012 may be even more indicative of the extreme meteorological conditions that trees had to endure (in 2012 mean summer temperature was by 2 °C above the long-term mean combined with less than half of the long-term precipitation sum of summers).
The vegetation activity response of forest canopies was apparent in late summer and early autumn in 2012 as shown by the mean standardized NDVI [37] for the months August–September (Figure 3B). The NDVI was more than two standard deviations below the average condition (2000–2017) in the study area for the selected period thus reinforcing the fact that the selected study area was among the most affected regions during the most recent drought event.

2.2. Meteorological Data

To analyse the climate-growth relationship, daily meteorological data (temperature, precipitation, vapour pressure, wind speed) for the period 1981–2016 were gathered from the nearest Keszthely (Sármellék) station (Hungarian Meteorological Service), located about 10–15 km from the study sites. Although topographical differences may cause differences in local microclimate conditions between the meteorological station and the study sites, longer time series (i.e., more than 30 years) were available only from the station that, nevertheless, indicates local tendencies.
We calculated several meteorological variables for correlation with growth at different time scales with particular attention to water availability. On the monthly scale, precipitation sum, mean temperature, FAI, SPEI and REW were computed. The formulas of the applied variables can be found in the Supplementary Materials (Table S1).
FAI is the ratio of the average temperature of July and August and the precipitation sums of May to July plus the precipitation sum from July to August corresponding to the main growth and organic matter production of forests [27].
SPEI [26] is a multi-scalar drought index that enables the monitoring of water availability over various timescales using the monthly difference of precipitation and potential evapotranspiration. The monthly potential evapotranspiration was calculated using the Thornthwaite method [38] using the SPEI package of the software R [39].

2.3. Water Balance Model Calculations

The REW values reflect the timing and strength of the droughts. The values below 0.4 define generally the threshold of stomatal closure i.e., the drought stress [28]. The mean monthly REW was estimated for the site S5 covering the period 1981–2016 based on daily water balance simulation. Components of the water budget were estimated by the Brook90 hydrologic model [40], a parameter-rich model suitable for studying soil water movement on small plots. We ran the model only for the S5 site since daily precipitation and soil moisture measurements were available only here.
The water balance simulations were driven by daily meteorological data, as well as by soil water and canopy parameters.
Daily minimum and maximum air temperature, vapour pressure and wind speed were based on the above-described meteorological station data while daily precipitation data of a nearby (1 km distance) precipitation gauge was used. Since the difference in altitude between the meteorological station and the site S5 is only 60 m we did not correct the air temperatures with elevation. Global radiation was estimated from daily sunshine hours using the Angström formula [41].
We estimated the soil water parameters needed for the water retention and hydraulic conductivity curve from soil texture using the table of Clapp and Hornberger [42] modified by Federer et al. [40]. Soil texture and rock fragments were determined by sieving and hydrometer analysis of particle size distribution of the soil samples, taken from two different depths (0–30 and 30–50 cm). Soil texture of the site is silt loam with a significant large fraction of rock fragments in the deeper soil horizons.
For evapotranspiration calculations, the canopy data, maximum rooting depth and the leaf area index were determined by in situ observations. The maximum rooting depth was estimated as one meter since roots were found in the rocky layer below 50 cm. The canopy height of 12 trees (these trees were also used for dendrochronology analysis) was measured in each plot using a Vertex IV instrument (Haglöf, Långsele, Sweden). Five hemispherical images were taken in each site in June 2017 to estimate the leaf area index (LAI) with a Sony NEX-7 24M DSLR camera (Regent Instruments, Québec, QC, Canada). The images were processed with the WinSCANOPY software (Regent Instruments, Québec, QC, Canada) using the average of the available logarithmic LAI methods that compensate for clumping [43]. For the seasonal LAI, a 20% increase during summer was considered due to new needle development [44].
Finally, albedo and maximum leaf conductance were estimated from previous research on Black pine [45,46,47]. The list of modified variables of the Brook90 model is provided in the Supplementary Materials (Table S2).
To calibrate and validate the Brook90 model, soil water content was measured in four depths (10, 20, 30 and 60 cm) in the S5 site (Figure 1) with ECH2O EC-5 sensors (METER Group, Pullmann, WA, USA) between 7 March 2016 and 31 August 2017.
We used the year 2016 to calibrate and the year 2017 to validate the model. To avoid any initialization problem due to inaccurate initial soil water content, we ran the model from the starting year 1981. We started the comparison on 1 May 2016 to avoid any possible discrepancies at the beginning of the measurement due to disturbance of the soil profile during installation of the monitoring equipment.
Due to the practical difficulty of measuring in situ soil water potential, the measured soil water contents were used for an initial setting of the model by modifying iteratively the soil water parameters of each soil layer. After fixation of the soil water parameters we calibrated the model by minimizing the deviation between the modelled and measured soil water content for each soil depth using the evapotranspiration-sensitive maximum leaf and plant conductivity suggested by Federer et al. [40]. The calibrated values were then used for the validation and simulation periods.

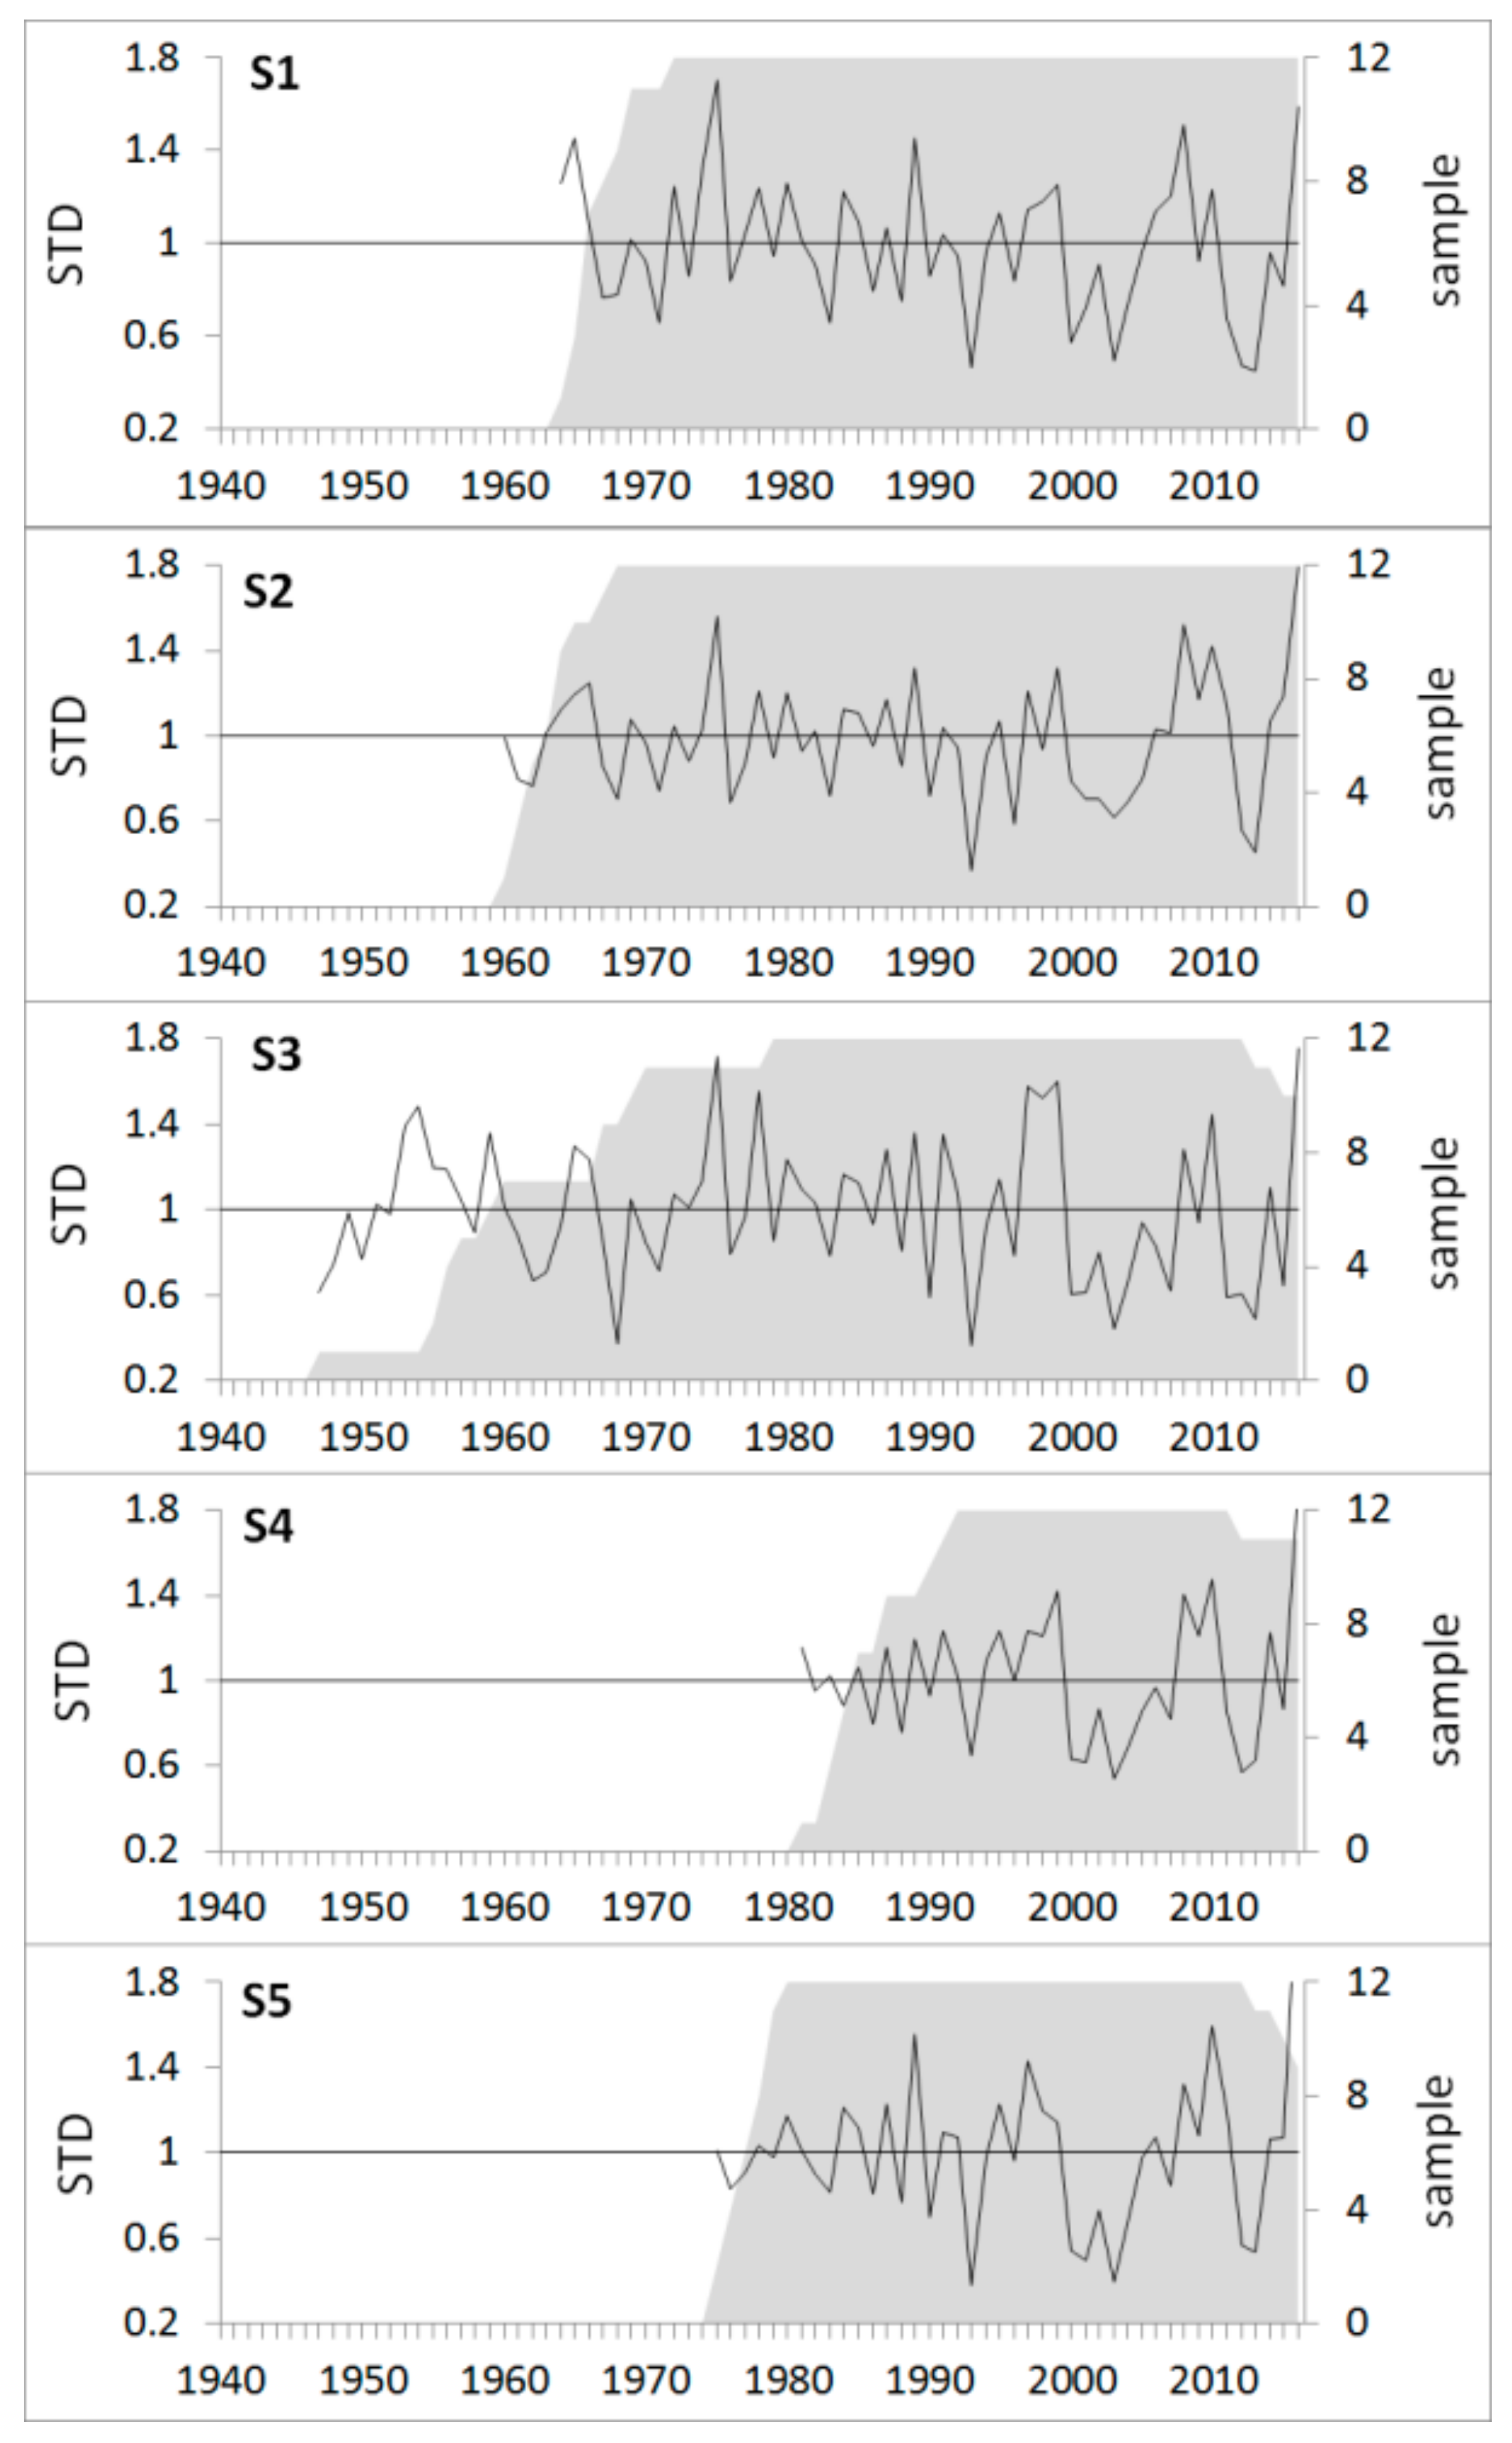
2.4. Dendrochronological Procedures

To establish local tree-ring-width chronologies, at each site 12 living dominant Black pine trees were cored (in total 60 cores) at 1.3 m height using a Pressler increment borer (Haglöf, Långsele, Sweden). Given that the studied stands have not been strongly disturbed by logging or wildfires within the last decades, sampling a few dominant trees was enough to obtain a reliable growth pattern. Since we were interested not specifically in the radial growth of individuals but in the mean chronology of the sites, a single core per tree was considered representative of that tree for dendrochronological analyses [48]. Additionally, the sampled trees had normal shape of stem thus we did not expect to have large differences among cores.
The cores were air-dried, glued onto wooden mounts and polished. First the wood samples were visually cross-dated [49]. Tree-ring widths (TRW) were measured on scanned images (1200 dpi) in WinDENDRO environment (Regent Instruments, Québec, QC, Canada) with a resolution of 0.001 mm. Cross-dating was statistically checked using the program COFECHA [50].
To remove age-related growth trends and highlight the inter-annual changes for climate-growth analysis, each cross-dated ring width series was detrended with a negative exponential curve [51] using the program ARSTAN [52]. With regard to the modest autocorrelation checked by the Akaike criterion (AIC), a standard version of chronologies was calculated as bi-weight robust mean of the individual series. The signal strength of index series was checked using the expressed population signal (EPS) statistics [53].

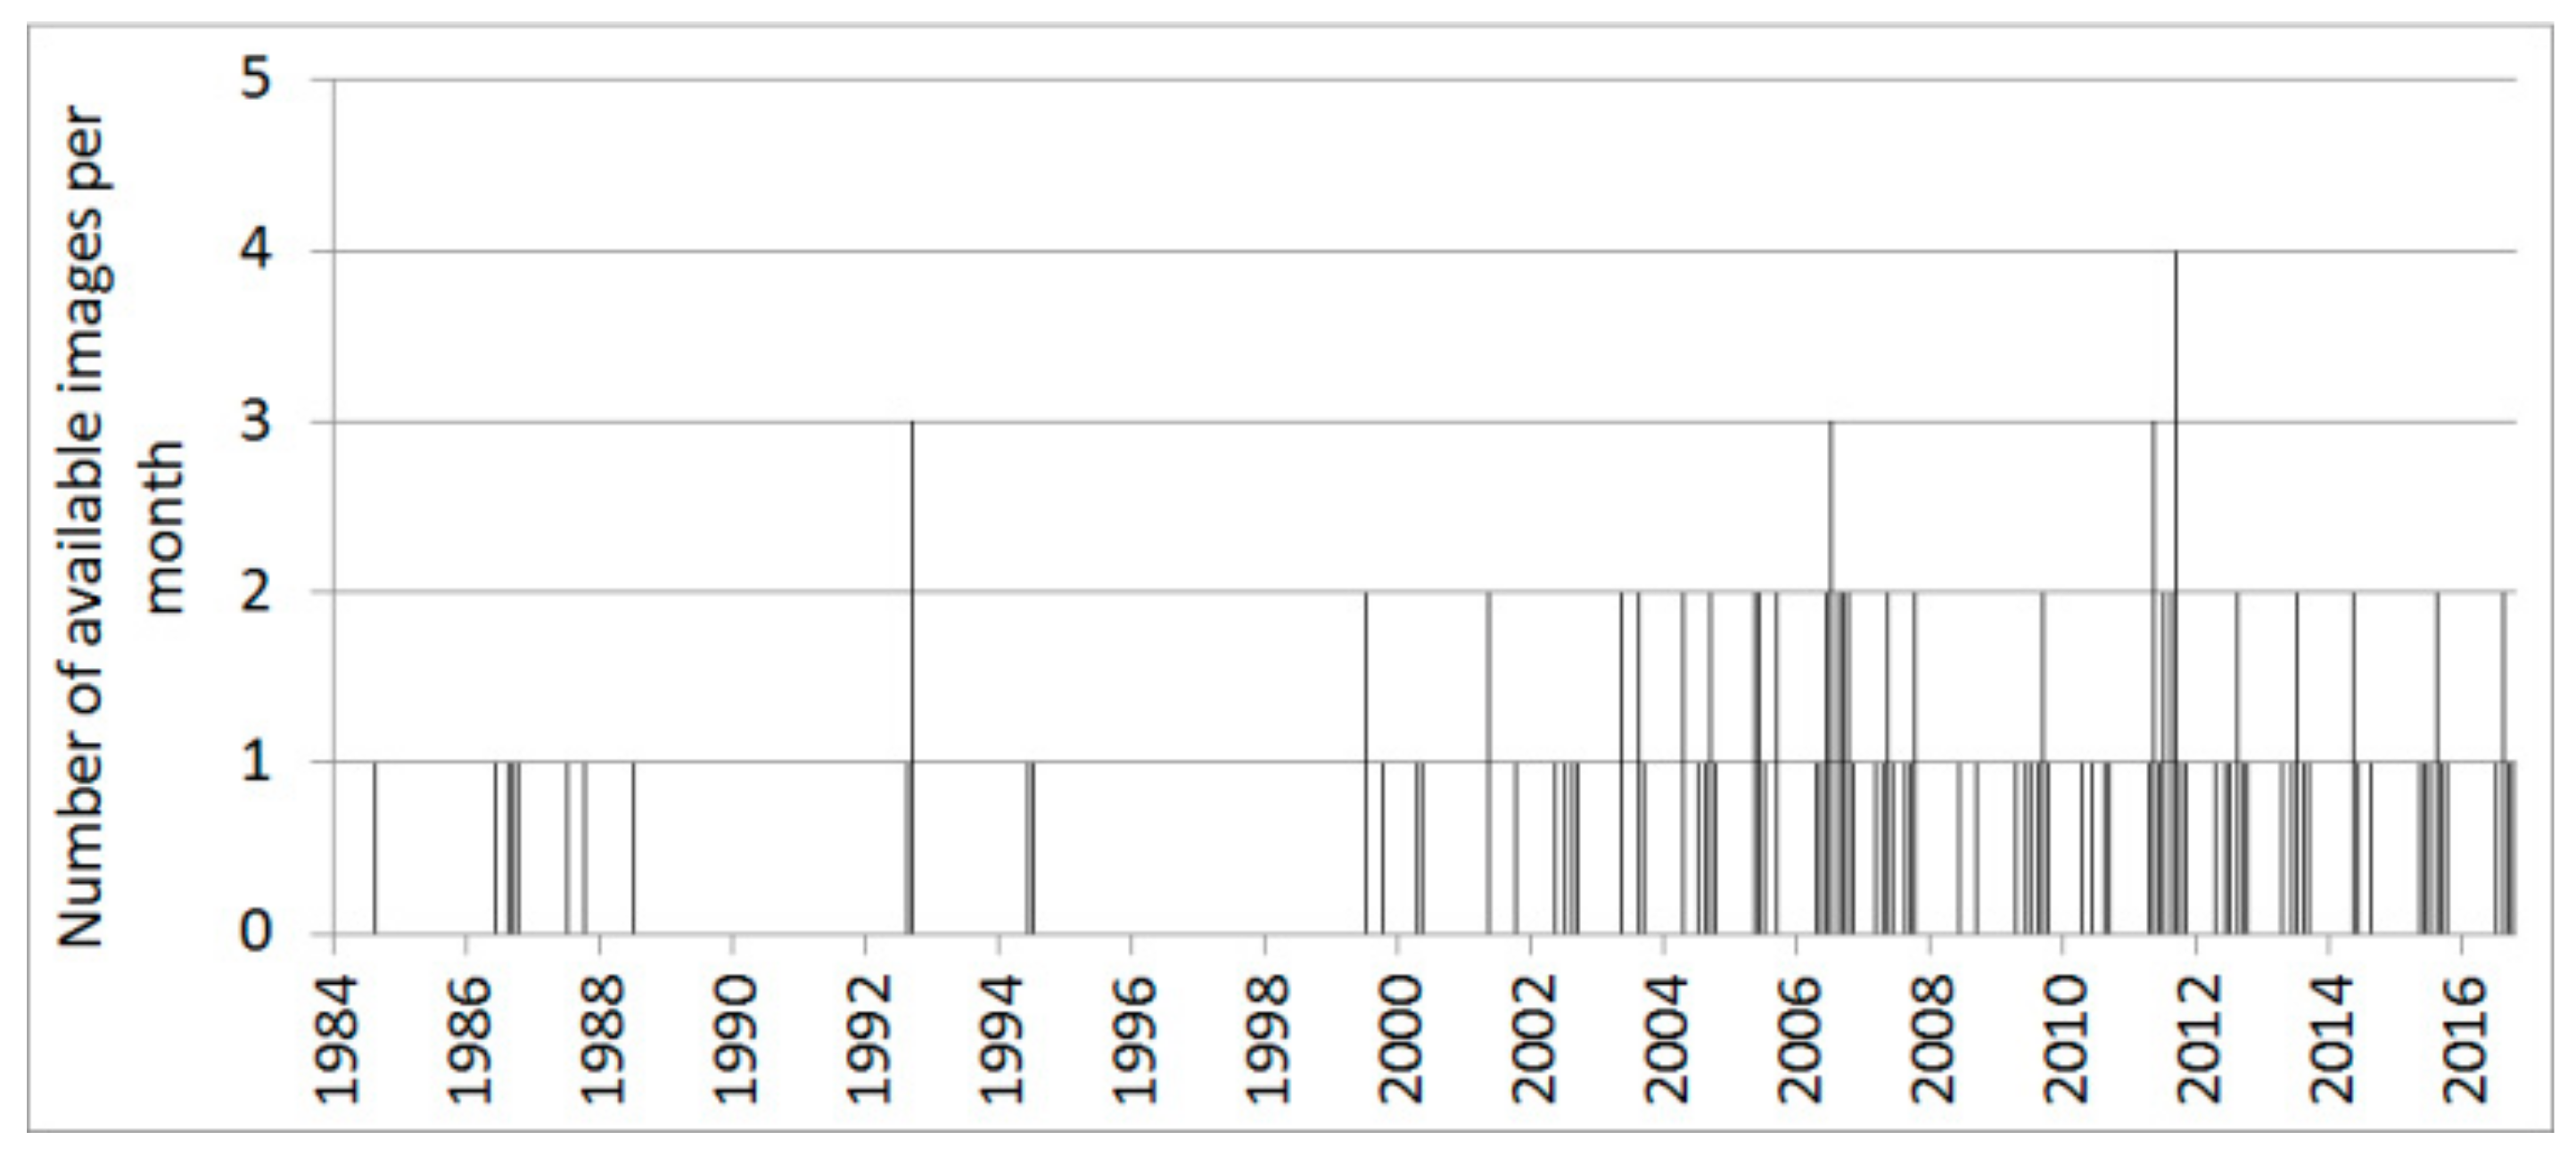
2.5. Remote-Sensing Data

Remote-sensing data was used to estimate changes in vegetation activity using NDVI and the normalized difference infrared index (NDII) developed by Hunt and Rock [54]. NDVI can be derived from spectral reflectance data (ρ) of red (R) and near infrared (NIR) channels as (ρNIR − ρRED)/(ρNIR + ρRED). NDVI was found to be a suitable index for indicating vegetation stress, particularly due to drought stress that controls leaf pigment control [55,56]. NDII is defined similarly to the NDVI, but using the shortwave infrared reflectance (ρSWIR) as (ρNIR − ρSWIR)/(ρNIR + ρSWIR). NDII can be used to detect water shortage using the property of shortwave infrared reflectance, which is negatively related to leaf water content due to the large absorption by the leaf e.g., [57,58].
Surface reflectance (SR) images were obtained from Landsat-5 and Landsat-7 satellites, and processed with LEDAPS atmospheric correction [59]. All the images were acquired from the United States Geological Survey (USGS) webpage [60]. We used 128 SR images (path 189/027) averaged monthly over the 1984–2016 period. The monthly number of cloud-free images was between 2 images in March and November and 24 images in August, respectively (Figure 4).
Fortunately, the low numbers occurred in months outside the summer period, so the corresponding biases did not affect the drought analysis.
We selected 9 Landsat pixels covering the selected stands (the extension of each pixel being 30 m × 30 m), all fully representing Black pine canopies, for computing the vegetation indices. We calculated the average value of the pixels for each site to reduce the pixel-by-pixel noise. To characterize overall conditions, long-term average values of the indices were calculated using pixels of all sites for each month of the year. For the drought analysis, we averaged the monthly values of the indices over the five sites for the drought years and these values were compared to the long-term averages.

2.6. Data Analysis

The performance of the water balance model was evaluated by comparing predicted and observed soil water content values for the calibration and validation periods using the root mean square error (RMSE).
Relationships among climate variables and growth patterns were assessed using the Pearson correlation coefficients as well as response-function analysis taking into account the inter-correlations between the climatic variables. The high correlation of standard chronologies between the sites allowed that the mean of all chronologies (46–60 trees, depending on the number of available trees) was used to calculate correlations with climate indicators covering the period 1981–2016. We analysed monthly meteorological data (temperature, precipitation) and derived indices (SPEI and REW) over the preceding 18 months from April of the previous year until September of the actual year of ring formation. Additionally we calculated multi-month precipitation sums, temperature means and REW averages for the periods June–August and annual values. Since FAI values were computed on annual basis we correlated these annual values with tree ring widths. The correlation of the selected variables with the radial growth of Black pine was compared and tested for significance using the method by Diedenhofen and Musch [61].
To highlight growth reaction to drought conditions we carried out a statistical analysis based on the results of the correlation analysis. The variable with the highest correlation was used to define drought years for Black pine since 1981. Years were considered drought years when they showed more than one standard deviation below the average conditions of the selected variable. Gazol et al. [62] found that a period of three years represents well the short-term growth response as for Pinus halepensis Mill., thus, short-term drought responses were quantified by comparing the growth during the drought event (which may last for several years) with the average growth three years after and before the drought event.
For the drought years or multi-year drought periods we calculated four indices of drought reaction (resistance, recovery, resilience and relative resilience) following Lloret et al. [63]. Resistance means that the trees are able to withstand a drought without showing a drop in ring width, thus, it can be computed as a ratio of ring widths during and before a drought period. Recovery can be characterized as the ability to restore from drops during the drought and given by the ratio of ring width after and during the drought period. Resilience describes the capacity to reach pre-episode growth levels and is computed by the ratio of ring width after and before the drought period. Finally, relative resilience indicates whether the effects of drought still persist after disturbance and how quickly trees able to recover to pre-drought level and is computed as follows: ((ring width after drought − ring width during a drought)/ring width before a drought period).
We tested if the values of the vegetation indices during selected drought years differ significantly from the mean monthly values of NDVI and NDII. Relations of the mean monthly values of the indices to tree ring width were analysed using correlation analysis.
All statistical analyses were done using the R statistical software [39].

3. Results and Discussions

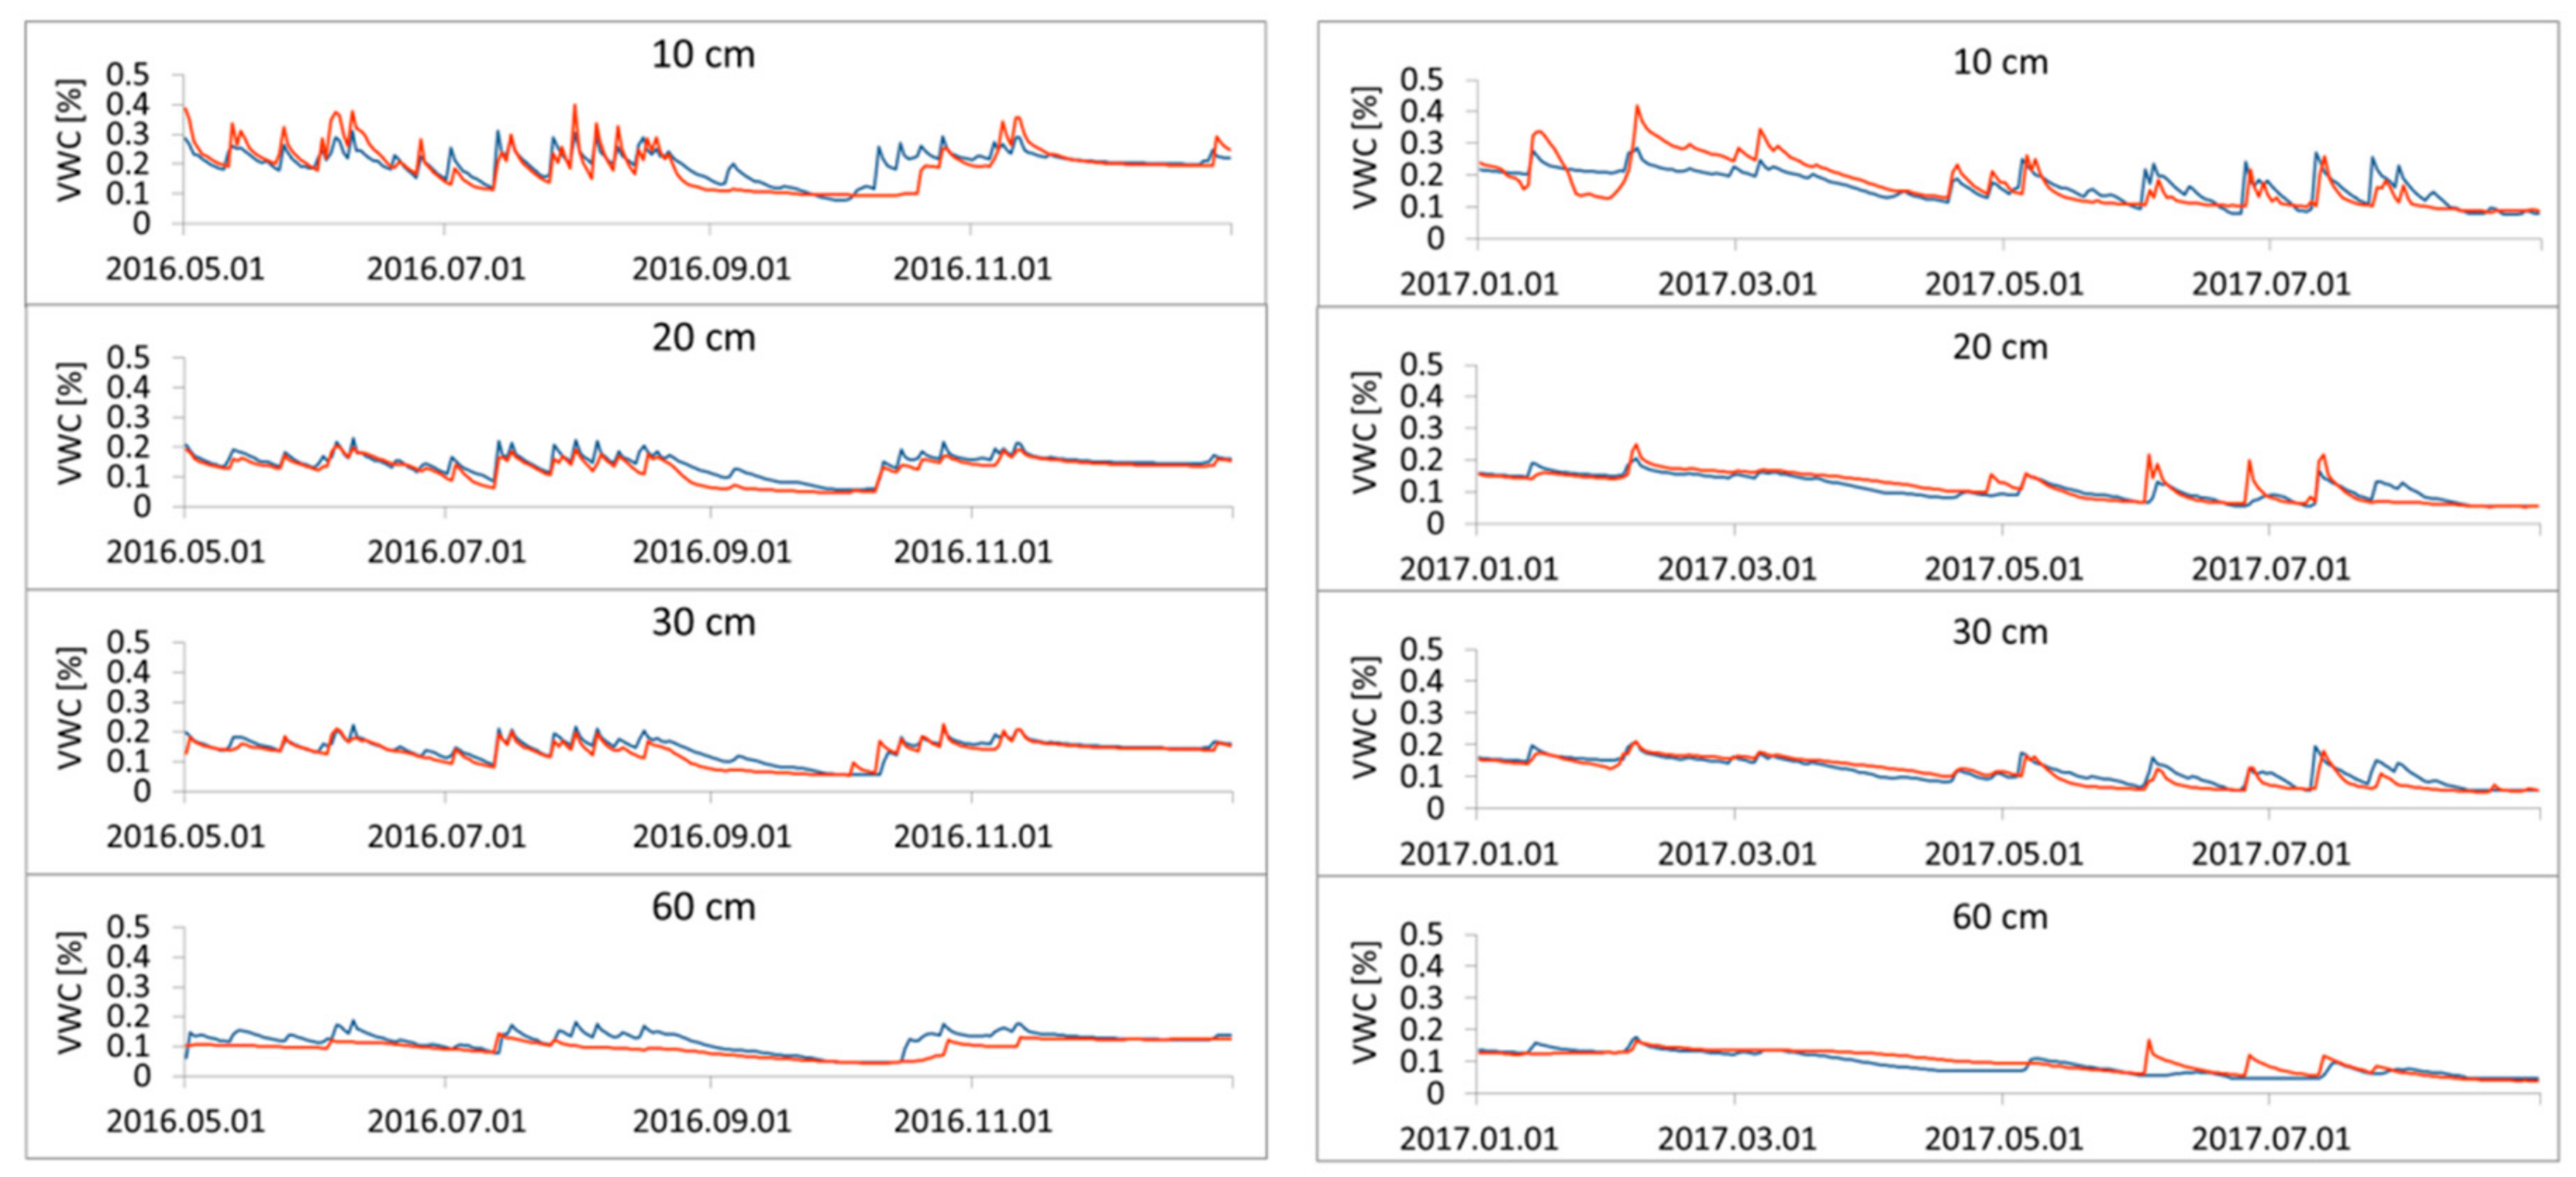
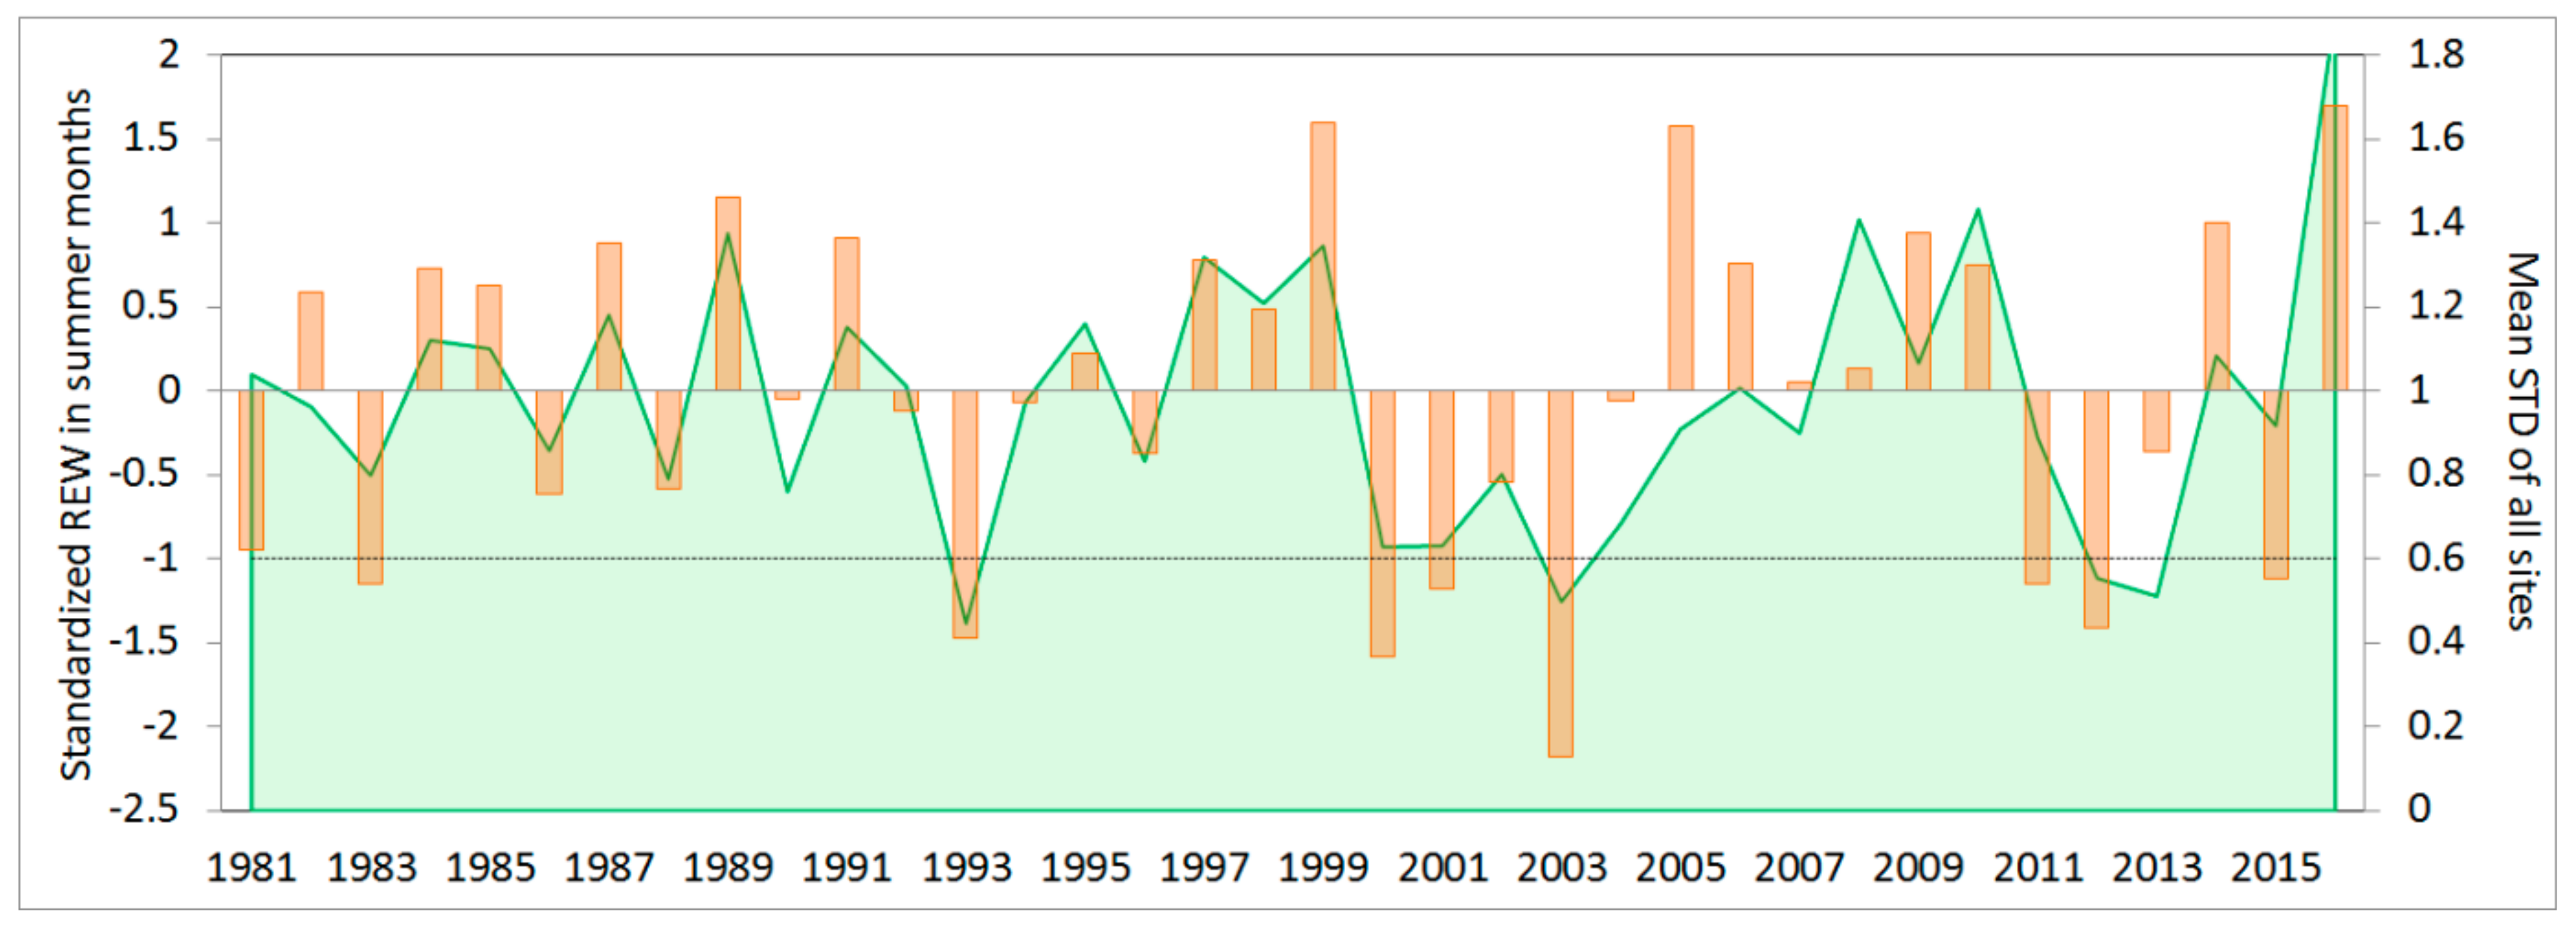
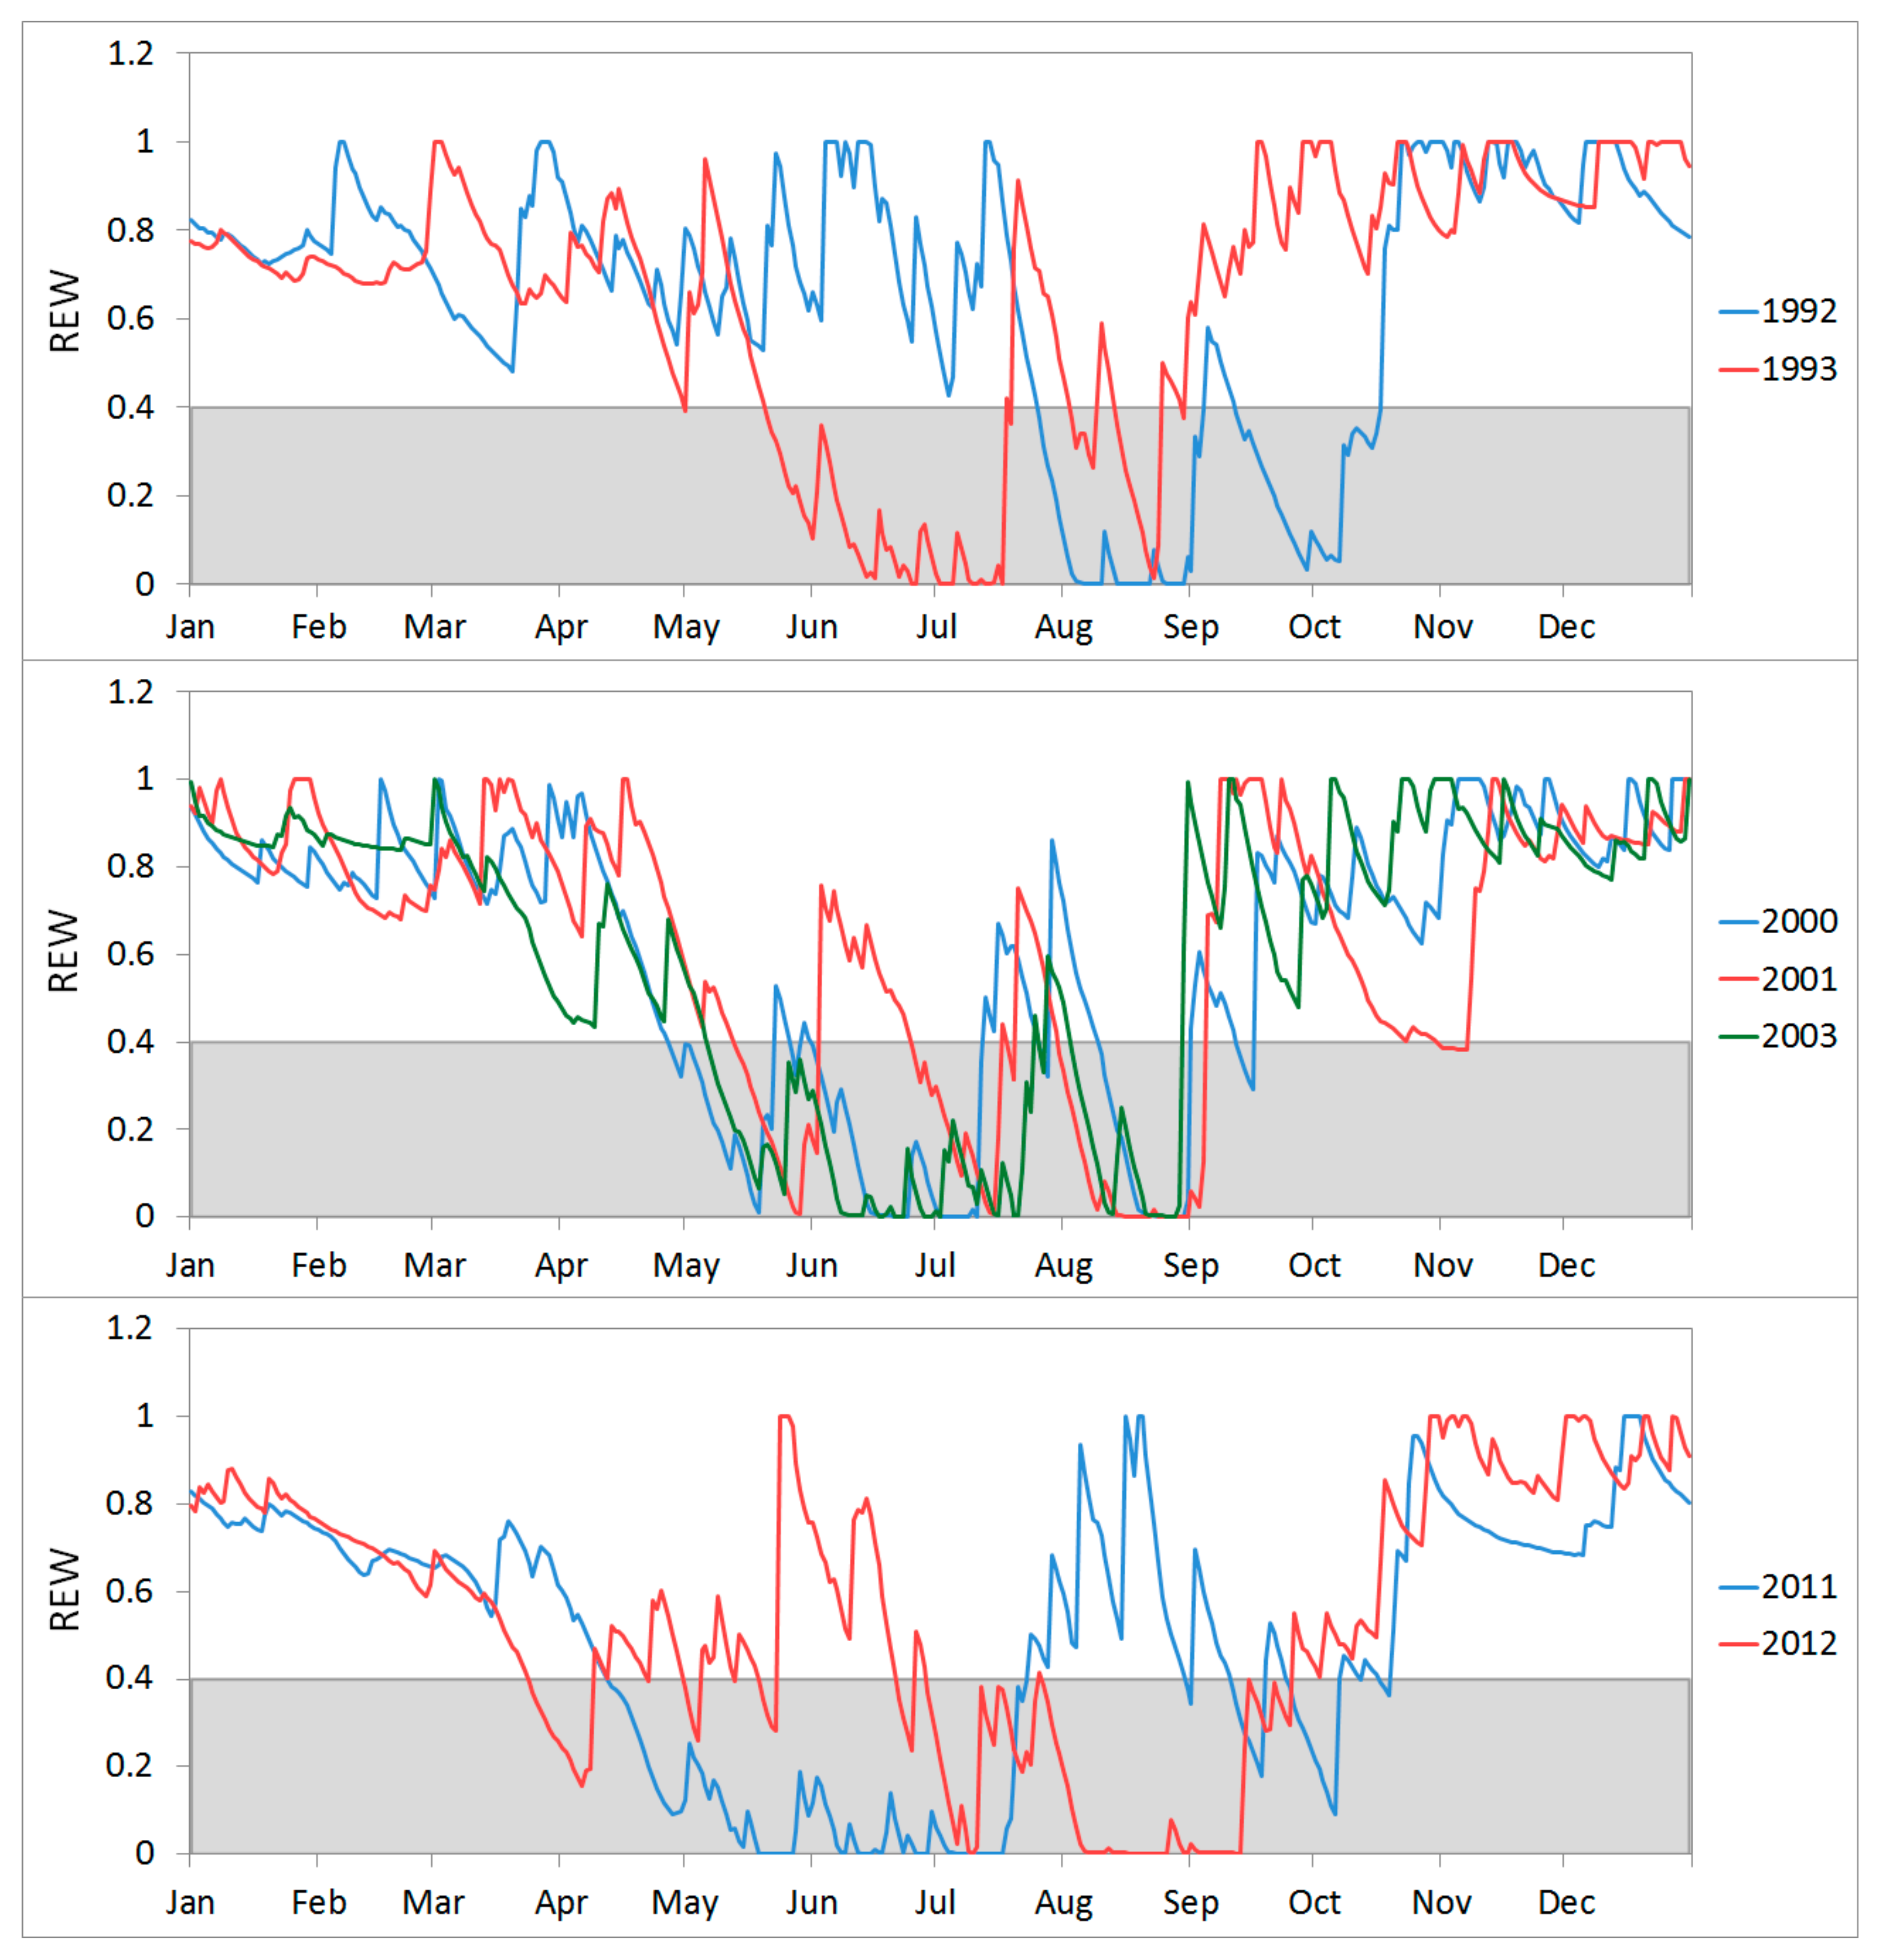
3.1. Simulation of Relative Extractable Water (REW) Using the Brook90 Model

The soil water contents corresponded well with observations in all depths both for the calibration and validation periods (Figure 5).
The mean RMSE was 0.036 in VWC for the calibration period while in the validation phase it was 0.029 in VWC, and thus the model could be considered to predict soil moisture changes sufficiently well. There are, however, numerous obstacles that need to be overcome to gain reasonable confidence in a water balance simulation. For instance, maximum rooting depth was hardly determinable due to the rocky subsoil below 50 cm depth. In the model we set this to 1 meter depth that could lead to an overestimation of the soil water storage capacity by 40% as opposed to the 50cm rooting depth. However, we prepared a supplementary investigation that revealed that this bias did not influence the mean REW value by more than 1% and, thus, had minimal impacts on the results of our climate-growth analysis. The short calibration/validation time periods and the location of precipitation data being at some distance from the study sites may further increase uncertainty for the estimation of REW. Nevertheless, the model validation in the hot and dry year 2017 implied that the model was able to sufficiently predict the soil water content even during drought conditions, and thus the derived REW values could be used for further analysis.

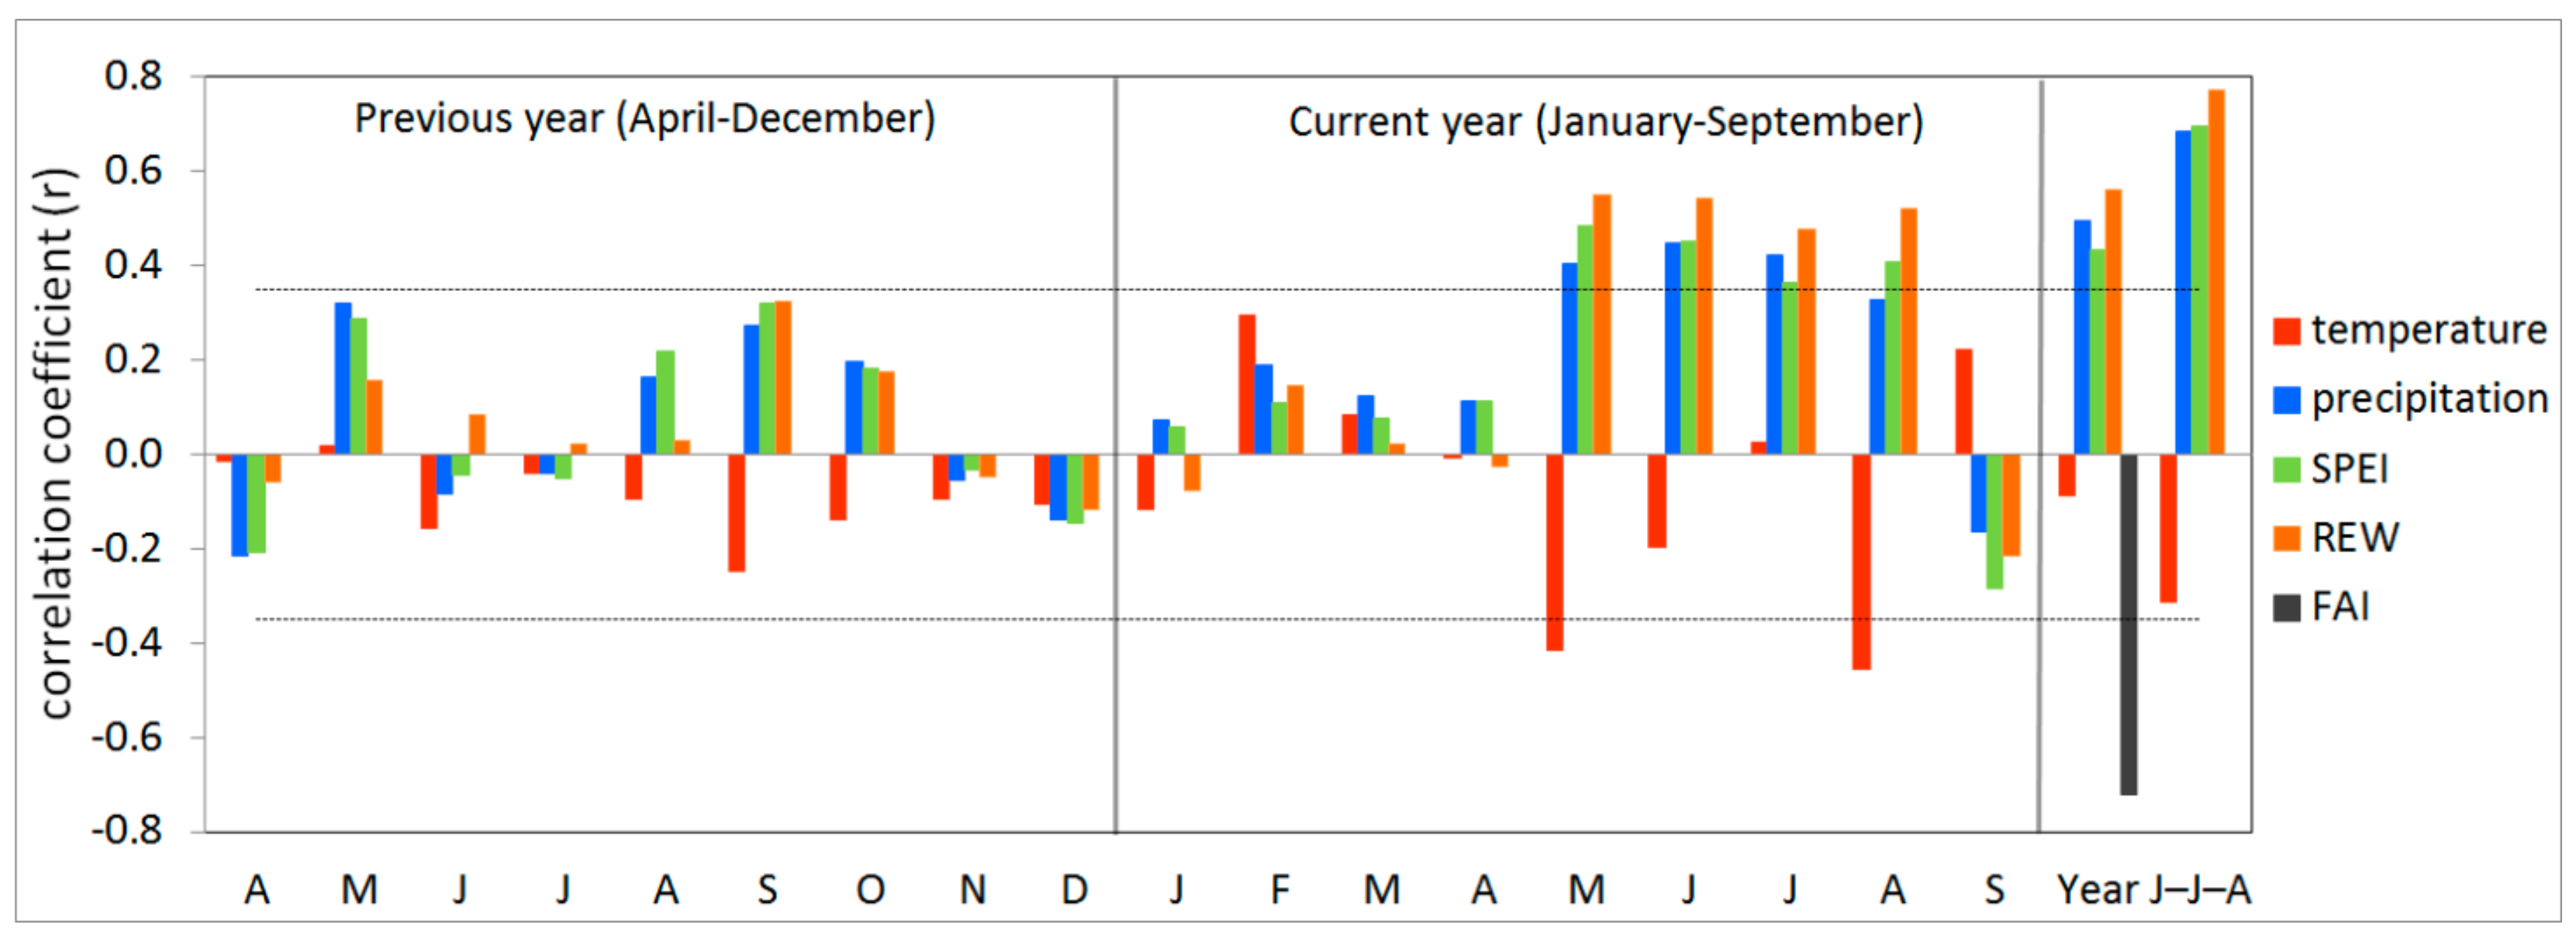
3.2. Climate-growth Relationship

Cross-dating was done with a mean inter-chronology correlation of 0.65 of the detrended series (Table 2). The values of the mean sensitivity (MS) suggested a high responsiveness of growth to climate. For all chronologies, the mean values of EPS were between 0.94 and 0.97, which exceeded the generally accepted threshold of 0.85 indicating that the selected population in each site is well characterized [53].
The Pearson correlations between the standard chronologies (Figure 6) of the sites showed high similarity in the range of r = 0.78−0.90.
Pearson’s correlation coefficients between meteorological variables and annual ring widths were highest from May to August of the current year of ring formation (Figure 7).
The mean REW of the current year summer (J–J–A) had significant influence on growth variation with the highest correlation coefficient of r = 0.77. The FAI showed the second highest correlation that was specifically designed to evaluate the climatic limitation of growth. Positive correlations with summer precipitation along with the negative dependency from summer temperature (r = −0.31) identify soil moisture availability during summer months as the main factor controlling tree ring width. The comparison of variables revealed that the REW did not explain significantly more of the inter-annual growth variations than the FAI (r = −0.72), SPEI (r = 0.69) or even the precipitation of the summer months (r = 0.68). This implies that the summer precipitation of the current year is the single most important factor affecting tree growth, which in turn is a consequence of the low soil water storage capacity in our study sites substantially diminishing the effect of meteorological conditions in the previous months. The temperature showed significant negative correlations in May and August of the current year being an important factor in summer moisture availability, as also suggested by e.g., Fyllas et al. [64].
The correlation analysis showed that weather conditions of the current year are responsible for the major part of the growth signal in interannual growth variations. Therefore we conducted the response-function analysis only for the present year that supported the results of correlation analysis by identifying the precipitation, the SPEI and the REW of June as the most significant (Figure 8).
In general, our results correspond to other studies describing spring/summer moisture availability as the main climatic driver of Pinus nigra growth in the Mediterranean [65,66,67,68,69,70,71,72].

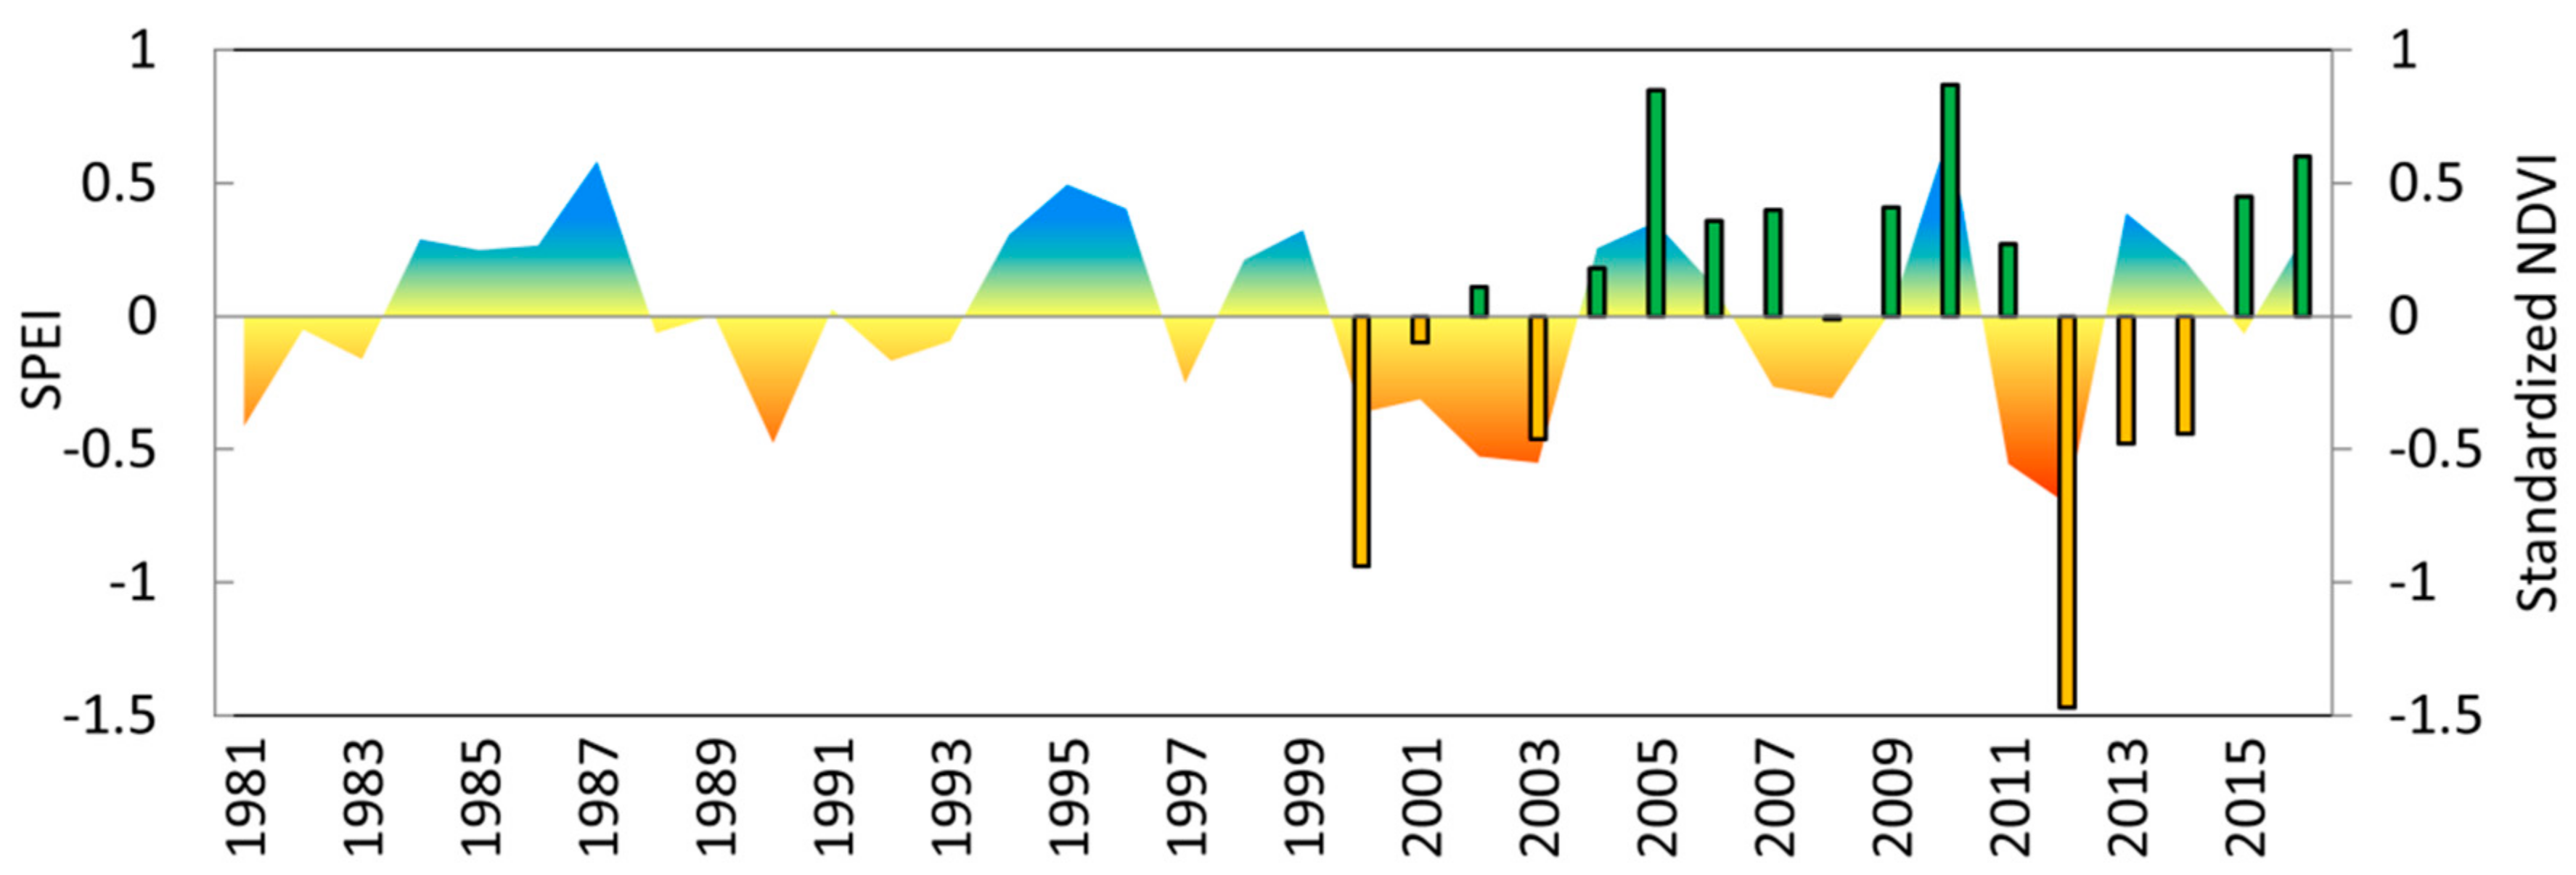
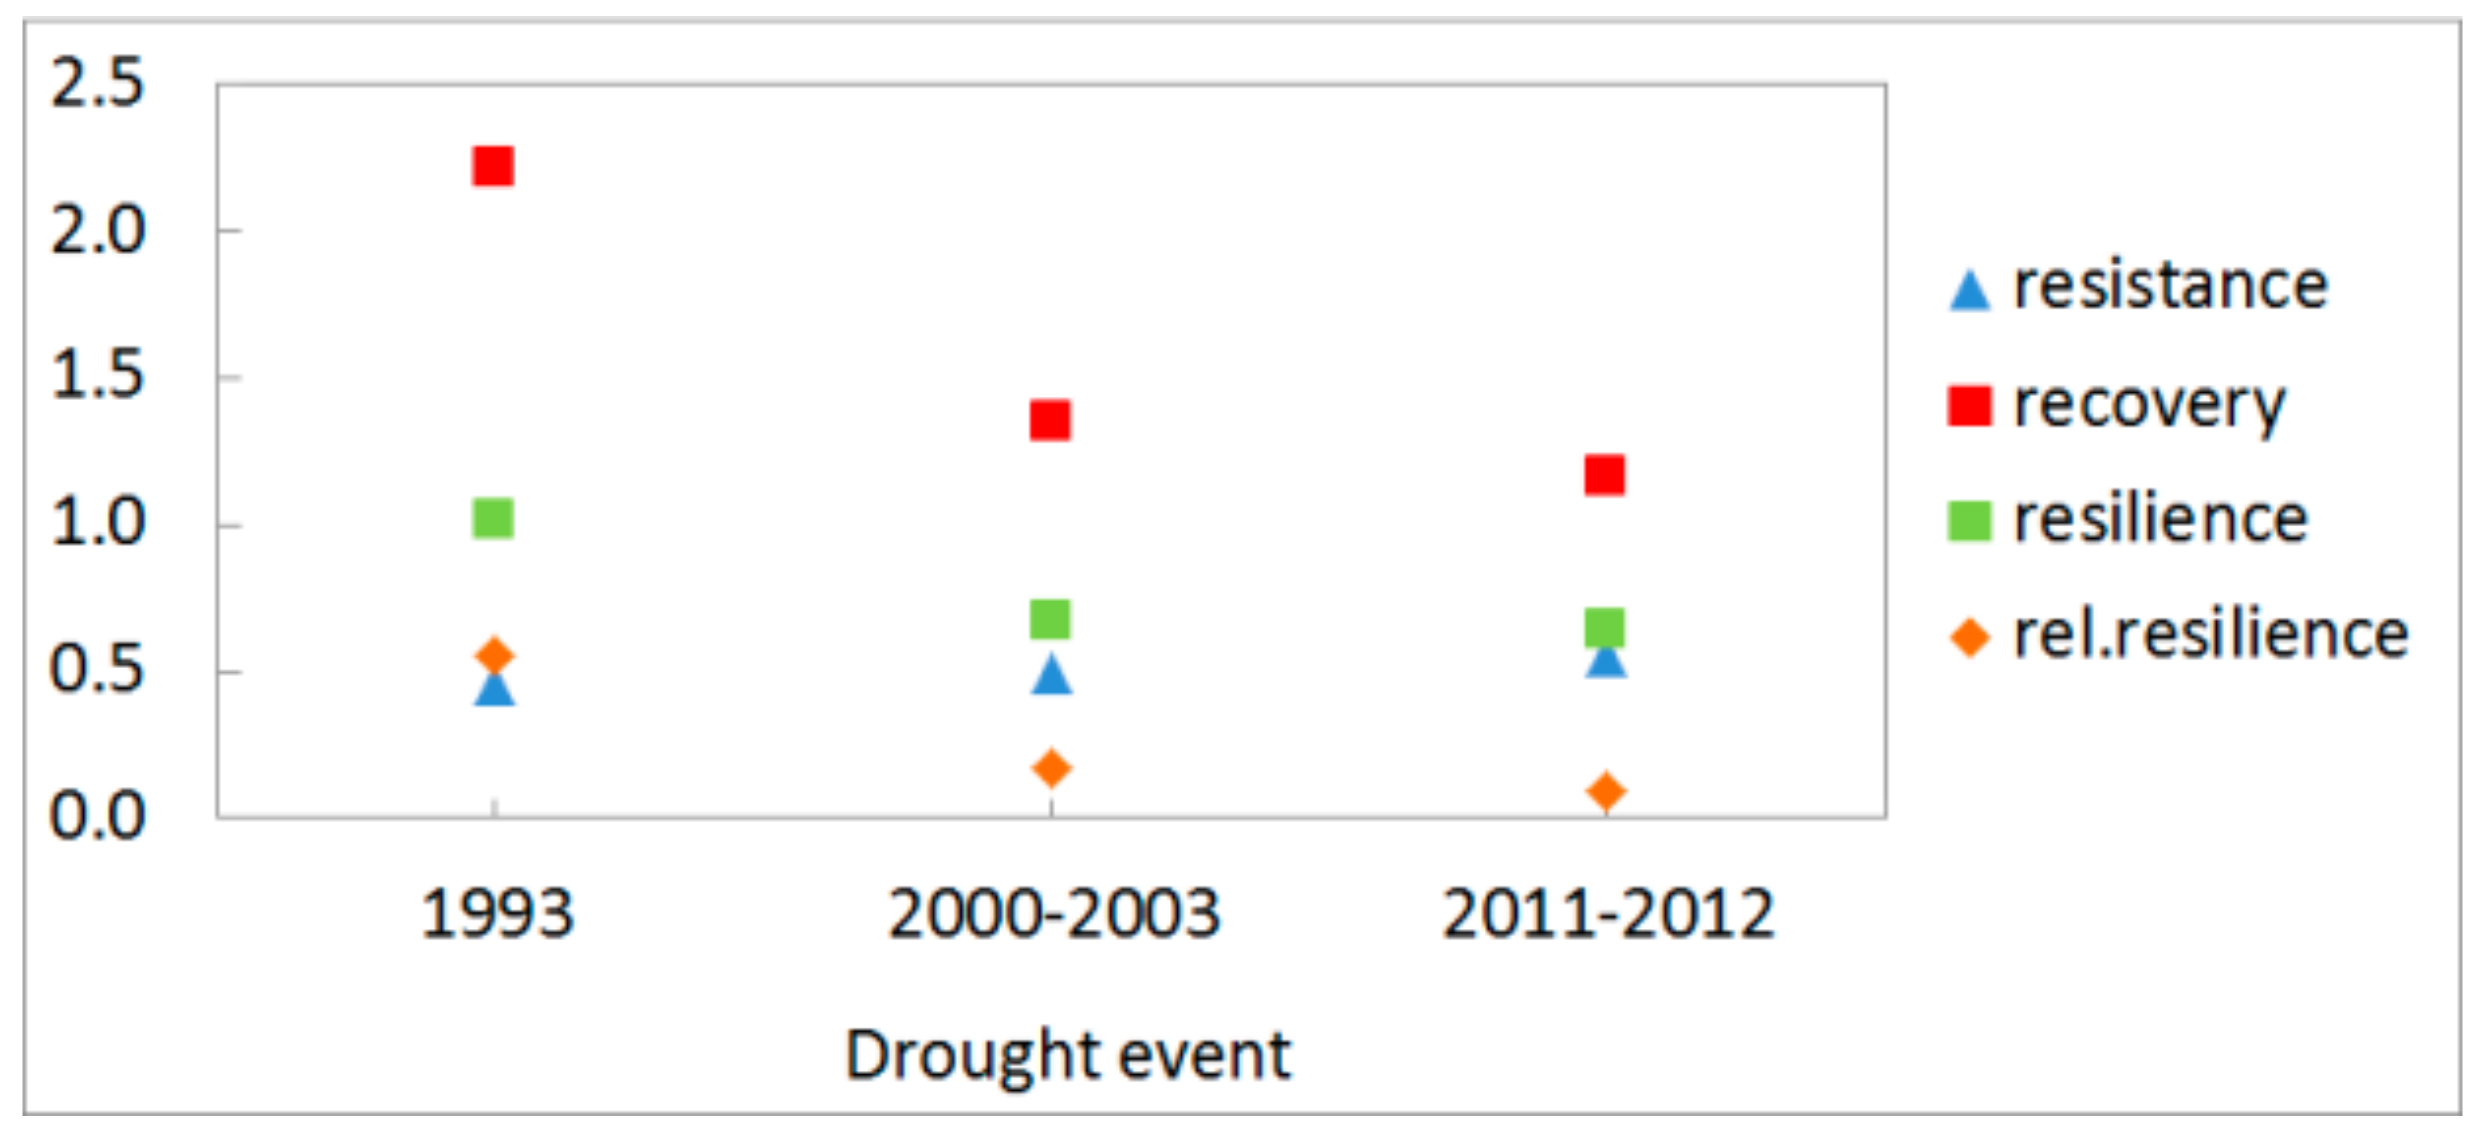
3.3. Growth Response to Droughts

Drought for Black pine was defined using REW, since the mean REW of the summer months showed the highest relationship with growth. We considered a year as drought-affected if the REW of the summer months was by more than one standard deviation lower than the mean. In the period 1981–2016 we found eight such years, two of them appeared at the beginning and at end of the time series (1983 and 2015). These two droughts could not be included in the analysis because climate data of neighbouring years was incomplete; thus, the calculations of pre- and post-drought periods were not possible. Since the drought 2000 was closely followed by the droughts in 2001 and 2003 we considered the period 2000–2003 as a multi-year drought period to avoid overlapping of the pre- and post-drought periods. Although the year 2002 was not a drought year by definition, we included it in the multi-year drought period since the REW was also below the long-term mean in this year’s summer. Similarly, the years 2011 and 2012 could be also interpreted as a multi-year drought event. The defined droughts showed much coincidence with reduced growth of trees (Figure 9).
The daily analysis of REW revealed important characteristics of the drought years. The drought in 1993 can be characterized as an early summer drought event that was preceded with a late summer drought in 1992 (Figure 10).
Tree ring width did not respond remarkable in 1992, since the extractable soil water was relatively high until August. In contrast, significantly reduced growth appeared in 1993. The trees were able to cope with this event that was verified by the high recovery value and also by the resilience value of close to one (Figure 11).
The prolonged multi-year drought event 2000–2003 had severe negative consequences for tree growth (Figure 10). The radial tree growth in 2000 reacted by a large drop from high values in 1999. The temporary better conditions in 2002 led to a slight improvement in growth. The drought characteristic in 2003 was similar to the drought in 2000 in terms of temporal REW changes during the year, but it was the most severe in the analysed period. The recovery dropped sharply after this event and the resilience value below one indicated that the effect of drought was still persisting for years (Figure 11). Due to the legacy effect of drought the trees were able to recover pre-drought relative growth rates three years after the drought event (Figure 9). This agrees well with other studies on Black pine [16,19,65] who found a recovery two to three years after severe drought episodes. The legacy effect can be caused by severe drought stress through hydraulic deterioration [4,5,72].
The drought in 2011–2012 was severe in terms of very long rainless periods (total number of consecutive days with less than 5 mm precipitation per day) that reached almost 50 days in late summer of 2012. This may have exceeded the ability of trees to tolerate water shortages and triggered a mass mortality of Black pine in the study area by a (secondary) fungal pathogen attack [22]. Similar abrupt mortality of pines has been described by several authors [66,70,73] where droughts in combination with unfavourable site conditions initiated mortality episodes through additional stressors such as defoliation by fungal pathogens. The values of recovery and relative resilience dropped again from the values of the period 2000–2003 implying that the further decline in growth could be the superimposed effect of previous droughts (Figure 11).
Since 2015 was again a drought year (Figure 9) that influenced the calculation of the response measures for the drought 2011–2012, we conducted a supplementary analysis with 2 and 4-years pre-and post-periods of the selected droughts. This showed very similar results to the applied 3-year period and thus reinforced the results of our analysis. The mean tree-ring widths (standardized chronologies) before, during and after the drought events are provided in the Supplementary Materials (Table S3). Unfortunately, due to the nature of the standardization method the tree-ring width of the last analysed year 2016 was less reliable. Since this heavily influenced the calculation of the 4-year post-drought period after 2011–2012, this calculation was omitted.
In general, our results are consistent with those that found Black pine to be sensitive to summer drought [65,69,74,75,76].

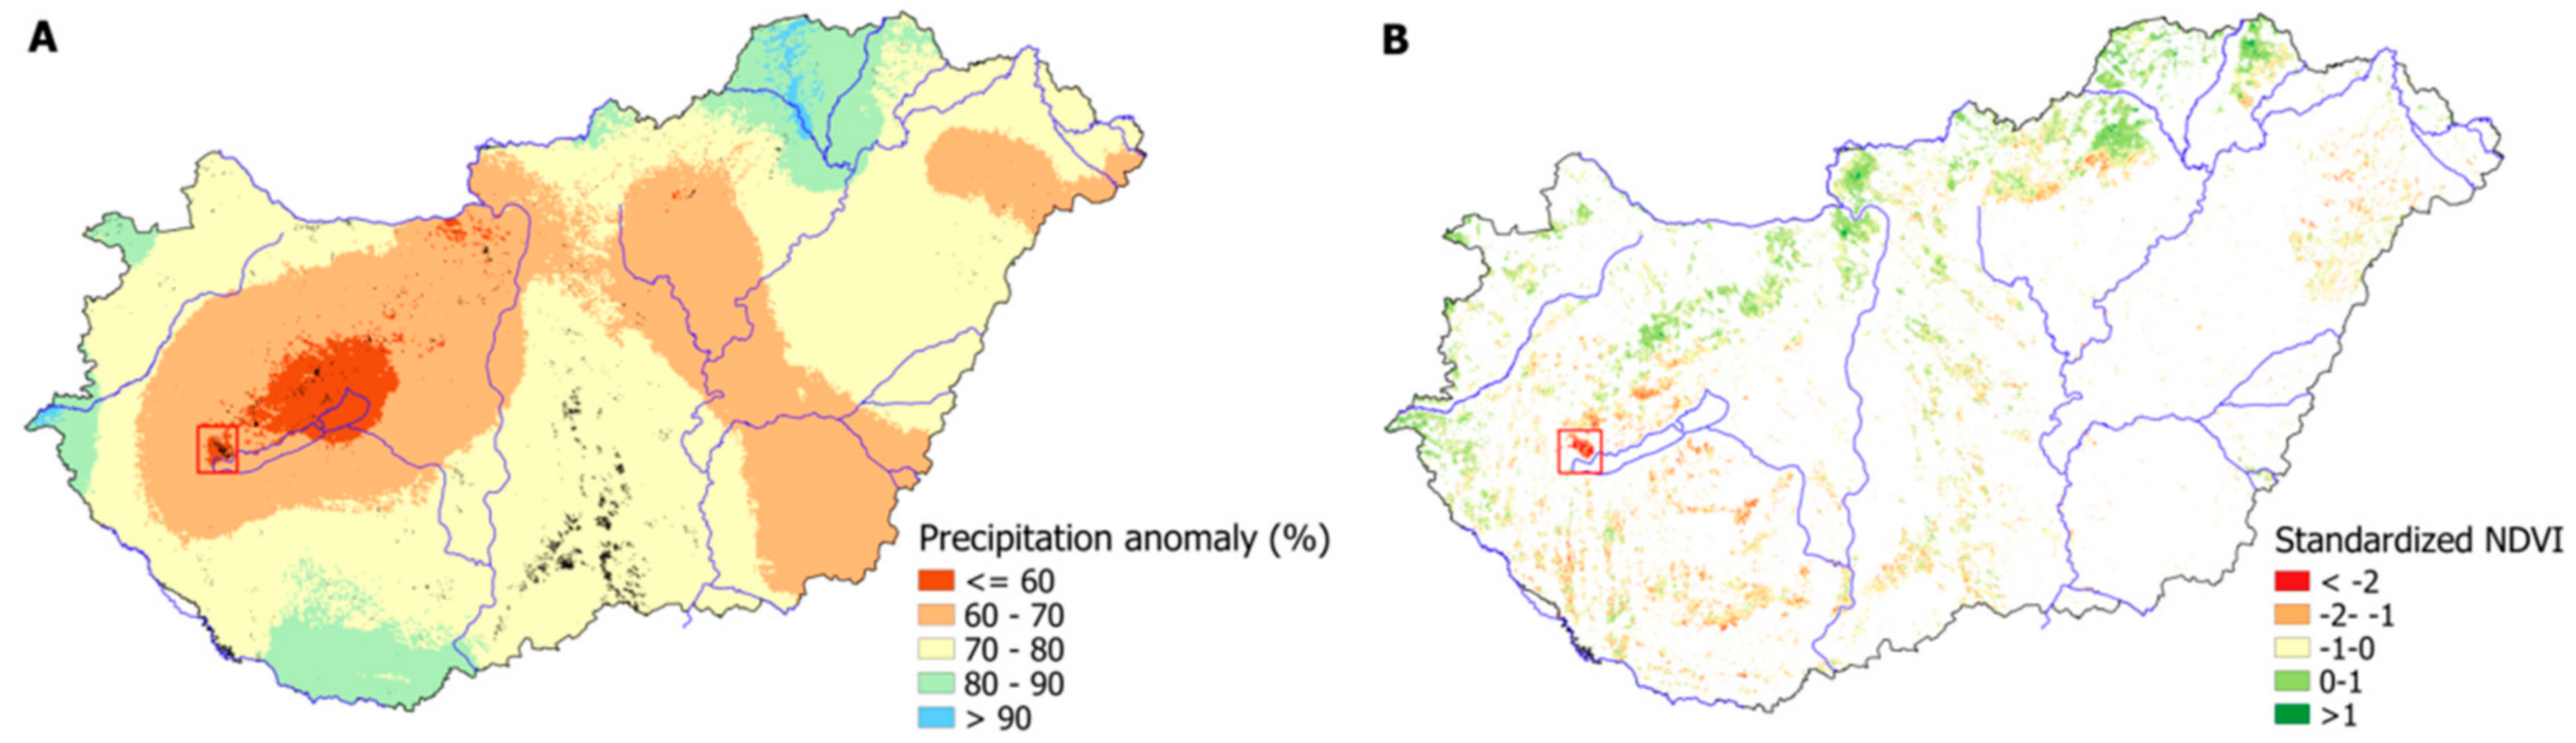
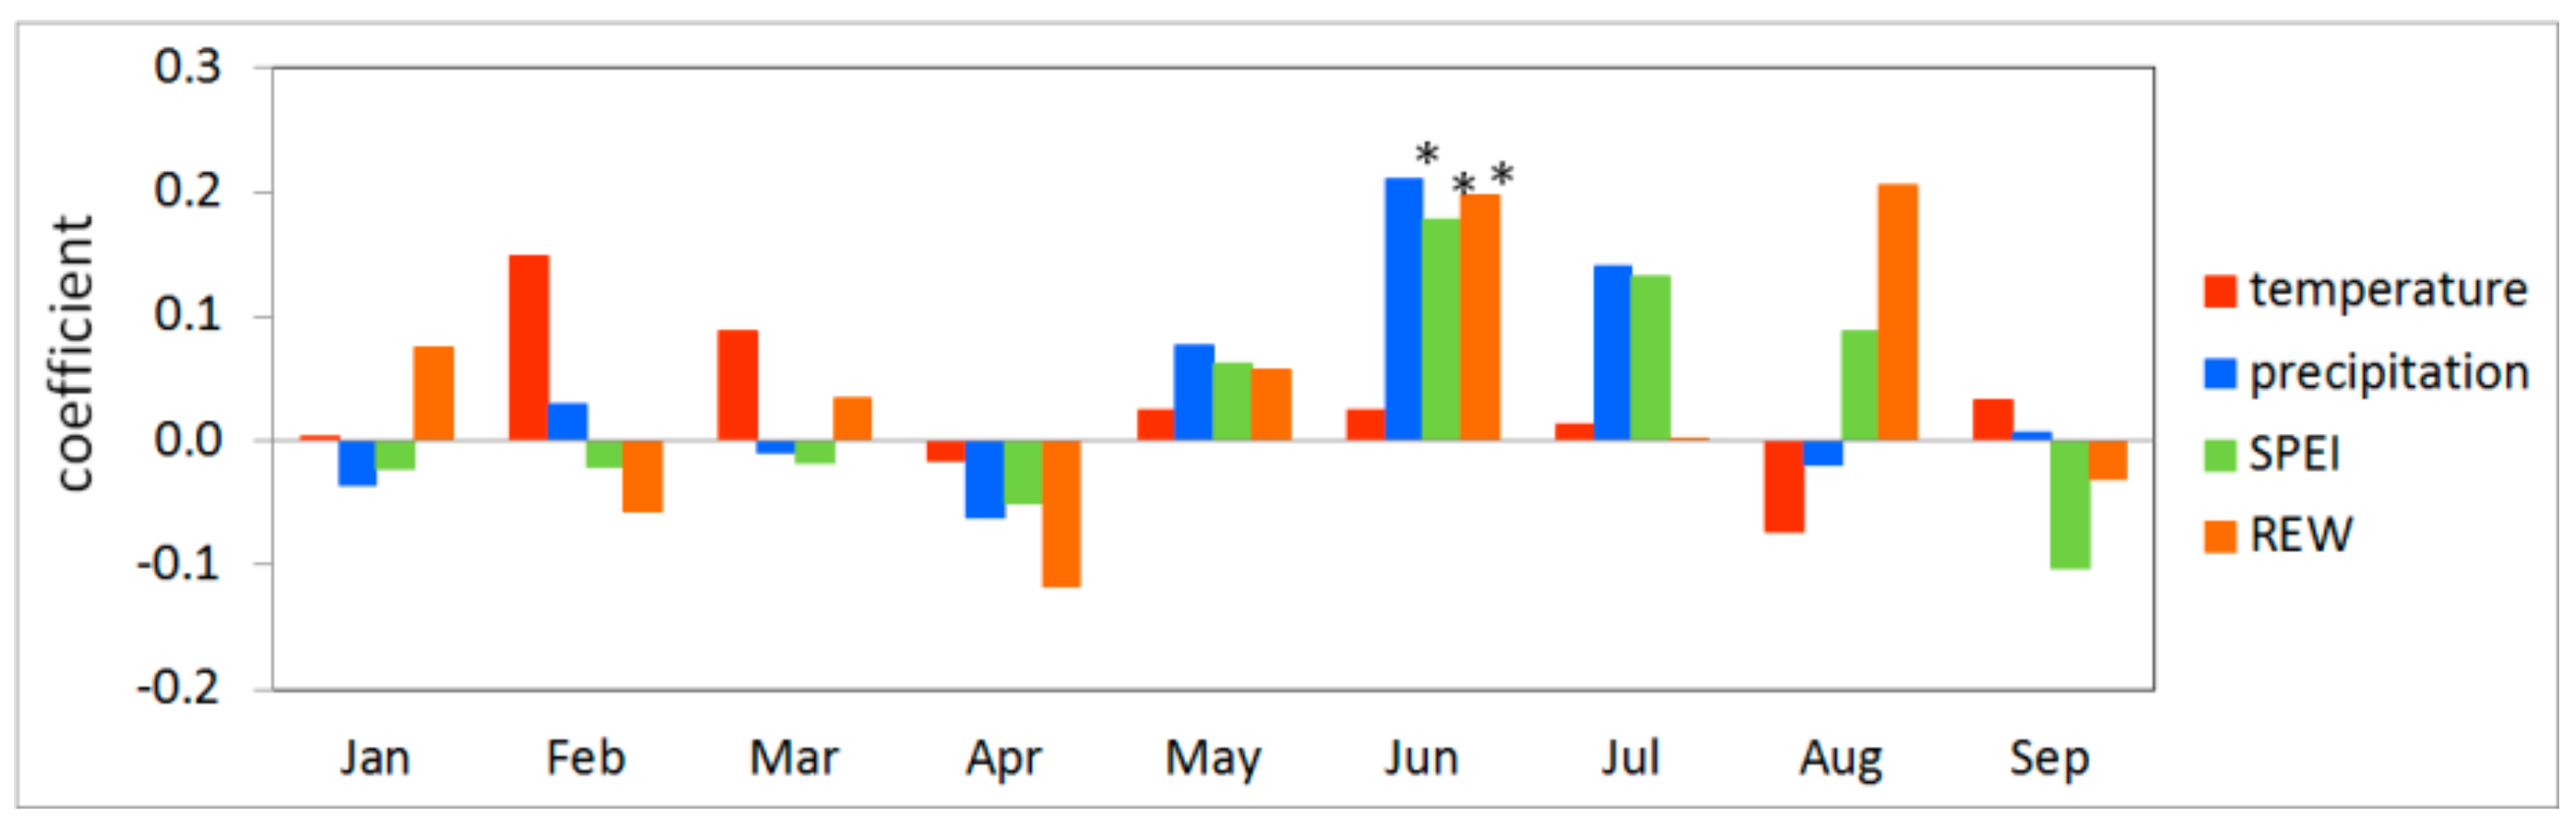
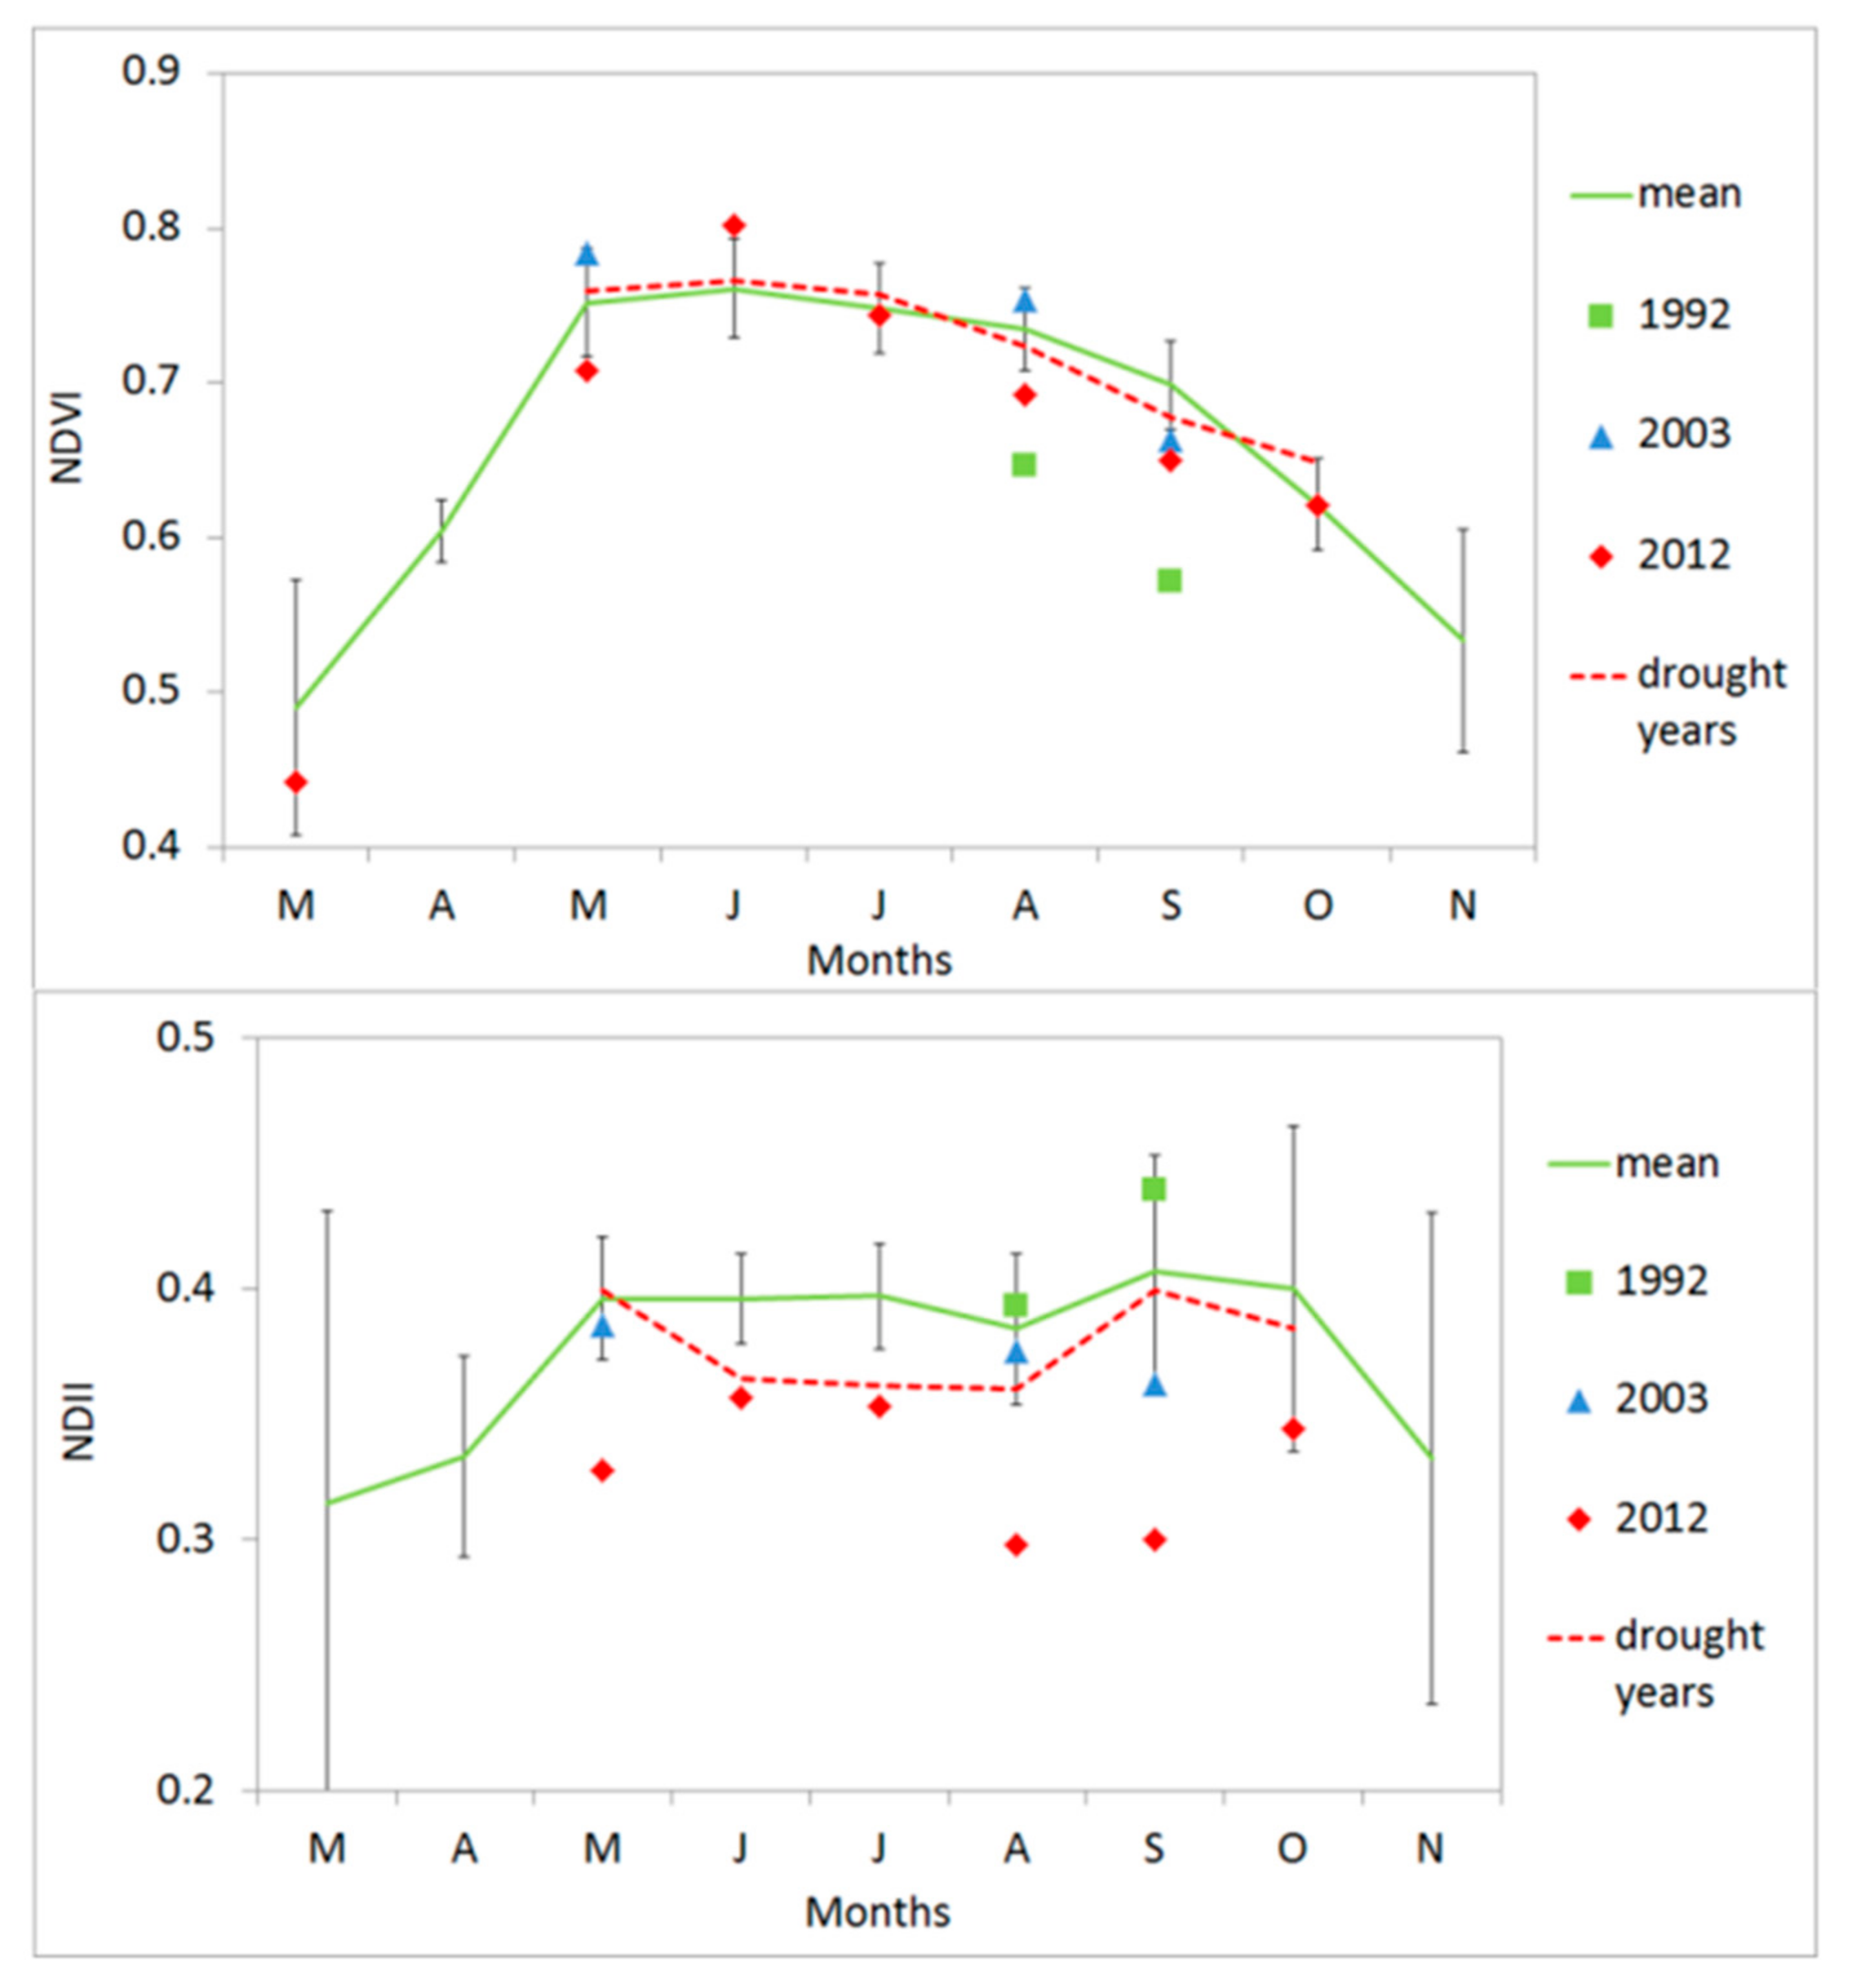
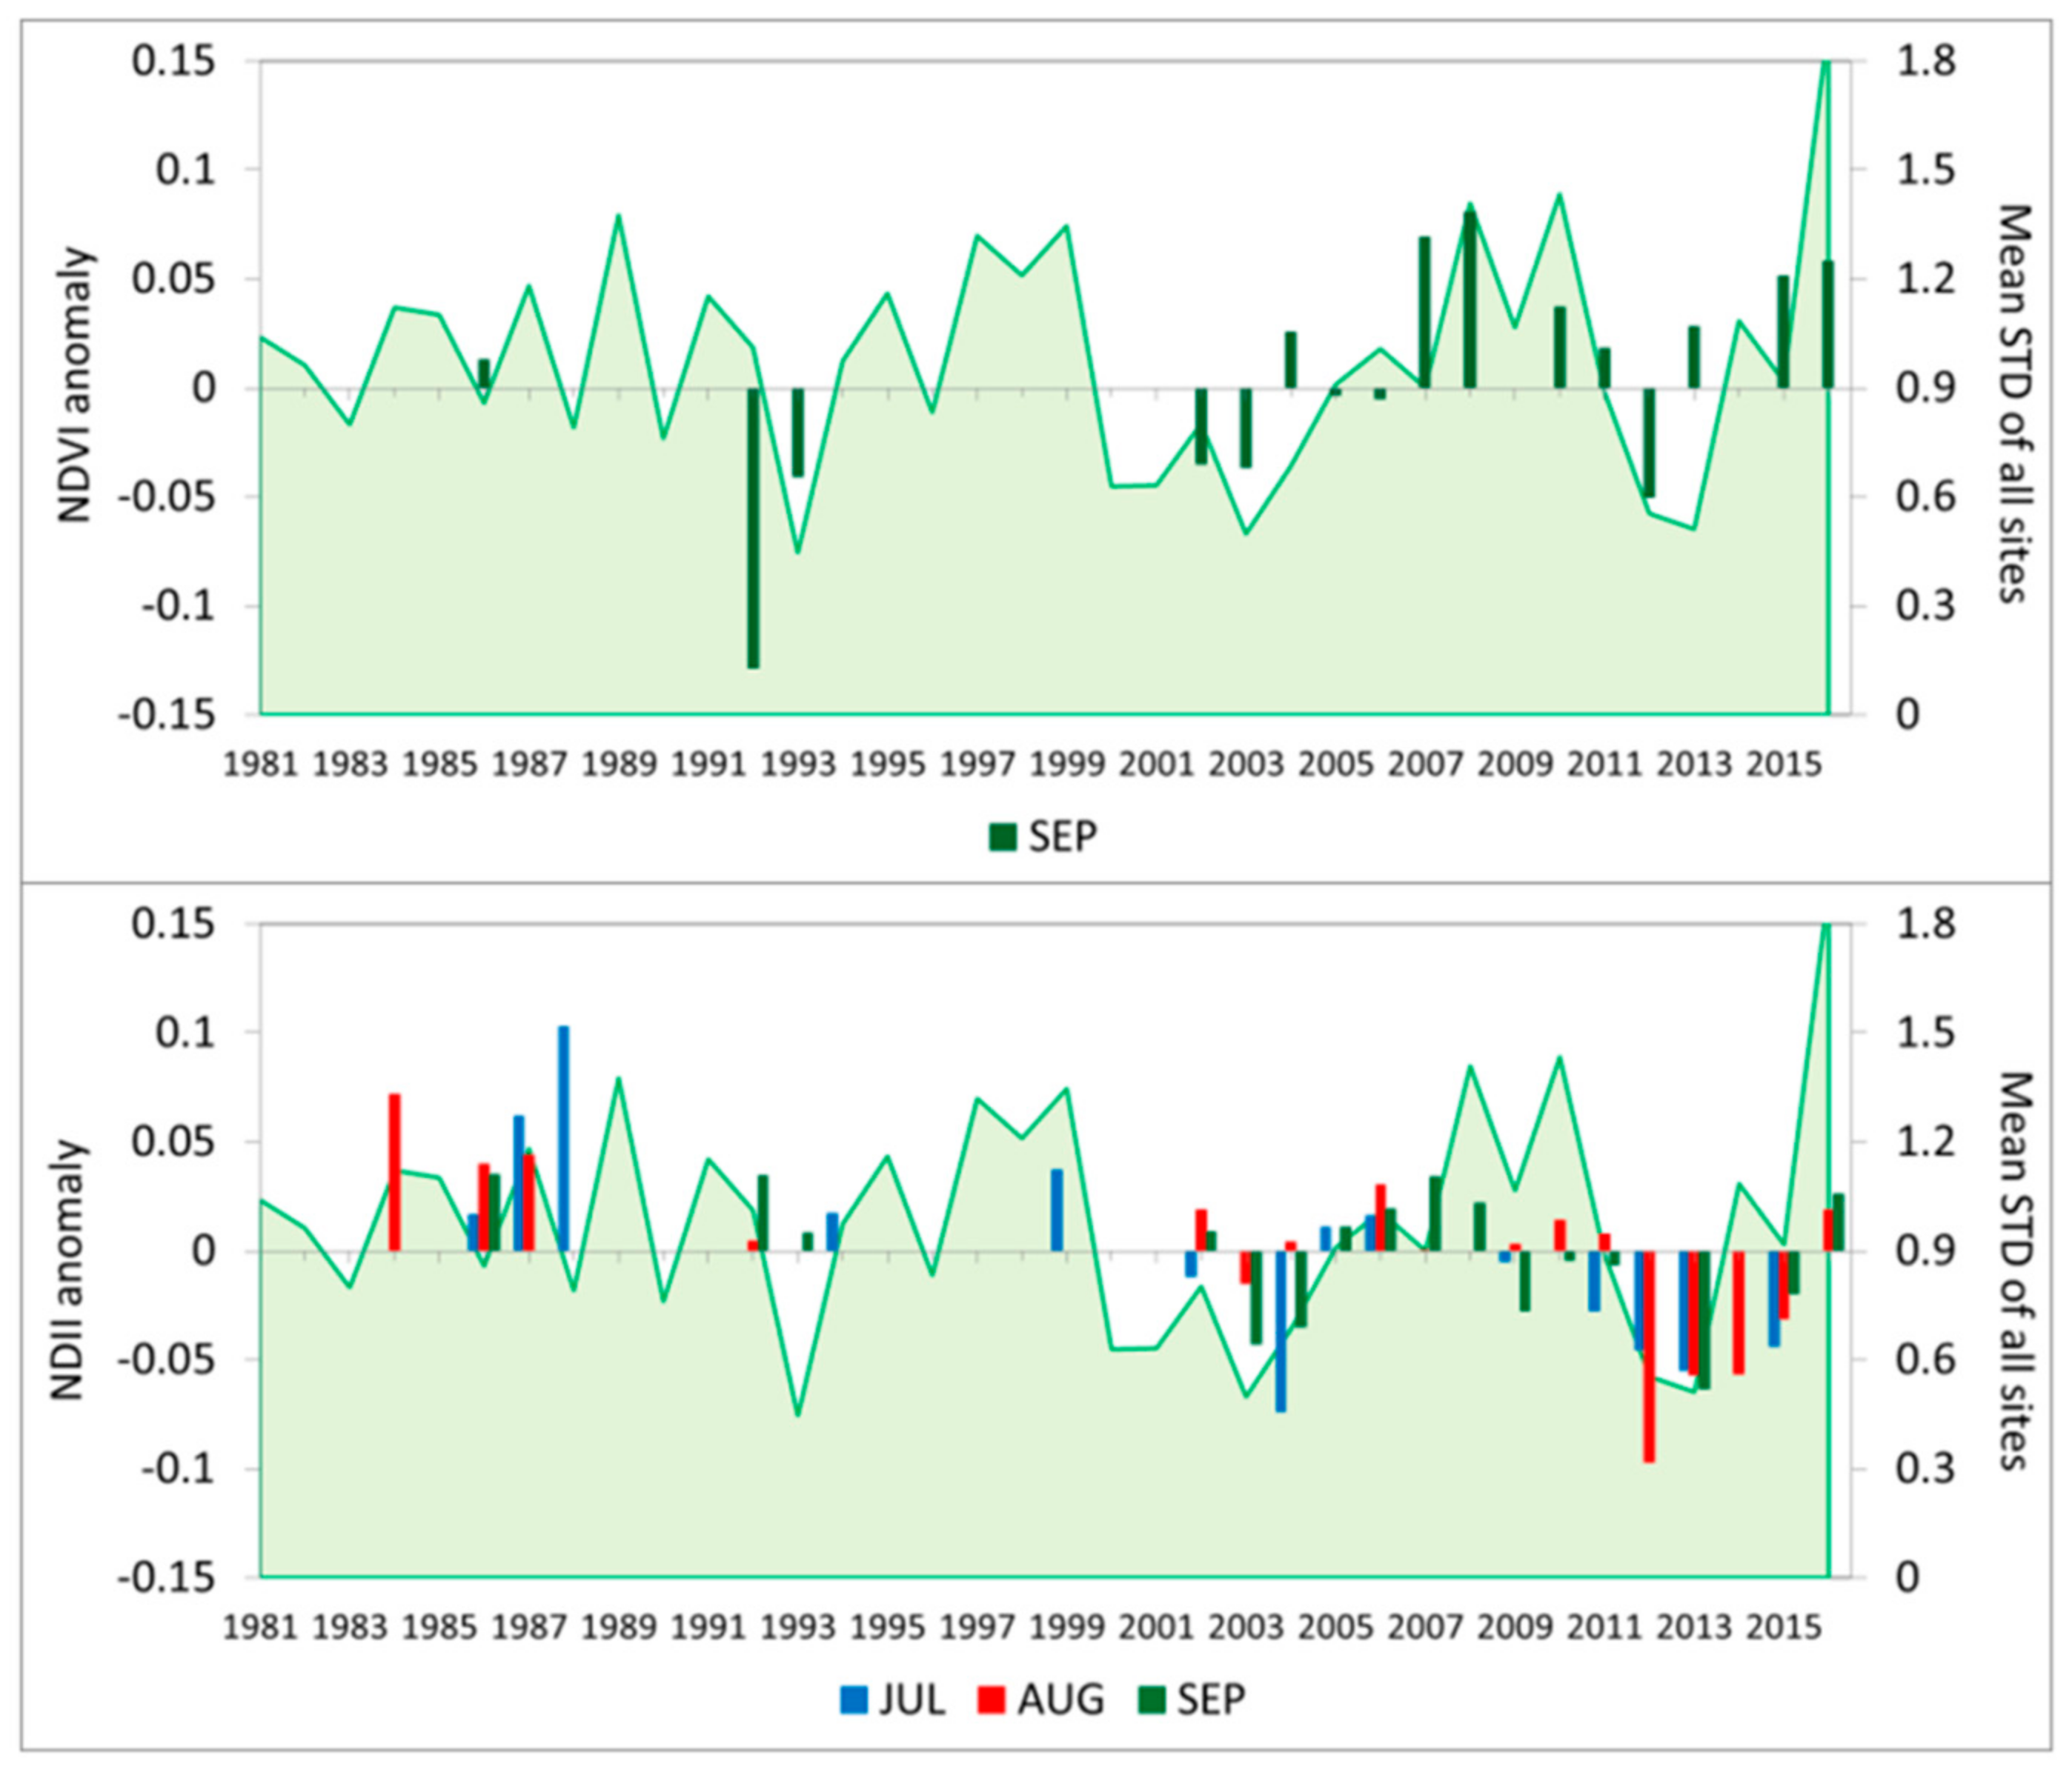
3.4. Vegetation Activity Responses to Drought

We found that the mean monthly NDVI during the analysed drought years (1992, 2000–2001, 2003, 2011–2012) diverged from the long-term mean (1984–2016) only in August and in September. The NDVI values in 1992 (August anomaly: −0.09, September anomaly: −0.13), in 2003 (September anomaly: −0.04) and in 2012 (August anomaly: −0.04) were significantly (p < 0.01) lower than the 1984–2016 mean values (Figure 12).
While both vegetation indices could indicate drought, the NDII reacted to the analysed drought conditions more rapidly and to a greater extent than NDVI from June to September. Especially remarkable are the very low NDII values in the extreme drought year 2012 starting already in May and reaching the bottom with more than two standard deviations below the long-term mean in August (anomaly: −0.1). The NDII was also below average in August (anomaly: −0.01) and September 2003 (anomaly: −0.05) but as opposed to the NDVI, the NDII did not respond to drought conditions in the late summer of 1992. The possible reason is that the NDII is proportional to the water content of the canopy [77] that is sensitive to changes in available water in the soil, and thus could react to changing conditions fast. This interpretation is confirmed by a recent paper of Sriwongsitanon et al. [78] where the NDII was successfully used to monitor the moisture content of the root zone especially during dry periods. Besides the different nature of the indices, the high daily maximum temperatures of August in 1992 (about 2.7 °C higher than in August of 2012) may have more negatively influenced the photosynthesis and consequently the NDVI than the NDII [79].
The observed NDVI and NDII anomalies were also in coarse coincidence with remarkable growth reductions of trees (Figure 13).
However, correlation of tree-ring width series with the mean NDVI of the months from May until September only showed a significant relationship in the single case of September (r = 0.45, p < 0.05 one-tailed t test). In the case of the NDII, the correlation with tree-ring widths was stronger and even significant for the months July, August and September (r values 0.55, 0.46 and 0.46 respectively) that may refer to the higher potential of NDII to explain growth, although the available data is not enough to draw robust conclusions. Although we had limited data to compute the average seasonal change of NDVI and NDII over the selected drought years (for some months only three data were available mainly because of cloudy weather conditions), they captured the changes in the vegetation activity to drought conditions, although to different degrees (Figure 12).

4. Conclusions

This study on Black pine growing under frequent summer droughts in south-west Hungary has indicated that:
(1) The summer moisture availability of the current year was the main driver of the growth of Black pine. The results of the analysis suggest that on soils with low soil water storage capacity the summer precipitation alone could be sufficient to track radial growth changes of Black pine, and thus the use of daily soil water balance is not necessarily needed.
The established climate-growth relationship is valid for the majority of Black pine stands in Hungary located on shallow soils with a sandy texture and no surplus water. Furthermore, the climate-tree-growth analysis should be extended to stands with deeper soils and larger soil water storage capacity to be able to estimate the country-wide changes in growth of Black pine induced by future climate change.
Due to the influence of many different factors like forest management activities (thinning intensities), competition, adaptation [80,81], prolongation of vegetation period, effect of fungal pathogens [82] and fertilizing effects of CO2 and nitrogen [83] the possible impact of the expected climate changes on tree growth is challenging. However, the strong dependency of Black pine growth on the water availability in summer combined with the declining summer precipitation [84] projected by climate models might lead to decreasing growth of Black pine in the future in Hungary.
(2) The drought response analysis showed that both the radial growth and vegetation activity of Black pine is sensitive to summer drought at this low altitude with poor site quality conditions. We found that Black pine was able to recover less and less during the three successive droughts of the last decades (1992–1993, 2000–2003 and 2011–2012) confirmed by the declining values of recovery and relative resilience, suggesting a long-term superimposed effect of these events.
The vegetation activity of Black pine responded with varying intensity to drought conditions. NDII reacted to droughts faster and to a greater extent than NDVI, but due to the low number of available images, this result has to be supported by additional studies on the intra-annual changes of vegetation indices.
Hence, it can be concluded that the risk of vitality loss due to the expected increase of the drought frequency is large on soils with low soil water storage capacity. For that reason, we argue that the suggestion by several papers [16,17,18,19] that Black pine can be a possible substitute species in the Alpine and Mediterranean region in the future should be revisited, and other substitute tree species, potentially well adapted to drought, should be the subject of dendroecological investigations to provide a scientific basis for future silvicultural management activities in these regions.

Supplementary Materials

The following are available online at https://www.mdpi.com/1999-4907/9/7/414/s1, Table S1: Formulas of the applied meteorological and water balance variables, Table S2: The modified Brook90 parameters, Table S3: Mean tree-ring widths (standardized chronologies) before, during and after the drought events (1993, 2000–2003 and 2011–2012).

Author Contributions

Conceptualization, N.M. and E.R.; Data curation, B.G. (Balázs Garamszegi), G.I. and B.G. (Borbála Gálos); Investigation, N.M., E.R., A.B. and A.H.; Methodology, N.M. and B.G. (Balázs Garamszegi); Resources, A.J.; Supervision, Z.V., Z.S. and B.G. (Borbála Gálos); Writing-original draft, N.M., B.G. (Balázs Garamszegi), E.R., A.B. and A.H., A.J., G.I., Z.V., Z.S. and B.G. (Borbála Gálos); Writing-review & editing, N.M., Z.V., Z.S. and B.G. (Borbála Gálos).

Acknowledgments

We thank the local forest management (Bakonyerdő Ltd., branch office Keszthely) for their valuable support in field-work. This study was supported by the VKSZ_12-1-2013-0034 project sponsored by the Hungarian State and the National Research, Development and Innovation Fund and the Forest Monitoring and Measuring program of the Hungarian Forest Research Institute. This research was also supported by the Higher Education Institutional Excellence Program awarded by the Ministry of Human Capacities within the framework of water-related research of Szent István University.

Conflicts of Interest

The authors declare no conflict of interest.

References

  1. Mishra, A.K.; Singh, V.P. A review of drought concepts. J. Hydrol. 2010, 391, 202–216. [Google Scholar] [CrossRef]
  2. Spinoni, J.; Naumann, G.; Vogt, J.V.; Barbosa, P. The biggest drought events in Europe from 1950 to 2012. J. Hydrol. Reg. Stud. 2015, 3, 509–524. [Google Scholar] [CrossRef]
  3. Bertini, G.; Amoriello, T.; Fabbio, G.; Piovosi, M. Forest growth and climate change: Evidences from the ICP-Forests intensive monitoring in Italy. IForest 2011, 4, 262–267. [Google Scholar] [CrossRef]
  4. Camarero, J.J.; Gazol, A.; Sangüesa-Barreda, G.; Cantero, A.; Sánchez-Salguero, R.; Sánchez-Miranda, A.; Granda, E.; Serra-Maluquer, X.; Ibáñez, R. Forest Growth Responses to Drought at Short- and Long-Term Scales in Spain: Squeezing the Stress Memory from Tree Rings. Front. Ecol. Evol. 2018, 6, 1–11. [Google Scholar] [CrossRef]
  5. Peltier, D.M.P.; Fell, M.; Ogle, K. Legacy effects of drought in the southwestern United States: A multi-species synthesis. Ecol. Monogr. 2016, 86, 312–326. [Google Scholar] [CrossRef] [Green Version]
  6. Anderegg, L.; Anderegg, W.; Berry, J. Not all droughts are created equal: Translating meteorological drought into woody plant mortality. Tree Physiol. 2013, 33, 701–712. [Google Scholar] [CrossRef] [PubMed]
  7. Zang, C.; Hartl-Meier, C.; Dittmar, C.; Andreas, R.; Menzel, A. Patterns of drought tolerance in major European temperate forest trees: Climatic drivers and levels of variability. Glob. Chang. Biol. 2014, 20, 3767–3779. [Google Scholar] [CrossRef] [PubMed]
  8. Camarero, J.J.; Linares, J.C.; Sangüesa-Barreda, G.; Sánchez-Salguero, R.; Gazol, A.; Navarro-Cerrillo, R.M.; Carreira, J.A. The Multiple Causes of Forest Decline in Spain: Drought, Historical Logging, Competition and Biotic Stressors. In Dendroecology; Amoroso, M.M., Daniels, L.D., Backer, P.J., Camarero, J.J., Eds.; Springer International Publishing AG: Basel, Switzerland, 2017; pp. 307–323. [Google Scholar]
  9. Bréda, N.; Huc, R.; Granier, A.; Dreyer, E. Temperate forest trees and stands under severe drought: A review of ecophysiological responses, adaptation processes and long-term consequences. Ann. For. Sci. 2006, 63, 625–644. [Google Scholar] [CrossRef]
  10. Allen, C.D.; Macalady, A.K.; Chenchouni, H.; Bachelet, D.; McDowell, N.; Vennetier, M.; Kitzberger, T.; Rigling, A.; Breshears, D.D.; Hogg, E.H.; et al. A global overview of drought and heat-induced tree mortality reveals emerging climate change risks for forests. For. Ecol. Manag. 2010, 259, 660–684. [Google Scholar] [CrossRef]
  11. Williams, A.P.; Allen, C.D.; Macalady, A.K.; Griffin, D.; Woodhouse, C.A.; Meko, D.M.; Swetnam, T.W.; Rauscher, S.A.; Seager, R.; Grissino-Mayer, H.D.; et al. Temperature as a potent driver of regional forest drought stress and tree mortality. Nat. Clim. Chang. 2013, 3, 292–297. [Google Scholar] [CrossRef]
  12. Gustafson, E.J.; Sturtevant, B.R. Modeling Forest Mortality Caused by Drought Stress: Implications for Climate Change. Ecosystems 2013, 16, 60–74. [Google Scholar] [CrossRef]
  13. Mészáros, I.; Veres, S.; Szollosi, E.; Koncz, P.; Kanalas, P.; Oláh, V. Responses of some ecophysiological traits of sessile oak (Quercus petraea) to drought stress and heat wave in growing season of 2003. Acta Biol. Szeged. 2008, 52, 107–109. [Google Scholar]
  14. Rasztovits, E.; Berki, I.; Mátyás, C.; Czimber, K.; Pötzelsberger, E.; Móricz, N. The incorporation of extreme drought events improves models for beech persistence at its distribution limit. Ann. For. Sci. 2014, 71, 201–210. [Google Scholar] [CrossRef]
  15. Mátyás, C.; Berki, I.; Czúcz, B.; Gálos, B.; Móricz, N.; Rasztovits, E. Future of beech in Southeast Europe from the perspective of evolutionary ecology. Acta Silv. Lignaria Hungarica 2010, 6, 91–110. [Google Scholar]
  16. Eilmann, B.; Rigling, A. Tree-growth analyses to estimate tree species’ drought tolerance. Tree Physiol. 2012, 32, 178–187. [Google Scholar] [CrossRef] [PubMed]
  17. Martín-Benito, D.; Beeckman, H.; Cañellas, I. Influence of drought on tree rings and tracheid features of Pinus nigra and Pinus sylvestris in a mesic Mediterranean forest. Eur. J. For. Res. 2013, 132, 33–45. [Google Scholar] [CrossRef]
  18. Herrero, A.; Zamora, R. Plant responses to extreme climatic events: A field test of resilience capacity at the southern range edge. PLoS ONE 2014, 9, 1–12. [Google Scholar] [CrossRef] [PubMed]
  19. Marqués, L.; Camarero, J.J.; Gazol, A.; Zavala, M.A. Drought impacts on tree growth of two pine species along an altitudinal gradient and their use as early-warning signals of potential shifts in tree species distributions. For. Ecol. Manag. 2016, 381, 157–167. [Google Scholar] [CrossRef]
  20. Stand-Based Inventory; National Forestry Database: Ottawa, ON, Canada, 2010; Unpublished work.
  21. Koltay, A. A magyarországi feketefenyő hajtáspusztulás történeti áttekintése. Erdészeti kutatások 2000, 90, 247–254. [Google Scholar]
  22. Koltay, A.; Szakács, I.; Horváth, A. Tömeges fenyőpusztulás a Keszthelyi-hegységben. Erdészeti lapok 2013, 5, 145–147. [Google Scholar]
  23. Gálos, B.; Lorenz, P.; Jacob, D. Will dry events occur more often in Hungary in the future? Environ. Res. Lett. 2007, 2. [Google Scholar] [CrossRef]
  24. Blanka, V.; Mezosi, G.; Meyer, B. Projected changes in the drought hazard in Hungary due to climate change. Idojaras 2013, 117, 219–237. [Google Scholar]
  25. Spinoni, J.; Vogt, J.V.; Naumann, G.; Barbosa, P.; Dosio, A. Will drought events become more frequent and severe in Europe? Int. J. Climatol. 2018, 38, 1718–1736. [Google Scholar] [CrossRef]
  26. Vicente-Serrano, S.M.; Beguería, S.; López-Moreno, J.I. A multiscalar drought index sensitive to global warming: The standardized precipitation evapotranspiration index. J. Clim. 2010, 23, 1696–1718. [Google Scholar] [CrossRef]
  27. Führer, E.; Horváth, L.; Jagodics, A.; Machon, A.; Szabados, I. Application of a new aridity index in Hungarian forestry practice. Idojaras 2011, 115, 205–216. [Google Scholar]
  28. Granier, A.; Bréda, N.; Biron, P.; Villette, S. A lumped water balance model to evaluate duration and intesity of drought constraints in forest stands. Ecol. Model. 1999, 116, 269–283. [Google Scholar] [CrossRef]
  29. Vilhar, U. Comparison of drought stress indices in beech forests: A modelling study. IForest 2016, 9, 635–642. [Google Scholar] [CrossRef]
  30. Isajev, V.; Fady, B.; Semerci, H.; Andonovski, V. Pinus nigra—Technical Guidelines for Genetic Conservation and Use for European Black pine, 2003. European Forest Genetic Resources Programme (EUFORGEN) Website. Available online: http://www.euforgen.org/species/pinus-nigra/ (accessed on 18 May 2018).
  31. Kovács, F.; Veperdi, G. A feketefenyő fatermése és erdőnevelési modellje. Erdészeti Kutatások 1993, 82–83, 328–344. (In Hungarian) [Google Scholar]
  32. IUSS Working Group WRB. World Reference Base for Soil Resources 2014, International Soil Classification System for Naming Soils and Creating Legends for Soil Maps, Update 2015; World Soil Resources Reports No. 106; Food and Agriculture Organization of the United Nations: Rome, Italy, 2015. [Google Scholar]
  33. National Climate Data Center NNDC Climate Data Online; US National Climate Data Center: Asheville, NC, USA, 2014; Available online: http://www7.ncdc.noaa.gov/CDO/CDODivisionalSelect.jsp (accessed on 24 November 2017).
  34. Somogyi, Z.; Koltay, A.; Molnár, T.; Móricz, N. Forest health monitoring system in Hungary based on MODIS products. In Theory Meets Practice in GIS; Molnár, V.É., Ed.; Debrecen University Press: Debrecen, Hungary, 2018; pp. 325–330. [Google Scholar]
  35. Rouse, J.W.; Haas, R.H.; Schell, J.A.; Deering, D.W. Monitoring vegetation systems in the Great Plains with ERTS. In Third Earth Resources Technology Satellite-1 Symposium; Freden, S.C., Mercanti, E.P., Becker, M.A., Eds.; NASA: Washington, DC, USA, 1973; Volume I, pp. 309–317. [Google Scholar]
  36. Justice, C.O.; Townshend, J.R.G.; Vermote, E.F.; Masuoka, E.; Wolfe, R.E.; Saleous, N.; Roy, D.P.; Morisette, J.T. An overview of MODIS Land data processing and product status. Remote Sens. Environ. 2002, 83, 3–15. [Google Scholar] [CrossRef] [Green Version]
  37. Peters, A.J.; Walter-Shea, E.A.; Ji, L.; Viña, A.; Hayes, M.; Svoboda, M.D. Drought monitoring with NDVI-based standardized vegetation index. Am. Soc. Photogramm. Remote Sens. 2002, 68, 71–75. [Google Scholar]
  38. Thornthwhaite, C.W. An approach toward a rational classification of climate. Geogr. Rew. 1948, 38, 55–94. [Google Scholar] [CrossRef]
  39. R Development Core Team. R: A Language and Environment for Statistical Computing; R Foundation for Statistical Computing: Vienna, Austria, 2014. [Google Scholar]
  40. Federer, C.A.; Vörösmarty, C.; Fekete, B. Sensitivity of Annual Evaporation to Soil and Root Properties in Two Models of Contrasting Complexity. J. Hydrometeorol. 2003, 4, 1276–1290. [Google Scholar] [CrossRef]
  41. Angström, A. Solar and terrestrial radiation. Q. J. R. Meteor. Soc. 1924, 50, 121–125. [Google Scholar]
  42. Clapp, R.B.; Hornberger, G.M. Empirical Equations for Some Soil Hydraulic Properties. Water Resour. Res. 1978, 14, 601–604. [Google Scholar] [CrossRef]
  43. Van Gardingen, P.R.; Jackson, G.E.; Hernandez-Daumas, S.; Russel, G.; Sharp, L. Leaf area estimates obtained for clumped canopies using hemispherical photography. Agric. For. Meteor. 1999, 94, 243–257. [Google Scholar] [CrossRef]
  44. Smith, W.K.; Hinckley, T.M. Ecophysiology of Coniferous Forests; Academic Press: San Diego, CA, USA, 1995. [Google Scholar]
  45. Chen, J.M.; Rich, P.M.; Gower, S.T.; Norman, J.M.; Plummer, S. Leaf area index of boreal forests. J. Geophys. Res. 1997, 102, 29429–29443. [Google Scholar] [CrossRef]
  46. Lebourgeois, F.; Levy, G.; Aussenac, G.; Clerc, B.; Willm, F. Influence of soil drying on leaf water potential, photosynthesis, stomatal conductance and growth in two black pine varieties. Ann. Sci. For. 1998, 55, 287–299. [Google Scholar] [CrossRef] [Green Version]
  47. Kuusinen, N.; Kolari, P.; Levula, J.; Porcar-Castell, A.; Stenberg, P.; Berninger, F. Seasonal variation in boreal pine forest albedo and effects of canopy snow on forest reflectance. Agric. For. Meteorol. 2012, 164, 53–60. [Google Scholar] [CrossRef]
  48. Fritts, H.C.; Vaganov, E.A.; Sviderskaya, I.V.; Shashkin, A.V. Climatic variation and tree-ring structure in conifers: Empirical and mechanistic models of tree-ring width, number of cells, cell size, cell-wall thickness and wood density. Clim. Res. 1991, 1, 97–116. [Google Scholar] [CrossRef]
  49. Stokes, M.A.; Smiley, T.L. An Introduction to Tree-Ring Dating; University of Chicago Press: Chicago, IL, USA, 1968; 73p. [Google Scholar]
  50. Holmes, R.L. Computer-assisted quality control in tree-ring dating and measurement. Tree-Ring Bull 1983, 43, 69–78. [Google Scholar]
  51. Fritts, H.C. Tree Rings and Climate; Academic Press: New York, NY, USA, 1976. [Google Scholar]
  52. Cook, E.R. A Time Series Analysis Approach to Tree-Ring Standardization. Ph.D. Thesis, University of Arizona, Tucson, AZ, USA, 5 August 1985. [Google Scholar]
  53. Wigley, T.M.L.; Briffa, K.R.; Jones, P.D. On the average value of correlated time-series, with applications on Dendroclimatology and Hydrometeorology. J. Appl. Meteorol. Climatol. 1984, 23, 201–213. [Google Scholar] [CrossRef]
  54. Hunt, E.R., Jr.; Rock, B.N. Detection of changes in leaf water content using near and middle-infrared reflectances. Remote Sens. Environ. 1989, 30, 43–54. [Google Scholar]
  55. Maselli, F. Monitoring forest conditions in a protected Mediterranean coastal area by the analysis of multiyear NDVI data. Remote Sens. Environ. 2004, 89, 423–433. [Google Scholar] [CrossRef]
  56. Ogaya, R.; Barbeta, A.; Başnou, C.; Peñuelas, J. Satellite data as indicators of tree biomass growth and forest dieback in a Mediterranean holm oak forest. Ann. For. Sci. 2015, 72, 135–144. [Google Scholar] [CrossRef]
  57. Steele-Dunne, S.C.; Friesen, J.; van de Giesen, N. Using Diurnal Variation in Backscatter to Detect Vegetation Water Stress. IEEE Trans. Geosci. Remote Sens. 2012, 50, 2618–2629. [Google Scholar] [CrossRef]
  58. Sriwongsitanon, N.; Gao, H.; Savenije, H.H.G.; Maekan, E.; Saengsawang, S.; Thianpopirug, S. The Normalized Difference Infrared Index (NDII) as a proxy for soil moisture storage in hydrological modelling. Hydrol. Earth Syst. Sci. Discuss. 2015, 12, 8419–8457. [Google Scholar] [CrossRef]
  59. Masek, J.G.; Vermote, E.F.; Saleous, N.; Wolfe, R.; Hall, F.G.; Huemmrich, F.; Gao, F.; Kutler, J.; Lim, T.K. LEDAPS Landsat Calibration, Reflectance, Atmospheric Correction Preprocessing Code; Oak Ridge National Laboratory Distributed Active Archive Center: Oak Ridge, TN, USA, 2012. [Google Scholar]
  60. EarthExplorer. Available online: https://earthexplorer.usgs.gov/ (accessed on 6 September 2017).
  61. Diedenhofen, B.; Musch, J. Cocor: A comprehensive solution for the statistical comparison of correlations. PLoS ONE 2015, 10, 1–12. [Google Scholar] [CrossRef] [PubMed]
  62. Gazol, A.; Ribas, M.; Gutiérrez, E.; Camarero, J.J. Aleppo pine forests from across Spain show drought-induced growth decline and partial recovery. Agric. For. Meteorol. 2017, 232, 186–194. [Google Scholar] [CrossRef]
  63. Lloret, F.; Keeling, E.G.; Sala, A. Components of tree resilience: Effects of successive low-growth episodes in old ponderosa pine forests. Oikos 2011, 120, 1909–1920. [Google Scholar] [CrossRef]
  64. Fyllas, N.M.; Christopoulou, A.; Galanidis, A.; Michelaki, C.Z.; Dimitrakopoulos, P.G.; Fulé, P.Z.; Arianoutsou, M. Tree growth-climate relationships in a forest-plot network on Mediterranean mountains. Sci. Total Environ. 2017, 598, 393–403. [Google Scholar] [CrossRef] [PubMed]
  65. Martín-Benito, D.; Cherubini, P.; Del Río, M.; Cañellas, I. Growth response to climate and drought in Pinus nigra Arn. trees of different crown classes. Trees Struct. Funct. 2008, 22, 363–373. [Google Scholar] [CrossRef]
  66. Martín-Benito, D.; Del Río, M.; Heinrich, I.; Helle, G.; Cañellas, I. Response of climate-growth relationships and water use efficiency to thinning in a Pinus nigra afforestation. For. Ecol. Manag. 2010, 259, 967–975. [Google Scholar] [CrossRef]
  67. Lebourgeois, F.; Mérian, P.; Courdier, F.; Ladier, J.; Dreyfus, P. Instability of climate signal in tree-ring width in Mediterranean mountains: A multi-species analysis. Trees Struct. Funct. 2012, 26, 715–729. [Google Scholar] [CrossRef]
  68. Sánchez-Salguero, R.; Navarro-Cerrillo, R.M.; Camarero, J.J.; Fernández-Cancio, Á. Selective drought-induced decline of pine species in southeastern Spain. Clim. Chang. 2012, 113, 767–785. [Google Scholar] [CrossRef]
  69. Granda, E.; Camarero, J.J.; Gimeno, T.E.; Martínez-Fernández, J.; Valladares, F. Intensity and timing of warming and drought differentially affect growth patterns of co-occurring Mediterranean tree species. Eur. J. For. Res. 2013, 132, 469–480. [Google Scholar] [CrossRef]
  70. Herguido, E.; Granda, E.; Benavides, R.; García-Cervigón, A.I.; Camarero, J.J.; Valladares, F. Contrasting growth and mortality responses to climate warming of two pine species in a continental Mediterranean ecosystem. For. Ecol. Manag. 2016, 363, 149–158. [Google Scholar] [CrossRef] [Green Version]
  71. Janssen, E.; Kint, V.; Bontemps, J.D.; Özkan, K.; Mert, A.; Köse, N.; Icel, B.; Muys, B. Recent growth trends of black pine (Pinus nigra J.F. Arnold) in the eastern mediterranean. For. Ecol. Manag. 2018, 412, 21–28. [Google Scholar] [CrossRef]
  72. Guada, G.; Camarero, J.J.; Sánchez-Salguero, R.; Cerrillo, R.M.N. Limited Growth Recovery after Drought-Induced Forest Dieback in Very Defoliated Trees of Two Pine Species. Front. Plant Sci. 2016, 7, 1–12. [Google Scholar] [CrossRef] [PubMed]
  73. Macalady, A.K.; Bugmann, H. Growth-mortality relationships in piñon pine (Pinus edulis) during severe droughts of the past century: Shifting processes in space and time. PLoS ONE 2014, 9. [Google Scholar] [CrossRef] [PubMed]
  74. Lebourgeois, F. Climatic signals in earlywood, latewood and total ring width of Corsican pine from western France. Ann. For. Sci. 2000, 57, 155–164. [Google Scholar] [CrossRef] [Green Version]
  75. Linares, J.C.; Tíscar, P.A. Climate change impacts and vulnerability of the southern populations of Pinus nigra subsp. salzmannii. Tree Physiol. 2010, 30, 795–806. [Google Scholar] [CrossRef] [PubMed]
  76. Bhuyan, U.; Zang, C.; Menzel, A. Different responses of multispecies tree ring growth to various drought indices across Europe. Dendrochronologia 2017, 44, 1–8. [Google Scholar] [CrossRef]
  77. Yilmaz, M.T.; Hunt, E.R.; Jackson, T.J. Remote sensing of vegetation water content from equivalent water thickness using satellite imagery. Remote Sens. Environ. 2008, 112, 2514–2522. [Google Scholar] [CrossRef]
  78. Sriwongsitanon, N.; Gao, H.; Savenije, H.H.G.; Maekan, E.; Saengsawang, S.; Thianpopirug, S. Comparing the Normalized Difference Infrared Index (NDII) with root zone storage in a lumped conceptual model. Hydrol. Earth Syst. Sci. 2016, 20, 3361–3377. [Google Scholar] [CrossRef]
  79. Allen, C.D.; Breshears, D.D.; McDowell, N.G. On underestimation of global vulnerability to tree mortality and forest die-off from hotter drought in the Anthropocene. Ecosphere 2015, 6, 1–55. [Google Scholar] [CrossRef]
  80. Sánchez-Salguero, R.; Camarero, J.J.; Dobbertin, M.; Fernández-Cancio, Á.; Vilà-Cabrera, A.; Manzanedo, R.D.; Zavala, M.A.; Navarro-Cerrillo, R.M. Contrasting vulnerability and resilience to drought-induced decline of densely planted vs. natural rear-edge Pinus nigra forests. For. Ecol. Manag. 2013, 310, 956–967. [Google Scholar] [CrossRef]
  81. Park, A.; Puettmann, K.; Wilson, E.; Messier, C.; Kames, S.; Dhar, A. Can Boreal and Temperate Forest Management be Adapted to the Uncertainties of 21st Century Climate Change? CRC. Crit. Rev. Plant Sci. 2014, 33, 251–285. [Google Scholar] [CrossRef]
  82. Raitelaitytė, K.; Rutkauskas, A.; Radzijevskaja, J.; Žukauskienė, J.; Markovskaja, S.; Paulauskas, A. The fungal pathogens causing diseases in pines. Biologija 2016, 62, 276–283. [Google Scholar] [CrossRef]
  83. Mellert, K.H.; Prietzel, J.; Straussberger, R.; Rehfuess, K.E.; Kahle, H.P.; Perez, P.; Spiecker, H. Relationships between long-term trends of air temperature, precipitation, nitrogen nutrition and growth of coniferous stands in Central Europe and Finland. Eur. J. For. Res. 2008, 127, 507–524. [Google Scholar] [CrossRef]
  84. Gálos, B.; Führer, E.; Czimber, K.; Gulyás, K.; Bidló, A.; Hänsler, A.; Jacob, D.; Mátyás, C. Climatic threats determining future adaptive forest management—A case study of Zala County. Idojaras 2015, 119, 425–441. [Google Scholar]
Figure 1. Distribution map of Black pine in Europe (green areas; source: EUFORGEN 2009 [30]) and location of the five study sites (S1–S5) in the Keszthely Mountains (within the green area denoting the forest area, the dots mark the subcompartments where the mixture ratio of Black pine was highest).
Forests 09 00414 g001
Figure 2. Annual standardized precipitation evapotranspiration index (SPEI) values (coloured area) and the standardized normalized difference vegetation index (NDVI) for August-September (green/yellow columns) for the study sites in the period 1981–2016 (NDVI data was provided by the Forest Monitoring and Measuring program of the Hungarian Forest Research Institute, [34]).
Forests 09 00414 g002
Figure 3. (A) Precipitation anomaly (%) of 2011–2012 relative to the long-term mean (1951–2000) and the (B) standardized mean normalized difference vegetation index (NDVI) of the months Aug–Sep in 2012 (red rectangle denotes the study area, grey dots the Black pine stands).
Forests 09 00414 g003
Figure 4. The monthly number of available images (1984–2016) for the study area.
Forests 09 00414 g004
Figure 5. Comparison of the predicted and observed soil water contents (volumetric water content (VWC)) in four different soil depths in the S5 site (red line: observations, blue line: model simulations) for the calibration (left chart) and validation (right chart) period.
Forests 09 00414 g005
Figure 6. Standard chronologies (STD) of the sites, with sample replication in grey (S1–S5 denote the five study sites).
Forests 09 00414 g006
Figure 7. Correlations between climate indices and the mean standard ring-width chronology of all sites. Dotted lines denote the 95% significance level (SPEI: standardized precipitation evapotranspiration index, REW: relative extractable water, FAI: forestry aridity index, Year: January–December of the current year, J–J–A: June–July–August).
Forests 09 00414 g007
Figure 8. Coefficients of response-function analysis (PCA) among indices and standard chronologies, stars indicate 95% significance level (SPEI: standardized precipitation evapotranspiration index, REW: relative extractable water).
Forests 09 00414 g008
Figure 9. Standardized relative extractable water (REW) of the summer months (orange columns), with one standard deviation below the mean (dotted line) and the detrended mean standard chronology of all sites (light green background).
Forests 09 00414 g009
Figure 10. Daily relative extractable water (REW) of the analysed drought years, grey area denotes the REW values below 0.4.
Forests 09 00414 g010
Figure 11. Drought reaction for the four drought response measures (dimensionless).
Forests 09 00414 g011
Figure 12. Monthly mean (±SD) normalized difference vegetation index (NDVI) (upper chart) and the normalized difference infrared index NDII (bottom chart) values (for 1984–2016) compared to the mean values of the drought years (1992, 2000–2001, 2003, 2011–2012) and average values of different months in 1992, 2003 and 2012.
Forests 09 00414 g012
Figure 13. The normalized difference vegetation index (NDVI) (upper chart) and normalized difference infrared index (NDII) (bottom chart) anomalies for selected months and the detrended mean standardized chronology of all sites (light green background).
Forests 09 00414 g013
Table 1. Site and stand characteristics of the analysed plots.
SiteMean Tree Height (m)Density (Trees/ha)Mean Stand Age in 2012 (Years)Slope/Aspect (°)Topsoil Layer Thickness (cm)Leaf Area Index (m2/m2)Ratio of Dead to Live Standing Trees Excluding Naturally Suppressed Trees (%)
S115.54115030/0252.75
S216.93385532/315402.10
S314.04505520/270503.010
S412.54013525/315302.330
S513.66884020/270502.915
Table 2. Tree ring statistics.
Raw DataStandard Chronology
MRW (mm/year)Standard DeviationMRMSMean RbarEPS
S11.851.340.810.390.590.94
S22.081.190.770.350.580.94
S31.691.320.830.440.660.95
S42.911.650.890.340.770.97
S51.951.320.810.430.630.95
MRW: mean ring width, MR: mean inter-series correlation, MS: mean sensitivity, EPS: expressed population signal.

