Article

A Probabilistic Method Predicting Forest Fire Occurrence Combining Firebrands and the Weather-Fuel Complex in the Northern Part of the Daxinganling Region, China

College of Forestry, Northeast Forestry University, Harbin 150040, China
*
Author to whom correspondence should be addressed.
Forests 2018, 9(7), 428; https://doi.org/10.3390/f9070428
Submission received: 16 June 2018 / Revised: 11 July 2018 / Accepted: 16 July 2018 / Published: 17 July 2018
(This article belongs to the Section Forest Ecology and Management)

Abstract

:
The fire danger rating method currently used in the northern part of the Daxinganling Region with the most severe forest fires in China only uses weather variables without considering firebrands. The discrepancy between fire occurrence and fire risk by FFDWR (Forest Fire-Danger Weather Rating, a method issued by the National Meteorological Bureau, that is used to predict forest fire probability through links between forest fire occurrence and weather variables) in the northern part is more obvious than that in the southern part. Great discrepancy has emerged between fire danger predicted by the method and actual fire occurrence in recent years since a strict firebrand prohibition policy has significantly reduced firebrands in the region. A probabilistic method predicting fire probability by introducing an Ignition Component (IC) in the National Fire Danger Rating System (NFDRS) adopted in the United States to depict effects of both firebrand and weather-fuel complex on fire occurrence is developed to solve the problem. The suitability and accuracy of the new method in the region were assessed. Results show that the method is suitable in the region. IC or the modified IC can be adopted to depict the effect of the weather-fuel complex on fire occurrence and to rate fire danger for periods with fewer firebrands. Fire risk classes and corresponding preparedness level can be determined from IC in the region. Methods of the same principle could be established to diminish similar discrepancy between actual fire occurrence and fire danger in other countries.

1. Introduction

Fire danger rating is the first step in forest fire prevention. A fire danger rating system suited to a region would generate valuable fire risk information for forest fire prevention and suppression. The current fire danger rating assessment method adopted in China is a method developed by the National Meteorological Bureau in 2007, named Forest Fire-Danger Weather Rating (FFDWR). The method predicts forest fire probability through links between forest fire occurrence and weather variables obtained by pure statistical analysis of historical fire data and weather variables. One problem in using the method to calculate fire danger in the region is that fewer fires occur per days with higher fire danger indices, similar to that in Southern Europe [1] because tighter firebrand (the pieces of material dropped by humans) restriction measures are usually taken on these days, which results in fewer firebrands. This is contradictory to the common sense that the higher the fire danger, the more fires. The discrepancy is getting larger and more obvious in recent years since tighter fire prevention measures have been taken in the region, which strongly reduces firebrands, leading to markedly reduced fire occurrence or even no fires in some year. This causes doubts in the usefulness of FFDWR. Changes in the fire danger rating method in the region are needed to diminish the differences.
Fire occurrence probability is affected not only by weather but also by firebrand and fuel [2]. It is the only consideration of effects of weather on fire occurrence without including the effects of firebrand and fuels that bring about the problem. Therefore, only by establishing a new method combining the effects of firebrands and the weather-fuel complex on forest fire probability can we solve the problem. The new method should not only yield small fire probability when firebrands are very limited, which diminishes the difference between fire probability and actual fire occurrence, but also provides potential fire danger caused by weather and fuel conditions. As a consequence, fire agencies can determine preparedness levels [3] to deal with situations with varied dry weather and fuel conditions.
The method cannot be established by simply reanalyzing fire and weather data in the new period by the FFDWR method or methods such as logistic regression [2,4,5,6] because too many identical fire probabilities occur at different fire danger levels would not produce a meaningful relationship between fire probability and fire indices by such analysis.
Theoretically, fire probability can be expressed as a product of firebrand probability, fuel ignition probability and probability of the ignition spreading to a reported fire [7]. Firebrand probability is affected by human activities and biophysical factors such as distance to roads [8,9,10,11]. Fuel ignition probability is mainly affected by fuel moisture content and firebrand type [12,13,14]. Probability of an ignition spreading to a reported fire is affected mainly by rate of spread [15]. A probabilistic fire occurrence prediction method based on the above rationale can provide a fire danger to avoid the discrepancy between fire danger rating prediction and actual fire occurrence probability.
Research on these probability models in China is too limited to establish such a probabilistic method for the region. However, intensive studies have been conducted on ignition probability by different firebrands [13,14,16,17,18,19,20] though only a few works on the probability of an ignition spreading to a reportable fire have been conducted. Establishing such a probabilistic method for China by aid of current existing models would be a practical way to achieve the above goal.
Among current models related to the two probabilities, the National Fire Danger Rating System [21] used in the United States determines ignition probability by fuel moisture content and air temperature based on analysis of results of an ignition experiment dropping matches on slash pine litter [22,23] and probability of the ignition spreading to a reported fire by rate of spread computed by the Rothermel model [24]. The component of the two probabilities is called the Ignition Component (IC), which denotes the probability that a reportable fire will result from a firebrand. These models have been used and tested for daily fire probability by incorporating the two probability models to avoid the discrepancy between fire danger rating prediction and actual fire occurrence probability.
Because firebrand, fuel and weather conditions in China are not the same as those in the United States, two issues must be solved before using the method for fire danger rating in China. One is evaluating the suitability of the method in China, quantifying the accuracy of the method, and determining what modification is needed. The other one is raised from the fact that firebrands can be broken into two parts: fixed firebrands relatively constant for a certain period and random firebrands. Firebrands are not fixed in an area. They are closely related to time, social progress, national economic development, scientific and technological progress, fire prevention measures and human activities. Usually, in a certain area, the firebrand is relatively fixed for a certain period of time, such as lighting, cigarette butts and so on. In addition, there may be some random firebrands that increase on a particular date, for example, firebrands increase significantly on holidays when more people enter forests for recreation [7]. Significant reduction of fixed firebrands in the region in recent years has not totally eliminated random firebrands. Mistakes in estimation of random firebrands will also produce errors in fire danger rating using the method. Therefore, the other issue is separating the contribution of the two kinds of firebrand to fire occurrence from historical data, especially understanding the extent of the effect of random firebrands on fire occurrence. This would provide a valuable reference or baseline for local fire managers to adjust firebrands and thus better predict fire danger.
The northern and southern parts of China are quite different in firebrand and fire regime. The northern part has fewer firebrands than the southern and consequently less fires but with a relatively higher area burned. The discrepancy between fire occurrence and fire risk by FFDWR in the northern part is more obvious than that in the southern part. Therefore, the northern part of the Daxinganling Region, China, was chosen as the study area, and relationships between fire probability, fire occurrence number and IC computed using the NFDRS method in the study area were analyzed to answer the two questions: (1) what is the suitability of the method to meet the discrepancy between fire danger rating prediction and actual fire occurrence probability under fewer firebrand conditions in the region? If suitable, what is the accuracy of the method and what modification should be made for improvement? and (2) what clues about the fixed and random firebrands can be obtained from the decomposition of fire probability into the two components?

2. Materials and Methods

2.1. Study Area

The study area is the northern part of the Daxinganling Region with geographical coordinates ranging from 121°07′~124°26′ E, 50°24′~53°33′ N (Figure 1). It includes, administratively, the Tahe County with an area of 14,420 km2 and the Mohe County with an area of 18,223 km2. Forests in the study area are managed by five forestry bureaus: Xilinji Forestry Bureau, Tuqiang Forestry Bureau, and Amur Forestry Bureau in the Mohe County, Tahe Forestry Bureau, and Shibazhan Forestry Bureau in the Tahe County.
The area is in a cold temperate continental monsoon climate zone; cold and dry in winter and cool in spring and autumn. Summer is short. The annual mean temperature is −2.4 °C for the Tahe County and −5.5 °C for the Mohe County. The annual mean precipitation is 460 mm, concentrated in the summer monsoon wet season. The zonal soil is brown forest soil. The elevation is 300–900 m with generally flat topography [24]. The original vegetation is larch (Larix gemelinii Rupr.) dominated boreal forest mixed with white birch (Betula platyphylla Sukaczev.) and poplar (Populus dividiana L.), and scots pine (Pinus sylvestris var. mongolica Litv.) forest located in the middle or upper part of south facing slopes, and spruce (Picea koraiensis Nakai.) forest located in the lower and wet valley.
A total of 416 fires burned in the period from 1976 through 2008 in the area. Firebrands in the area are mainly cigarette butts, burning paper as offering to the dead, firecrackers, escaped prescribed burning, lighting, burning for warming, hunting, etc. Firebrands have been significantly reduced since 2009 due to strict firebrand prohibition measures and the number of forest fires also decreased significantly. No fire occurred in the study area in 2010, and only two of the six forestry bureaus in the area observed fires, but the number was no more than 3 per year in 2009 and 2013.

2.2. The Probabilistic Method Predicting Fire Occurrence Probability

The probability of at least one fire occurrence on a day Pf is computed by the following equation:
Pf = IC × Pfb
where, IC, ignition component; Pfb, the probability that at least one firebrand occurs.
Daily firebrands can be broken into two parts: fixed firebrands relatively constant for a certain period Pfbc and random firebrands subject to fire management staff’s adjustment Pfbr, so
Pfb = Pfbc + Pfbr
Substitute Pfb in Equation (2) into Equation (1):
Pf = IC × (Pfbc + Pfbr) = IC × Pfbc + IC × Pfbr
Because Pfbr is a random variable, IC × Pfbr is also random, let
ε = IC × Pfbr
So,
Pf = IC × Pfbc + ε
IC is computed as [15]:
IC = Pi × Ps
where, Pi, the probability that a firebrand will ignite receptive fuels after landing on them; Ps, the probability of the ignition spreading to a reportable fire.
The first step in determining Pi is calculating the heat required to bring a fine fuel particle with a given moisture content from its initial temperature to the ignition temperature, the heat of preignition (Qig), by following equation:
Q ig = 144.51 0.266 T 0 0.00058 T 0 2 T 0 M f + 18.54   ( 1 e 15.1 M f ) + 640 M f  
where Qig: preignition heat, cal·g−1; T0, ambient temperature, °C; Mf: fuel moisture content, %.
Then, Pi is computed as follows:
P i = 0.02 k 1 χ k 2
χ = 0.1 × ( Q igmax Q ig )
where, χ, intermediate variable, Qigmax, the heat of preignition for a fuel particle at the extinction moisture content, k1 and k2, empirical constants. k1 and k2, functions of the dead fuel moisture of extinction in the literature [15].
Ps is computed as follows:
P s = ( SC SCM ) 0.5
where, SC, spread component computed from the Rothermel model [25], is the numerical equivalent to the predicted rate of spread; SCM, the SC for which all ignitions become reportable fires in the developers’ best judgment [26].

2.3. Rational for Suitable Evaluation

The main task of evaluating the suitability of the method to the northern Daxinganling Region is to assess the suitability of the method in evaluating firebrand probability and the probability of ignition of fuels by a firebrand and spreading to a reportable fire. The straightforward way to assess the probability models of ignition and spreading to a reportable fire is to conduct burning experiments, but this is too laborious. Firebrands are mainly affected by socioeconomic factors such as forestry practice mode, population density, traffic, and firebrand management policy, which are also very difficult to model [10]. An alternative way was used to do the assessment. The basic principle is that the probability of fire occurrence in the region can be decomposed into a constant times IC and a random term (as Equation (4)) during a period when firebrands are in the region; the constant can be regarded as the probability Pfbc, and IC as the probability of a firebrand to produce a reportable fire and the residual of the regression as the error caused by Pfbr. The IC might not be identical with the real probability of the firebrand to produce a reportable fire in an absolute value, but would hold a constant ratio to the real probability, and thus can be used to depict fire danger caused by the weather-fuel complex in a relative sense and to determine preparedness levels according to fire danger class identified by the IC. Assessing the suitability of the above method involves determining if a linear relationship exists between fire probability and the computed IC with zero intercept for a relatively constant firebrand period.
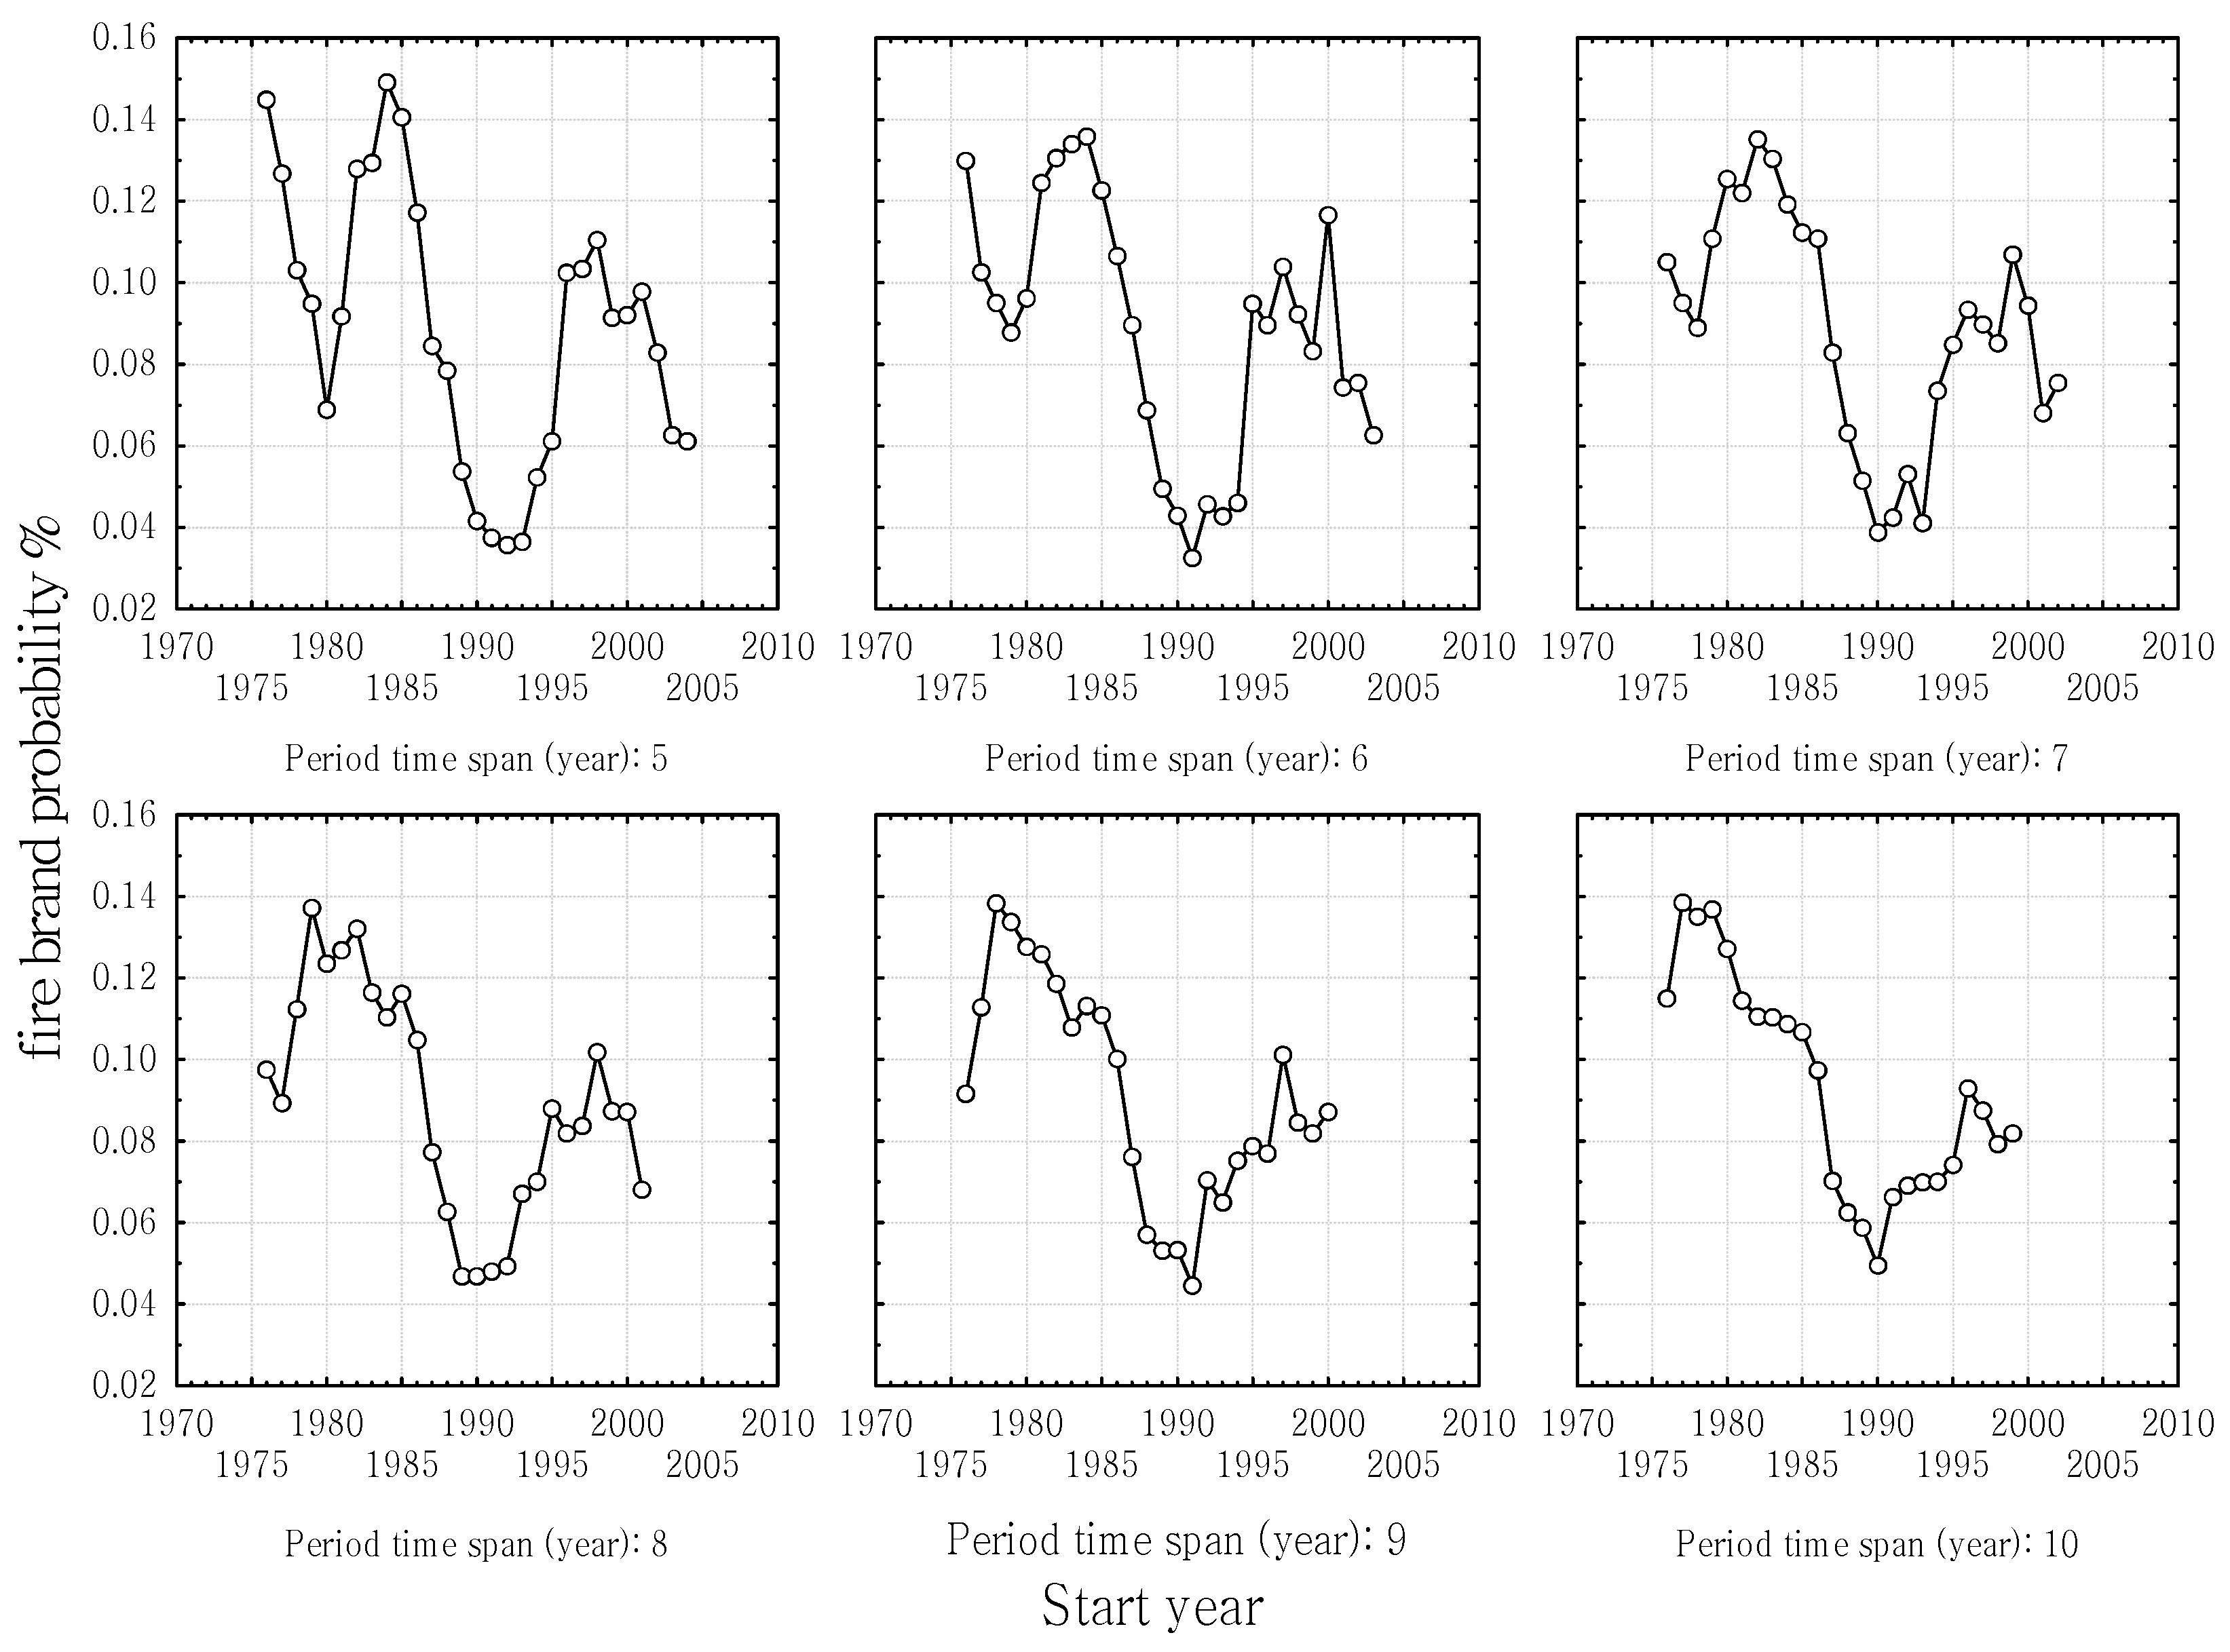
The above factors affecting firebrands in the study area have undergone several changes in the past four decades. For example, high intensity clear cutting, weak fire prevention facility and high population in the 1970s and early 1980s led to high firebrand probability and consequently a large number of fires in the period. Strick fire prevention policy, lower population density and fewer to no timber harvest activities resulted in significantly reduced firebrand after 2009. Generally, firebrands in the region can be relatively constant only for several years or longer with smaller annual variation. The test of a linear relationship between fire probability and IC should be conducted for all the periods with relatively constant firebrand probability. However, little information could be obtained to distinguish the number and durations of these periods in the area. It is believed that these periods would range from 5 to 10 years. Therefore, the linear relationship test is conducted for all the periods spanning from 5 years to the maximum time span of the data used. If the number of such periods is much larger than the number of actual relatively constant firebrand periods based on probability and IC with zero intercept, then the model is deemed as meaningful and suitable for the region.

2.4. Data

Forest fires have been reduced significantly due to strict firebrand management since 2009. So fire and weather data before 2009 were used to determine the suitability of the method in the region. Forest fire data including occurrence data and geographical coordinates were collected for the period of 1974 through 2008 from the Heilongjiang Forest Fire Prevention Center. Daily weather data including minimum and maximum daily air temperature, minimum and maximum daily air relative humidity, rainfall, wind speed of the Mohe County and the Tahe County were collected from the China Meteorological Data Network (http://data.cma.cn/). Since no precipitation duration data were available on the website, daily precipitation and rainfall duration from the Tahe weather station in 2009–2010 were collected to establish a linear regression model to compute daily precipitation duration from daily rainfall. Since there is no cloudiness data available for two counties from the website, the cloudiness was set to 100%, so as to artificially reduce the number of fire occurrences; if this is appropriate, this method is suitable for other cloud conditions.

2.5. Parameterization

Fuel conditions, such as fuel types and loads changed throughout the whole study period in the region, but there is no way of tracking the changes. Therefore, larch (Larix gmelinii) stands, the most common stand in the region, were chosen as a representative fuel type in the region. Parameters of this fuel type required in fire behavior computation were obtained by a field survey of a typical larch stand and the literature [27] and were kept constant for the whole study period (Table 1).
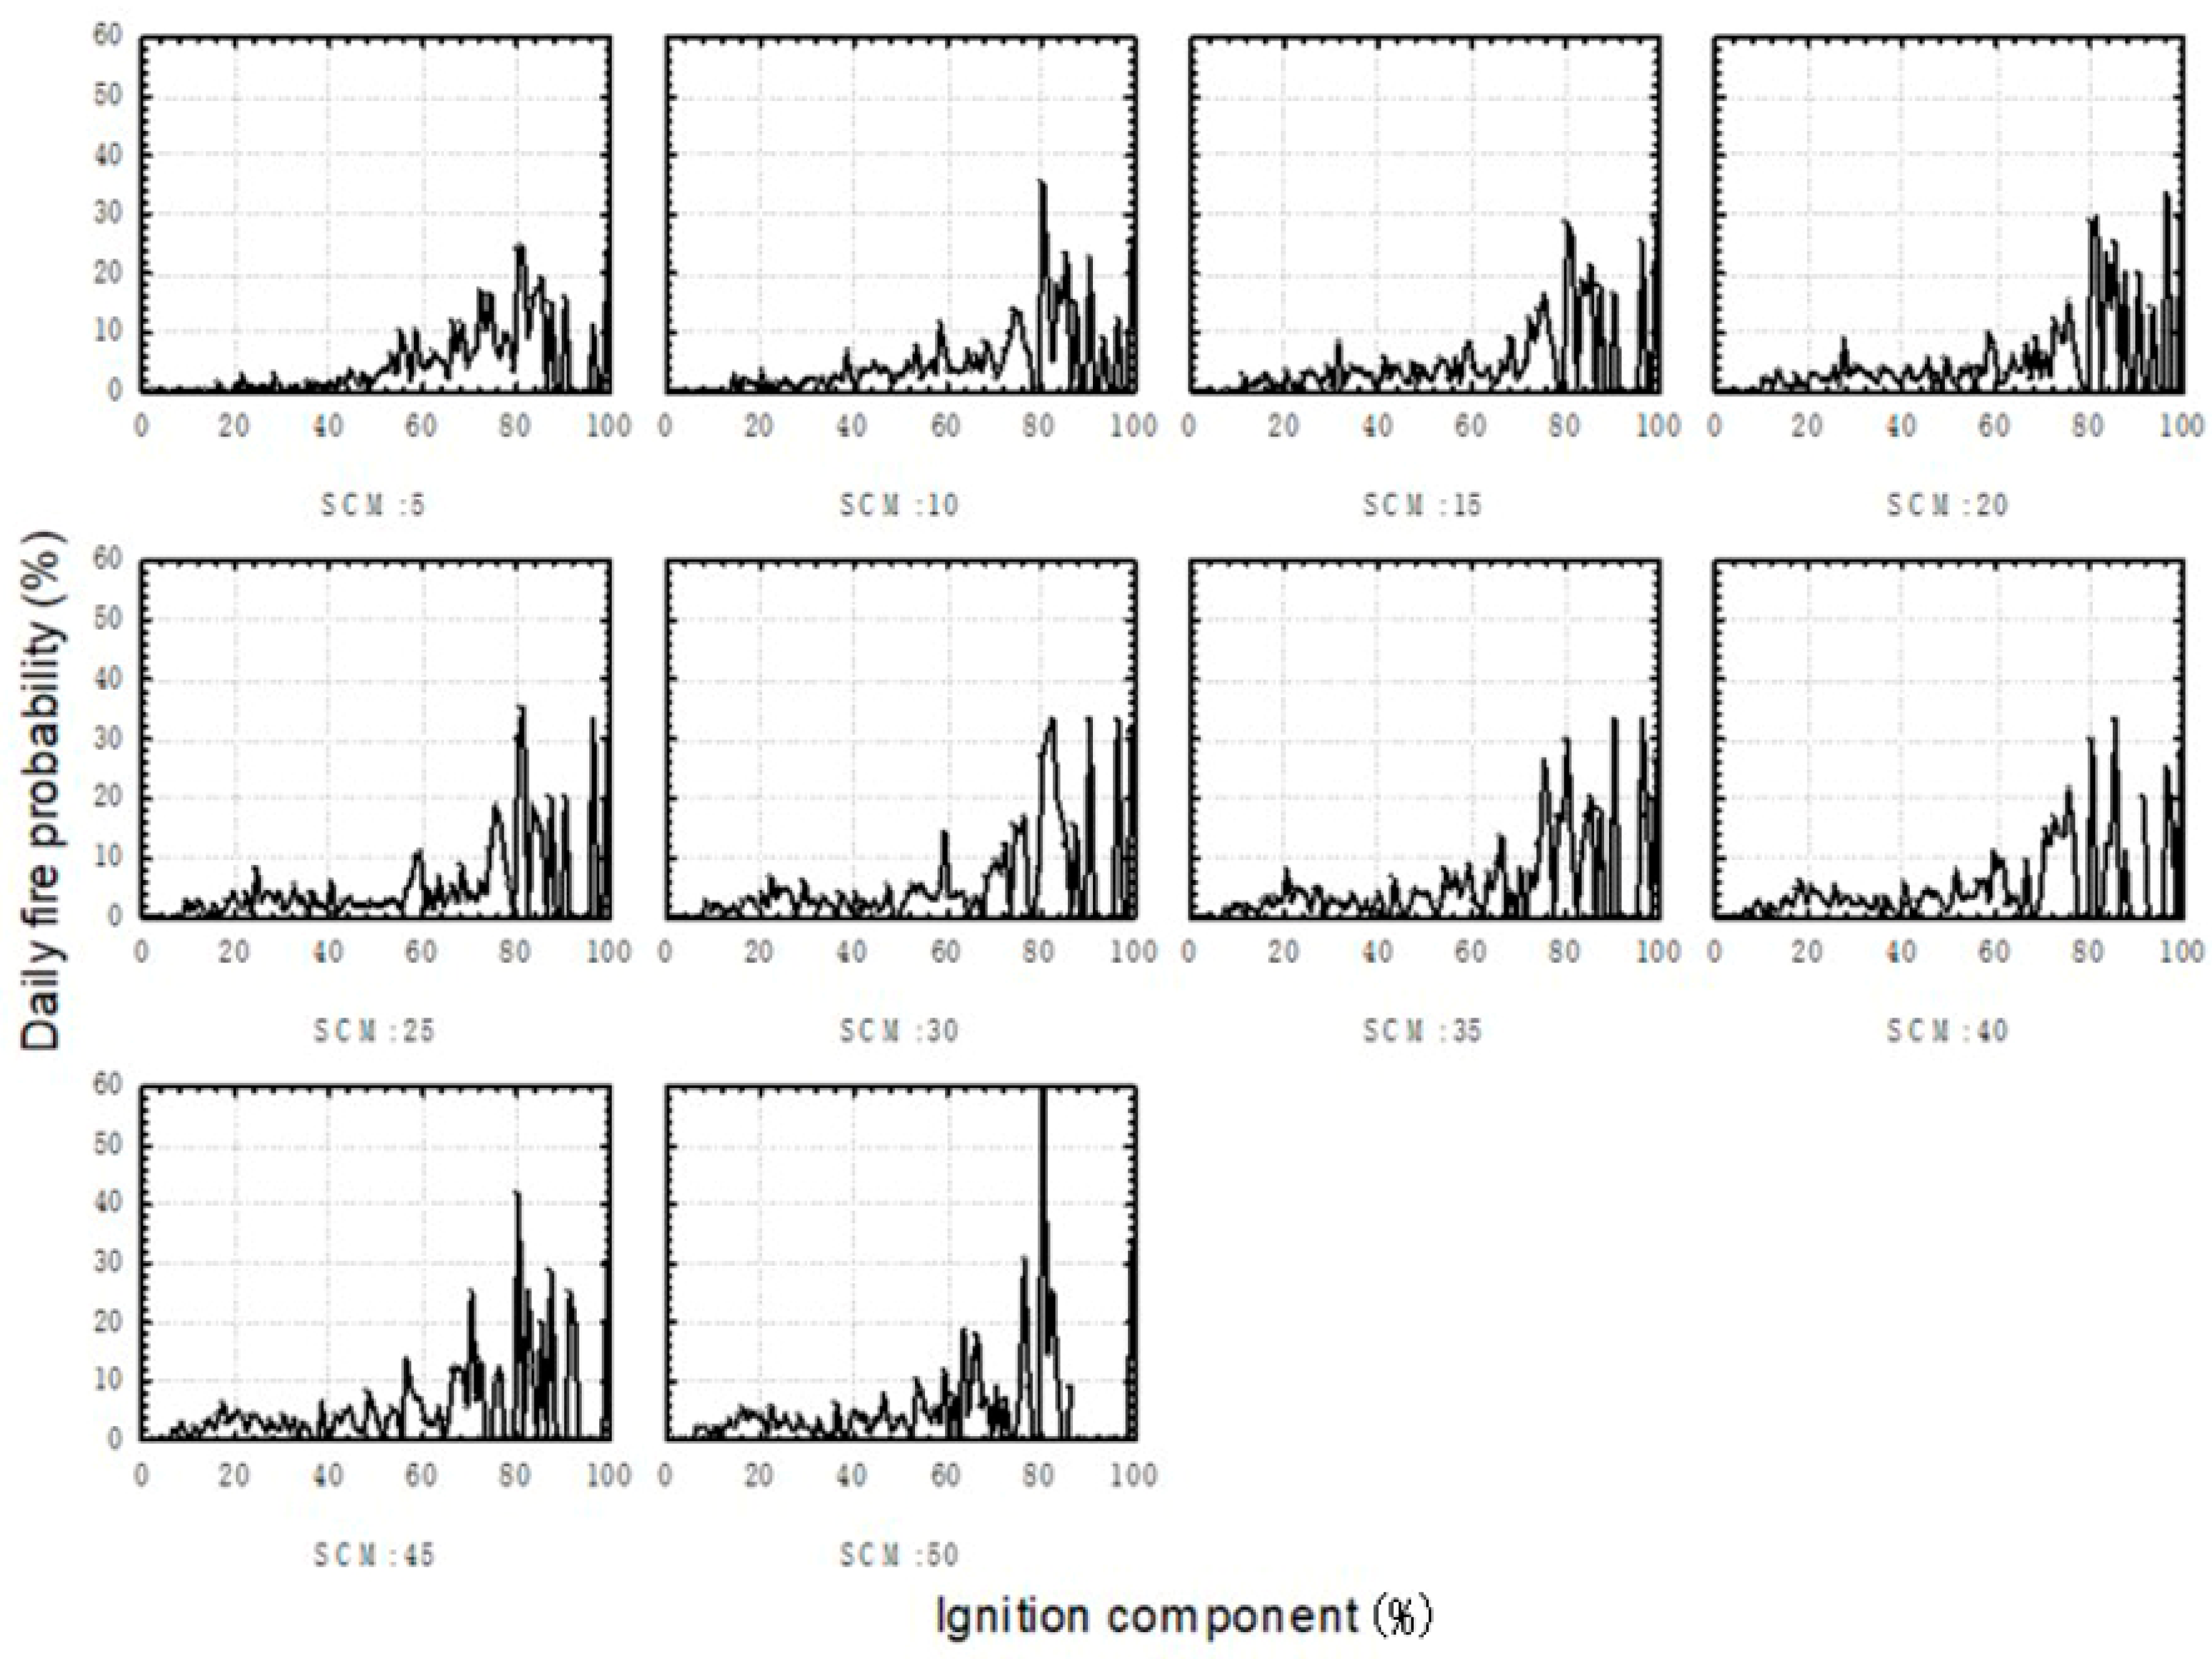
Since SCM is constant for different periods and independent of firebrand, and the longer the time period of data used, the better the fire probability computed, data of years 1976–2008 were used to determine the right SCM for IC calculation. SCM was set from 5 to 50 ft·min−1 with an increment of 5 ft·min−1. SC higher than 50 ft·min−1 is regarded as a surely reportable fire. Since fire was a relatively rare event, more samples for each IC class would increase fire number in the class and avoid too many IC classes with zero fire probability in the computation; the data were separated into two groups, each covering an area of roughly 1.5 million hectares by careful selection: the Tahe group and the Mohe group. For each SCM value, IC was computed using a NFDRS program written in Visual Basic according to the literature [26] for the Tahe group and the Mohe Group with corresponding weather data. Then, the ICs of the two groups were pooled together and divided into 100 classes with a class width of unit IC. Number of days and days with at least one fire occurrence for each IC class were summed, and daily fire probability for the class was computed by dividing the number of days by the number of fire days of the IC class. Then, plots of daily fire probability against IC were drawn for all the SCMs and compared to determine the influence of SCM value on the relationship between daily fire probability and IC. If SCM does not affect the relationship, then it is determined by fire managers, otherwise it is set to the smallest value when a change in the relationship occurs.

2.6. Suitability Assessment

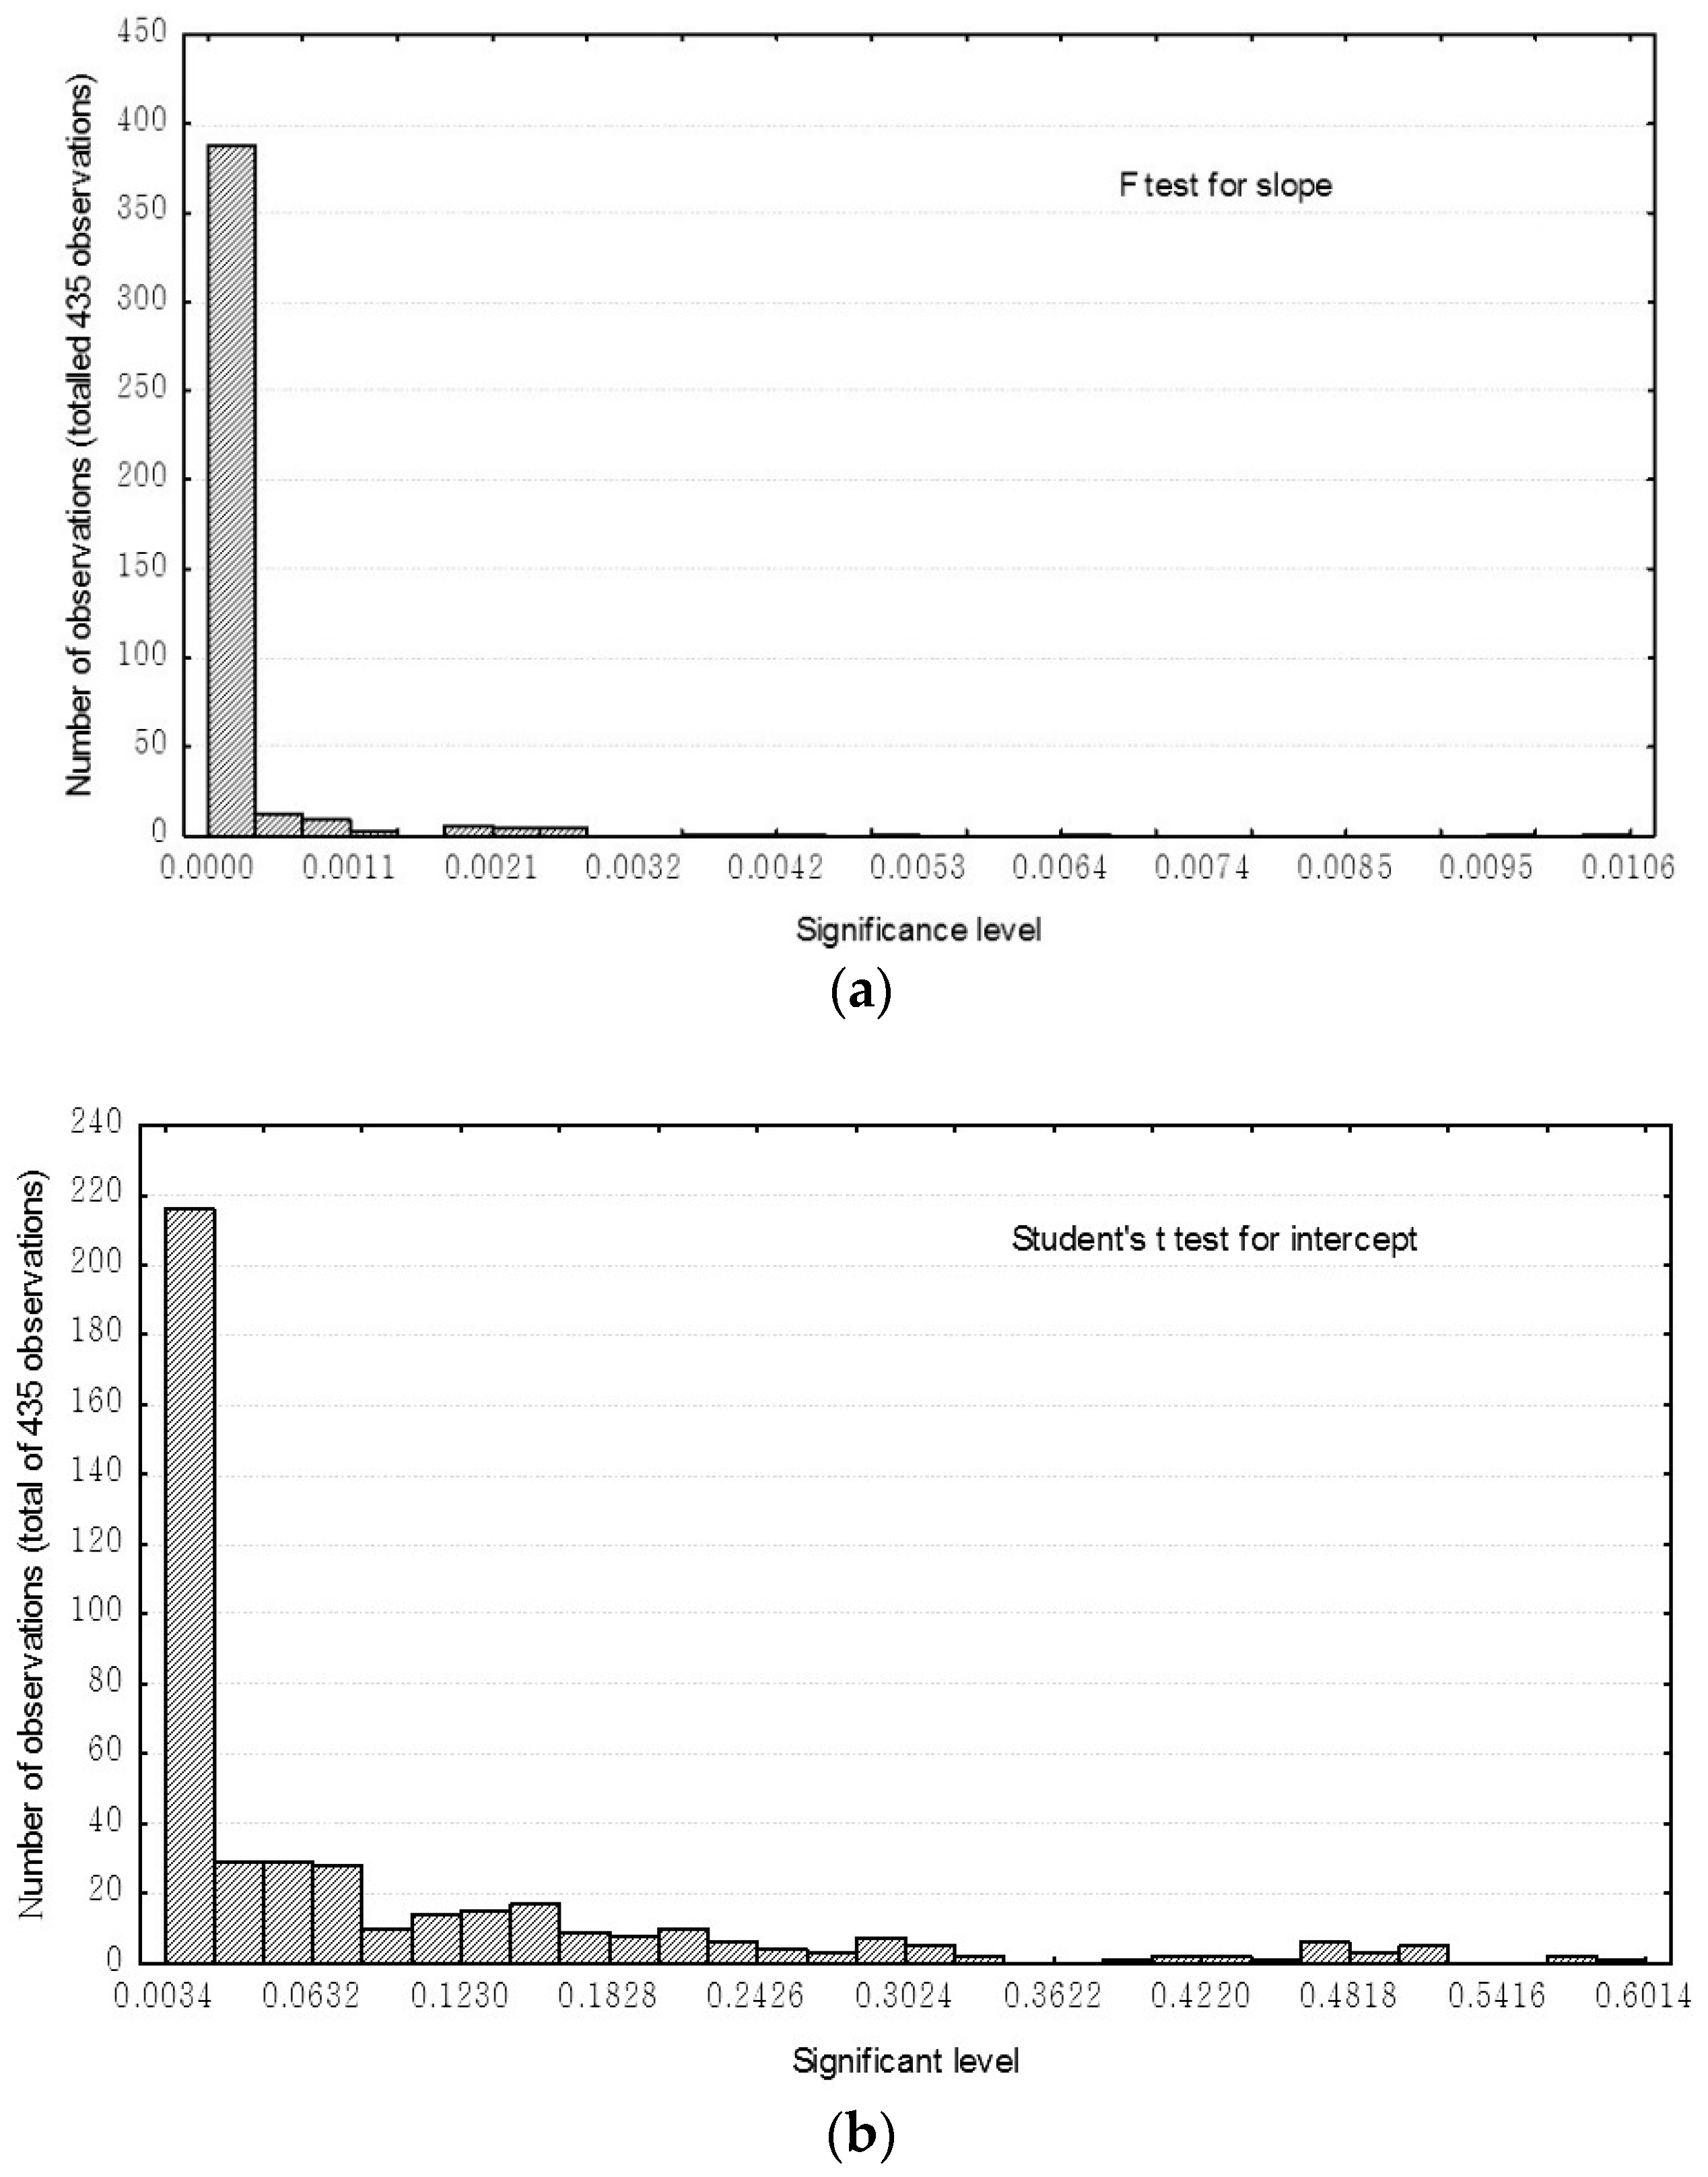
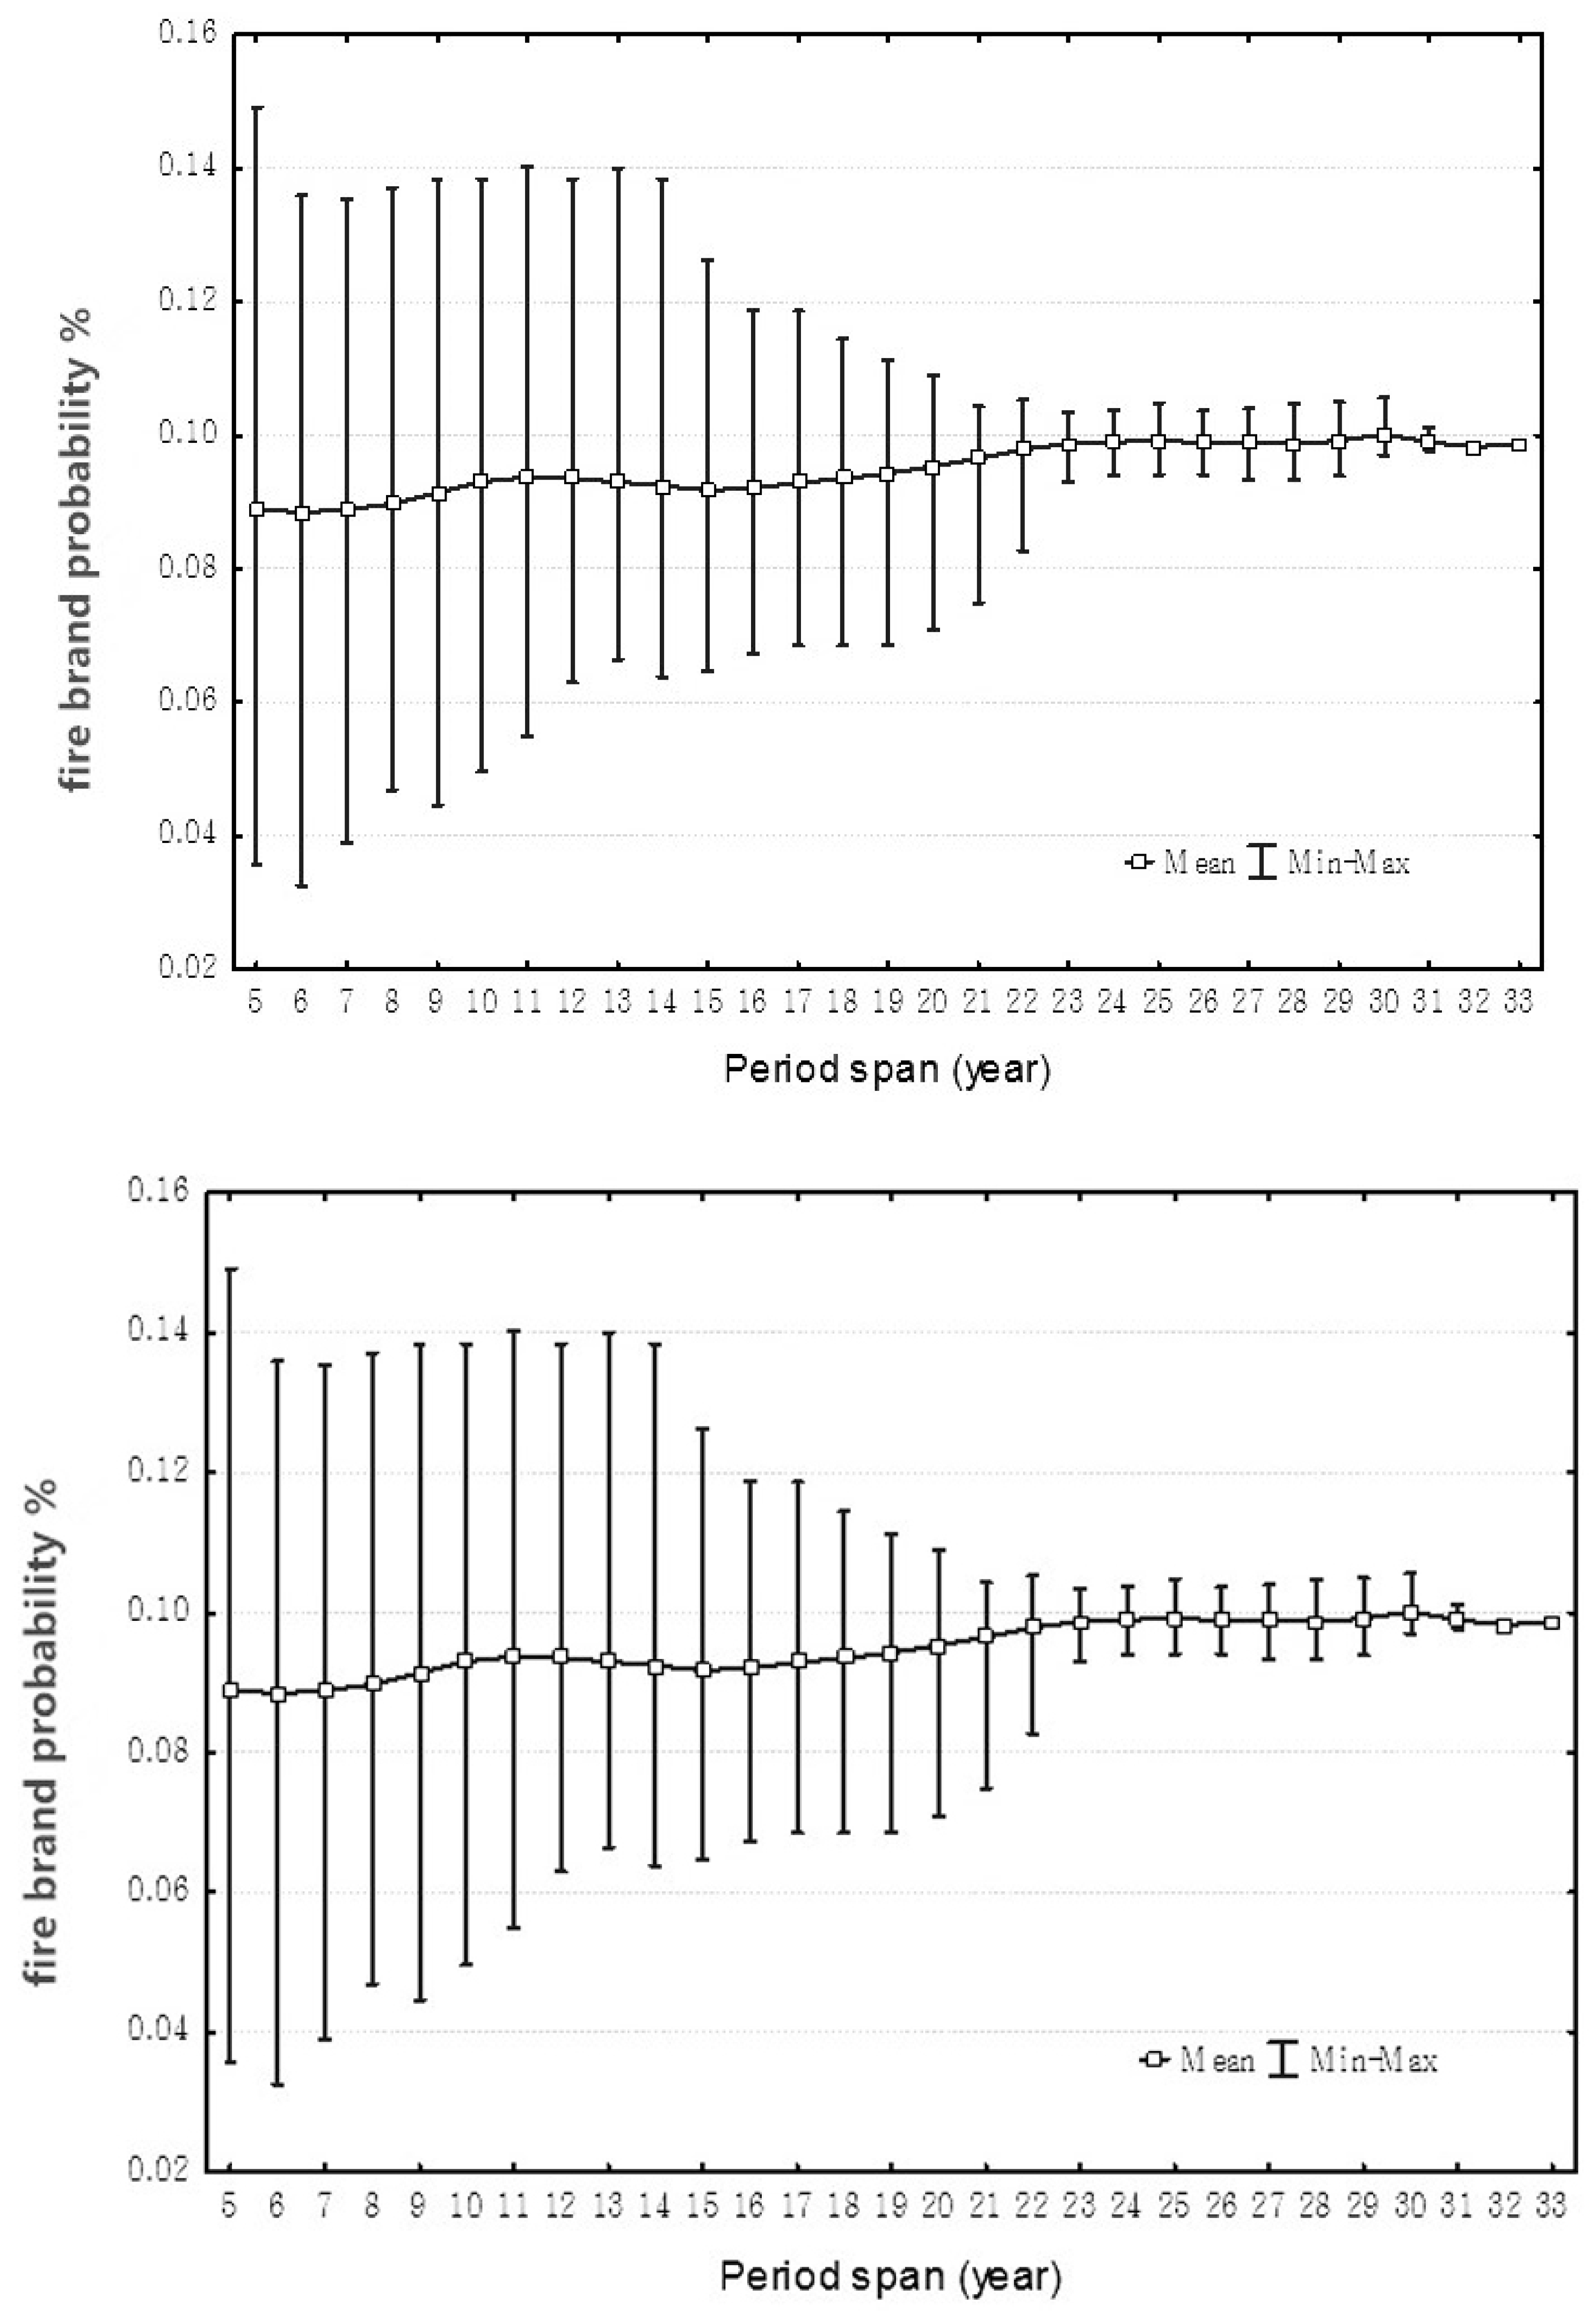
For a constant firebrand period with a time span of m years: the start year of the period can be any year from year 1976 to 2008 − m + 1. Therefore, there are 34 − m possible constant firebrand periods spanning m years. The time spans of constant firebrand periods range from 5 to 33 years, so there are m = 5 33 ( 34 m ) = 435 possible constant firebrand periods; IC was computed with SCM determined in Section 2.5. Then, the ICs were pooled and divided into 100 classes with equal width of unit IC. Number of days and days with at least one fire occurrence were summed for each IC class and daily fire probability was computed by dividing the number of days by the number of fire days of the IC class. Linear regression analysis of firebrand probability over IC was conducted using the Statistica (StatSoft, Inc., Palo Alto, CA, USA) Visual Basic program. An F test was used to test the significance of the slope, and Student’s t test was used to determine if the intercept was zero.
Since IC and daily fire probability used for the linear regression analysis were pooled data of the two counties, the resulting firebrand probability should be a firebrand probability occurring within an area covered by each of the two groups, namely, 1.5 million hectares.

2.7. Accuracy Assessment

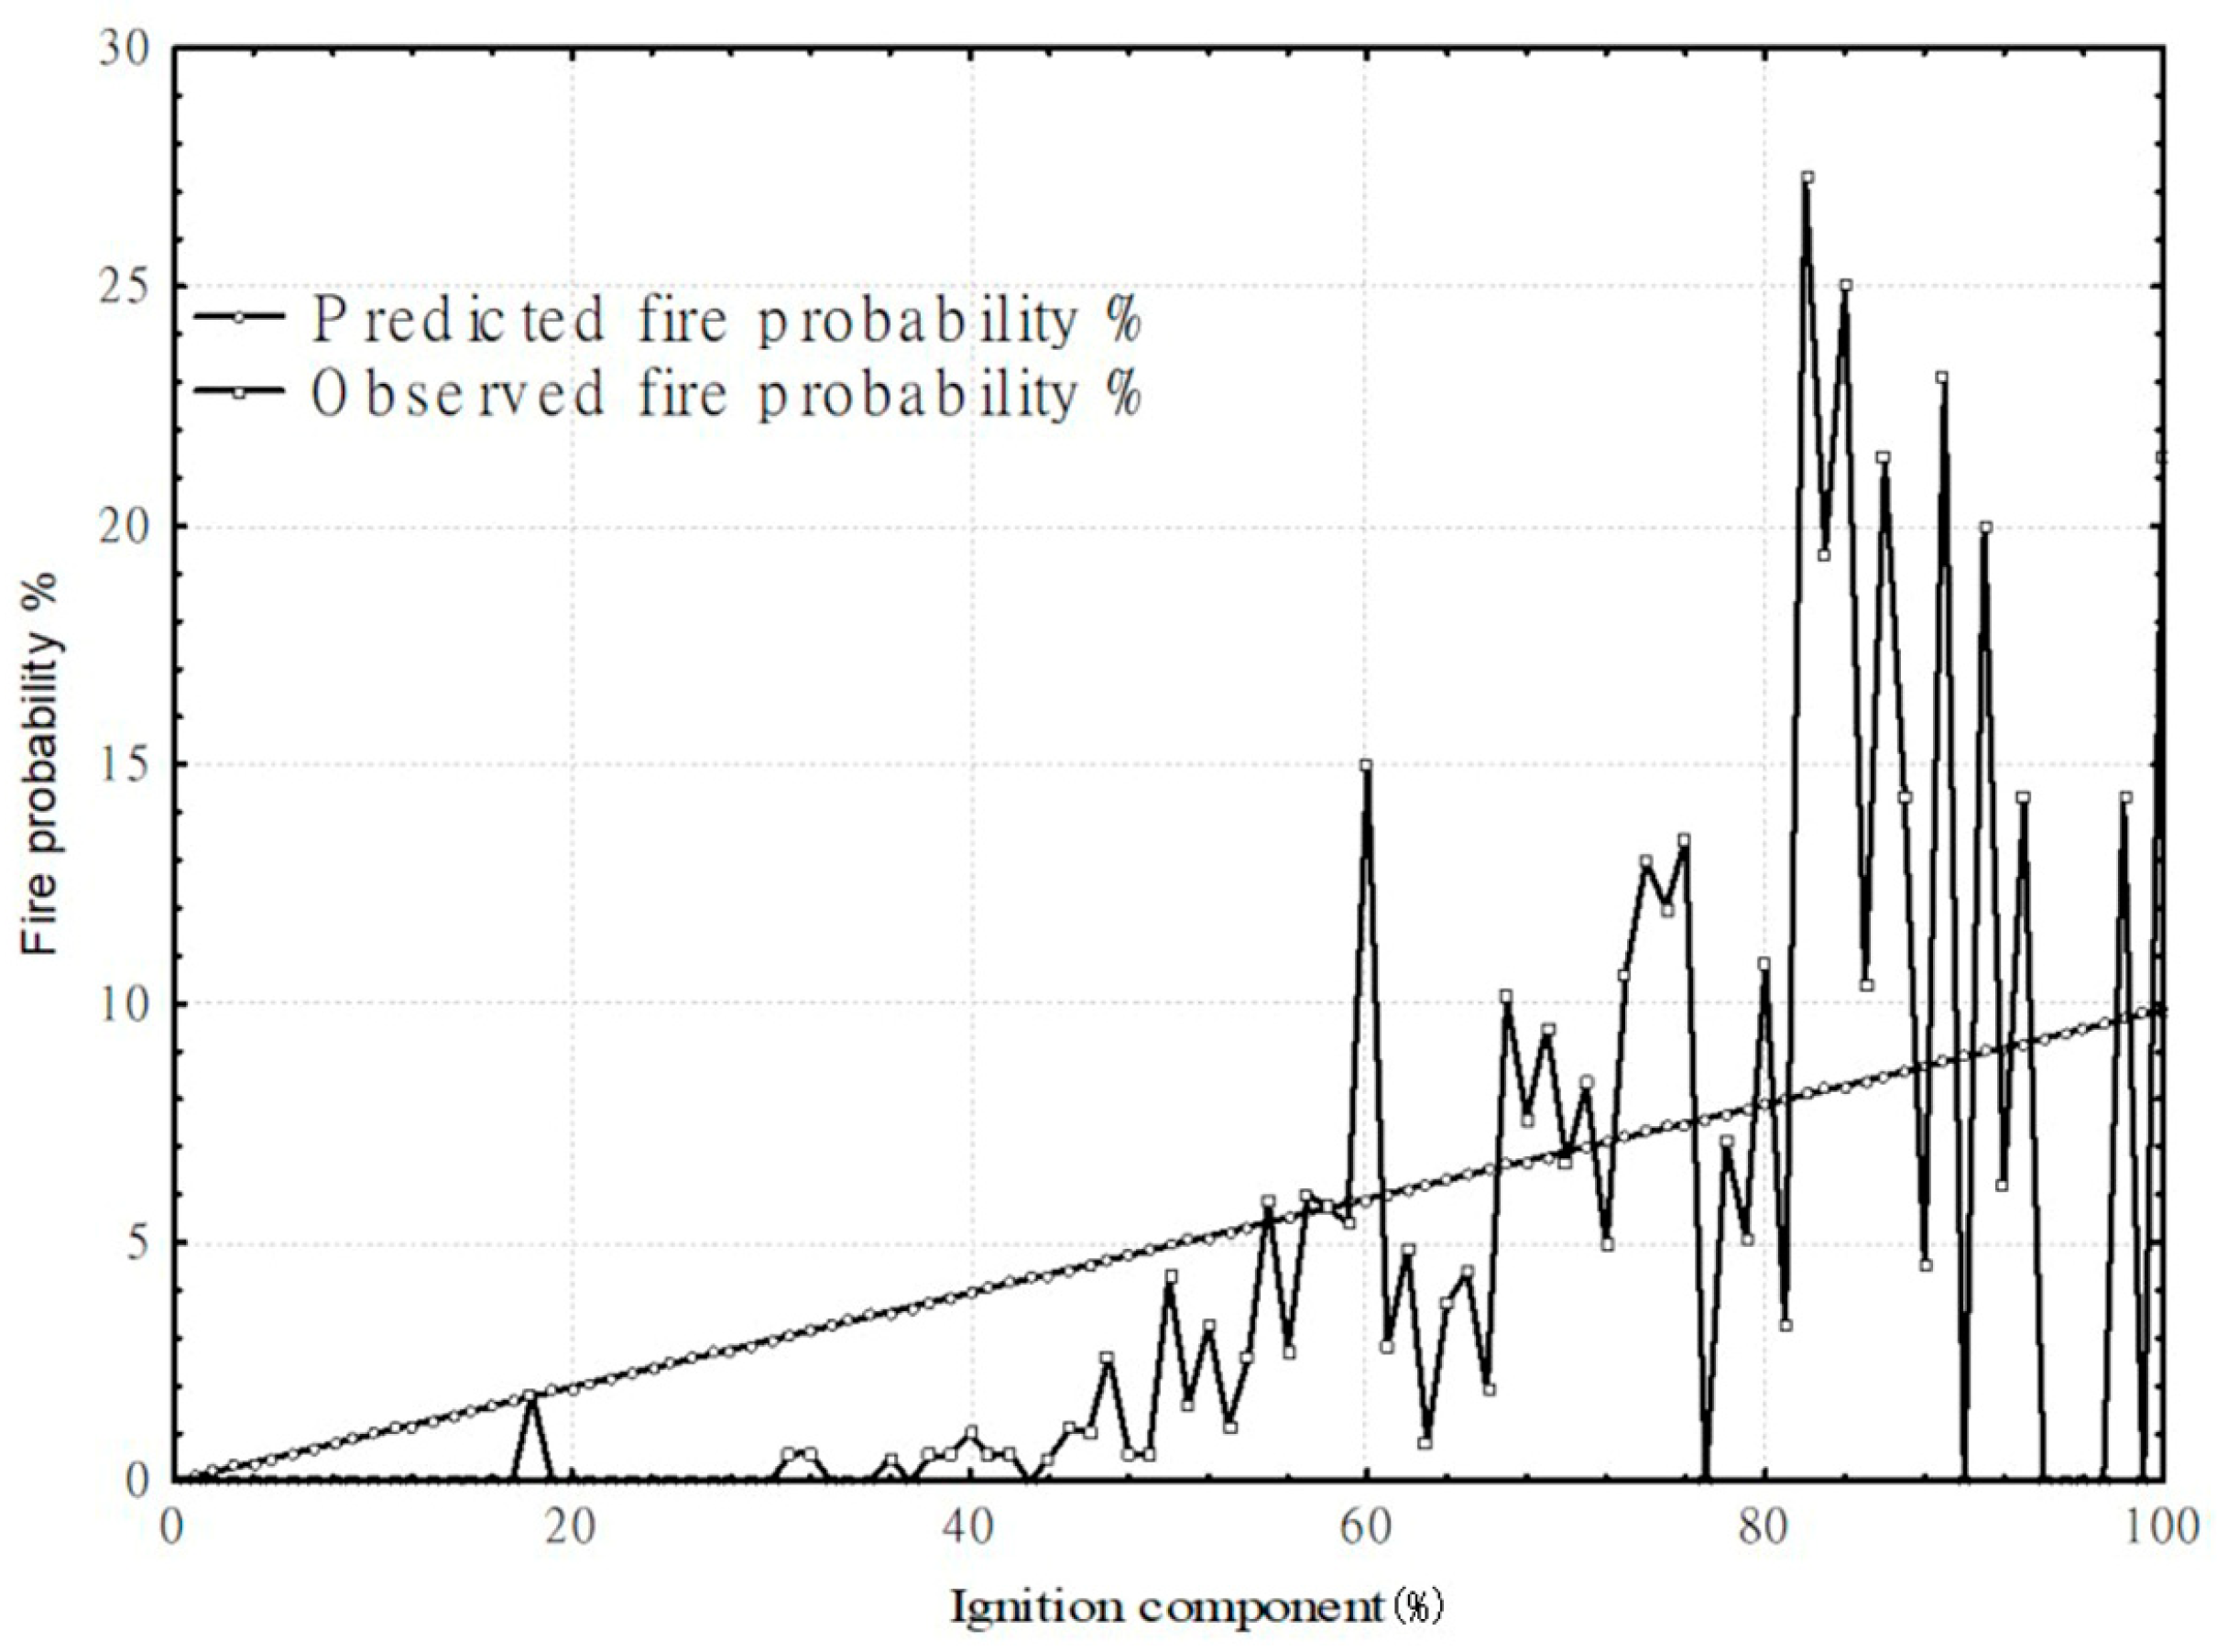
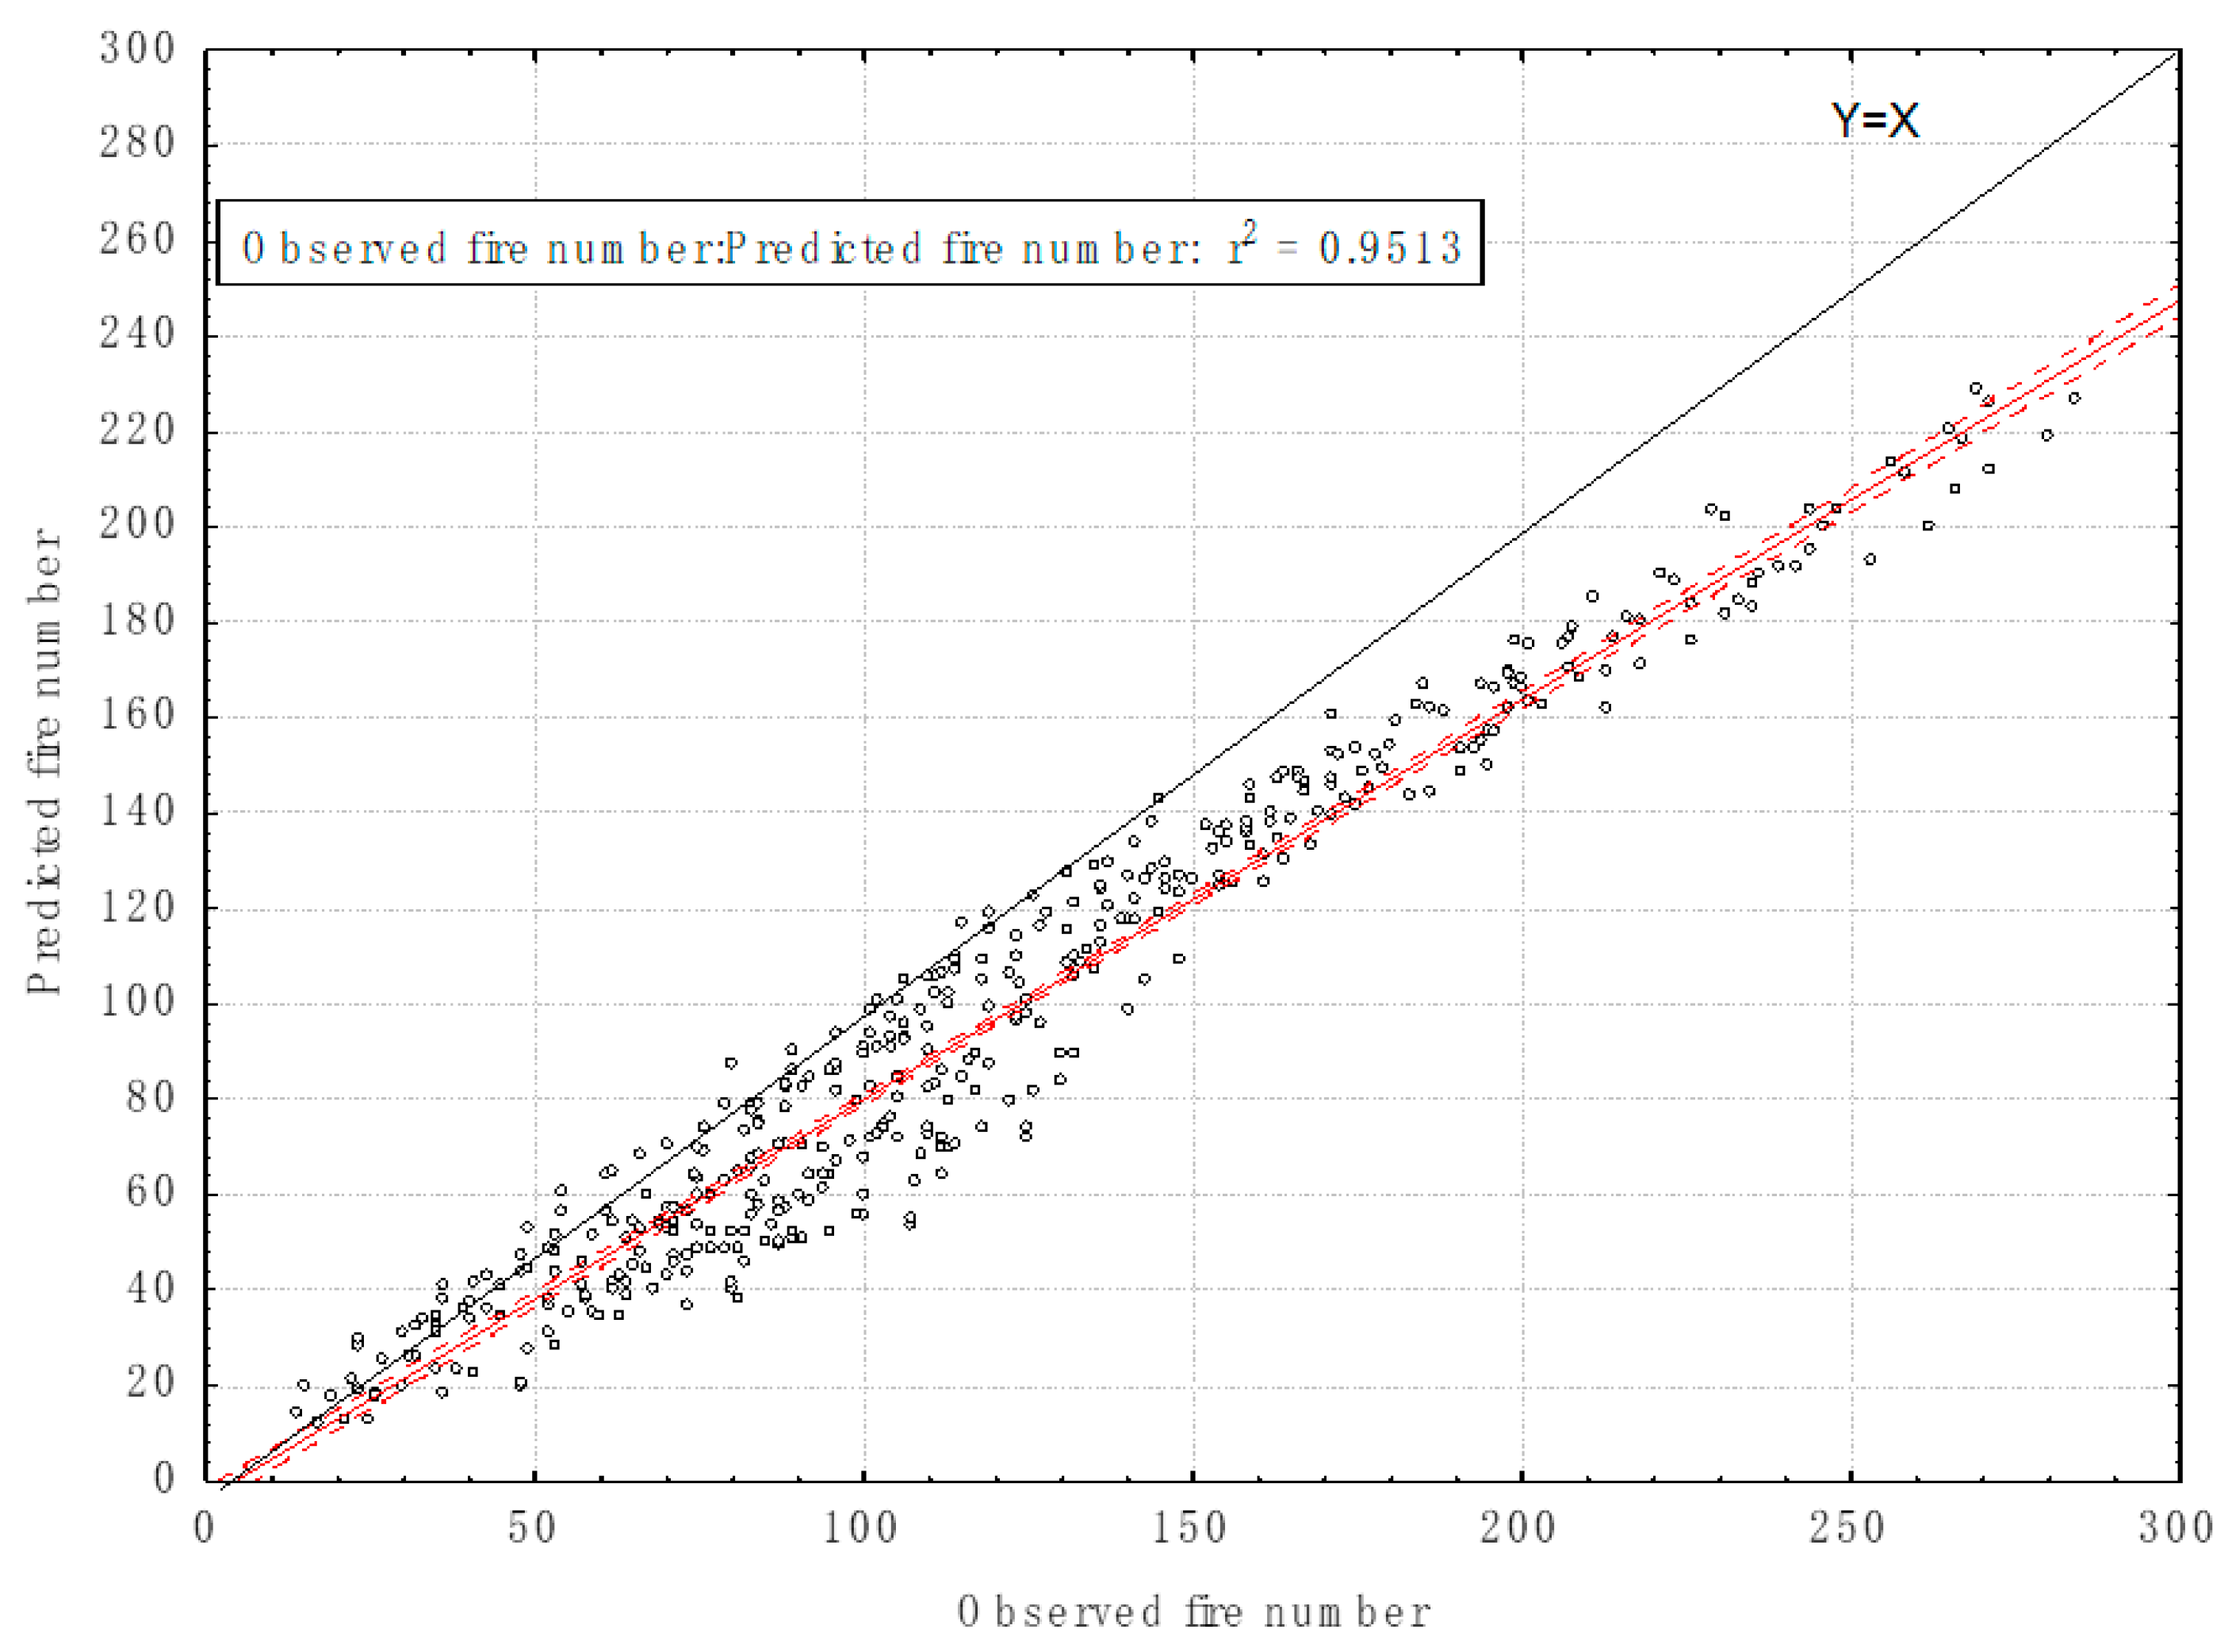
Accuracy assessment of the method was accomplished in two ways: one is the assessment of daily fire probability prediction, which reflects the linear-formed equation’s ability to predict daily fire probability from IC; the other is the prediction of fire occurrence number within a certain time period, which reflects the method’s ability to predict fire occurrence.
Daily fire probability was computed using the linear equations with corresponding regression coefficients of the 435 tests. The total fire number in a period in the study area is the sum of the fire number of the Tahe County and the Mohe County. For each county, the expected total fire number in the period is the sum of daily fire probability in the period, which is the product of IC and firebrand probability. The longer the data period, the more reliable the accuracy assessment. Therefore, the accuracy assessment of total fire number prediction was conducted on two kinds of numbers, one is annual fire number, the other is the sum of fire number within a period. The expected annual fire number for a particular year was taken as the mean of all the predicted fire numbers of that year in all of the 435 tests. This would generate more reliable results than only using one single predicted fire number of that year. The total observed and predicted fire numbers within each period of the 435 tests were computed.
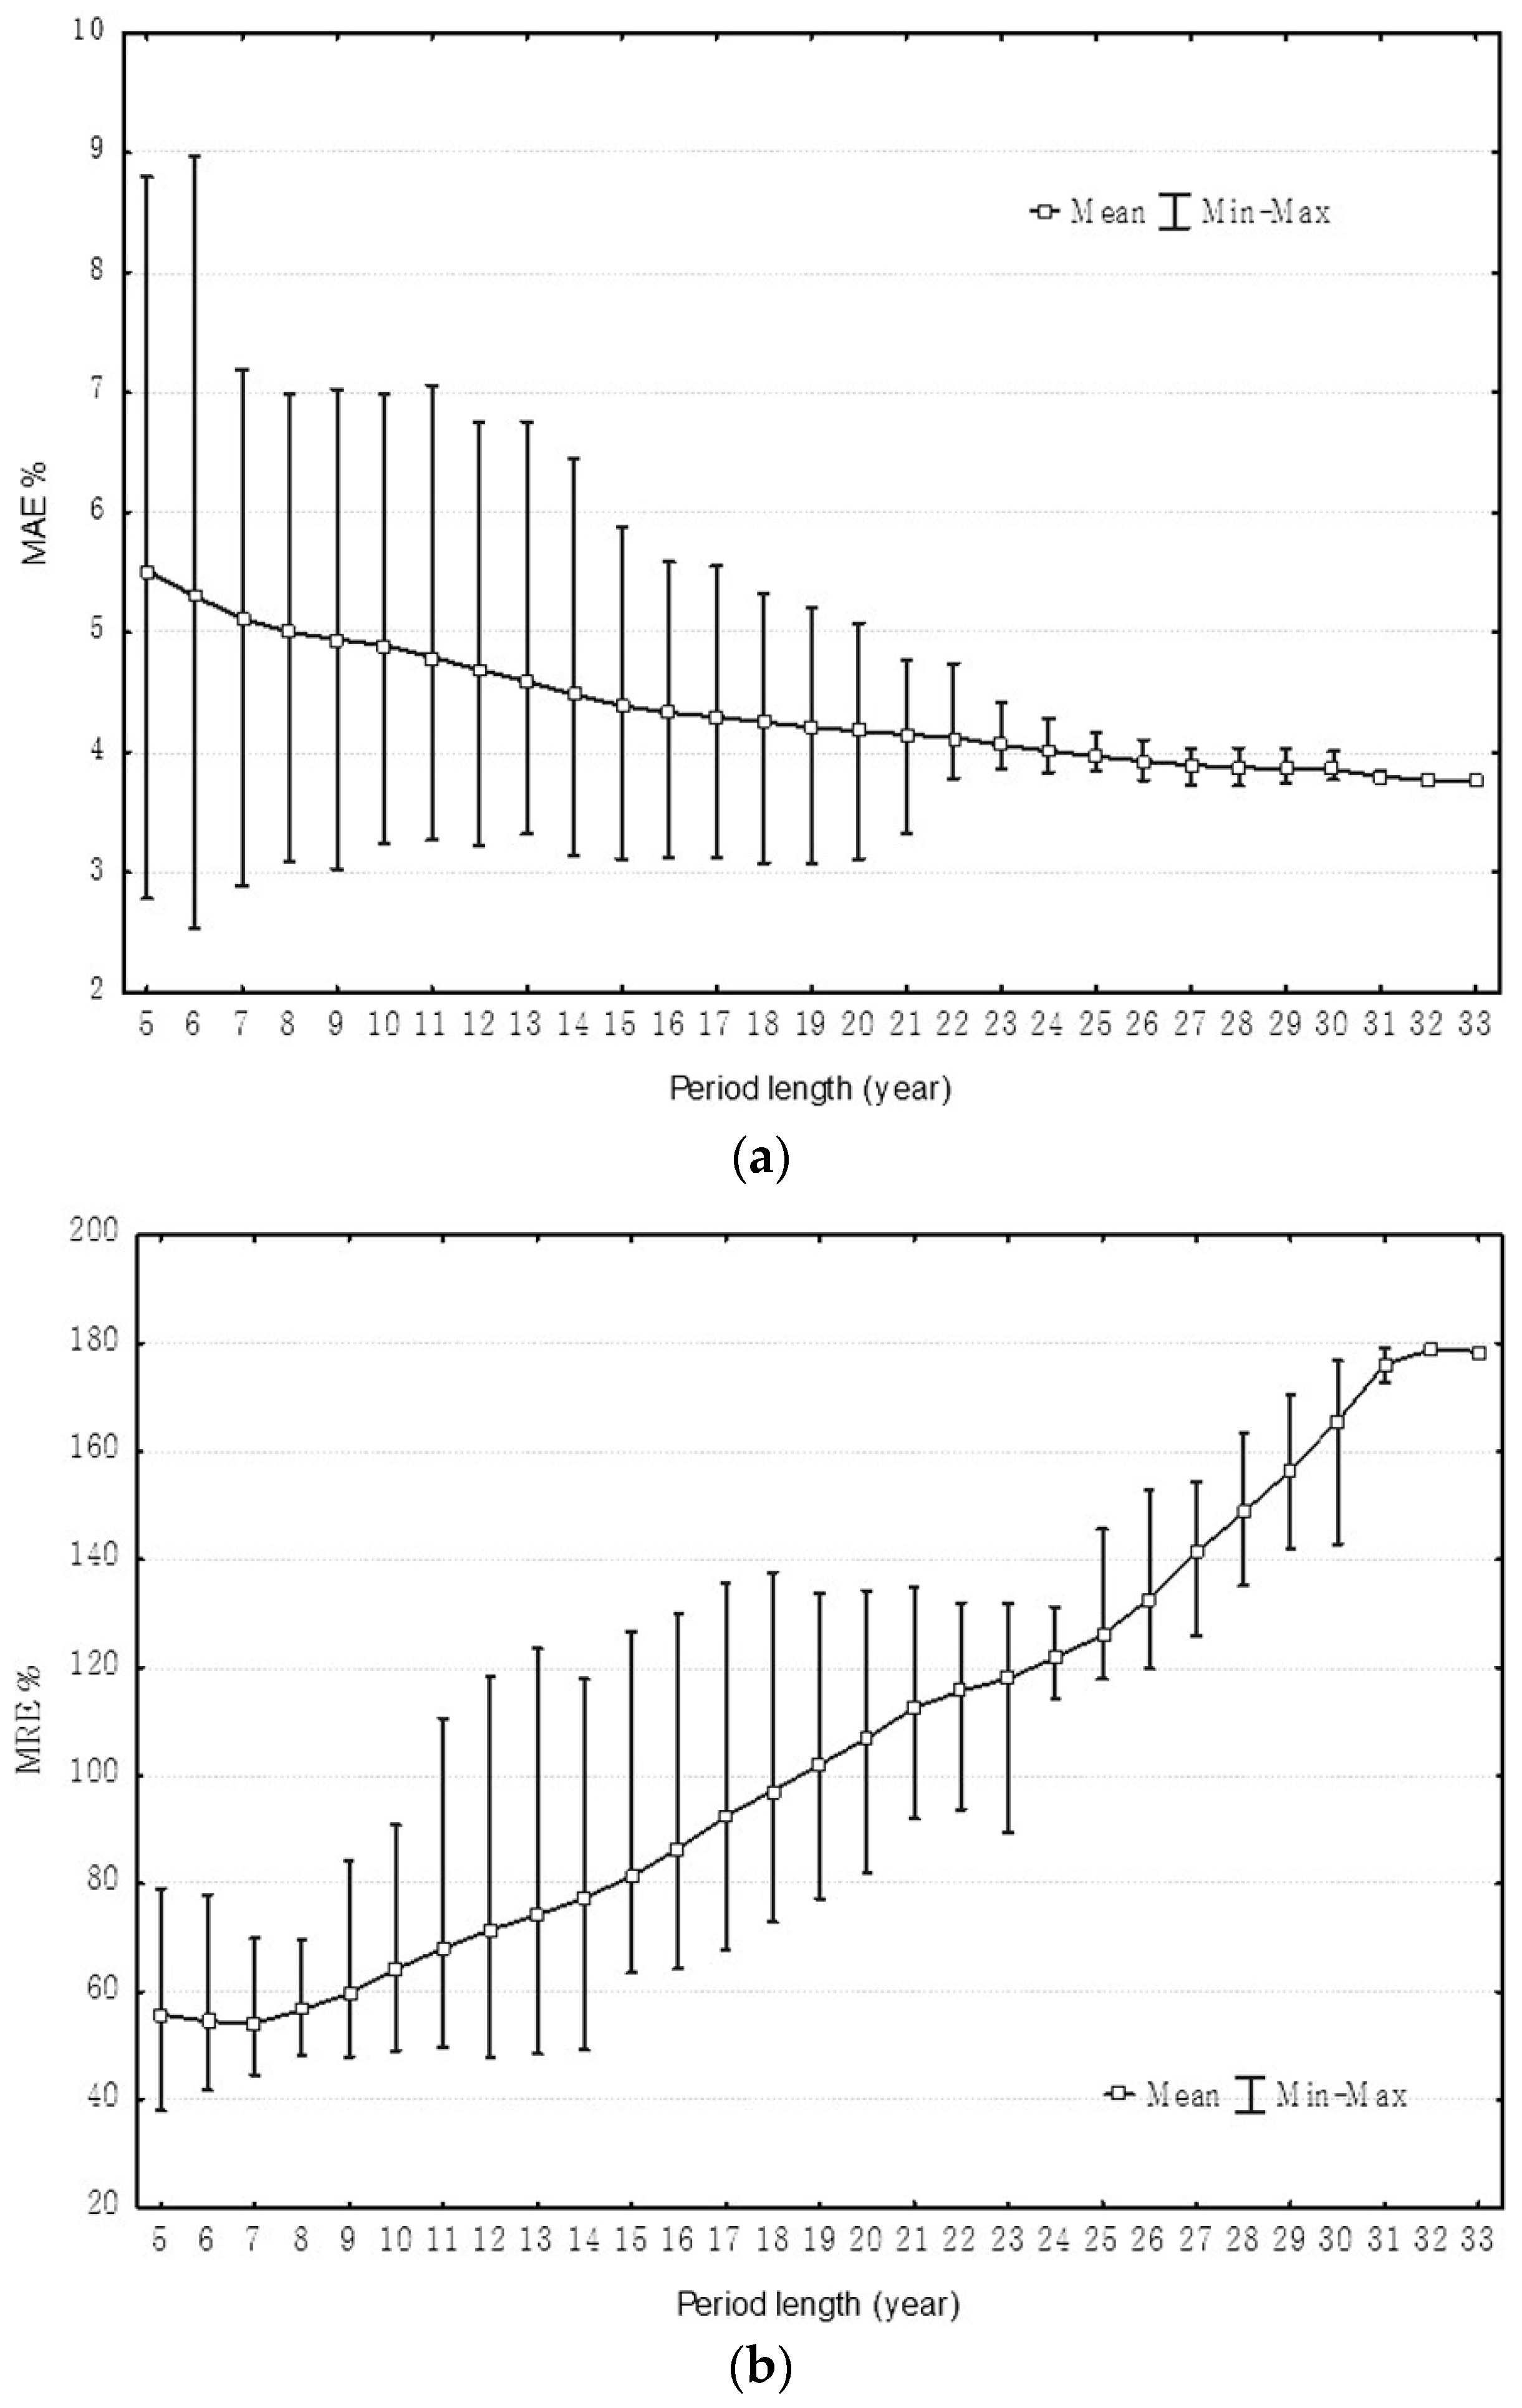
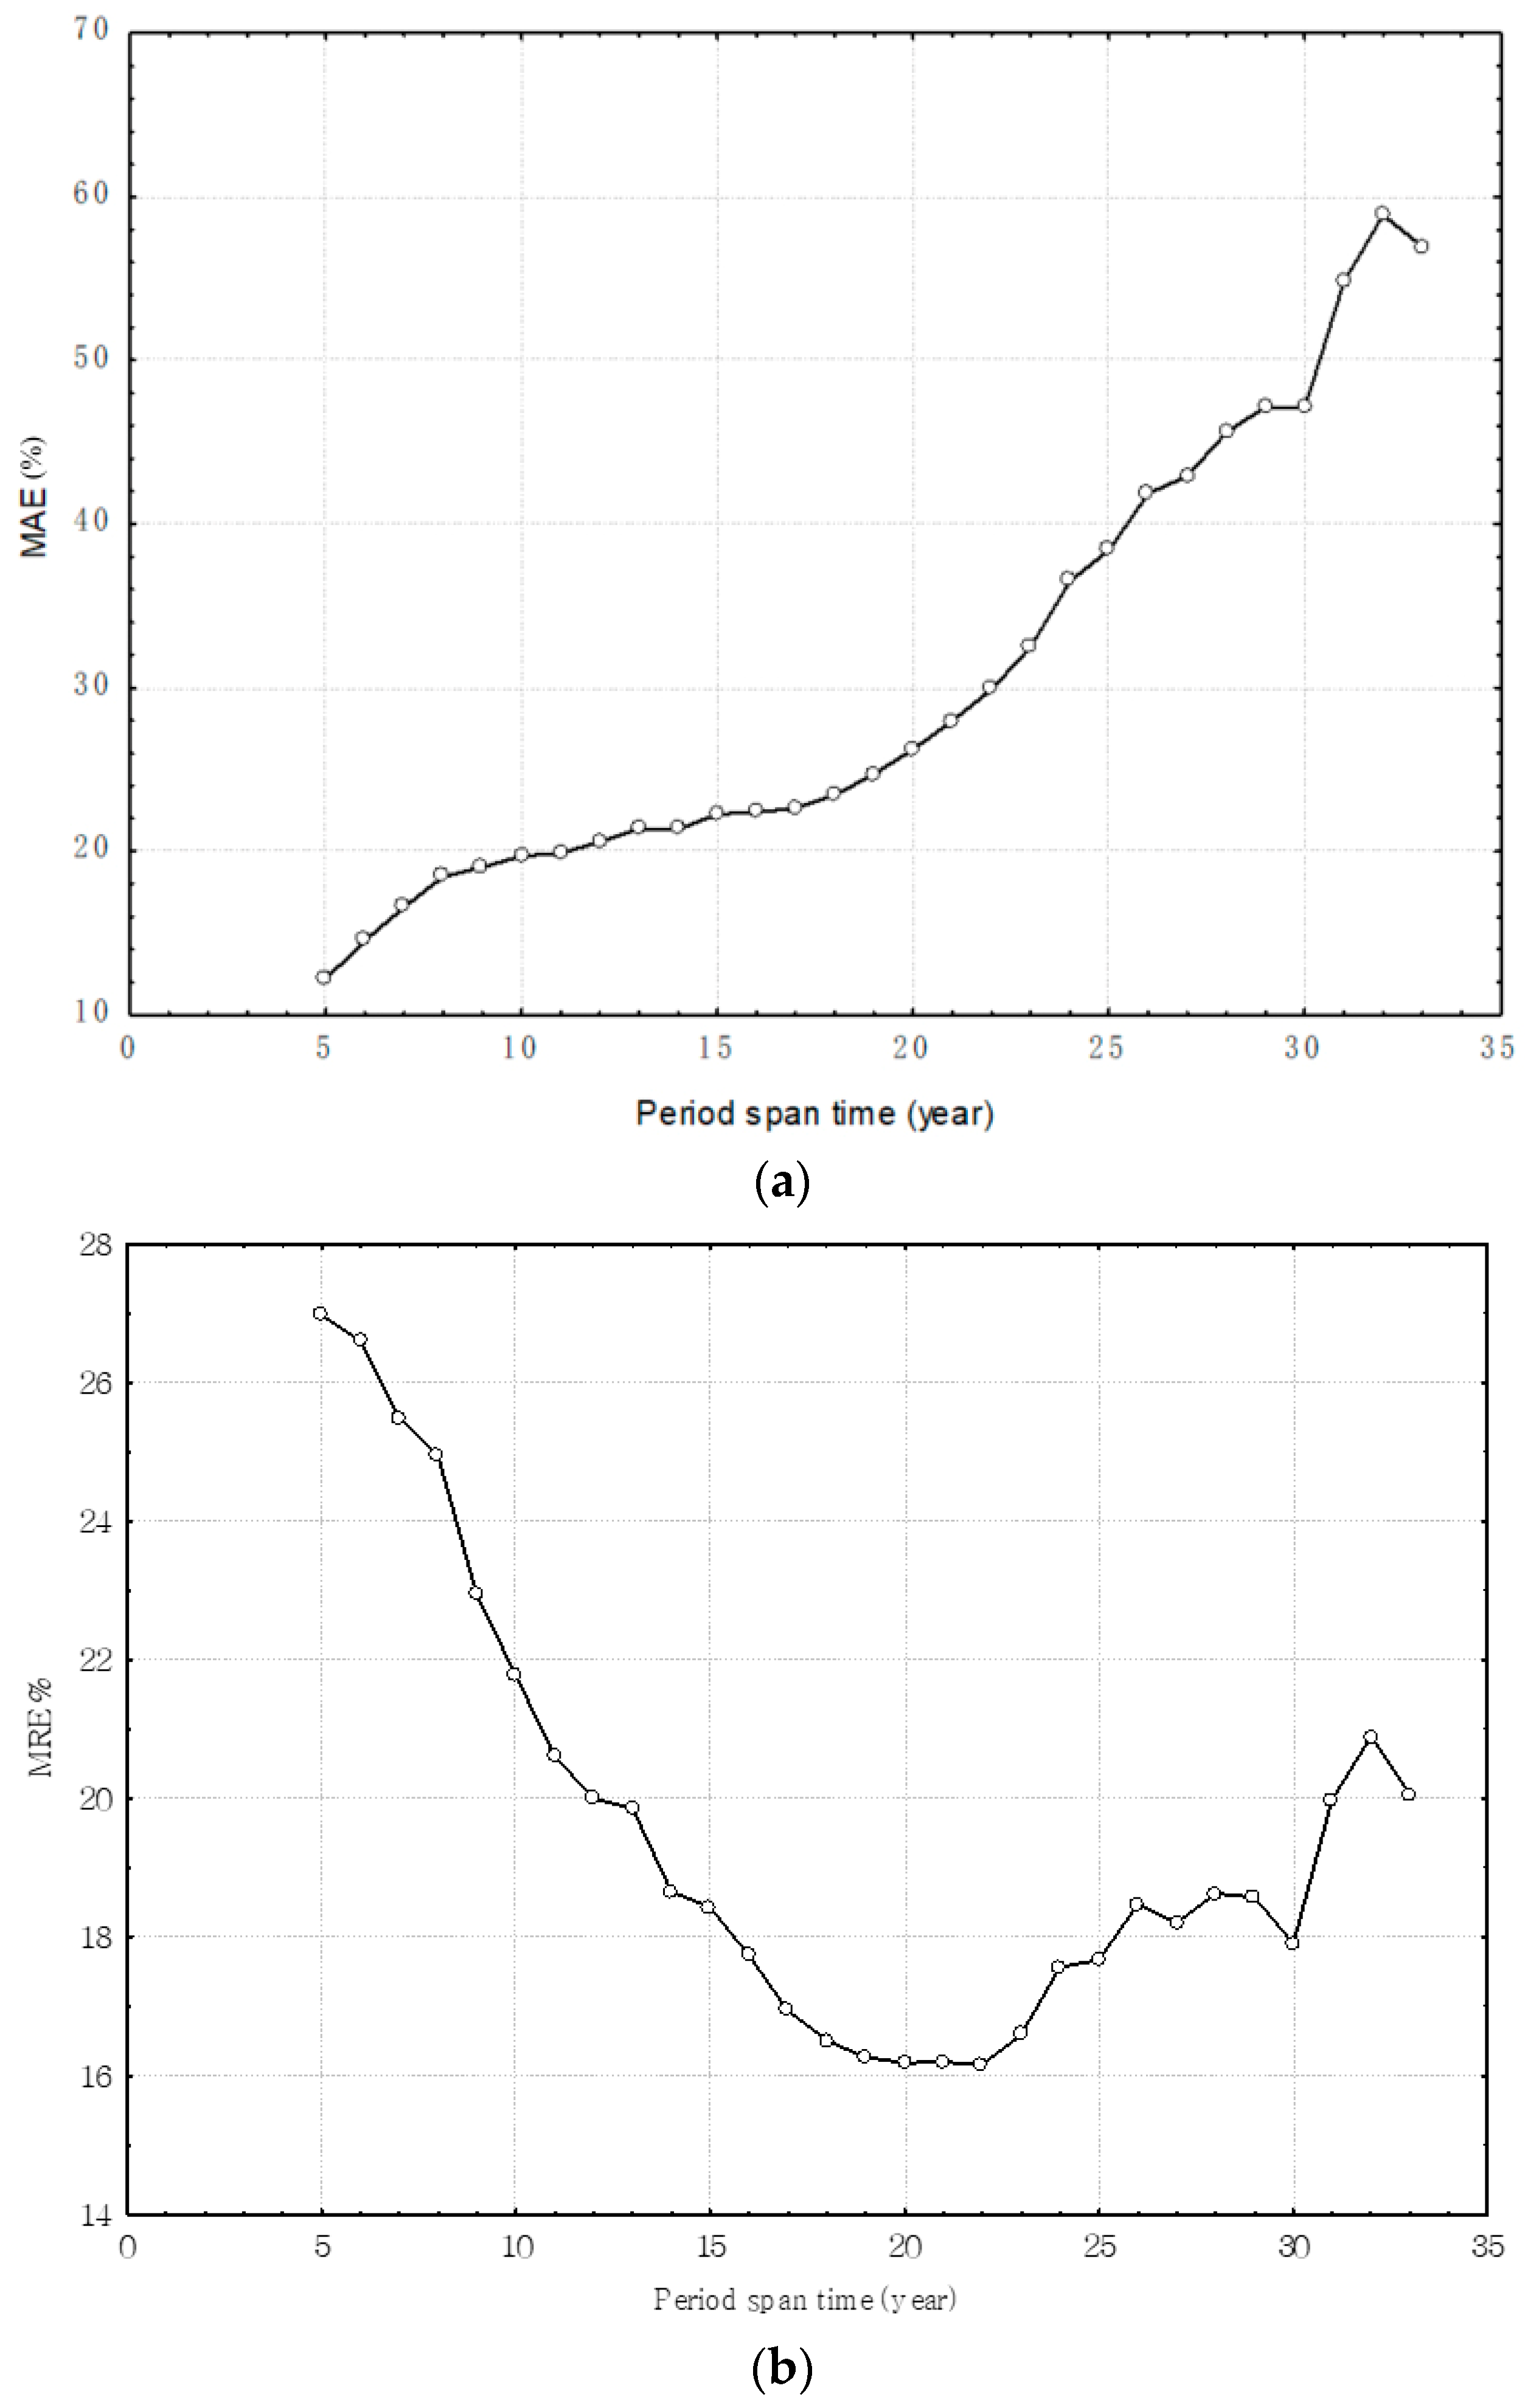
The prediction accuracies were evaluated by mean absolute error (MAE) and mean relative error (MRE) computed using the following equations:
M A E = i = 1 n | m i m ^ i | n
M R E = i = 1 n | m i m ^ i m i | n
where, mi and m ^ i are the respective observed and predicted daily fire probability or annual fire number or total fire number in a period, and n is the number of IC classes used in regression, 100 here. Changes in MAE and MRE with the start year of each period were analyzed by plotting MAE or MRE vs. start year of periods spanning different years.

3. Results and Discussion

3.1. SCM Value

Figure 2 shows similar relationships between daily fire probability and IC computed with varied SCM values using data of year 1976 through 2008. Four levels of daily fire probability can be identified from the curves. The first level is where daily fire probability is zero when IC is lower than a certain value, which is around 10. The second level is where daily fire probability is around 5% when IC is 10–60. The third level is where daily fire probability is around 10% when IC is 60–80, and the fourth level is where daily fire probability is higher than 20% when IC is greater than 80. These imply that the SCM value has a minor effect on the analysis of the relationship between daily fire probability and IC. Therefore, 20 was chosen as the right SCM based on judgement from fire management staff in the region.

3.2. Suitability of the Method

Distributions of the significant level of the F test of the slope and t test of the intercept of the 435 regressions are presented in Figure 3. The mean of the significant level of the F test of the slope of the 435 regressions of firebrand probability over IC is 0.000236 with a maximum of 0.010590 and standard deviation of 0.000965. This indicates linear relationships between firebrand probability and IC existed for the region. The mean of the significant level of the t test of the intercept of all the 435 regressions of firebrand probability over IC is 0.087000 with a range of 0.003400 to 0.601400 and standard deviation of 0.122000. One hundred and eighty out of the 435 tests have a significant level of the t test of the intercept higher than 0.05, which means 41.4% of the intercepts of the 435 regressions are statistically equal to zero. Although nearly 60% of the regressions did not have a zero intercept, this does not mean the unsuitability of the new method in the region. In fact, if daily fire probability Pf and IC have the following linear relationship:
Pf = a × IC + b
where a, b are regression coefficients. Then Equation (12) can be rewritten as:
Pf = a × (IC + b/a)
Let ICnew = IC + b/a, Then
Pfnew = a × ICnew
Therefore, the daily fire probability can be expressed at least as a conduct of a constant and a new IC equal to the original IC with a shift (nearly 40% of zero shift). This indicates that the established method with modification can be used in the area to separate the effects of firebrand and the fuel-weather complex on fire occurrence probability. The new IC can be used to depict the effects of the fuel-weather complex on fire occurrence probability. Based on historical fire data, the maximum of the new IC can be determined, and corresponding fire danger classes determined according to IC values.
The reason for a shift of IC can be traced to the fact as mentioned in Section 3.1 (Figure 2) that zero fire probability occurred below a certain IC threshold. This is caused because it is usually in early spring and late autumn when IC is lower and the study region is usually covered with snow or relatively cold at that time and correspondingly, almost no fire occurs in that period. Carcia [4] and Beverly [28] also believed that fires occurring outside the fire season, such as in the early spring and late fall, are infrequent and easily controlled.

3.3. Accuracy of the Method

3.3.1. Accuracy of Daily Fire Probability Prediction

The mean of MAE of predicted daily fire probability ranges from 3.76 to 5.5%. It decreases with the time span of relatively constant firebrand period (Figure 4), from the maximum of 5.5% for periods of 5 years span to 4.89% for periods of 10 years and dropping to 3.96% for periods of 21 years and to the minimum of 3.76% of a period of 33 years. Variation of the mean also decreases with the time span of each period. The mean of the MRE of predicted fire probability increases gradually with time, from the minimum of 55.5% for periods of 6 years to the maximum of 178.8% for periods of 32 years.
Due to paper size limitation, only predicted and observed daily fire probability of the period from 1976 to 2008 is presented here for comparison (Figure 5). A nonlinear relationship between daily fire probability and IC can be identified. Daily fire probability decreased and fluctuated strongly for higher ICs, implying the remarkable influences of random firebrands and firebrand prohibition measures. The method over-predicted daily fire probability when IC is lower than 40, and under-predicted daily fire probability when IC is higher than 65.

3.3.2. Accuracy of Fire Occurrence Prediction

The MAE and MRE of annual fire prediction are 5.33 and 102%, respectively. The correlation coefficient between the two fire numbers is 0.54 (R2 = 0.292), meaning that the predicted annual fire number accounts for nearly 30% of the variation of annual fire number in the region. The predicted annual fire number reflects well the variation trend of the observed annual fire number but with much less variation amplitude than the observed ones (Figure 6). This can be traced to two reasons: one is that daily fire probability was underestimated as above discussed, the other is the random firebrand is very large for some particular years.
The MAE of total fire number in a period increases with the period time span while the MRE generally decreases with the time span (Figure 7). A close relationship exists between the two fire numbers with a correlation coefficient of 0.98, and the total fire number within a period is usually under-estimated by the method (Figure 8). The MRE ranges from 16.2 to 26.9%, indicating a better agreement with the observed total fire number than the annual fire number. The better prediction ability of the method for fire number of a longer time period than just one year is because the sum of multiple year fire prediction contains both under- and over-estimations of annual fire number and thus is much closer to the sum of observed total fire number in the periods. This suggests further modification of the method should be accomplished separately for different IC ranges.

3.4. Firebrands

3.4.1. Fixed Daily Firebrand Probability

Fixed daily firebrand probability is the slope of the 435 linear regressions. The mean fixed daily firebrand probability of periods with different time spans fluctuates slightly with time span (Figure 9). It ranges from 0.127% at 6 years to 0.144% at 19 years. Variation of fixed daily firebrand probability within each time span decreases with the time span. For a time span of 5 to 10 years, the minimum firebrand probability may be less than 0.04% and the maximum higher than 0.2% (Figure 10), indicating great variations within periods of the same time span but a different start year.
Identifying periods with relatively constant fixed daily firebrand probability is quite important in modifying and applying the established method in the region [29]. Four periods with different relatively constant fixed firebrand probability can be identified from Figure 5: (1) years 1976–1988 with fixed daily firebrand probability higher than 0.09%, (2) years 1988–1994 with fixed daily firebrand probability ranging from 0.0325 to 0.0687%, (3) years 1995–2000 with fixed daily firebrand probability higher than 0.9%, and (4) the period after 2001 with constant daily firebrand probability dropping below 0.08%. These four fixed firebrand probability periods are not exact since the daily firebrand probability is that of a period ranging from 5 to 10 years, not just one particular year. Work to determine a constant fixed daily firebrand probability period should be strengthened, which would improve fire probability by using the right fixed daily firebrand probability.

3.4.2. Random Firebrand

Daily firebrand can be expressed as Fb = Fbc + Fbr, where Fbc is the fixed daily firebrand in a given period, which mainly depends on life style and forestry practice in the region. Fbr is the random firebrand and increases on some particular date, for example, firebrand increases significantly on holidays when more people enter forests for recreation.
The expected annual fire occurrence is
N f = i = 1 n ( P fbc + P fbri ) IC i = P fbc i = 1 n IC i + i = 1 n P fbri IC i  
where Nf is the annual number of fires in the region, n is the day number of the fire season, ICi is the ignition component of the ith day, Pfbc is the probability of a fixed firebrand, and Pfbri is the random firebrand probability on the ith day.
The part P fbc i = 1 n IC i is the number of fires caused by fixed daily firebrand and also the predicted annual fire number in the paper, and i = 1 n P fbri IC i is the number of fires caused by random firebrands. The differences between observed fire number and predicted fire number in Figure 6 are fires caused by random firebrands. Although it is difficult to give statistical features of the random daily firebrand here, random firebrand probability should be positively related to the differences in Figure 6. It fluctuates strongly with year in a cycle of roughly 3–4 years. This might be mainly caused by the fact that tighter fire prevention measures were usually taken after a year with a higher fire number, causing a fire number decrease, then fire prevention measures gradually got looser, resulting in increased fire number again in the following year. It also resulted from the change of firebrands on different days, such as an increase in firebrand on holidays. The changes of random firebrands are subject to a fire manager’s adjustment based on their decision. Random firebrands are large for some particular year (Figure 6) and can cause large fires when they coincide with adverse weather conditions. Therefore, sufficient weight should be given to the adjustment of daily firebrands to avoid under-estimating fire danger.

3.5. Possible Modifications to the Original Method

Results in Section 3.2 suggest that to ensure daily probability of at least one fire occurrence in the region to be expressed as a product of a constant and IC, a modified IC should be used based on a shift from the original IC by a ratio of constant b and slope a of the linear regression. For the current 435 tests, b/a ranges from −9.05 to −27.77 with a mean of −21.07 and se. 3.71, so for historical fire data, ICnew = IC − 21.07.
Since the above modification is mainly caused by a daily fire probability of zero under a certain IC threshold, an alternative way to do the modification is fitting the data separately, i.e., set daily fire probability to zero below a threshold and linear fitting the rest of the data.
Daily fire probability as the most important output of fire danger rating systems is crucial in determining fire danger rating classes and following preparedness levels. Relatively large deviation can be seen between the predicted daily fire probability from IC and observed ones (Figure 4 and Figure 5). Figure 5 shows the relationship between daily fire probability and IC is more of a power form than a linear form. Daily fire probabilities computed from data of different time span periods show similar relationships with IC to that in Figure 5. A linear fitting of the higher than the second power form from the relationship is a major source of error in daily fire probability prediction, which resulted in under-estimation of daily fire probability at higher IC and over-estimation of daily fire probability at lower IC. To maintain the linear relationship between daily fire probability and IC, modification of the computation method of IC additional to that in Section 3.2 is needed. The simplest way to do so is to let the new IC be a power function of the current IC, i.e., IC new = aIC b ,   b > 1 . Other modifications to the calculation of ignition probability and probability of an ignition spreading to a reportable fire, which maintains the linear relationship between fire probability and IC, are also valid.
A modification of IC combining the above modification methods was conducted. The modified IC is computed according to the following equation:
  IC new = a × ( IC b ) 2  
where ICnew is the modified IC, a, b are estimated parameters, b is the shift from the original IC. The resulting MAE of daily fire probability of the 435 tests is 3.96%, significantly lower than the original MAE of 4.34% (t = −5.31, df = 868, p < 0.00). The correlation coefficient of predicted and observed annual fire number is 0.54, a bit higher than the original one.
The above modification is just a trial improvement of the method with minor decrease of errors. A comprehensive modification of the method involves work at least in the following two aspects in addition to the above modifications: (1) modification of the algorithm of ignition probability using local firebrands, different types of firebrands and their occurrence probability are not the same in different regions [16,18,30]. The NFDRS’s method adopted matches as the firebrand, which is quite different from the major firebrands in the study area. Ignition probability models using local firebrands are needed; (2) modification of probability of an ignition spreading to a reportable fire. Currently very limited work has been conducted on the topic, implying further efforts are needed.
Furthermore, the suitability of the method in the study area and large room for further improvement indicate the usefulness of the probabilistic method. The problem of disagreement between actual fire occurrence and fire danger rating by those methods only considering weather variables but without firebrands is quite common in other countries and regions [1]. It would be a prospective way to solve the problem by using current existing fire probability models to construct similar probabilistic methods combining effects of weather, fuel and firebrand on fire occurrence. The models from NFDRS are just one set of the many models. Other similar models might also help in realizing the aim, which needs further research.
Integrating equations for IC computation (Equations (5)–(9)) and those from the Rothermel model [25] into one long equation, IC can be expressed as IC = F(f)G(m), where f is a collection of fuel related parameters such as packing ratio, surface area to volume ratio, fuel load, etc., m is fuel moisture content, F is the function combining all the equations using f but without m as inputs, G is the function combining all the equations solely using m as input. For a fixed set of fuel parameters as listed in Table 1, F(f) is a constant denoted as k here, thus IC can be rewritten as IC = kG(m). So for a period with relatively steady fuel conditions, the values of f or fuel parameters affect the absolute value of the fire rate of spread and then IC, but do not affect the fire danger rating class when it is determined by the rank or percentile of IC instead of its absolute value. Therefore, fuel parameters would not affect the accuracy of fire probability prediction when fuel conditions are steady but can cause errors when fuel conditions change over time, which is the case in our study.

4. Conclusions

Even though firebrand varies from year to year, and periods with relatively constant fixed firebrand probability are difficult to identify, the 435 tests conducted in the research include all the possible periods with relatively constant fixed firebrand probability from 1976 to 2008. Therefore, the significant linear relationship between daily fire probability and IC in the 435 tests strongly indicates that daily fire probability in the northern part of the Daxinganling Region can be expressed as a product of a constant and IC or new IC with a shift from NFDRS’ IC, which proves the suitability of the established method combining the effects of firebrand and weather-fuel complex on fire occurrence in the region. IC or the modified IC can be used to depict the effect of weather-fuel complex on fire occurrence and to rate fire danger for periods with fewer firebrands. Fire risk classes and corresponding preparedness levels can be determined from IC in the region. Methods of the same principle could be established to diminish similar discrepancy between actual fire occurrence and fire danger in other regions in the world.
The mean MAE of daily fire probability ranges from 3.76 to 5.5%. The new method can only account for less than 30% of the variation of annual fire number in the region. The linear relationship between daily fire probability and IC is a just an approximation of an essentially nonlinear relationship of the two variables. Further modification of the method is needed. The modification can be accomplished in the following ways: one is to make a proper shift from the original IC or to set daily fire probability to zero below a proper threshold to account for zero fire probability under a certain IC threshold. The other is to modify the IC computation method by a power transformation of the current IC to retain a stronger linear relationship between fire probability and IC.
Random firebrands in the region account for more variation of annual fire number than fixed firebrands, implying large fires may break out under certain adverse conditions. Even with fewer firebrands in the region in recent years, caution should be always taken to prevent outbreaks of several fires burning on a day which poses great pressure on fire suppression resources. In particular, forest fire management staff should pay more attention to firebrand management in forest fires and prescribed fires in a timely manner to reduce fuel load to prevent several forest fires.

Author Contributions

Conception, P.S. and Y.Z.; Methodology, Writing—Original Draft Preparation, Writing—Review & Editing, Supervision, Project Administration, P.S.; Data Curation, Software, validation, Formal Analysis, Y.Z.

Funding

This research was funded by National Natural Science Foundation of China, grant number (31370656).

Conflicts of Interest

The authors declare no conflicts of interest.

References

  1. Viegas, D.X.; Bovio, G.; Ferreira, A.; Nosenzo, A.; Sol, B. Comparative study of various methods of fire danger evaluation in southern Europe. Int. J. Wildland Fire 1999, 9, 235–246. [Google Scholar] [CrossRef]
  2. Vilar, L.; Woolford, D.G.; Martell, D.L.; Martin, M.P. A model for predicting human-caused wildfire occurrence in the region of Madrid, Spain. Int. J. Wildland Fire 2010, 19, 325–337. [Google Scholar] [CrossRef]
  3. National Wildfire Coordinating Group. Gaining and Understanding of the Interior National Fire Danger Rating System. 2002. Available online: http://www.nwcg.gov (accessed on 22 April 2017).
  4. Garcia, C.V.; Woodard, P.M.; Titus, S.J.; Adamowicz, W.L.; Lee, B.S. A logit model for predicting the daily occurrence of human caused forest fires. Int. J. Wildland Fire 1995, 5, 101–111. [Google Scholar] [CrossRef]
  5. Prestemon, J.P.; Chas-Amil, M.L.; Touza, J.M.; Goodrick, S.L. Forecasting intentional wildfires using temporal and spatiotemporal autocorrelations. Int. J. Wildland Fire 2002, 21, 743–754. [Google Scholar] [CrossRef]
  6. Guo, F.T.; Zhang, L.J.; Jin, S.; Tigabu, M.; Su, Z.W.; Wang, W.H. Modeling Anthropogenic Fire Occurrence in the Boreal Forest of China Using Logistic Regression and Random Forests. Forests 2016, 7, 250. [Google Scholar] [CrossRef]
  7. Hu, H.Q. Forest Fire Ecology and Management; China Forestry Press: Beijing, China, 2005; p. 56. [Google Scholar]
  8. Maingi, J.K.; Henry, M.C. Factors influencing wildfire occurrence and distribution in eastern Kentucky, USA. Int. J. Wildland Fire 2007, 16, 23–33. [Google Scholar] [CrossRef]
  9. Sturtevant, B.R.; Cleland, D.T. Human and biophysical factors influencing modern fire disturbance in northern Wisconsin. Int. J. Wildland Fire 2007, 16, 398–413. [Google Scholar] [CrossRef]
  10. Catry, F.X.; Rego, F.C.; Bacão, F.; Moreira, F. Modeling and mapping wildfire ignition risk in Portugal. Int. J. Wildland Fire 2009, 18, 921–931. [Google Scholar] [CrossRef]
  11. Camp, P.E.; Krawchuk, M.A. Spatially varying constraints of human-caused fire occurrence in British Columbia, Canada. Int. J. Wildland Fire 2017, 26, 219–229. [Google Scholar] [CrossRef]
  12. Chuvieco, E.; González, I.; Verdú, F.; Aguado, I.; Yebra, M. Prediction of fire occurrence from live fuel moisture content measurements in a Mediterranean ecosystem. Int. J. Wildland Fire 2009, 18, 430–441. [Google Scholar] [CrossRef]
  13. Almedia, M.; Viegas, D.X.; Miranda, A.I.; Reva, V. Effect of particle orientation and of flow velocity on the combustibility of Pinus pinaster and Eucalyptus globulus firebrand material. Int. J. Wildland Fire 2011, 20, 946–962. [Google Scholar] [CrossRef]
  14. Bianchi, L.O.; Defosse, G.E. Ignition probability of fine dead surface fuels in native Patagonia forests of Argentina. For. Syst. 2014, 23, 129–138. [Google Scholar]
  15. Bradshaw, L.S.; Deeming, J.E.; Burgan, R.E.; Cohen, J.D. The National Fire-Danger Rating System: Technical Documentation; General Technical Report GTR INT-169; USDA Forest Service, Intermountain Forest and Range Experiment Station: Ogden, UT, USA, 1983.
  16. Manzello, S.L.; Cleary, T.G.; Shields, J.R.; Yang, J.C. Ignition of mulch and grasses by firebrands in wildland-urban interface fires. Int. J. Wildland Fire 2006, 15, 427–431. [Google Scholar] [CrossRef]
  17. Manzello, S.L.; Cleary, T.G.; Shields, J.R.; Maranghides, A.; Mell, W.; Yang, J.C. Experiment investigation of firebrands: Generation and ignition of fuel bed. Fire Saf. J. 2008, 43, 226–233. [Google Scholar] [CrossRef]
  18. Ganteaume, A.; Lampinmaillet, C.; Guijarro, M.; Hernando, C.; Jappiot, M.; Fonturbel, T.; Vega, J.A. Spot fires: Fuel bed flammability and capability of firebrands to ignite fuel beds. Int. J. Wildland Fire 2009, 18, 951–969. [Google Scholar] [CrossRef]
  19. Ellips, P.E.M. Fuelbed ignition potential and bark morphology explain the notoriety of the eucalypt messmate stringybark for intense spotting. Int. J. Wildland Fire 2011, 20, 897–907. [Google Scholar] [CrossRef]
  20. Ganteaume, A.; Guijarro, M.; Jappiot, M.; Hernando, C.; Lampin-Maillet, C.; Pérez-Gorostiaga, P.; Vega, J.A. Laboratory characterization of firebrands involved in spot fires. Ann. For. Sci. 2011, 68, 531–541. [Google Scholar] [CrossRef]
  21. Deeming, J.E.; Burgan, R.E.; Cohen, J.D. The National Fire-Danger Rating System-1978; INT-39; USDA Forest Service, Intermountain Forest and Range Research Station Research Paper: Ogden, UT, USA, 1977.
  22. Schroeder, M.J. Ignition Probability; U.S. Department of Agriculture, Forest Service, Rocky Mountain Forest and Range Experiment Station: Fort Collins, CO, USA, 1969.
  23. Blackmarr, W.H. Moisture Content Influences Ignitability of Slash Pine Litter; Res. Note SE-173; U.S. Department of Agriculture, Forest Service, Southeastern Forest Experiment Station: Asheville, NC, USA, 1972.
  24. Zhou, Y.L.; Shi, F.C.; Chen, X.W.; Liu, M. A study on the change regularity of the litterfall and nutrient element in natural secondary oak forests. J. Northeast For. Univ. 1990, 8, 7–12. [Google Scholar]
  25. Rothermel, R.C. A Mathematical Model for Predicting Fire Spread in Wildland Fuels; INT-115; USDA Forest Service Research Paper: Washington, DC, USA, 1972.
  26. Cohen, J.D.; Deeming, J.E. The National Fire-Danger Rating System: Basic Equations; General Technical Report, PSW-82; USDA Forest Service, Pacific Southwest Forest and Range Experiment Station: Ogden, UT, USA, 1985.
  27. Hu, H.Q.; Wei, S.J.; Sun, L. Estimating carbon emissions from forest fires during 2001 to 2002 in Daxing’anling Mountain. Acta Ecol. Sin. 2012, 32, 5373–5386. [Google Scholar]
  28. Beverly, J.L.; Wotton, B.M. Modelling the probability of sustainable flaming: Predictive value of fire weather index components compared with observation of site weather and fuel moisture conditions. Int. J. Wildland Fire 2005, 16, 161–173. [Google Scholar] [CrossRef]
  29. Elia, M.; Loverglio, R.; Ranieri, N.A.; Sanesi, G.; Lafortezza, R. Cost-Effectiveness of Fuel Removals in Mediterranean Wildland-Urban Interfaces Threatened by Wildfires. Forest 2016, 7, 149. [Google Scholar] [CrossRef]
  30. Plucinski, M.P.; Anderson, W.R. Laboratory determination of factors influencing successful point ignition in the litter layer of shrubland vegetion. Int. J. Wildland Fire 2008, 17, 628–637. [Google Scholar] [CrossRef]
Figure 1. Location of the northern part of the Daxinganling Region.
Forests 09 00428 g001
Figure 2. Daily fire probability and IC computed using different SCM values.
Forests 09 00428 g002
Figure 3. Distributions of significant level of the slope and intercept of the regression of fire probability over IC for periods with different time spans. (a) denotes the F test of the slope; (b) denotes the t test of the 435 regression.
Forests 09 00428 g003
Figure 4. (a) MAE and (b) MRE of daily fire probability predicted for periods of different time spans.
Forests 09 00428 g004
Figure 5. Predicted and observed daily fire probability for the period of 1976–2008.
Forests 09 00428 g005
Figure 6. Comparison of observed and predicted annual fire number for the northern part of the Daxinganling Region from 1976 to 2008.
Forests 09 00428 g006
Figure 7. (a) MAE and (b) MRE of predicted fire number of periods ranging from 5 to 33 years.
Forests 09 00428 g007
Figure 8. Predicted and observed fire number of periods of different time spans for the northern part of the Daxinganling Region.
Forests 09 00428 g008
Figure 9. Fixed daily firebrand probability of periods with different time spans.
Forests 09 00428 g009
Figure 10. Fixed daily firebrand probability of periods spanning 5 to 10 years with different start years.
Forests 09 00428 g010
Table 1. Parameters used for IC computation.
CountyMoheTahe
Latitude (degree)52.3551.85
Climate zone3.003.00
1 h fuel load (t·ha−1)5.335.33
10 h fuel load (t·ha−1)8.688.68
100 h fuel load (t·ha−1)3.783.78
1000 h fuel load (t·ha−1)3.833.83
Herbaceous fuel load (t·ha−1)1.201.20
Woody fuel load (t·ha−1)2.102.10
Wind reduction factor0.500.50
Dormant Julian data290.00290.00
Greenup Julian data120.00120.00
Rainfall threshold (mm)1.501.50

