Consumption Rates and Use Patterns of Firewood and Charcoal in Urban and Rural Communities in Yedashe Township, Myanmar


1
Graduate School of Bioresource and Bioenvironmental Sciences, Kyushu University, Fukuoka 819-0395, Japan
2
Forest Department, Ministry of Natural Resources and Environmental Conservation, Nay Pyi Taw, Myanmar
3
Faculty of Agriculture, Kyushu University, Fukuoka 819-0395, Japan
4
Institute of Decision Science for a Sustainable Society, Kyushu University, Fukuoka 819-0395, Japan
5
Faculty of Agriculture, Kagoshima University, Kagoshima 890-8580, Japan
*
Author to whom correspondence should be addressed.
Forests 2018, 9(7), 429; https://doi.org/10.3390/f9070429
Submission received: 12 June 2018
/
Revised: 13 July 2018
/
Accepted: 16 July 2018
/
Published: 17 July 2018
(This article belongs to the Section Forest Economics, Policy, and Social Science)
Abstract
:There is concern over the environmental impact of charcoal use for cooking in urban areas; however, studies have mainly been limited to Africa and South Asia. This investigation aimed to evaluate woodfuel consumption rates and patterns in an urban area in Yedashe Township, Myanmar and compared them with results from a rural area in the same township. From interviews with 66 urban households, it was evident that firewood and charcoal consumption rates in the urban area were about one-third and one-fourth, respectively, of those in the rural area. These low consumption rates were because of multiple-fuel use (mainly woodfuel and electricity) in the urban area in contrast to single-fuel use in the rural area. We estimated the forest area required to meet woodfuel demand of the whole township to be 3738 ha; that could decrease by almost 40% (1592 ha) if the single-fuel use in the rural area switched to the multiple-fuel methods used in the urban area. This study confirms that urbanization with an “energy stack” in multiple-fuel use, rather than an “energy ladder” from firewood to charcoal, could largely reduce the environmental impact on forests.
1. Introduction
Woodfuel remains a dominant energy source in the developing world in both rural and urban areas. Over 2 billion people in developing countries are still mainly dependent on woodfuel for cooking and heating [1]. Traditional biofuels have harmful effects, such as human health issues caused by indoor air pollution and impacts on forest areas, so an energy transition from traditional biofuels to modern fuels is needed [2]. Understanding the household energy transition is of vital importance in search of policies to support this transition process [3]. A common model to describe the household fuel choices in developing countries is the “energy ladder”, where primitive fuels (such as firewood and agricultural wastes) are replaced by transition fuels (such as charcoal and kerosene) and then advanced fuels (such as electricity and liquefied petroleum gas) in the processes of urbanization [3]. On the other hand, studies showed that the energy transition does not occur as a series of simple, discrete steps as the “energy ladder” implies; instead, “energy stack” is more common, where with increasing income, households adopt new fuels and technologies that serve as partial rather than perfect substitutes for more traditional ones [3]. Comparisons of household energy consumption between rural and urban areas would help understand the energy transition patterns and their environmental impacts.
In many developing countries, firewood users are dominant in rural areas, whereas charcoal is commonly employed in urban areas [4,5,6,7,8]. Unlike firewood use in rural areas, there has been concern about the environmental impact of charcoal use in urban areas [2,4,9,10,11,12]; that is because collected firewood is mostly from deadwood or small branches [13,14,15], though charcoal is mainly produced from living trunks or branches [16,17,18]. Mwampamba [19] produced a simulation of the necessary extent of forest area needed to meet urban charcoal consumption in Tanzania; the author concluded that charcoal consumption was a real threat to the long-term survival of forests. By contrast, Chidumayo and Gumbo [9] found that charcoal production contributed <7% to total forest cover loss in tropical countries; they determined that other causes of deforestation, such as agricultural expansion, were more important than charcoal production. Arguments about the environmental impact of charcoal consumption have mainly been limited to African and South Asian countries; there is a lack of such studies in other regions.
In Myanmar, about 70% of all primary energy consumption was derived from woodfuel in 2009 [7]. Myanmar had the third-highest annual loss of forest area in 2010 to 2015 (ca. 546,000 ha/year), just behind Brazil and Indonesia [20]. Studies in Myanmar have reported that firewood collection and charcoal production contribute to deforestation there [21,22,23,24,25]. Understanding the demand for woodfuel and its exploitation could play an essential role in planning and implementing forest policies for sustainable energy [26]. However, none of the above studies produced data about woodfuel consumption rates and patterns, and how much deforestation is attributed by woodfuel consumption. While the study by Win et al. [18] estimated the woodfuel supply and demand conditions for rural areas, the overall supply and demand potentials in Myanmar for woodfuel are still not clear. Win et al. [18] evaluated the impacts of the “energy ladder” from firewood to charcoal in rural areas. They estimated that the area of forest needed to meet the woodfuel demand in all the rural villages in Yedashe Township would increase from 3% of forest within 5 km of villages to 13% of forest if they assumed an energy transition whereby the proportion of charcoal single users increased from the current level of 19% to 100%. However, no study has examined the situation in urban areas.
The present investigation aimed to evaluate woodfuel consumption rates and patterns in an urban area of Yedashe Township, Myanmar and compare the results with those of a rural area within the same township by Win et al. [18]. Through this comparison, we examine the effects of urbanization on woodfuel use and its impact on forests.
2. Materials and Methods
2.1. Study Site
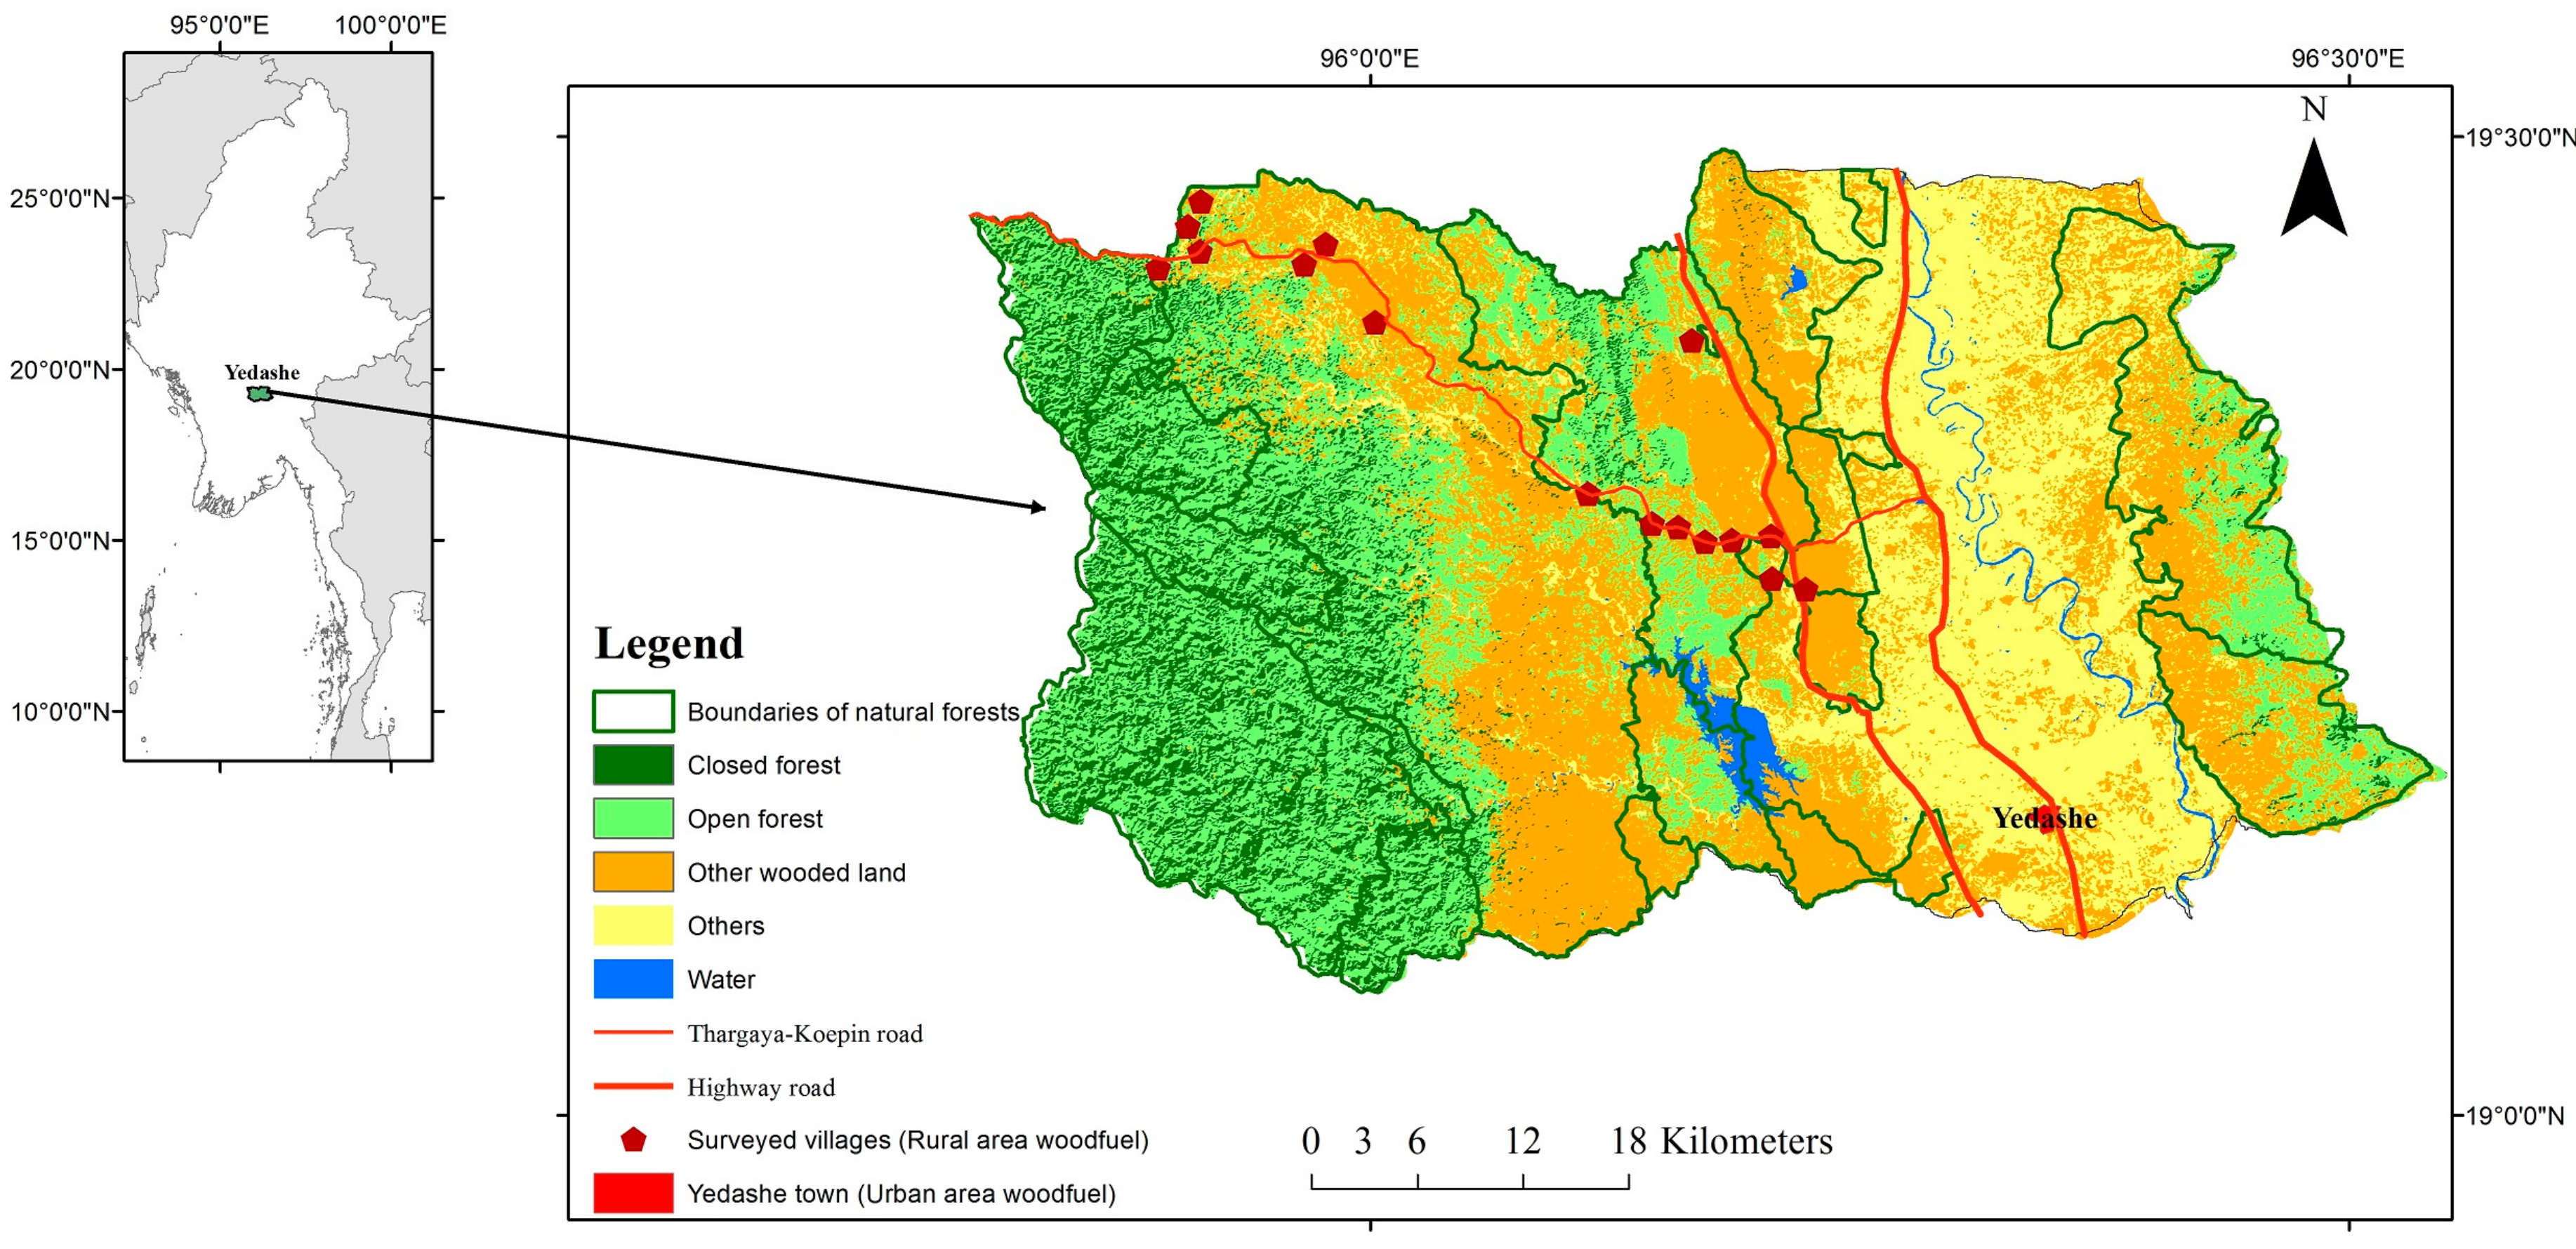
We conducted a survey in the urban area of Yedashe town, Bago region, Myanmar (Figure 1). Yedashe Township has an area of 2618.7 km², 76.6% of which is covered with forest according to a 2014 internal report from the Forest Department of Myanmar. According to the 2014 National Census results, the township’s population and number of households were 213,593 and 50,527, respectively; 11.4% of the people lived in urban areas, accounting for an urban population of 24,350.
2.2. Household Survey
For household interviews, we selected a total of 66 households from two wards in Yedashe town (Figure 1). The two wards were selected randomly among six ones within the town. The 66 households were selected systematically every fourth or fifth household along the streets in the wards. This sampling intensity covered approximately 6% of the total number of households in the two surveyed wards. We conducted the surveys in January 2016. Unlike the households in rural Yedashe [18], these households used multiple types of energy for cooking, such as firewood, charcoal, electricity, and gas. We held interviews based on semi-structured questionnaires, which focused on household sector energy uses. The questionnaires examined household characteristics, such as family members, income, livelihood activity, land possession, and consumption patterns (e.g., amount of woodfuel consumed, stove types, and cooking frequency). Additional variables were included in the questionnaires, such as the type and size of wood used for firewood, whether dead or green wood was collected, the sources of firewood, and the places where woodfuel was bought.
Other than in the case of buying woodfuel, we asked about the composition of dead or green wood for each source. The respondents who bought firewood did not have any information about its source. Likewise, they were unable to identify the tree species and size of firewood since most firewood sold in the market had already been cut into small pieces that were suitable for immediate use. To obtain this missing information, our team interviewed the main firewood wholesalers mentioned by the respondents. As a consequence, the sources and types of firewood could be identified; however, the wholesalers did not know precise details of the firewood size or species of tree. Therefore, the results on the size and species for woodfuel in the rural area were applied to re-estimate the woodfuel supply for the whole township.
To determine woodfuel consumption, we measured the actual amount of charcoal and firewood consumed daily. Measurements of the actual consumption for 1 day were conducted using a weight survey method [27,28]. During the course of interviews, the researcher weighed some woodfuel that was greater than the amount that the main cook indicated they used on a daily basis. The cook was requested to use that woodfuel for the day’s cooking. The following day, the researcher revisited the households, weighed the remaining woodfuel, and calculated the actual amount consumed. From the daily consumption, we calculated the annual consumption. The woodfuel weights (kilograms) were recorded under air-dried conditions when the available firewood in the household was ready for use.
2.3. Data Analysis
To calculate basic statistics, we used the data from actual consumption of firewood (26 households) and charcoal (37 households). We converted consumption volume in kilograms to consumption volume in cubic meters using the value of 710 ± 34 kg (mean ± standard error) of air-dried firewood = 1.0 solid m3, reported by Win et al. [18]. We applied the conversion factor of 167 kg/m3 reported by the United Nations Food and Agriculture Organization [29] for the solid wood volume required to produce charcoal.
As in Win et al. [18], we applied generalized linear model (GLM) with a Gaussian link to estimate factors affecting firewood and charcoal consumption rates. The dependent variable was per capita annual consumption rates, and the independent variables included household size, annual income, cooking frequency and user type (single- or multiple-fuel user). Being different from Win et al. [18], the present GLM analysis did not consider types of stoves for firewood since most of the users used only the three-stone stove. R software (R Core Team 2014) was used for the GLM analysis.
We determined the forest area needed to meet the woodfuel demand in the urban area using the same methods of Win et al. [18]. For that estimation, we considered source (forest or non-forest), size, and species of trees that were used for making firewood and charcoal. The detailed methods appear in Win et al. [18].
We also determined the forest area needed to meet the woodfuel demand for the whole township, including both urban and rural areas. To evaluate the potential impact of urbanization on woodfuel consumption and on forests, we then estimated the changes in forest area needed if rural residents switched their current rates and patterns of woodfuel consumption to those of urban residents.
3. Results
3.1. Household Characteristics in Urban Area
The household size ranged from 1 to 11 members; the average household size was 4.6 people (Table 1). In terms of education background, 4.5% of household heads were graduates; 30.3% attended high school and the remainder received lower education. The annual household income ranged from US$720 to $24,000; the average annual income was $4338 ± $460. The main livelihood activities were government work, agricultural work, self-employment, physical labor, and others; those categories accounted for 19.7%, 3.0%, 56.1%, 16.7%, and 4.5%, respectively, of households. Among the sample households, 6% owned agricultural land; maximum land possession was 4.0 ha. Electricity was installed in 97% of the households; the remainder had not done so owing to economic circumstances.
3.2. Patterns of Cooking Energy Use in Urban Area
For cooking energy, 39.4% of households used firewood and 56.1% employed charcoal. About 7% of households reported the use of only non-wood energy, such as electricity and gas. Most households used multiple fuels; woodfuel and other energy types were utilized in combination (Table 2). No household used agricultural crop residues; however, 1.5% of households employed sawdust from nearby sawmills as a substitute for firewood and charcoal.
Over 80% of respondents with installed electricity used it for cooking. However, owing to its instability and frequent stoppages, respondents had to employ other energy sources, such as firewood, charcoal, and gas. Among woodfuel users, the average number of days when firewood and charcoal were employed for cooking was about 20 per month for both. No respondents reported having collected firewood themselves from the natural forest; the woodfuel market is very commonly used in that area. Among firewood users, only 3.8% employed a fuel-efficient stove; the remainder utilized a three-stone fireplace for cooking. The majority of households (57.6%) cooked meals once a day; the remainder cooked three times (1.5%) and twice (40.9%) a day.
3.3. Source, Type, Size, and Species of Woodfuel
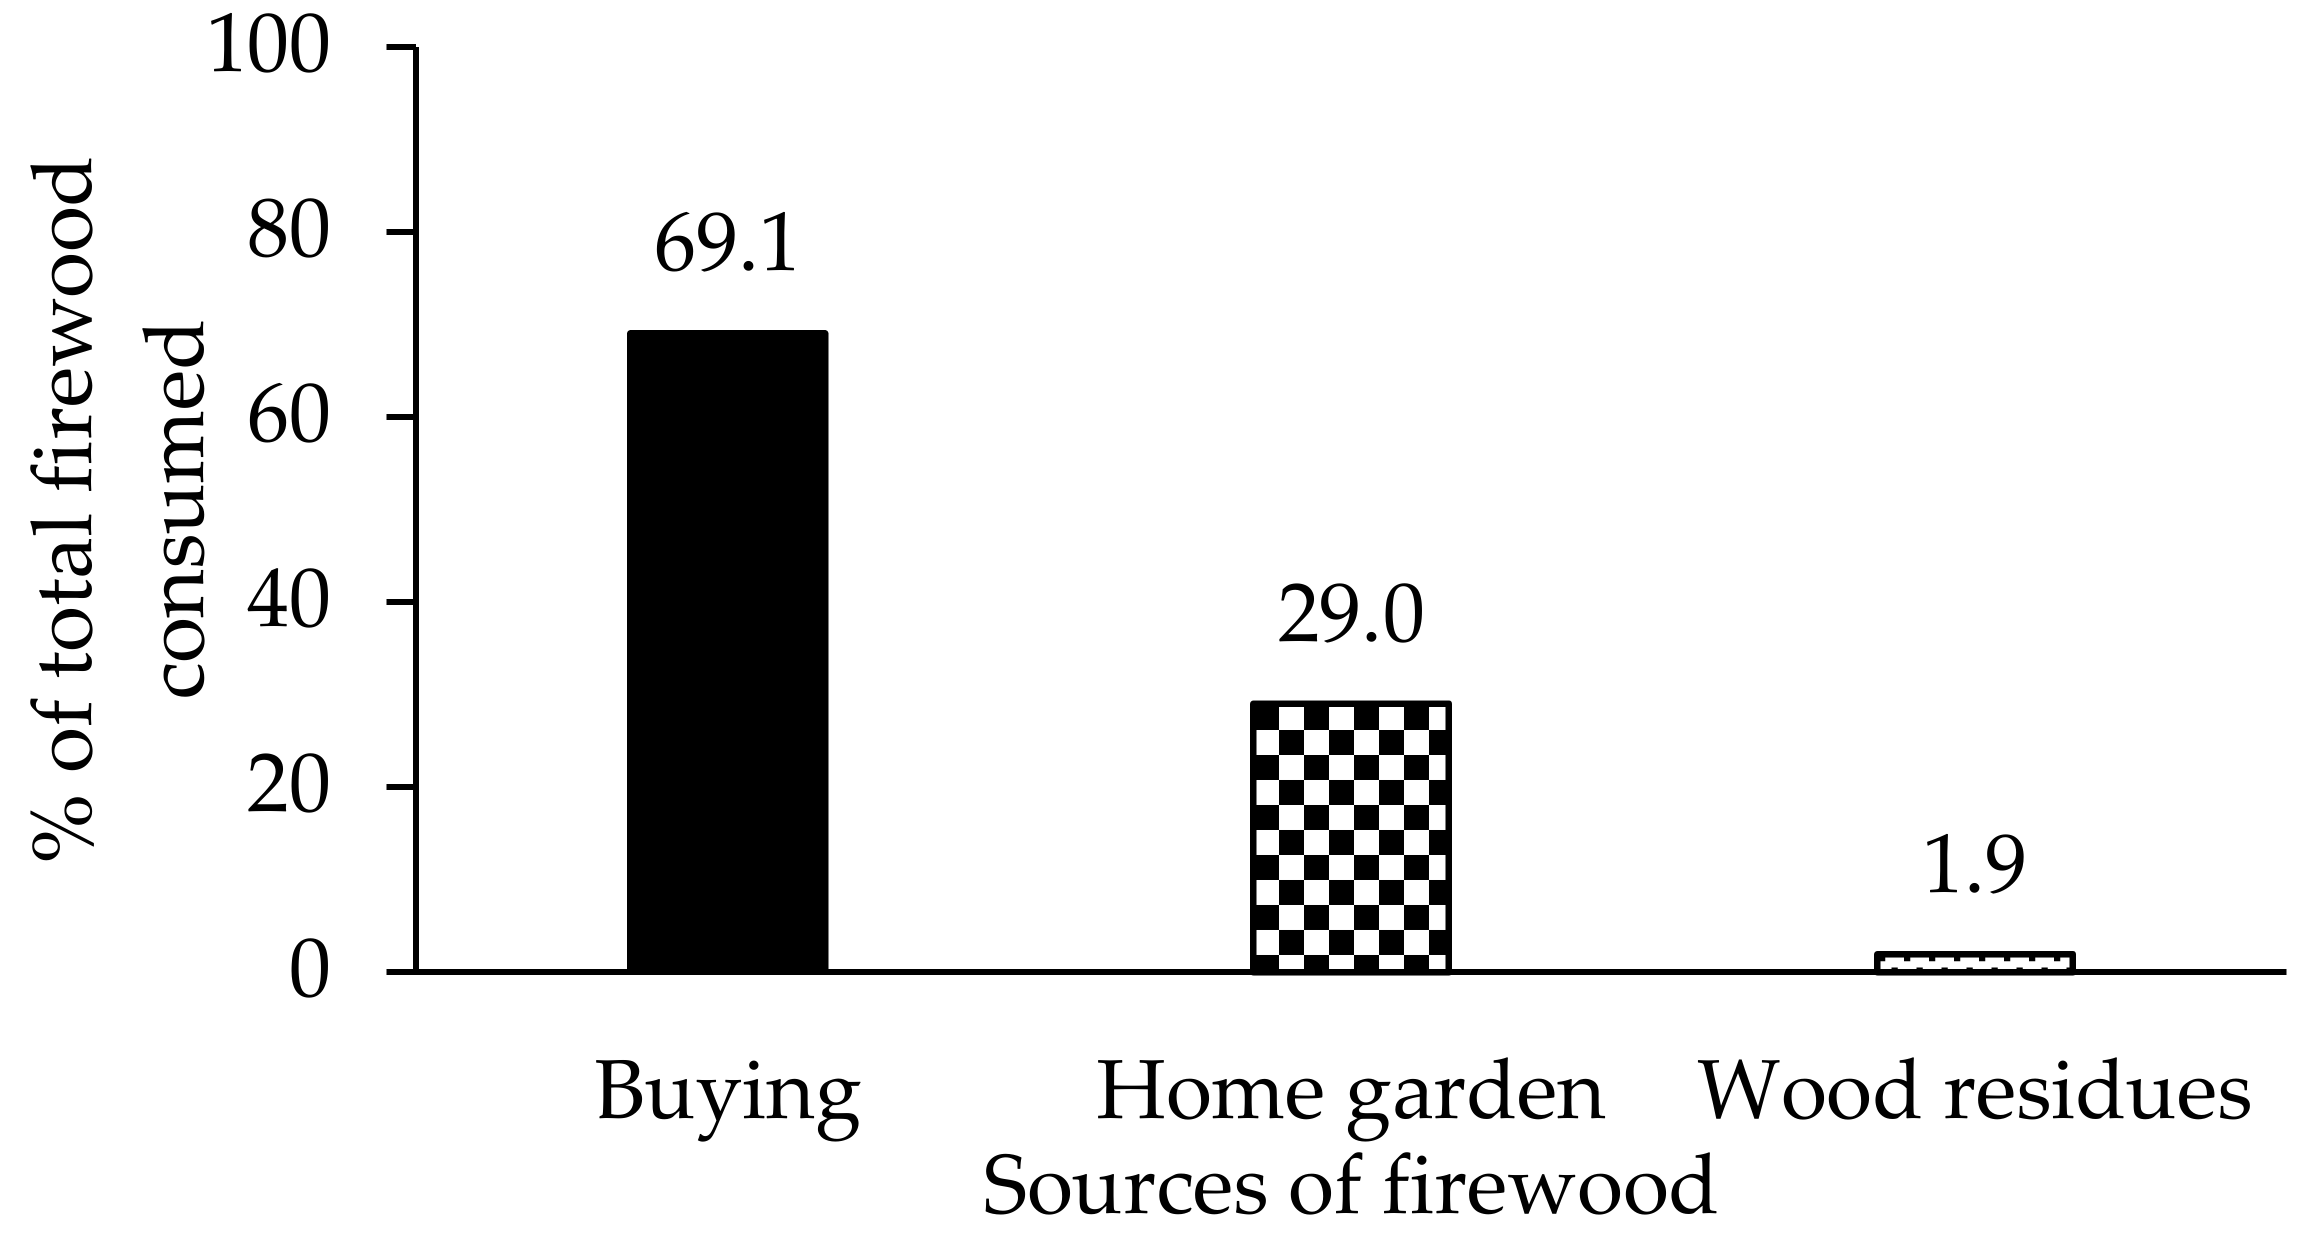
As noted above, no households reported collecting their own firewood from natural forests. As shown in Figure 2, 69.1% of the firewood consumed in the urban area was bought; 29.0% came from the home garden; 1.9% was wood residues from housing and furniture work. Among the purchased firewood, 88.6% was green wood originating from natural forests; that was equivalent to 61.2% (= 69.1% × 88.6%) of the total firewood consumed. We were unable to obtain exact details about the size and tree species of firewood consumed during the interview. For the charcoal, the source, size, and species preferences were assumed to be the same as those reported for rural areas [18] since they are the major sources of charcoal production.
3.4. Woodfuel Consumption Rates in Urban Area
Among all multiple-fuel and single-fuel users, the average (± standard error) per capita consumption of firewood and charcoal for cooking was 217 ± 39 kg year−1 and 69 ± 11 kg year−1, respectively; that is equivalent to 0.3 ± 0.1 m3 year−1 and 0.4 ± 0.1 m3 year−1 of solid wood, respectively (Table 3). Among single-fuel users, the consumption rate was about 1.7- and 1.6-fold the total average, respectively; that amounts to 362 ± 107 kg capita−1 year−1 for firewood and 110 ± 18 kg capita−1 year−1 for charcoal.
The consumption rates in the urban area were about one-third for firewood (217 versus 780 kg) and one-fourth for charcoal (69 versus 280 kg) those in the rural area (Table 3). Even in a comparison of firewood-only and charcoal-only users in urban and rural areas, the consumption rates in the urban area were still less than half those in the rural area (362 versus 780 kg for firewood; 110 versus 280 kg for charcoal).
The GLM results (Table 4) indicate that single-fuel users consistently had significantly higher consumption rates than multiple-fuel users for both firewood and charcoal. All of the other three independent variables were significant (p < 0.05) for firewood, while they all were not significant (p > 0.05) for charcoal. The per capita firewood consumption rates were higher for the households with less family members, more income and more cooking frequency. The Durbin-Watson (DW) test [30] showed that there was no autocorrelation in the residuals from the GLM for firewood (DW = 2.484, p = 0.867) and charcoal (DW = 1.493, p = 0.068).
3.5. Estimating Woodfuel Demand and Forest Area Needed to Meet Demand
Woodfuel supply and demand in the urban area appear in Table 3 together with the results for the rural area by Win et al. [18]. The per capita demand for forest-derived green wood >10 cm in diameter in the urban area was 38 kg and 293 kg for firewood and charcoal, respectively. Among the forest biomass density for all standing trees ≥10 cm (45 t ha−1), 10.2 t ha−1 and 14.6 t ha−1 could be used for firewood and charcoal, respectively, according to Win et al. [18]. Accordingly, the forest area needed to meet the per capita demand for firewood and charcoal would be 37 m2 and 201 m2, respectively. For the whole urban population, the forest area needed to meet consumption of firewood and charcoal would be 34 ha and 274 ha, respectively; these figures are very much smaller than those (530 ha and 2900 ha, respectively) needed for rural consumption in the whole township.
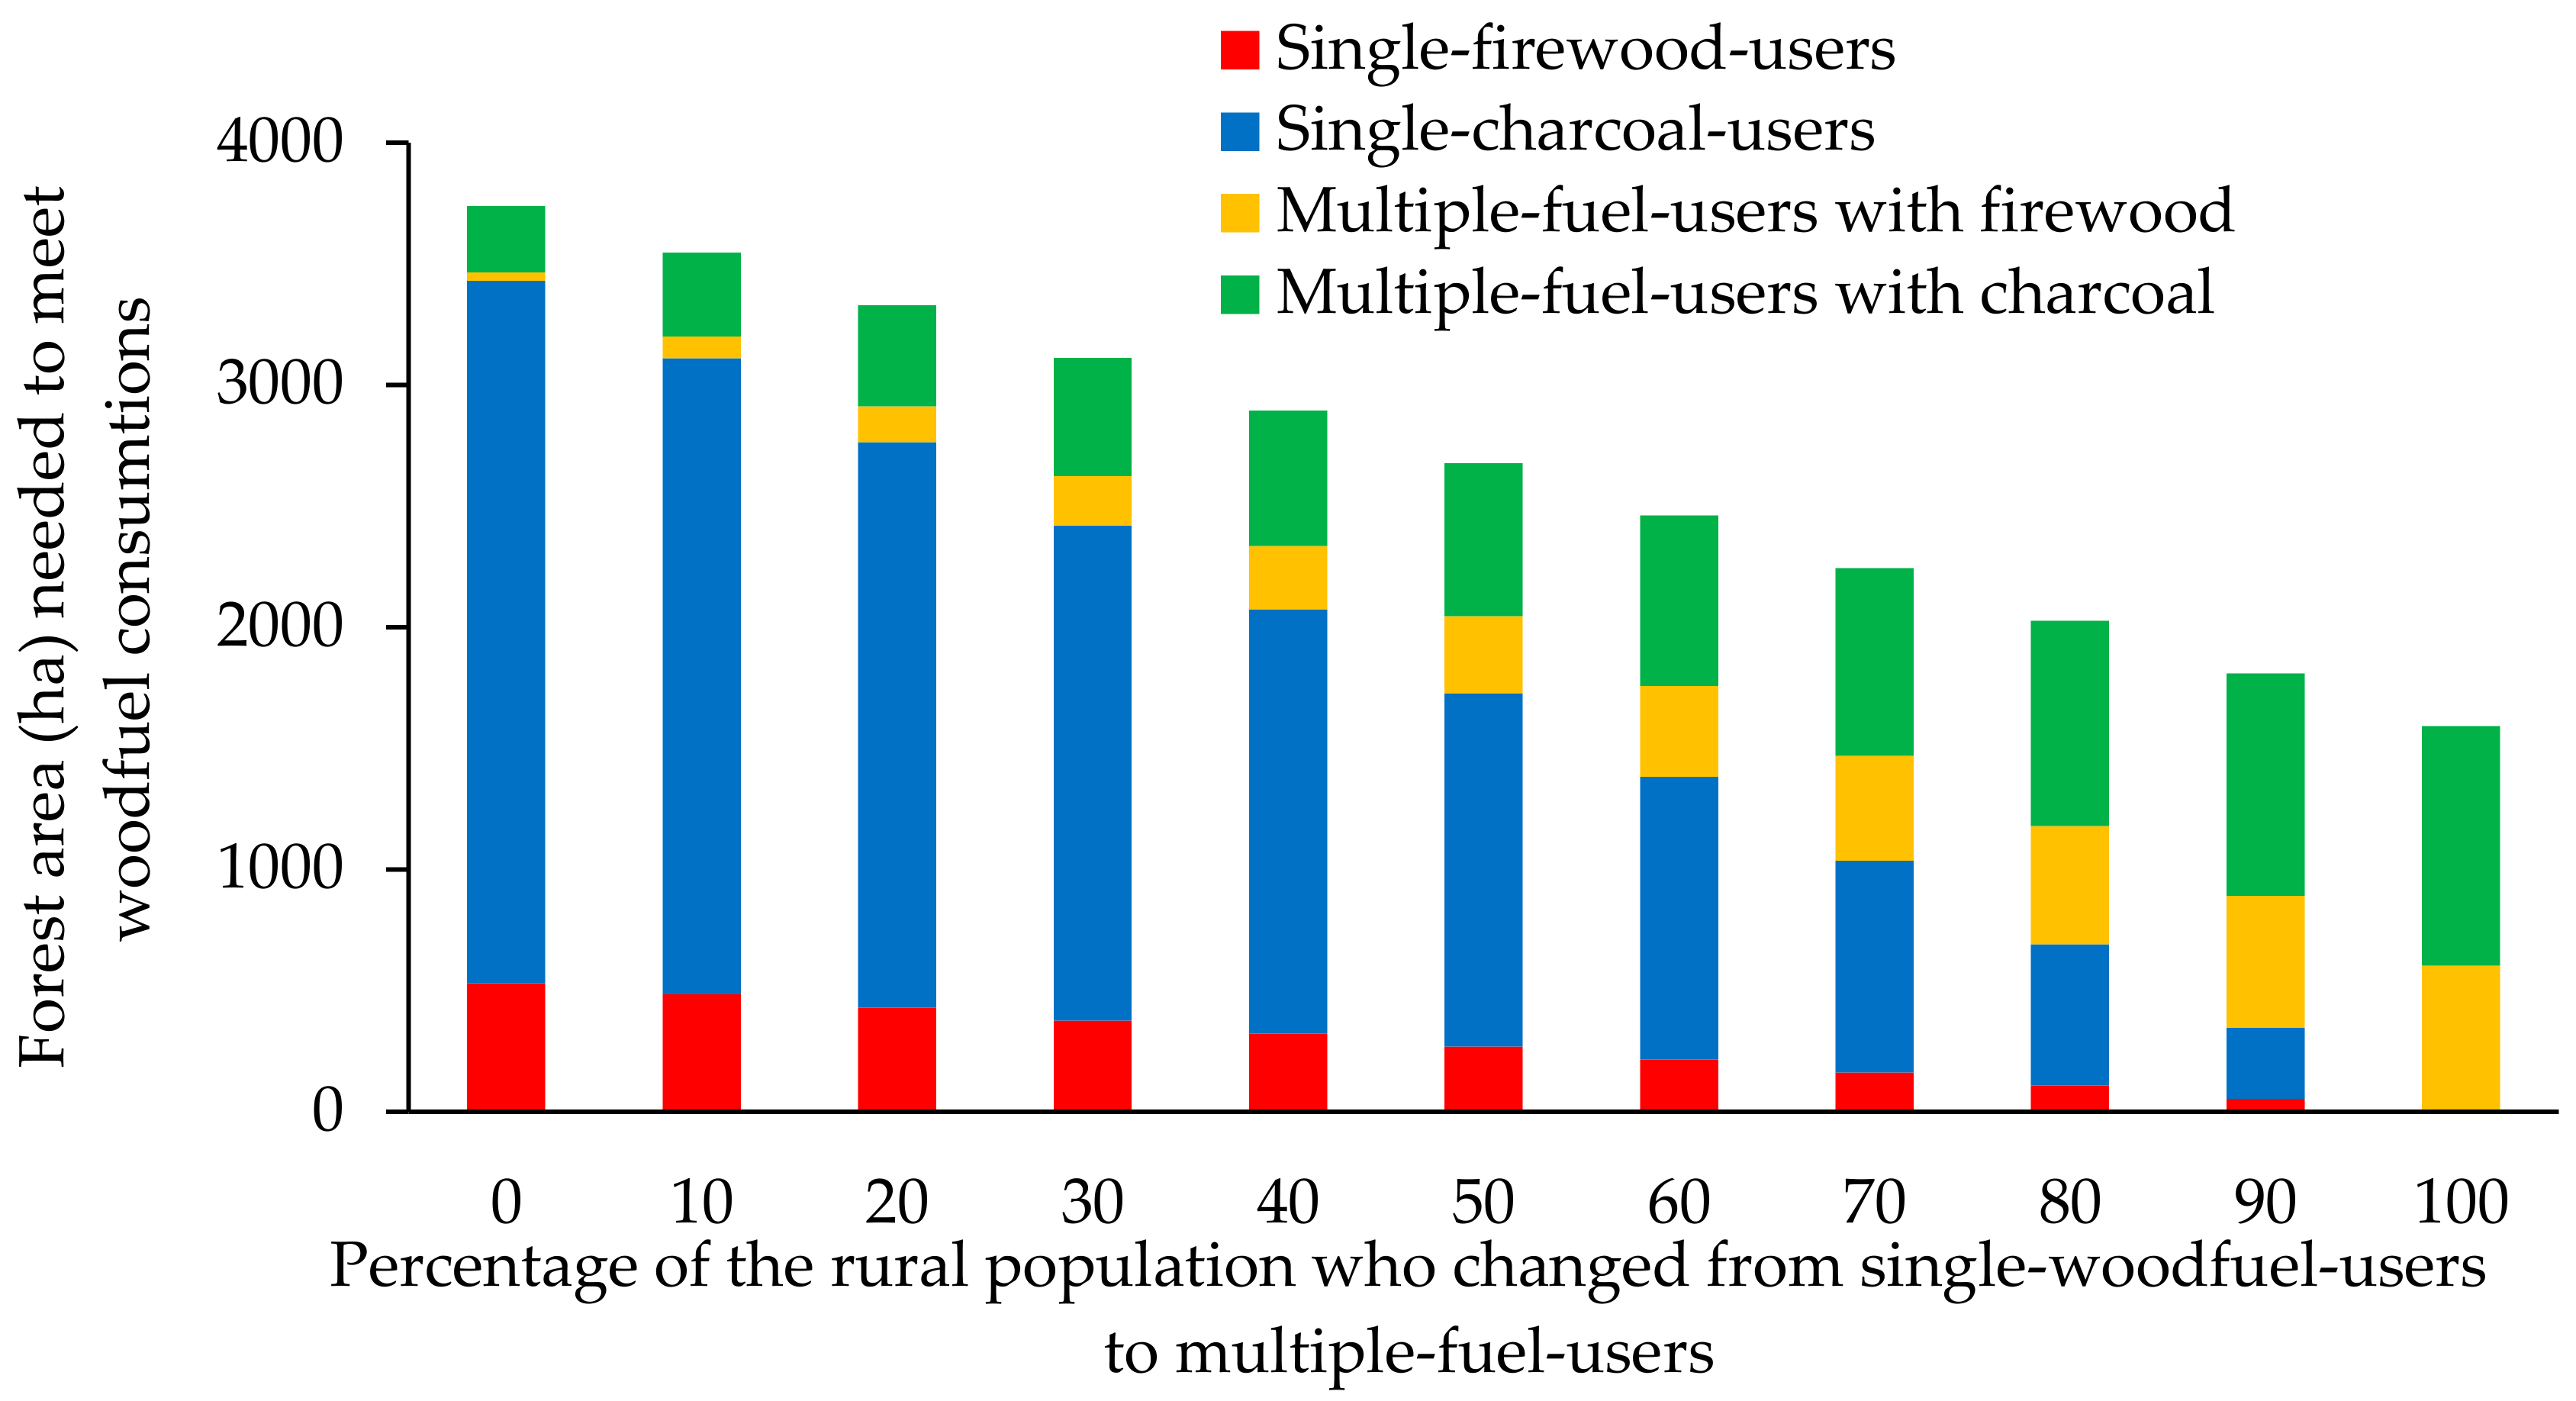
We estimated the forest area needed to meet the total demand for firewood and charcoal in the whole township, including both urban and rural areas, to be 3738 ha (Table 3). This value would decrease to 1592 ha if rural residents changed their woodfuel rates and patterns (single woodfuel users) to those currently adopted by urban residents (multiple-fuel users; Figure 3). This reduction in total demand for forest area would be largely contributed to through the decrease in the number of charcoal-only users rather than single firewood-users (Figure 3).
4. Discussion
4.1. Woodfuel Consumption Rates in Urban Area
Previous studies have examined woodfuel consumption rates in urban areas. The firewood consumption rate in the present study is within the range of reported values for other countries [26,31,32]; however, our charcoal consumption rates are lower than previously observed figures. For firewood, the consumption rate at our study site (217.4 ± 38.9 kg capita−1 year−1, equivalent to 1898.0 ± 506.1 kg household−1 year−1 and 3.8 ± 0.4 kg household−1day−1) was higher and lower, respectively, than the rates reported for urban areas of South Africa (1454 kg household−1year−1) [31] and Mozambique (5.47 ± 1.00 kg household−1day−1) [26]. For charcoal, the per capita consumption in our study (68.8 ± 9.15 kg year−1) was approximately half the rates found for urban Tanzania (138.6 kg capita−1 year−1) [19], urban areas of Kenya (130 kg capita−1 year−1) [32], and Kampong Thom Province, Cambodia (120 kg capita−1 year−1) [33]. In Mozambique, average daily charcoal consumption was found to be 2.69 ± 0.10 kg household−1 day−1 [26]; that is about 3-fold our result (0.8 ± 0.1 kg household−1 day−1). The reason for the consistently lower rate of urban charcoal consumption in the present study is not clear; it may be because charcoal users in this study consumed more additional sources of energy than those in the other countries, and/or because the availability of charcoal in our study was lower than the other study regions.
We found that the rates of firewood and charcoal consumption in the urban area were much lower than those for the rural area (Table 3) [32]. This is obviously because the majority of woodfuel users in the urban area were multiple-fuel users (Table 2); only single-fuel users were found in the rural area [18]. Other energy sources, such as electricity, played an important role in the urban area: over 70% of households reported using electricity for cooking. Our GLM results also confirmed that single-fuel users consumed more firewood or charcoal than multiple-fuel users within the urban area (Table 4). Even among single-fuel users, the consumption rates in the urban area (362 ± 107 kg capita−1 year−1 for firewood and 110 ± 18 kg capita−1 year−1 for charcoal) were less than half those in the rural area. The greater distance from forest resources may be a reason for the lower consumption rates among urban single-fuel users: accessibility to forests considerably influences such consumption rates [18,32,34].
There were some similarities and differences in the GLM results of the consumption rates between the urban area of this study and the rural area by Win et al. [18]. The households with less members and more frequent cooking tended to have higher firewood consumption rates in both the urban (Table 4) and rural areas, and this trend was also found for rural charcoal consumption [18]. In contrast, the independent variables other than the user types (single- or multiple users) did not affect urban charcoal consumption rates (Table 4). The reason of such differences is not clear, so further analysis with more sample size would be needed since this study only used data from 66 households.
4.2. Potential Impact of Urban Woodfuel Consumption on Forests
When evaluating the impact of woodfuel use on forests, it is important to consider the source, size, and species of trees used. In the present study, 61.2% of the firewood consumed was forest-derived green wood >10 cm in diameter; this proportion is substantially higher than that reported for the rural area in our study site (16.1%) [18]. This difference may be because most (69.1%) of the total firewood consumed in the urban area was bought, largely from firewood producers who tend to cut living trees in forests. In the rural area, only 1.9% of firewood was bought; most rural users collect deadwood in forests or cut trees in non-forested areas, such as farms and home gardens [18]. When we compare the same amount of firewood consumption, the impact of the household use of firewood on forests was greater in the urban than in the rural area.
Regarding solid wood, the per capita consumption rates for firewood (217 kg or 0.3 m3) and charcoal (293 kg or 0.4 m3) in the urban area were much lower than those in the rural area (780 kg or 1.1 m3 for firewood; 1190 kg or 1.7 m3 for charcoal). This difference is also because most residents used multiple fuels in the urban area but only a single fuel in the rural area [18]. With firewood, the per capita demand for forest-derived green wood >10 cm in the urban area (37.6 kg) was similar to that in the rural area (36.0 kg); that is because the lower consumption rate due to multiple-fuel use may be offset by a higher proportion of forest-derived green wood in the urban (61.2%) than in the rural area (16.1%). For charcoal, 100% of the wood used in its production in both urban and rural areas was forest-derived green wood >10 cm in diameter. Thus, the per capita demand for forest-derived green wood >10 cm is the same as the per capita consumption rates (293 kg and 1190 kg in the urban and rural areas, respectively). Consequently, the estimated area needed to meet the per capita demand for firewood is also similar in the urban (37 m2) and rural areas (35 m2); for charcoal, the demand in the rural area (820 m2) was 4-fold that for the urban area (201 m2). This result indicates that it is crucial to reduce charcoal consumption in rural areas.
Assuming that the numbers of firewood and charcoal users in the urban area are currently 39.4% and 56.1% of the total urban population, respectively, the estimated area of forest needed to meet the demand for all the urban area would be 274 ha for charcoal and 34 ha for firewood. That total 308 ha for the urban area is equivalent to only 0.3% of the forest area within a 5-km distance of residential areas (115,051 ha) in the township; it is very small compared with about 3% (3430 ha) estimated for the rural area [18]. This result suggests that impact of current woodfuel consumption on forests is likely to be much more substantial for rural than for urban use in the studied township in Myanmar. That is the opposite finding regarding such concerns in urban areas in African countries [4,19].
Win et al. [18] assumed the “energy ladder” in the rural area, switching from firewood to charcoal, and then concluded that such the “energy ladder” causes higher harvesting intensity, resulting in a high risk of further forest degradation. However, the present study suggests that urbanization likely induces an “energy stack” [3], in which residents employ multiple fuels (among primitive fuels, transition fuels, and advanced fuels) rather than the single-fuel use in the “energy ladder”. This finding is compatible with those from several studies in other countries [3]. We estimated that the forest area needed for woodfuel consumption for all villages in the township would reduce to around 40% if the share of single-fuel users in rural villages deceased and was replaced by multiple-fuel use. This result confirms that the “energy stack” can largely reduce the impact of woodfuel consumption in forests. Such an “energy stack” scenario would be enabled if the Myanmar government achieves the stated energy policy goal of encouraging energy independence, improving hydroelectric sources of supply, expanding the electricity grid to rural areas and promoting energy efficiency [7].
5. Conclusions
The consumption rates in the urban area are only about one-third of the firewood and one-fourth of the charcoal consumption rates in the rural area. These low consumption rates are mainly through the use of multiple fuels in the urban area. This result implies that the availability of other energy sources can decrease the demand for woodfuel. This finding highlights the importance of creating different energy options when planning and implementing a sustainable energy policy for a region. Contrary to the impact caused by the “energy ladder” from firewood to charcoal, the “energy stack” from single- to multiple-fuel use for rural residents can make a major contribution to reducing impacts on forests.
Author Contributions
Z.C.W., N.M., and T.O. performed the analysis. All the authors (Z.C.W., N.M., T.O., T.K., S.Y.) contributed to writing the paper.
Funding
This study was supported by JSPS KAKENHI (grant numbers 23405029 and 17H01477), Grant for Environmental Research Projects from The Sumitomo Foundation, and Capacity Building for Developing REDD + Activities in the Context of Sustainable Forest Management (2012–2015) by ITTO (International Tropical Timber Organization).
Acknowledgments
We would like to thank the Forest Department of Myanmar and particularly the Yedashe Township officers for their support and arrangements for our fieldwork. We thank the Edanz Group (www.edanzediting.com/ac) for editing a draft of this manuscript.
Conflicts of Interest
The authors declare no conflict of interest.
References
- Johnson, F.X.; Tella, P.V.; Israilava, A.; Takama, T.; Diaz-Chavez, R.; Rosillo-Calle, F. What woodfuels can do to mitigate climate change. FAO For. Pap. 2010, 1, 1–98. [Google Scholar]
- DeFries, R.; Pandey, D. Urbanization, the energy ladder and forest transitions in India’s emerging economy. Land Use Policy 2010, 27, 130–138. [Google Scholar] [CrossRef]
- Van Der Kroon, B.; Brouwer, R.; Van Beukering, P.J.H. The energy ladder: Theoretical myth or empirical truth? Results from a meta-analysis. Renew. Sustain. Energy Rev. 2013, 20, 504–513. [Google Scholar] [CrossRef]
- Arnold, J.E.M.; Köhlin, G.; Persson, R. Woodfuels, livelihoods, and policy interventions: Changing Perspectives. World Dev. 2006, 34, 596–611. [Google Scholar] [CrossRef]
- Kersten, I.; Baumbach, G.; Oluwole, A.F.; Obioh, I.B.; Ogunsola, O.J. Urban and rural fuelwood situation in the tropical rain-forest area of south-west Nigeria. Energy 1998, 23, 887–898. [Google Scholar] [CrossRef]
- Woollen, E.; Ryan, C.M.; Baumert, S.; Vollmer, F.; Grundy, I.; Fisher, J.; Fernando, J.; Luz, A.; Ribeiro, N.; Lisboa, S.N. Charcoal production in the Mopane woodlands of Mozambique: what are the trade-offs with other ecosystem services? Philos. Trans. R. Soc. B Biol. Sci. 2016, 371, 1–14. [Google Scholar] [CrossRef] [PubMed]
- Sovacool, B.K. Confronting energy poverty behind the bamboo curtain: A review of challenges and solutions for Myanmar (Burma). Energy Sustain. Dev. 2013, 17, 305–314. [Google Scholar] [CrossRef]
- Sa’ad, S.; Bugaje, I.M. Biomass Consumption in Nigeria: Trends and Policy Issues. J. Agric. Sustain. 2016, 9, 127–157. [Google Scholar]
- Chidumayo, E.N.; Gumbo, D.J. The environmental impacts of charcoal production in tropical ecosystems of the world: A synthesis. Energy Sustain. Dev. 2013, 17, 86–94. [Google Scholar] [CrossRef]
- Zulu, L.C. The forbidden fuel: Charcoal, urban woodfuel demand and supply dynamics, community forest management and woodfuel policy in Malawi. Energy Policy 2010, 38, 3717–3730. [Google Scholar] [CrossRef]
- Gebreegziabher, Z.; Mekonnen, A.; Kassie, M.; Köhlin, G. Urban energy transition and technology adoption: The case of Tigrai, northern Ethiopia. Energy Econ. 2012, 34, 410–418. [Google Scholar] [CrossRef]
- Zulu, L.C.; Richardson, R.B. Charcoal, livelihoods, and poverty reduction: Evidence from sub-Saharan Africa. Energy Sustain. Dev. 2013, 17, 127–137. [Google Scholar] [CrossRef]
- Nagothu, U. S. Fuelwood and fodder extraction and deforestation: Mainstream views in India discussed on the basis of data from the semi-arid region of Rajasthan. Geoforum 2001, 32, 319–332. [Google Scholar] [CrossRef]
- Top, N.; Mizoue, N.; Kai, S.; Nakao, T. Variation in woodfuel consumption patterns in response to forest availability in Kampong Thom Province, Cambodia. Biomass Bioenergy 2004, 27, 57–68. [Google Scholar] [CrossRef]
- Top, N.; Mizoue, N.; Ito, S.; Kai, S.; Nakao, T.; Ty, S. Re-assessment of woodfuel supply and demand relationships in Kampong Thom Province, Cambodia. Biomass Bioenergy 2006, 30, 134–143. [Google Scholar] [CrossRef]
- Bensch, G.; Peters, J. Alleviating Deforestation Pressures? Impacts of Improved Stove Dissemination on Charcoal Consumption in Urban Senegal. Land Econ. 2011, 89, 676–698. [Google Scholar] [CrossRef]
- Cuvilas, C. A.; Jirjis, R.; Lucas, C. Energy situation in Mozambique: A review. Renew. Sustain. Energy Rev. 2010, 14, 2139–2146. [Google Scholar] [CrossRef]
- Win, Z. C.; Mizoue, N.; Ota, T.; Kajisa, T.; Yoshida, S.; Oo, T. N.; Ma, H. ok Differences in consumption rates and patterns between firewood and charcoal: A case study in a rural area of Yedashe Township, Myanmar. Biomass Bioenergy 2018, 109, 39–46. [Google Scholar] [CrossRef]
- Mwampamba, T. H. Has the woodfuel crisis returned? Urban charcoal consumption in Tanzania and its implications to present and future forest availability. Energy Policy 2007, 35, 4221–4234. [Google Scholar] [CrossRef]
- FAO. Global Forest Resources Assessment 2015: How Are the World’s Forests Changing? FAO: Rome, Italy, 2015. [Google Scholar]
- James, H. Cooperation and community empowerment in Myanmar in the context of Myanmar Agenda 21. Asia. Pac. Econ. Lit. 2003, 17, 1–21. [Google Scholar] [CrossRef]
- Kelso, D.J. Applying U.S. Law to Halt Deforestation in Southeastern Myanmar: A Survey of Potential Strategies. Pacif. Rim. Law Policy J. 1991, 83, 1–25. [Google Scholar]
- Mon, M.S.; Mizoue, N.; Htun, N.Z.; Kajisa, T.; Yoshida, S. Factors affecting deforestation and forest degradation in selectively logged production forest: A case study in Myanmar. For. Ecol. Manag. 2012, 267, 190–198. [Google Scholar] [CrossRef]
- Webb, E.L.; Jachowski, N.R. A.; Phelps, J.; Friess, D.A.; Than, M.M.; Ziegler, A.D. Deforestation in the Ayeyarwady Delta and the conservation implications of an internationally-engaged Myanmar. Glob. Environ. Chang. 2014, 24, 321–333. [Google Scholar] [CrossRef]
- Leimgruber, P.; Kelly, D.S.; Steininger, M.K.; Brunner, J.; Müller, T.; Songer, M. Forest cover change patterns in Myanmar (Burma) 1990–2000. Environ. Conserv. 2005, 32, 156–364. [Google Scholar] [CrossRef]
- Brouwer, R.; Falcão, M.P. Wood fuel consumption in Maputo, Mozambique. Biomass Bioenergy 2004, 27, 233–245. [Google Scholar] [CrossRef]
- Bhatt, B.P.; Negi, A.K.; Todaria, N.P. Fuelwood consumption pattern at different altitudes in Garhwal Himalaya. Energy 1994, 19, 465–468. [Google Scholar] [CrossRef]
- Fox, J. Firewood consumption in a Nepali village. Environ. Manag. 1984, 8, 243–249. [Google Scholar] [CrossRef]
- FAO. FAO Year Book of Forest Products 2010–2014 (2014); FAO: Rome, Italy, 2016. [Google Scholar]
- Zeileis, A.; Hothorn, T. Diagnostic Checking in Regression Relationships. R News 2002, 2, 7–10. [Google Scholar]
- Shackleton, C.M.; Gambiza, J.; Jones, R. Household fuelwood use in small electrified towns of the Makana District, Estern Cape, South Africa. J. Energy S. Afr. 2007, 18, 4–10. [Google Scholar]
- Kituyi, E.; Marufu, L.; Huber, B.; Wandiga, S.O.; Jumba, I.O.; Andreae, M.O.; Helas, G. Biofuel consumption rates and patterns in Kenya. Biomass Bioenergy 2001, 20, 83–99. [Google Scholar] [CrossRef]
- Top, N.; Mizoue, N.; Kai, S. Woodfuel Consumption Rates and Flow in Kampong Thom Province, Cambodia. J. For. Plan. 2003, 9, 17–24. [Google Scholar]
- Mushtaq, T.; Sood, K.K.; Peshin, R. Delineating key determinants of domestic fuelwood consumption of rural households in western Himalaya-policy implications. J. Mt. Sci. 2014, 11, 195–204. [Google Scholar] [CrossRef]
Figure 1.
Location of the Yedashe town surveyed in this present study and the rural villages sampled by Win et al. [18] in Bago region, Myanmar. The World Borders Dataset, provided by Thematic Mapping (http://thematicmapping.org/), was used for the national border. The administrative boundary provided by the Myanmar Information Management Unit (http://www.themimu.info/) was used for the township boundary. Data about land cover and roads were obtained from the Forest Department of Myanmar.

Figure 2.
Sources of firewood consumed in urban area of Yedashe Township.

Figure 3.
Change in forest area (hectares) needed to meet the woodfuel demand for the whole township if the rural population switched from being single- to multiple-fuel users.
Figure 3.
Change in forest area (hectares) needed to meet the woodfuel demand for the whole township if the rural population switched from being single- to multiple-fuel users.


Table 1.
Household characteristics in urban and rural areas of Yedashe Township. Data of the rural area were obtained from Win et al. [18].
Table 1.
Household characteristics in urban and rural areas of Yedashe Township. Data of the rural area were obtained from Win et al. [18].
| Urban | Rural | |
|---|---|---|
| Number of household | 66 | 137 |
| Family size (number of family members) (mean ± SE) | 4.6 ± 0.2 | 4.9 ± 0.2 |
| Annual income (US$) (mean ± SE) | 4338 ± 460 | 1686 ± 101 |
| Electricity installment | ||
| Yes | 64 | 0 |
| No | 2 | 137 |
Table 2.
Types of cooking energy consumed in urban area of Yedashe Township.
| Number of Households | Fraction of Sample Household According to the Type of Energy Use | Per-Capita Woodfuel Consumption (Weight) (kg year−1) | Per-Capita Woodfuel Consumption (Volume) (m-3 year−1) | ||
|---|---|---|---|---|---|
| Types of energy | |||||
| Only Firewood | 6 | 9.09% | 362.3 ± 107.0 | 0.5 ± 0.2 | |
| Electricity and Firewood | 17 | 25.76% | 189.0 ± 40.2 | 0.3 ± 0.1 | |
| Only Charcoal | 7 | 10.61% | 109.8 ± 18.3 | 0.7 ± 0.1 | |
| Electricity & Charcoal | 28 | 42.42% | 62.0 ± 13.7 | 0.4 ± 0.1 | |
| Gas, Firewood & Electricity | 1 | 1.52% | 21.6 ± 0.0 | 0.3 ± 0.0 | |
| Charcoal, Firewood & Electricity | 2 | 3.03% | 122.2 ± 50.2 (firewood) 19.5 ± 1.5 (charcoal) | 0.2 ± 0.1 (firewood) 0.1 ± 0.0 (charcoal) | |
| Non-woodfuel only | 5 | 7.57% | |||
| Total | 66 | 100% | |||
| Stove types in firewood users | |||||
| Fuel-efficient stove Parallel-brick stove Three-stone-stove | 1 1 24 | 3.8% 3.8% 92.4% | |||
| Frequency of cooking | |||||
| Once Twice Thrice | 38 27 1 | 57.6% 40.9% 1.5% | |||
Table 3.
Summary of woodfuel supply and demand in urban and rural areas; values for the rural area are from Win et al. [18].
Table 3.
Summary of woodfuel supply and demand in urban and rural areas; values for the rural area are from Win et al. [18].
| Items | Items (Symbols) | Firewood | Charcoal | Unit | ||
|---|---|---|---|---|---|---|
| Urban | Rural | Urban | Rural | |||
| Demand of woodfuel | ||||||
| Annual per capita consumption | ||||||
| weight of the product | Ccp | 217 | 780 | 69 | 280 | kg |
| weight in solid-wood equivalent | Ccw | 217 | 780 | 293 | 1190 | kg |
| volume in solid-wood equivalent | Ccv | 0.3 | 1.1 | 0.4 | 1.7 | m3 |
| Proportion of forest-derived green wood | Pg | 61 | 16 | 100 | 100 | % |
| Proportion of size ≥ 10 cm in diameter | P10 | 28 | 28 | 100 | 100 | % |
| Per capita demand for forest-derived green wood ≥ 10 cm in diameter | Dc = Ccw × Pg × P10 | 38 | 36 | 293 | 1190 | kg |
| Number of the woodfuel users in the whole township | Nr | 9159 | 153,666 | 13,651 | 35,578 | persons |
| Total demand from all woodfuel users in the township | Dt = Dc × Nr | 344 | 5460 | 3993 | 42,340 | t |
| Supply | ||||||
| Forest biomass density for all trees ≥ 10 cm in diameter | Ba | 45 | 45 | 45 | 45 | t ha−1 |
| Proportion of tree size available for woodfuel | Psi | 53 | 53 | 80 | 80 | % |
| Proportion of tree species available for woodfuel | Psp | 43 | 43 | 40 | 40 | % |
| Forest biomass density for trees available for woodfuel | Bw = Ba × Psi × Psp | 10 | 10 | 15 | 15 | t ha−1 |
| Forest area needed to meet the annual per capita demand | Fc = Dc/Bw | 37 | 35 | 201 | 820 | m2 |
| Forest area needed to meet the total annual demand | Ft = Fc × Nr | 34 | 530 | 274 | 2900 | ha |
Table 4.
The estimates of the generalized linear model (GLM).
| Estimate | SE | t | Pr (>|t|) | ||
|---|---|---|---|---|---|
| Firewood Consumption | |||||
| Intercept | 157.450 | 111.159 | 1.416 | 0.174 | |
| Household size | −67.796 | 19.949 | −3.398 | 0.003 | |
| Annual income | 0.028 | 0.011 | 2.525 | 0.021 | |
| Frequency of cooking | 183.840 | 49.449 | 3.718 | 0.002 | |
| User type (Single-fuel user) | 157.585 | 65.736 | 2.397 | 0.028 | |
| Charcoal Consumption | |||||
| Intercept | 38.644 | 34.459 | 1.121 | 0.271 | |
| Household size | −0.349 | 7.048 | −0.049 | 0.961 | |
| Annual income | −0.002 | 0.003 | −0.699 | 0.490 | |
| Frequency of cooking | 15.672 | 19.253 | 0.814 | 0.422 | |
| User type (Single-fuel user) | 59.757 | 22.858 | 2.614 | 0.014 | |
© 2018 by the authors. Licensee MDPI, Basel, Switzerland. This article is an open access article distributed under the terms and conditions of the Creative Commons Attribution (CC BY) license (http://creativecommons.org/licenses/by/4.0/).
Share and Cite
MDPI and ACS Style
Win, Z.C.; Mizoue, N.; Ota, T.; Kajisa, T.; Yoshida, S. Consumption Rates and Use Patterns of Firewood and Charcoal in Urban and Rural Communities in Yedashe Township, Myanmar. Forests 2018, 9, 429. https://doi.org/10.3390/f9070429
AMA Style
Win ZC, Mizoue N, Ota T, Kajisa T, Yoshida S. Consumption Rates and Use Patterns of Firewood and Charcoal in Urban and Rural Communities in Yedashe Township, Myanmar. Forests. 2018; 9(7):429. https://doi.org/10.3390/f9070429
Chicago/Turabian StyleWin, Zar Chi, Nobuya Mizoue, Tetsuji Ota, Tsuyoshi Kajisa, and Shigejiro Yoshida. 2018. "Consumption Rates and Use Patterns of Firewood and Charcoal in Urban and Rural Communities in Yedashe Township, Myanmar" Forests 9, no. 7: 429. https://doi.org/10.3390/f9070429
Note that from the first issue of 2016, this journal uses article numbers instead of page numbers. See further details here.