Taylor’s Power Law for Leaf Bilateral Symmetry
by

Ping Wang
1, 
David A. Ratkowsky
2,
Xiao Xiao
3,
Xiaojing Yu
1,
Jialu Su
1,
Lifang Zhang
1 and
Peijian Shi
1,* 1
Co-Innovation Centre for Sustainable Forestry in Southern China, College of Biology and the Environment, Bamboo Research Institute, Nanjing Forestry University, Nanjing 210037, China
2
Tasmanian Institute of Agriculture, University of Tasmania, Private Bag 98, Hobart, Tasmania 7001, Australia
3
Intuit Inc., 7535 Torrey Santa Fe Rd, San Diego, CA 92131, USA
*
Author to whom correspondence should be addressed.
Forests 2018, 9(8), 500; https://doi.org/10.3390/f9080500
Submission received: 17 July 2018
/
Revised: 12 August 2018
/
Accepted: 14 August 2018
/
Published: 16 August 2018
(This article belongs to the Section Forest Ecophysiology and Biology)
Abstract
:Leaf shape and symmetry is of interest because of the importance of leaves in photosynthesis. Recently, a novel method was proposed to measure the extent of bilateral symmetry in leaves in which a leaf was divided into left and right sides by a straight line through the leaf apex and base, and a number of equidistant strips were drawn perpendicular to the straight line to generate an equivalent number of differences in area between the left and right parts. These areal differences are the basis for a measure of leaf bilateral symmetry, which was then examined to see how well it follows Taylor’s power law (TPL) using three classes of plants, namely, 10 geographical populations of Parrotia subaequalis (H.T. Chang) R.M. Hao et H.T. Wei, 10 species of Bambusoideae, and 10 species of Rosaceae. The measure of bilateral symmetry followed TPL for a single species or for a class of closely related species. The estimate of the exponent of TPL for bamboo plants was significantly larger than for the dicotyledonous trees, but its goodness of fit was the best among the three classes of plants. The heterogeneity of light falling on branches and leaves due to above-ground architectural patterns is an important contributor to leaf asymmetry.
1. Introduction
The leaf is the most important organ of plant photosynthesis. The scaling relationship between leaf weight and leaf area (W = aAb, where W denotes leaf weight, A denotes leaf area, a and b are constants to be estimated) is of wide interest because the leaf dry mass per unit area (LMA = W/A = aAb−1) has been shown to be proportional to photosynthetic efficiency [1,2,3,4]. Leaf shape can affect the scaling relationship between leaf weight and leaf area [5], so that closely related species with a large variation in leaf shape, for example, Rosa, will have a very weak scaling relationship between leaf weight and leaf area for pooled data from those species. However, if the closely related species are also similar in leaf shape, for example, bamboo plants, there can be a strong scaling relationship both for a single species and for pooled leaf weight and leaf area data from different species [6]. Since LMA can affect the photosynthetic rate, leaf shape can also affect it [5]. Thus, leaf shape appears to be important for the investigation of leaf functional traits. Seed plants are considered to have evolved independently from ancient large-leaf vascular plants with diverse leaf shapes [5], and the leaves of many plants, especially the angiosperms, exhibit bilateral symmetry [7]. Previous studies on leaf shape paid much attention to leaf teeth and leaf anatomic structure, but largely neglected leaf bilateral symmetry [5,8]. Although bilateral symmetry has attracted attention in biotic and abiotic areas, there are still few quantitative studies about leaf symmetry [9,10,11,12].
Taylor’s power law (TPL) first described the variance–mean relationship in ecology [13]: V = αMβ, where V and M represent the variance and mean, respectively, of a series of specific ecological measures, for example, the population densities of insects in different-size quadrats, and α and β are constants to be estimated. This power law has been found to be valid in many areas of study [14]. Controversy surrounding recent relevant studies is about whether the exponent β of TPL is determined by an inherent biological mechanism or is only a purely statistical feature [15,16,17,18]. Cohen and Xu demonstrated that the estimate of the exponent of TPL is proportional to the skewness of the distribution generated by random sampling in blocks [15]. Using a feasible set approach, Xiao et al. showed that TPL arises from the constraining influences of two primary variables, namely, the number of individuals and the number of sites [16]. TPL with an exponent ranging from 1.0 to 2.0 could be generated by the most possible configurations of individuals among sites. Shi et al. [17] used two clustering point process models to examine the effect of dispersal distance of plant seeds or rhizomes on the estimate of the exponent of TPL, and found that with increasing dispersal distance the exponent described a complex response curve. In addition, dry weights of crops at different investigation times and the development and growth rates of insects at different temperatures have also been shown to follow TPL [18]. These measures associated with TPL appear to be related to the energy distribution among different statistical units. To use a more direct approach to demonstrate the link between TPL and energy distribution, Li et al. [19] checked the influence of different time interval divisions of the same seismic time series on the estimate of the exponent of TPL between the variance and mean of the released energies among different earthquakes within the same interval. The estimates of the exponent of TPL for the seismic time series approximated 2.0. Then, fixing the exponent of TPL to 2.0, the estimate of the logarithm of the constant α in TPL was demonstrated to be a logarithmic function of the time interval division. These studies related to TPL have added to our understanding of the variation of a large number of ecological and non-ecological measures, for example, animal and plant population density, biomass, poikilothermic developmental rate, crime, precipitation, released energies of aftershocks, trading activity of stock, and so on [13,18,19,20,21,22]. In our recent studies, weight is a typical representative of energy for biological measures, so the variance–mean relationship based on weight measures should reflect TPL well [23].
In this paper, we examine whether TPL holds for a measure of leaf bilateral symmetry. Because a relationship between leaf weight and leaf area has been demonstrated to hold for many individual species [1,2,6], we believe that a measure of bilateral symmetry based on leaf area instead of leaf weight could fit the TPL. A strong scaling relationship between leaf weight and leaf area should result in a strong TPL for a measure of bilateral symmetry based on leaf area. In addition, the light heterogeneity caused by differences of the above-ground architectural patterns among different families [24] should result in different estimates of the exponent of TPL. The scaling relationship between leaf weight and leaf area actually only affects the goodness of fit for TPL of the leaf bilateral symmetry measure. However, it might not determine the size of the estimate of the exponent of TPL, which could be closely related to the light heterogeneity. The topology of branches apparently has an important influence on the light interception for the leaves at different layers of the crown. A regular and sparse branching pattern can render leaves to capture light with two sides equally that consequently reduces the degree of leaf bilateral asymmetry. In this case, the estimate of the exponent of TPL would be expected to be smaller than that from an irregular and dense branching pattern.
2. Materials and Methods
2.1. Materials
Three families of plants were used: 10 geographical populations of Parrotia subaequalis (H.T. Chang) R.M. Hao & H.T. Wei (Hamamelidaceae) with 150 leaves for each population, 10 species of Bambusoideae (Poaceae) with 100 to 500 leaves for every species, and 10 species of Rosaceae with more than 300 leaves for each species. Tables S1–S3 on the online Supplementary Materials show the details of these plants, including their collection sites, Latin names, sample sizes. For P. subaequalis, the populations were collected in South-Eastern China. The plants of Bambusoideae and Rosaceae were all collected from the Nanjing Forestry University campus in Nanjing, Jiangsu Province, China (see Tables S1–S3 for details). To carry out the interspecific comparison, the sample size (number of leaves collected) of each species is more than 100. To test whether the power–law relationship between the variance and mean of a measure of leaf bilateral symmetry for a single species can be representative of whole bamboo clusters, we collected 500 leaves of Pleioblastus chino (Franchet & Savatier) Makino. We collected these leaves when their shapes were basically or completely stable in order to reduce the measurement error during the calculation of the extent of leaf bilateral symmetry.
2.2. Methods
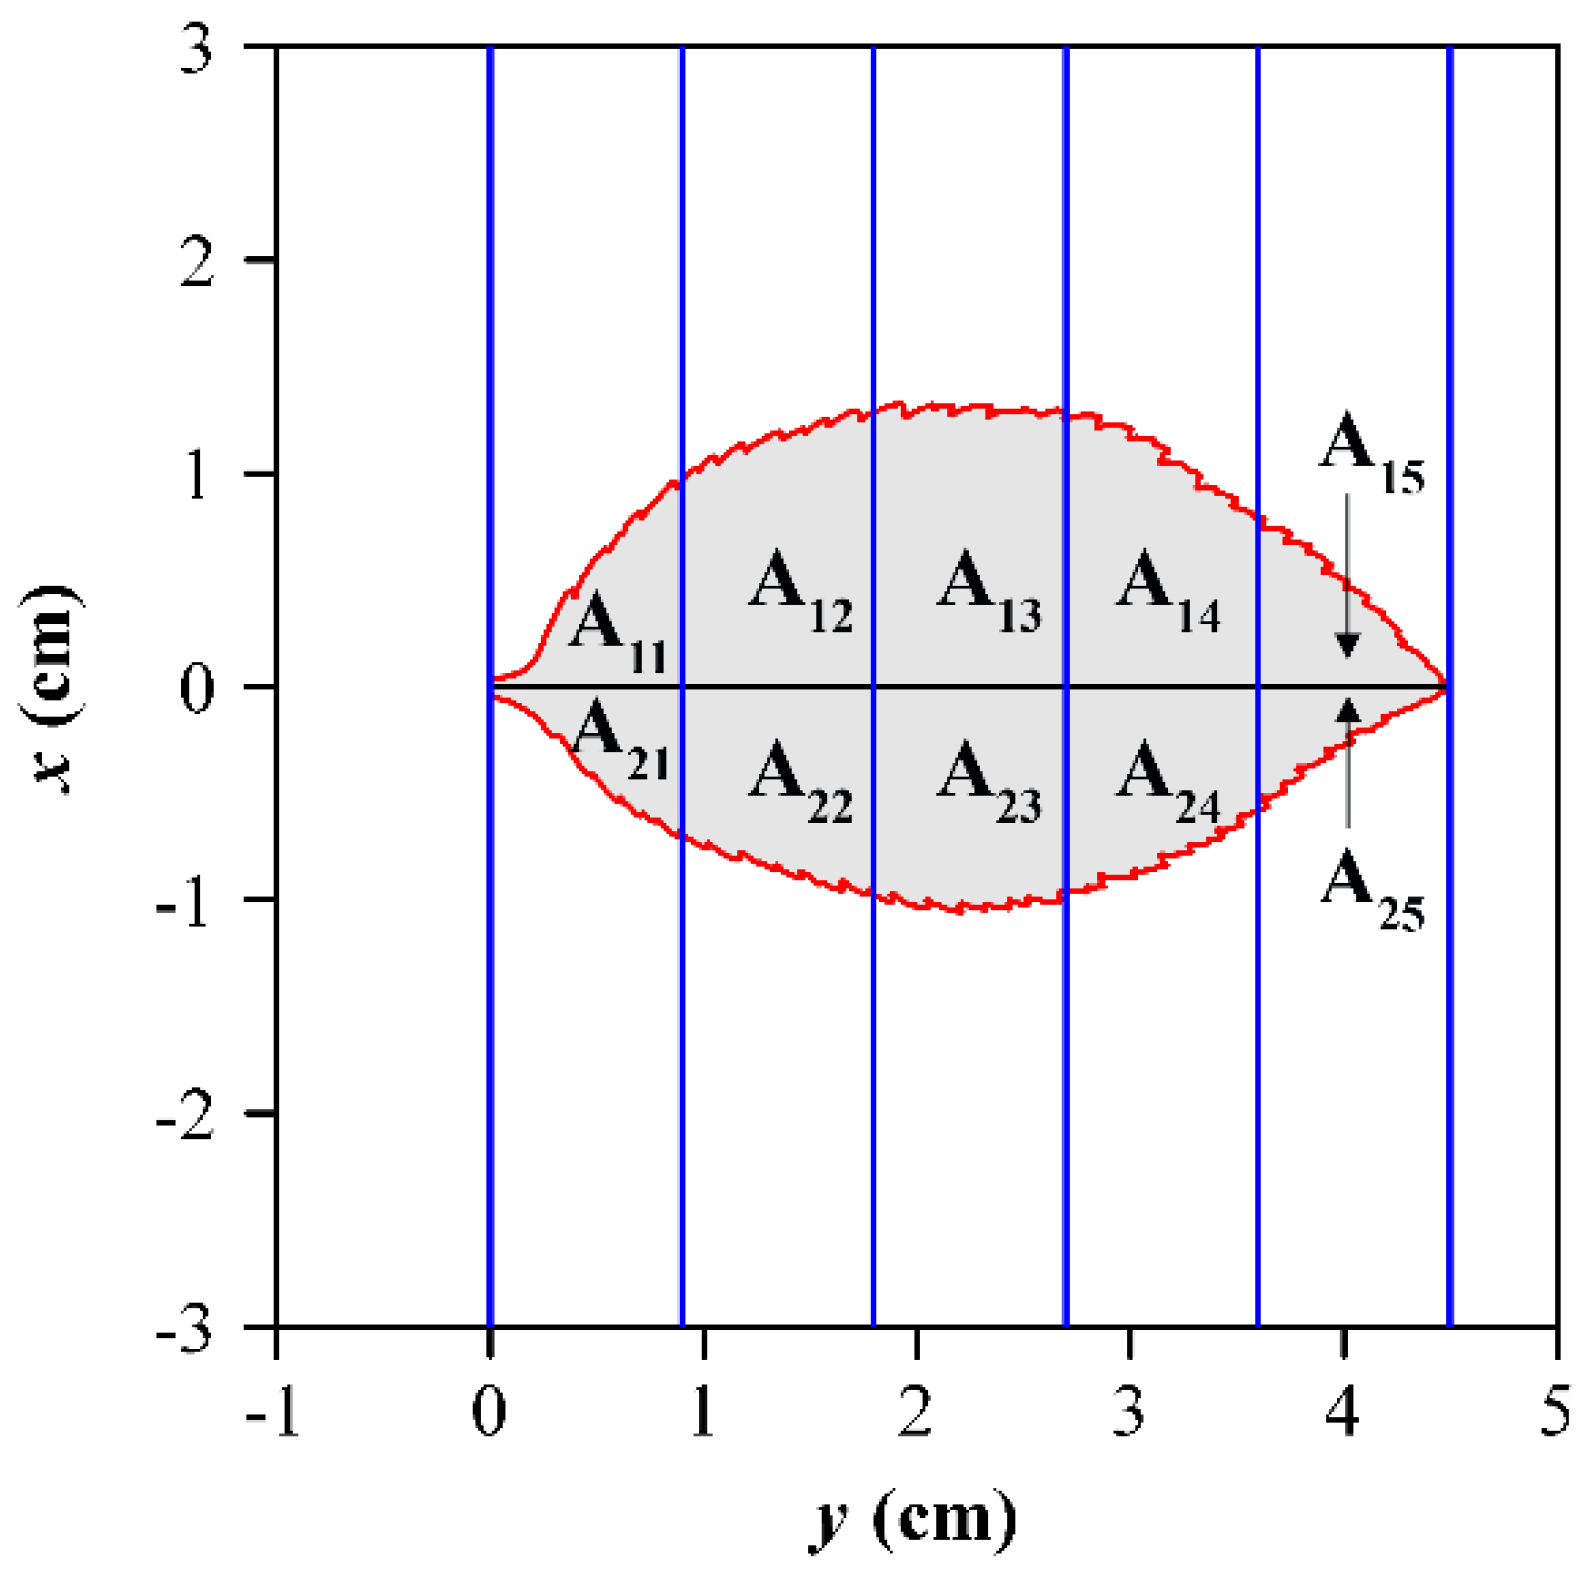
Shi et al. proposed a method to calculate the extent of leaf bilateral symmetry (or asymmetry) [7]. A leaf was divided into left and right (or upper and lower) sides by a straight line passing through leaf apex and leaf base (Figure 1). Using n strips perpendicular to the straight line to intersect the leaf, the areas of the intersected parts between the leaf and strips were obtained. Let A1i (i ranging from 1 to n) represent the areas of the intersected parts between the left (upper) side of the leaf with the i-th strip, and A2i (i ranging from 1 to n) represent the areas of those parts between the right (lower) side of the leaf with the i-th strip. Then the following differences in a leaf were obtained:
Here, is used to quantify the extent of the subregion on the leaf segmented by the i-th strip deviating from a perfect bilateral symmetry. Clearly, . In actuality, because of the existence of measurement errors and left-right natural asymmetry, is usually greater than zero. From these measurements on a leaf, paired values of the mean (M) and variance (V) of these differences were obtained. Assuming that there are N leaves for a species or a cluster of species, there would be N pairs of data for the mean and variance: , where j represents the j-th leaf and j ranges from 1 to N. According to the definition of TPL,
Taking the natural logarithm of both sides of the above equation, we have
where is the response variable, is the independent variable, and and β are parameters to be estimated.
Assume that N leaves for a species have been collected (see Tables S1–S3 for the detailed sample size information for every species). For any leaf, we can calculate the mean and variance of the absolute values of the areal differences between the left and right subregions segmented by the strips on the leaf (Figure 1). Thus, for each species, there are in total N pairs of data for mean and variance. Linear regression was then used to fit the log-transformed data of mean and variance to estimate the parameters β and γ of Equation (3). The bootstrap percentile method was used to test whether there was a significant difference between any of the estimates of the exponent of TPL for any two species within the same family, and the 95% confidence intervals (CIs) of the exponent of TPL were also calculated using the bootstrap percentile to indicate the reliability of the parameter estimates [25,26]. The coefficient of determination (i.e., R2) was calculated to measure the goodness of fit of the linear regression and the degree of the predicted values deviating from the observations.
where denotes the predicted value of yj, and denotes the mean of yj (j ranging from 1 to N). For the comparison of the estimates of the exponent of TPL among three families (which means that the data for the mean and variance of species within the same family were pooled), the analysis of covariance was used.
3. Results and Discussion
For P. subaequalis, TPL holds for the 10 geographical populations, with the coefficients of determination ranging from 0.81 to 0.91 (Figure 2). The estimates of the exponent of TPL for the measure of leaf bilateral symmetry for the 10 populations range from 1.5 to 1.7 except for population ‘TT’ (Code 9) which had an estimate of 1.79, significantly larger than those of the other populations except for population ‘TX’ (Code 10) (Figure 3a). The estimate of the exponent of TPL of population ‘HZ’ (Code 4) is significantly smaller than those of populations ‘HN’, ‘TT’ and ‘TX’ (Codes 2, 9 and 10). There are eight populations in total whose estimates of the exponent of TPL are not significantly different (see the letter ‘B’ in Figure 3a). The estimate of the exponent of TPL for the pooled data for these 10 populations is 1.649 with 95% CI (1.618, 1.681).
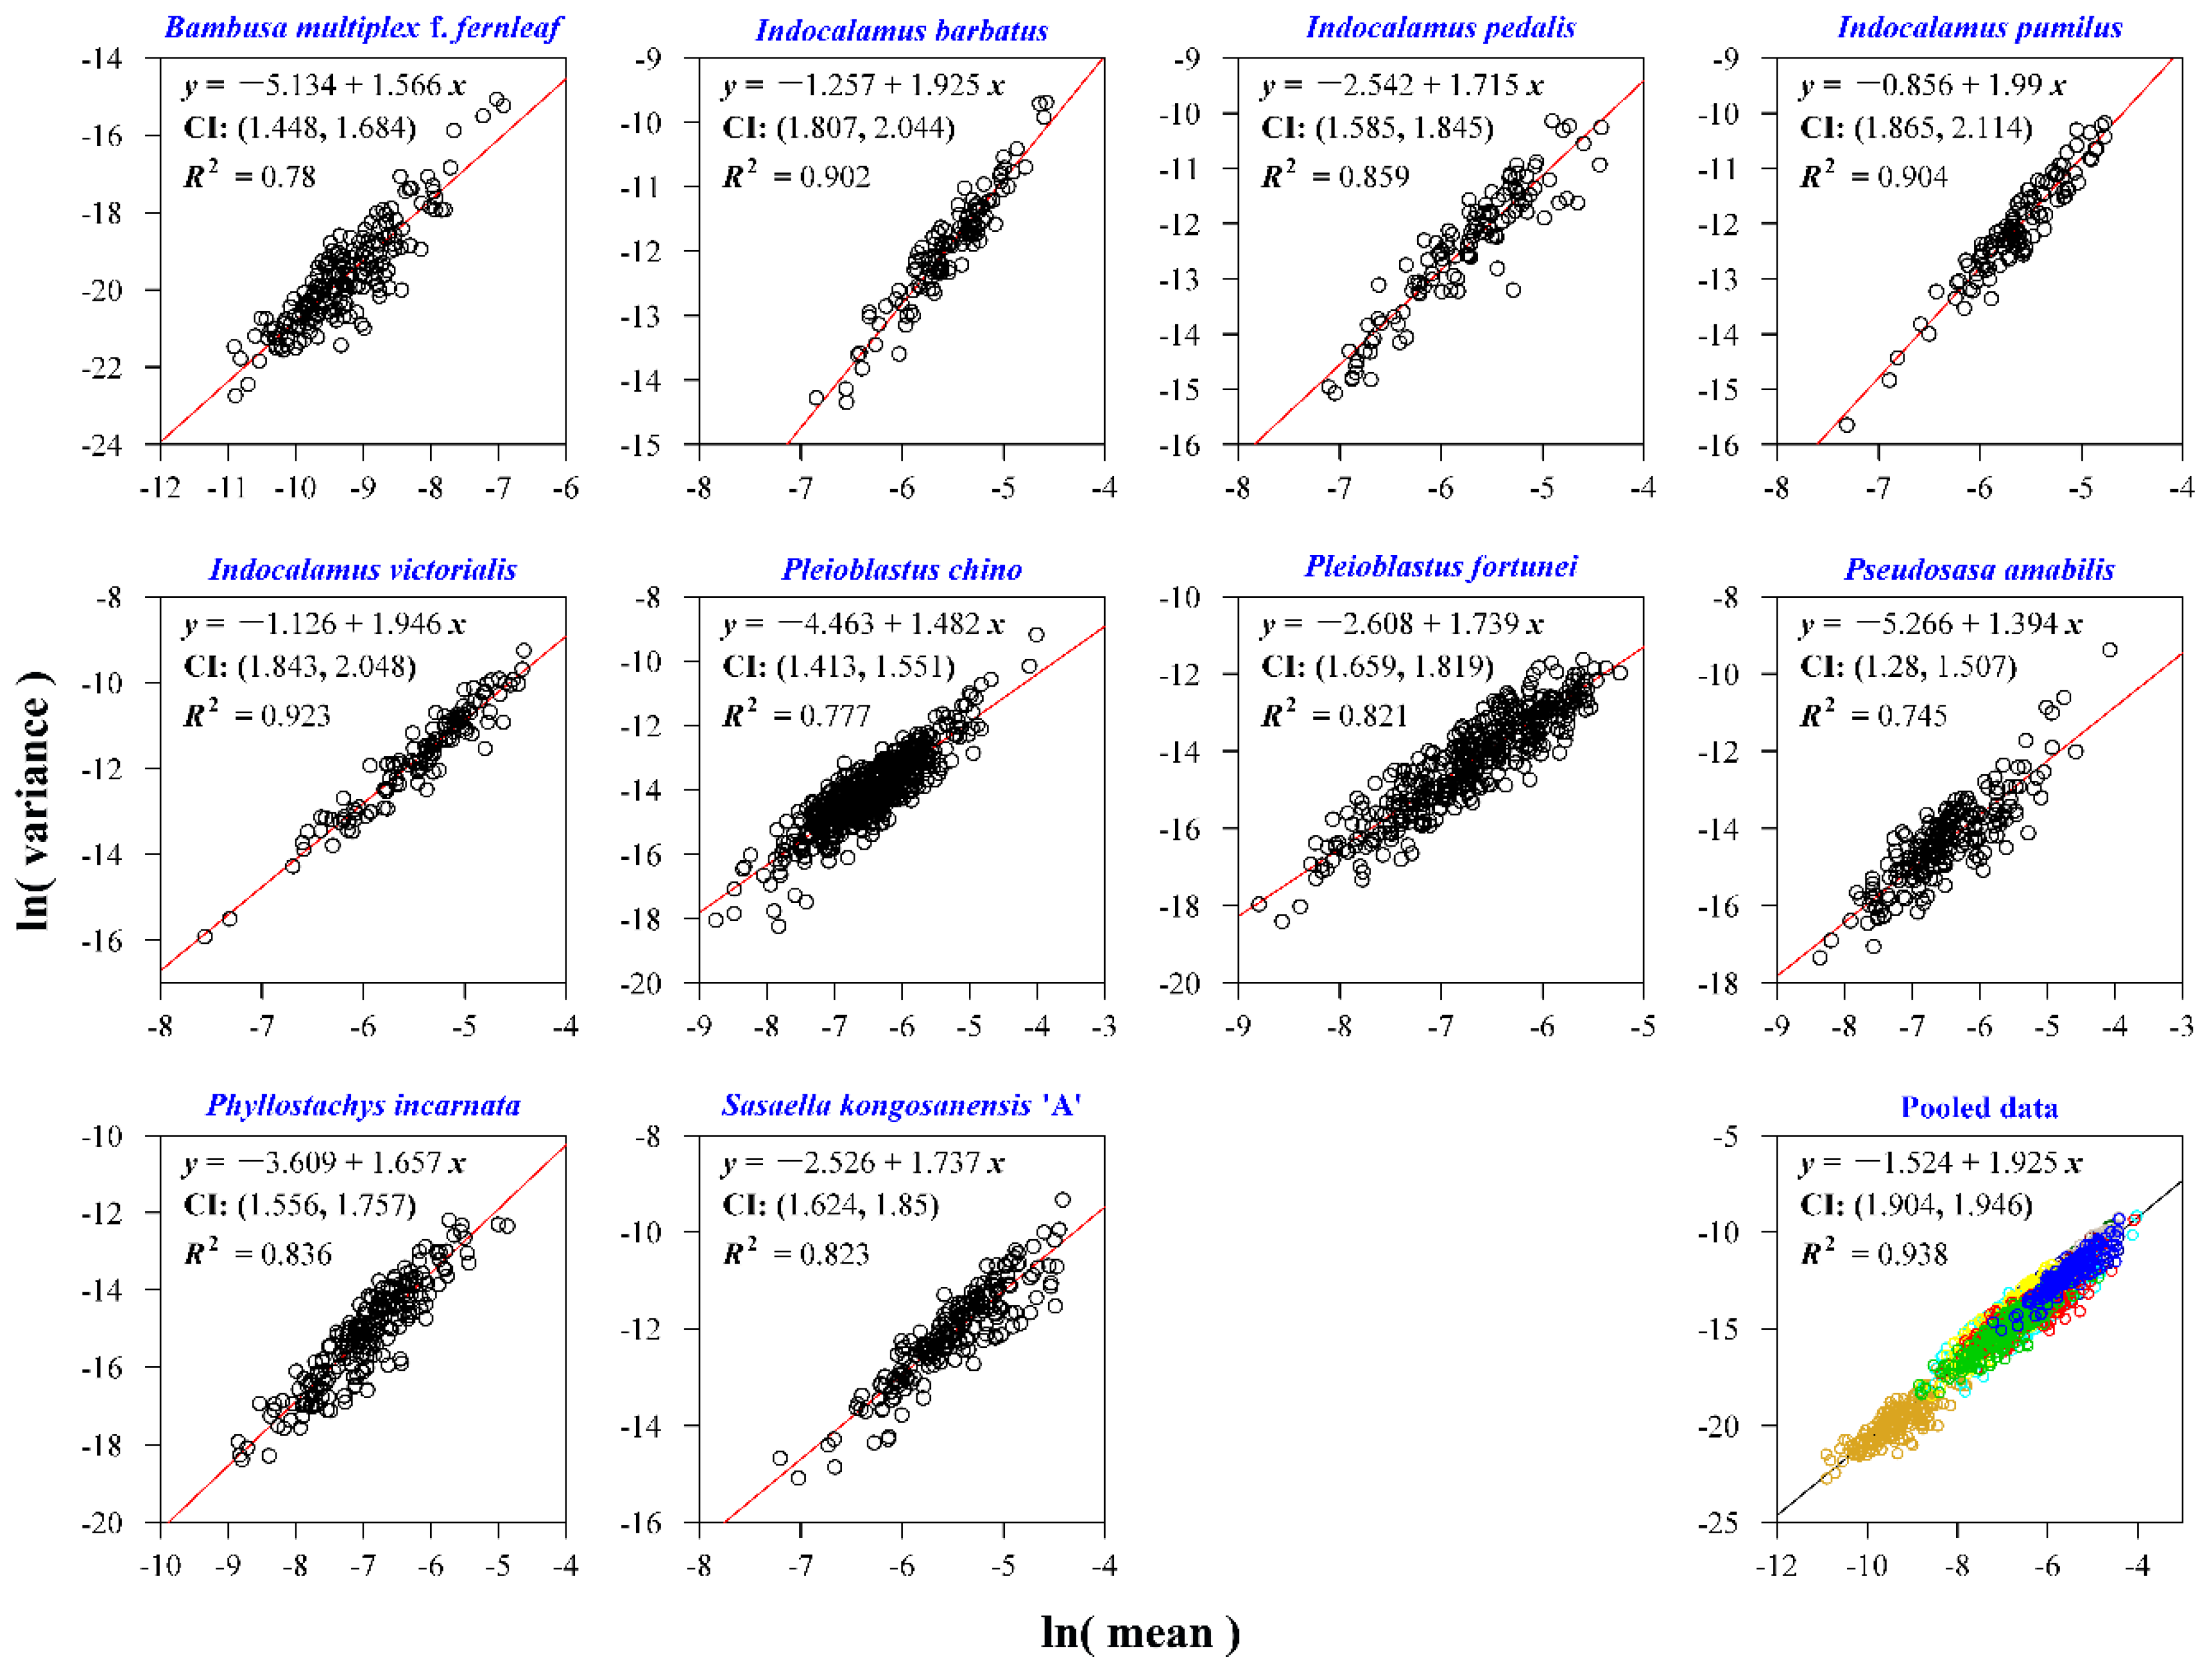
For the plants of Bambusoideae, there are large differences in the estimates of the exponent of TPL between the pooled data and the individual species (Figure 3b). The estimate based on the pooled data is 1.925 with 95% CI (1.904, 1.946) (Figure 4), apparently larger than the estimates of the exponent of TPL, which for most species range from 1.4 to 1.9, except for species 2, 4, and 5 whose estimates are significantly larger than the estimates of the remaining seven species (Figure 3b and Figure 4). These three species with large estimates of the exponent of TPL belong to the same genus Indocalamus. We note that these estimates of the exponent of TPL are the largest among the three classes of plant (Figure 3).
For the plants of Rosaceae, the estimates of the exponent of TPL range from 1.3 to 1.7, with the estimate for the pooled data being 1.621 with 95% CI (1.602, 1.641) (Figure 5). Although there are significant differences in the estimates of the exponent of TPL among different species, the range of the estimates for this family is smaller than that for the bamboo plants (Figure 3).
From the comparison of the exponents of TPL among three pooled data sets using analysis of covariance, we found that they were significantly different, although the difference between the estimates of the exponent for the pooled data of P. subaequalis and for the pooled data of Rosaceae was very small (Table 1 and Figure 6). However, the estimate of the exponent for the pooled data of Bambusoideae was significantly higher than for the others. After pooling the data of ln(variance) and ln(mean) for all three classes of plants, TPL still holds and the estimate of the exponent of TPL is 1.773 with 95% CI (1.760, 1.787). It appears that the measure of bilateral symmetry for all leaves of the plants investigated follow a general TPL (R2 = 0.907) if we neglect differences among the species and among the classes (Figure 6).
Our previous study demonstrated that there was a strong scaling relationship between leaf weight and leaf area using 11 bamboo species, with the estimate for the scaling exponent being 1.147, with 95% CI (1.143, 1.152) and R2 = 0.99 (see Figure 5 in reference [6]). However, our recent studies show that the estimate of the scaling exponent between leaf dry weight and leaf area using the pooled data of the 10 populations of P. subaequalis is 1.245, with 95% CI (1.214, 1.277) and R2 = 0.70 [30], and the estimate for the scaling exponent between leaf dry weight and leaf area using the pooled data of the 10 species of Rosaceae is 1.462, with 95% CI (1.439, 1.486) and R2 = 0.70 (unpublished data of P. Shi). Therefore, the scaling relationship of leaf weight and leaf area of bamboo plants is significantly stronger than those of the other two classes of plants based on the comparison of the coefficients of determination (i.e., R2). Because the biomass (weight) is a better measurement than the area or length in describing TPL [18,23], plants with a better scaling relationship between leaf weight and leaf area will have a better TPL for describing leaf bilateral symmetry. If we could cut a leaf into different parts with equidistant intervals from the leaf base to leaf apex and measure their weights (see Figure 1), we believe that we would obtain a better goodness of fit for TPL by using the measures of leaf weight than using the measures of leaf area. However, the cost of measurement makes this impracticable.
The estimate of the exponent of TPL for bamboo plants is higher than those for P. subaequalis and Rosaceae, and the estimate for P. subaequalis is slightly higher than that for Rosaceae (Table 1). Leaf asymmetry is closely related to light heterogeneity caused by the crown structure [8,24,31]. The above-ground architecture of plants could significantly affect phyllotaxy and leaf shape [24], and neighbourhood competition among plants can also have an influence on the spatial arrangement of branches and twigs, further affecting phyllotaxy and leaf shape [32,33]. P. subaequalis and Rosaceae have similar crown patterns and leaf shapes, so their estimates of the exponent of TPL are very similar (Figure 6). However, for bamboo plants, there is a large variation in crown patterns and spatial arrangement of branches, and the branching system is more complicated than for other grasses [34]. For example, a branch of Phyllostachys has two divarications, whereas a branch of Pleioblastus has three divarications. The extent of variation of light heterogeneity is rather large for some bamboo species, for example, plants of Indocalamus. In a natural population, approximately half the leaves face the sun, and another half are shaded, leading to large differences in light interception. The spatial densities of the bamboos have a significant influence on leaf size [35]. For a leaf, if one side can receive light but another side is shaded, the former will be invested by photosynthesis with more biomass [8] and the leaf will become more bilaterally asymmetric. Thus, plants with a more regular spatial arrangement of branches for light capture might have a smaller variation in their leaf bilateral symmetry. Apparently, bamboo plants do not have such a regular pattern. In the habitats of bamboos without human management, they grow fast and reach their maximal environmental capacity in a short period. For many herbaceous bamboos, this period does not exceed 10 years and the average biomass of bamboos decreases with increasing density [36,37]. The leaves usually cannot extend to their natural state in crowed environments, and the possibility of bilateral asymmetry increases. Comparing the exponent of TPL for the measure of leaf bilateral symmetry for bamboo populations with different densities merits investigation. It is also worthwhile checking whether there are significant differences in the estimates of the exponent of TPL among woody plants with different densities that have the same or similar crowns.
4. Conclusions
Taylor’s power law describing the variance–mean scaling relationship has been demonstrated to hold for a measure of leaf bilateral symmetry in three classes of plants investigated, with estimates of the exponent of TPL in the range of 1.0 to 2.0, in accordance with previous reports in the relevant ecological literature. TPL was found to be applicable to any single species or to the pooled data of closely related different species. However, even for different populations of the same species, the estimates of the exponent of TPL are not identical. The estimate of the exponent for the pooled data for different species within the same taxon was more robust than that obtained using the data of a single species. The estimate of the exponent of TPL for the pooled data of bamboo plants is significantly higher than those for the pooled data of P. subaequalis and Rosaceae. This means that there is a larger variation in the measure of leaf bilateral symmetry for bamboos, which implies that there might be larger light heterogeneity for the leaves at different positions. The goodness of fit of the TPL relationship for bamboos is the best among three classes of plants, which might be related to a good scaling relationship between leaf weight and leaf area. Considering that biomass (or weight) is the best measure for describing TPL, a plant or a class of plants whose leaves have a better scaling relationship between weight and area will have a better TPL for measuring leaf bilateral symmetry. Thus, plants that have the same or similar spatial arrangements of the crown and branches and have the same or similar leaf shape should give a more precise estimate of the exponent of TPL and the goodness of fit for TPL than plants lacking the above characteristics in the above-ground architectural patterns.
Supplementary Materials
The following are available online at https://www.mdpi.com/1999-4907/9/8/500/s1. Table S1. 10 geographical populations of Parrotia subaequalis (H. T. Chang) R. M. Hao et H. T. Wei from Eastern China. For every geographical population, 150 leaves were randomly chosen. Table S2. List of the 10 bamboo species. The collection location: Nanjing Forestry University campus, Nanjing, P. R. China (32.08°N, 118.82°E). Table S3. List of the 10 species of Rosaceae. The collection location: Nanjing Forestry University campus, Nanjing, P. R. China (32.08°N, 118.82°E).
Author Contributions
P.W., X.Y., J.S. and L.Z. carried out the work of leaf collection; P.S., D.A.R. and X.X. designed the experiment, analyzed the data, and wrote the manuscript. The first-round revision was completed by P.S. and D.A.R. All authors read and commented on the manuscript, and contributed equally to this work.
Funding
This research was funded by the National Natural Science Foundation of China (grant number 31400348) and the Priority Academic Program Development of Jiangsu Higher Education Institutions.
Acknowledgments
We thank Yanming Fang, Shuyan Lin and Zhiyi Lin for their useful help in this study.
Conflicts of Interest
The authors declare no conflict of interest.
References
- Niklas, K.J.; Cobb, E.D.; Niinemets, U.; Reich, P.B.; Sellin, A.; Shipley, B.; Wright, I.J. ‘Diminishing returns’ in the scaling of functional leaf traits across and within species groups. Proc. Natl. Acad. Sci. USA 2007, 104, 8891–8896. [Google Scholar] [CrossRef] [PubMed]
- Milla, R.; Reich, P.B. The scaling of leaf area and mass: The cost of light interception increases with leaf size. Proc. R. Soc. Biol. Sci. 2007, 274, 2109–2114. [Google Scholar] [CrossRef] [PubMed]
- Jurik, T.W.; Briggs, G.M.; Gates, D.M. A comparison of four methods for determining leaf area index in successional hardwood forests. Can. J. For. Res. 1985, 15, 1154–1158. [Google Scholar] [CrossRef]
- Niinemets, Ü.; Kull, K. Leaf weight per area and leaf size of 85 Estonian woody species in relation to shade tolerance and light availability. For. Ecol. Manag. 1994, 70, 1–10. [Google Scholar] [CrossRef]
- Nicotra, A.B.; Leigh, A.; Boyce, C.K.; Jones, C.S.; Niklas, K.J.; Royer, D.L.; Tsukaya, H. The evolution and functional significance of leaf shape in the angiosperms. Funct. Plant Biol. 2011, 38, 535–552. [Google Scholar] [CrossRef]
- Lin, S.; Shao, L.; Hui, C.; Song, Y.; Reddy, G.V.P.; Gielis, J.; Li, F.; Ding, Y.; Wei, Q.; Shi, P. Why does not the leaf weight-area allometry of bamboos follow the 3/2-power law? Fron. Plant Sci. 2018, 9, 583. [Google Scholar] [CrossRef] [PubMed]
- Shi, P.; Zheng, X.; Ratkowsky, D.A.; Li, Y.; Wang, P.; Cheng, L. A simple method for measuring the bilateral symmetry of leaves. Symmetry 2018, 10, 118. [Google Scholar] [CrossRef]
- Smith, W.K.; Vogelmann, T.C.; DeLucia, E.H.; Bell, D.T.; Shepherd, K.A. Leaf form and photosynthesis: Do leaf structure and orientation interact to regulate internal light and carbon dioxide? BioScience 1997, 47, 785–793. [Google Scholar] [CrossRef]
- Thompson, D.W. On Growth and Form; Cambridge University Press: London, UK, 1917. [Google Scholar]
- Mardia, K.V.; Bookstein, F.L.; Moreton, I.J. Statistical assessment of bilateral symmetry of shapes. Biometrika 2000, 87, 285–300. [Google Scholar] [CrossRef]
- Klingenberg, C.P.; Barluenga, M.; Meyer, A. Shape analysis of symmetric structures: Quantifying variation among individuals and asymmetry. Evolution 2002, 56, 1909–1920. [Google Scholar] [CrossRef] [PubMed]
- Klingenberg, C.P. Analyzing fluctuating asymmetry with geometric morphometrics: Concepts, methods, and applications. Symmetry 2015, 7, 843–934. [Google Scholar] [CrossRef]
- Taylor, L.R. Aggregation, variance and the mean. Nature 1961, 189, 732–735. [Google Scholar] [CrossRef]
- Fronczak, A.; Fronczak, P. Origins of Taylor’s power law for fluctuation scaling in complex systems. Phys. Rev. E 2010, 81, 066112. [Google Scholar] [CrossRef] [PubMed]
- Cohen, J.E.; Xu, M. Random sampling of skewed distributions implies Taylor’s power law of fluctuation scaling. Proc. Natl. Acad. Sci. USA 2015, 112, 7749–7754. [Google Scholar] [CrossRef] [PubMed]
- Xiao, X.; Locey, K.J.; White, E.P. A process-independent explanation for the general form of Taylor’s law. Am. Nat. 2015, 186, E51–E60. [Google Scholar] [CrossRef] [PubMed]
- Shi, P.J.; Sandhu, H.S.; Reddy, G.V.P. Dispersal distance determines the exponent of the spatial Taylor’s power law. Ecol. Model. 2016, 335, 48–53. [Google Scholar] [CrossRef]
- Shi, P.J.; Ratkowsky, D.A.; Wang, N.T.; Li, Y.; Reddy, G.V.P.; Zhao, L.; Li, B.L. Comparison of five methods for parameter estimation under Taylor’s power law. Ecol. Complex. 2017, 32, 121–130. [Google Scholar] [CrossRef]
- Li, M.; Shi, P.; Li, Y.; Liu, J.; Shi, H.; Xie, T.; Yue, C. A Taylor’s power law in the Wenchuan earthquake sequence with fluctuation scaling. Geophys. Res. Lett. 2018. in review. [Google Scholar]
- Kilpatrick, A.M.; Ives, A.R. Species interactions can explain Taylor’s power law for ecological time series. Nature 2003, 422, 65–68. [Google Scholar] [CrossRef] [PubMed]
- Hanley, Q.S.; Khatun, S.; Yosef, A.; Dyer, R.-M. Fluctuation scaling, Taylor’s law, and crime. PLoS ONE 2014, 9, e109004. [Google Scholar] [CrossRef] [PubMed]
- Eisler, Z.; Bartos, I.; Kertész, J. Fluctuation scaling in complex systems: Taylor’s law and beyond. Adv. Phys. 2008, 57, 89–142. [Google Scholar] [CrossRef]
- Cheng, L.; Hui, C.; Reddy, G.V.P.; Ding, Y.; Shi, P. Internode morphometrics and allometry of Tonkin Cane Pseudosasa amabilis. Ecol. Evol. 2017, 7, 9651–9660. [Google Scholar] [CrossRef] [PubMed]
- Küppers, M. Ecological significance of above-ground architectural patterns in woody plants: A question of cost-benefit relationships. Trends Ecol. Evol. 1989, 4, 375–379. [Google Scholar] [CrossRef]
- Efron, B.; Tibshirani, R.J. An Introduction to the Bootstrap; Chapman and Hall: London, UK, 1993. [Google Scholar]
- Sandhu, H.S.; Shi, P.; Kuang, X.; Xue, F.; Ge, F. Applications of the bootstrap to insect physiology. Fla. Entomol. 2011, 94, 1036–1041. [Google Scholar] [CrossRef]
- R. Core Team. R: A Language and Environment for Statistical Computing; R Foundation for Statistical Computing: Vienna, Austria, 2015; Available online: https://www.R.-project.org/ (accessed on 17 April 2018).
- Shi, P.J.; Huang, J.G.; Hui, C.; Grissino-Mayer, H.D.; Tardif, J.; Zhai, L.H.; Wang, F.S.; Li, B.L. Capturing spiral radial growth of conifers using the superellipse to model tree-ring geometric shape. Front. Plant Sci. 2015, 6, 856. [Google Scholar] [CrossRef] [PubMed]
- Shi, P.J.; Ratkowsky, D.A.; Li, Y.; Zhang, L.F.; Lin, S.Y.; Gielis, J. General leaf-area geometric formula exists for plants—Evidence from the simplified Gielis equation. J. For. Res. 2018. in review. [Google Scholar]
- Zhang, L.; Kilgore, J.S.; Fang, Y. The scaling relationship between leaf mass per area (LMA) and photosynthesis potential of Parrotia subaequalis (Hamamelidaceae) from eastern China. Front. Plant Sci. 2018. in review. [Google Scholar]
- Sumida, A.; Komiyama, A. Crown spread patterns for five deciduous broad-leaved woody species: Ecological significance of the retention patterns of larger branches. Ann. Bot. 1997, 80, 759–766. [Google Scholar] [CrossRef]
- Sumida, A.; Terazawa, I.; Togashi, A.; Komiyama, A. Spatial arrangement of branches in relation to slope and neighbourhood competition. Ann. Bot. 2002, 89, 301–310. [Google Scholar] [CrossRef] [PubMed]
- Chen, L.; Sumida, A. Patterns of branch growth and death in crowns of Sakhalin spruce, Picea glehnii (F. Schmidt) Mast. Forests 2017, 8, 26. [Google Scholar] [CrossRef]
- Liese, W.; Köhl, M. Bamboo: The Plant and Its Uses; Springer: Heidelberg, Germany, 2015. [Google Scholar]
- Shi, P.J.; Xu, Q.; Sandhu, H.S.; Gielis, J.; Ding, Y.L.; Li, H.R.; Dong, X.B. Comparison of dwarf bamboos (Indocalamus sp.) leaf parameters to determine relationship between spatial density of plants and total leaf area per plant. Ecol. Evol. 2015, 5, 4578–4589. [Google Scholar] [CrossRef] [PubMed]
- Liu, G.H.; Shi, P.J.; Xu, Q.; Dong, X.B.; Wang, F.S.; Wang, G.; Hui, C. Does the size-density relationship developed for bamboo species conform to the self-thinning rule? For. Ecol. Manag. 2016, 361, 339–345. [Google Scholar] [CrossRef]
- Qin, P.; Gu, Q.; Wang, S.C.; Cao, J.J.; Wang, F.S.; Shi, P.J. Point pattern analysis on the distributions of large individuals of four dwarf bamboos. J. Nanjing For. Univ. 2018, 42, 39–45. (In Chinese) [Google Scholar]
Figure 1.
Illustration of the measure of bilateral symmetry for a leaf of Prunus cerasifera f. atropurpurea. The leaf base is on the left, and the leaf apex is on the right. For convenience, only five equidistant strips are shown. In practice, we used 1000 equidistant strips intersecting the leaf to calculate the mean and variance of the absolute differences between Ai1 and Ai2, where i ranges from 1 to 1000.

Figure 2.
Taylor’s power law for the measure of leaf bilateral symmetry for 10 populations of P. subaequalis (Hamamelidaceae). The two-letter title of every panel represents the population code (see Table S1 for details). The small open circles represent the observations, and the straight line represents the fitted regression line based on the ordinary least-squares method. ‘CI’ represents the 95% confidence interval of the estimate of the slope of the fitted linear equation.

Figure 3.
Boxplots of the estimates of the exponent of Taylor’s power law (TPL) for three classes of plants. The values forming the box were calculated using 4000 bootstrap replications. The letters on the top of the boxes are used to indicate significant differences between pairs of plants. Codes sharing the same letter(s) indicate no significant difference; otherwise, there is a significant difference. The significance tests were obtained using the bootstrap percentile method.

Figure 4.
Taylor’s power law for the measure of leaf bilateral symmetry for 10 species of Bambusoideae (Poaceae). The detailed Latin name and collecting information can be found in Table S2. The small open circles represent the observations, and the straight line represents the fitted regression line based on the ordinary least-squares method. ‘CI’ represents the 95% confidence interval of the estimate of the slope of the fitted linear equation.

Figure 5.
Taylor’s power law for the measure of leaf bilateral symmetry for 10 species of Rosaceae. The detailed Latin name and collecting information can be found in Table S3. The small open circles represent the observations, and the straight line represents the fitted regression line based on the ordinary least-squares method. ‘CI’ represents the 95% confidence interval of the estimate of the slope of the fitted linear equation.

Figure 6.
Comparison of the estimates of the exponent of TPL among the three classes of plants. The dashed line represents the regression line that used the pooled data of the three classes of plants. The fitted results shown at the top-left corner are for the dashed line with the pooled data.
Figure 6.
Comparison of the estimates of the exponent of TPL among the three classes of plants. The dashed line represents the regression line that used the pooled data of the three classes of plants. The fitted results shown at the top-left corner are for the dashed line with the pooled data.


Table 1.
Analysis of covariance on the significance of difference of the exponent of TPL among three classes of plants.
Table 1.
Analysis of covariance on the significance of difference of the exponent of TPL among three classes of plants.
| Predictor Variables | Coefficient Estimate | SD | z Value | Pr (>|z|) |
|---|---|---|---|---|
| Intercept | −2.6881 | 0.0480 | −55.98 | < 0.01 |
| ln(mean) | 1.7663 | 0.0068 | 260.48 | < 0.01 |
| Bambusoideae | 0.1253 | 0.0185 | 6.79 | < 0.01 |
| Rosaceae | −0.0833 | 0.0171 | −4.86 | < 0.01 |
Residual standard error: 0.5491 on 6908 degrees of freedom; R2 = 0.9092; R2adj = 0.9091; F(3, 6908) = 23043; p < 0.01.
© 2018 by the authors. Licensee MDPI, Basel, Switzerland. This article is an open access article distributed under the terms and conditions of the Creative Commons Attribution (CC BY) license (http://creativecommons.org/licenses/by/4.0/).
Share and Cite
MDPI and ACS Style
Wang, P.; Ratkowsky, D.A.; Xiao, X.; Yu, X.; Su, J.; Zhang, L.; Shi, P. Taylor’s Power Law for Leaf Bilateral Symmetry. Forests 2018, 9, 500. https://doi.org/10.3390/f9080500
AMA Style
Wang P, Ratkowsky DA, Xiao X, Yu X, Su J, Zhang L, Shi P. Taylor’s Power Law for Leaf Bilateral Symmetry. Forests. 2018; 9(8):500. https://doi.org/10.3390/f9080500
Chicago/Turabian StyleWang, Ping, David A. Ratkowsky, Xiao Xiao, Xiaojing Yu, Jialu Su, Lifang Zhang, and Peijian Shi. 2018. "Taylor’s Power Law for Leaf Bilateral Symmetry" Forests 9, no. 8: 500. https://doi.org/10.3390/f9080500
Note that from the first issue of 2016, this journal uses article numbers instead of page numbers. See further details here.