Structure, Diversity, and Carbon Stocks of the Tree Community of Kumasi, Ghana


1
Department of Land Reclamation and Rehabilitation, Kwame Nkrumah University of Science and Technology, PMB, University Post Office, Kumasi, Ghana
2
Center for Development Research (ZEF), University of Bonn, Genscherallee 3, D-53113 Bonn, Germany
*
Author to whom correspondence should be addressed.
Forests 2018, 9(9), 519; https://doi.org/10.3390/f9090519
Submission received: 23 June 2018
/
Revised: 6 August 2018
/
Accepted: 8 August 2018
/
Published: 29 August 2018
(This article belongs to the Special Issue Growth and Ecosystem Services of Urban Trees)
Abstract
:Urban forestry has the potential to address many urban environmental and sustainability challenges. Yet in Africa, urban forest characterization and its potential to contribute to human wellbeing are often neglected or restrained. This paper describes the structure, diversity, and composition of an urban forest and its potential to store carbon as a means of climate change mitigation and adaptation in Kumasi. The vegetation inventory included a survey of 470,100-m2 plots based on a stratified random sampling technique and six streets ranging from 50 m to 1 km. A total of 3757 trees, comprising 176 species and 46 families, were enumerated. Tree abundance and species richness were left skewed and unimodally distributed based on diameter at breast height (DBH). Trees in the diameter classes >60 cm together had the lowest species richness (17%) and abundance (9%), yet contributed more than 50% of the total carbon stored in trees within the city. Overall, about 1.2 million tonnes of carbon is captured in aboveground components of trees in Kumasi, with a mean of 228 t C ha−1. Tree density, DBH, height, basal area, aboveground carbon storage, and species richness were significantly different among green spaces (p < 0.05). The diversity was also significantly different among urban zones (p < 0.0005). The DBH distribution of trees followed a modified reverse J-shaped model. The urban forest structure and composition is quite unique. The practice of urban forestry has the potential to conserve biological diversity and combat climate change. The introduction of policies and actions to support the expansion of urban forest cover and diversity is widely encouraged.
1. Introduction
More than 50% of Ghana’s population now reside in urban areas [1,2]. Kumasi, the second largest city in Ghana, is expanding rapidly in both land area and population. Its population and land area have respectively expanded from about 300,000 inhabitants and 25 km2 in the 1950s to about 2.5 million and 254 km2 today. Between 1986 and 2014, about 200 ha of Kumasi’s green cover was lost annually to urban build-up and road infrastructure [3]. In spite of this massive loss, some 33% of the land area of the political metropolitan Kumasi is still predominantly vegetated, of which 65% is composed of woody tree/shrub cover [3,4]. This remaining natural land cover is a vital ingredient for environmental sustainability and a primary source of key ecosystem goods and services. Yet knowledge about the forest structure and composition, as well as its carbon storage potential, is limited.
Successful ecological management of the urban forest requires a thorough understanding of the structure and composition of remnant trees, forest patches, and the dynamic variability between and within green space types. This reveals inter-green space structural and compositional differences and provides information on how to achieve conservation goals. The urban forest structure and composition is considerably unique and distinct from that of natural and plantation forests. Unlike the latter two, the urban forest exists as fragments of tree clusters of varying sizes scattered between grey infrastructures and may assume several shapes of varying dimensions [5]. The tree community is composed of planted and naturally regenerated species of both exotic and native origins, hence urban forest can be more diverse than forest in neighboring open landscape [6]. Species composition and diversity depend on the ecological zone. For instance, in West Africa, the species tolerant to droughts predominate in cities of the tropical dry savannah, while cities in the tropical high forest zone are composed of species adapted to moist and humid conditions [7]. The size-class distribution of the urban forest is a blend of plantation and natural forests and a mixture of small and large growing trees [6]. The extent, species composition, and structure are influenced by the city morphology, natural environmental characteristics, human management and city age [8], and the pre-development land use types [9]. The stratified levels of stress among green spaces [10] and the lack of or ineffective implementation of urban forestry policies in developing countries [7] affect the pattern of urban forest structure, diversity, and species composition.
Assessing urban forest structure and composition involves measuring and recording information on every tree and the methods adopted are quite well-documented. A complete census of all trees is the most precise way of collecting data, but is cost- and time-consuming for larger tree populations. Random sampling techniques have been used by several studies in the past to assess urban forest structure and composition [11,12,13,14,15]. Other recent studies have used models such as the urban forest effects model, designed and used in several cities around the world, to evaluate urban forest structure, composition, function, and values [13,14]. Remote sensing techniques have also been used intensively to map and depict the distribution, structure, and function of urban forest at a citywide scale [16,17,18,19]. These studies depict the urban forest as a spatially- and vertically-stratified multifunctional entity composed of patches of different sizes, species compositions, tree densities, and tree sizes. Despite this progress, there is limited knowledge on the forest structure, species composition, and forest functions in urban areas in developing countries and urban and peri-urban forest resources are neglected in national forest policies and strategies in countries such as Ghana [20].
There have been several vegetation inventory studies conducted in the forest landscape of Ghana. For instance, between 1985 and 1989, the forest inventory project was implemented to provide data for sustained yield policy formulation and to establish inventory units [21]. This was continued under a new name, as the forest inventory and management project (1989–1997) [22]. The latter provided a more comprehensive national level estimate of the forest structure, species composition, and the yield potential of timber resources in forest inside and outside forest reserves. However, none of the past inventory programs have accounted for urban landscapes in the country, despite the potential of the urban forest to enhance urban sustainability and resilience. The present study contributes to this gap by assessing the tree species composition, diversity, and structure of the urban forest of Kumasi. More specifically, the study (1) describes the tree community structure, species diversity, and composition differences among green spaces of Kumasi; (2) establishes the linkage between urban forest structure, species diversity, and carbon storage (productivity); and (3) discusses the conservation relevance of the urban forest structure and composition of Kumasi.
2. Materials and Methods
2.1. Study Area
Kumasi metropolis is located in south central Ghana (6°41″ N, 1°37″ W, Figure 1). The climate is tropical, characterized by a bi-modal rainfall system. Mean annual rainfall and temperature are 1250 mm [23] and 26.4 °C [24], respectively. Kumasi’s current population accounts for 10% of the total population of Ghana. It is the fastest growing and second largest city in the country, with a population density of 10,000 persons per km2 and an annual growth rate of 4.8% [1,25]. It is a central transiting point for travelers from within and beyond Ghana and hosts the largest open market in West Africa [26]. Kumasi’s history as the “Garden City of West Africa”, in addition to its rapid population growth rate, medium-size character, and location in the tropical high forest zone, make it an ideal city for the analysis of urban forest structure and composition. The metropolitan land area of Kumasi is about 254 km2 (Figure 1) and is partitioned into ten sub-metropolises.
2.2. Vegetation Sampling
Plots were located in Kumasi by a stratified random sampling design (Figure 1) in 2014 as part of the urban biomass study in Ghana [4]. The city was partitioned into two zones based on the normalized difference vegetation index (NDVI): High Density Urban Zone (HDUZ or core urban; mean NDVI ≤ 0.11) and Low Density Urban Zone (LDUZ or peri-urban; mean NDVI > 0.11) (Figure 1). About 12 land-use classes (including eight urban green space (UGS) types) were delineated using satellite imagery techniques [3]. The UGS types included: plantations, natural forest, home gardens, institutional compounds, farmlands, cemeteries/sacred grooves, public parks, and grasslands/rangelands (Figure 1). Forest (plantation or natural) refers to any extensive area of planted or naturally occurring trees, either managed or unmanaged and occupying an area of at least 0.5 ha with trees at least 5 m tall and a canopy cover of at least 80%.
A total of 470 sample points were randomly generated on the UGS map of Kumasi, Ghana, for the assessment of forest structure and biodiversity (Figure 1). A 10 × 10 m quadrat was established for each sampling point with the help of a compass, a distance tape measure, and ranging poles, except in home gardens, where the entire area of the garden was surveyed. All trees with a diameter at breast height (DBH = 1.3 m from ground) >5 cm within each plot were identified to the species level, counted by species, and the height and DBH were measured. For trees with multiple stems below the DBH mark, the diameter of each stem was measured and their combined mean estimated as the quadratic mean of the individual stem diameters. At least six streets of lengths ranging from 50 m to 1 km were purposively selected and all trees along each road were counted by species and their heights and DBH measured. Purposive sampling was required here because the majority of streets in Kumasi are devoid of trees. The species identification was carried out with the aid of tree experts and published tree identification guides, such as those by Hawthorne and Gyakari [27] and Oteng-Amoako [28].
2.3. Data Analysis
Tree density, basal area, and size class distribution (SCD) were estimated and constituted the basis for describing the urban forest structure of Kumasi. Tree density is the number of trees per plot area, while basal area is expressed as 0.00007854 × D2 (D = DBH in cm). An interval of 10 cm was maintained between successive diameter size classes, except for diameters above 90 cm, where larger intervals >10 cm were adopted. Species richness, abundance, and biomass in each DBH class were calculated for the entire city and for each green space type.
The aboveground biomass of each tree was computed using the generalized biomass model developed for pantropical forest trees (Equation (1)) [29].
where AGB = aboveground biomass (kg), D = DBH in cm, h = height in m, and ρ = dry wood density of the tree species. For plants in the Arecaceae family, height was measured and specific biomass equations involving height used for the estimation of biomass, since the DBH of these trees are usually inaccessible and unmeasurable.
AGB = 0.0673 × (ρD2h)0.976
The dry wood density of each species was obtained from published literature and global databases [30,31]. The biomass was then multiplied by 0.474 to obtain carbon stocks per tree [32].
Species richness was expressed as the number of observed species for each DBH class of the sampled trees, while Chao1 was used to estimate the potential species richness for the entire city, each UGS type, and each urban zone (Equation (2)). Chao1, the simplest nonparametric estimator, estimates the total number of species (Sest) by adding a term that only depends on the observed number of singletons (a), species each represented by a single individual) and doubletons (b), species each represented by exactly two individuals) to the number of species observed (Sobs) [33].
Species accumulation curves were constructed based on the number of individuals and the sample size/number. Shannon’s (H) and Simpson’s (D) diversity indices and Pielou’s (J) evenness were calculated. Chi-square statistics were used to establish significant differences in species richness and diversity among green spaces and urban zones.
Beta diversity analysis was performed to determine similarities in species composition among urban zones and UGS types. Beta diversity was estimated with the reformulated Sørenson’s and Jaccard’s indices instead of the binary techniques often employed [34]. These indices use a probabilistic approach which combines incidence-based indices with relative abundance data, thus minimizing bias and placing unequal weightings on rare and common species [34]. The computations of these indices are outlined in Chao et al. [34]. The values of both indices range between 0 and 1: with a value of 0 implying absolute dissimilarity and a value of 1 implying absolute similarity [33,35]. Thus, high values reflect a low beta diversity (high similarity) and low values reflect a high beta diversity (high dissimilarity). Bootstrap confidence intervals (CI) of the indices at 95% CI were estimated using 1000 iterations.
Correspondence analysis (CA) was performed to show the association between tree species, UGS type, and urban zone. CA graphically displays the relationship between variables which otherwise would not be detected using a pairwise test of associations. The graphs represent relative frequencies based on the distance between row (green space or urban zone) and column (species) profiles and the distances to the average row and column profiles in a low-dimensional space. The distance is measured as a chi-square metric. CA, as well as the inferential chi-square and ANOVA test, were performed in SAS/STAT® 13.2 (SAS Institute Inc., Cary, NC, USA), while the dissimilarity and other qualitative analyses were performed in Microsoft Excel (Microsoft Inc., Redmond, WA, USA).
3. Results
3.1. Species Diversity and Composition
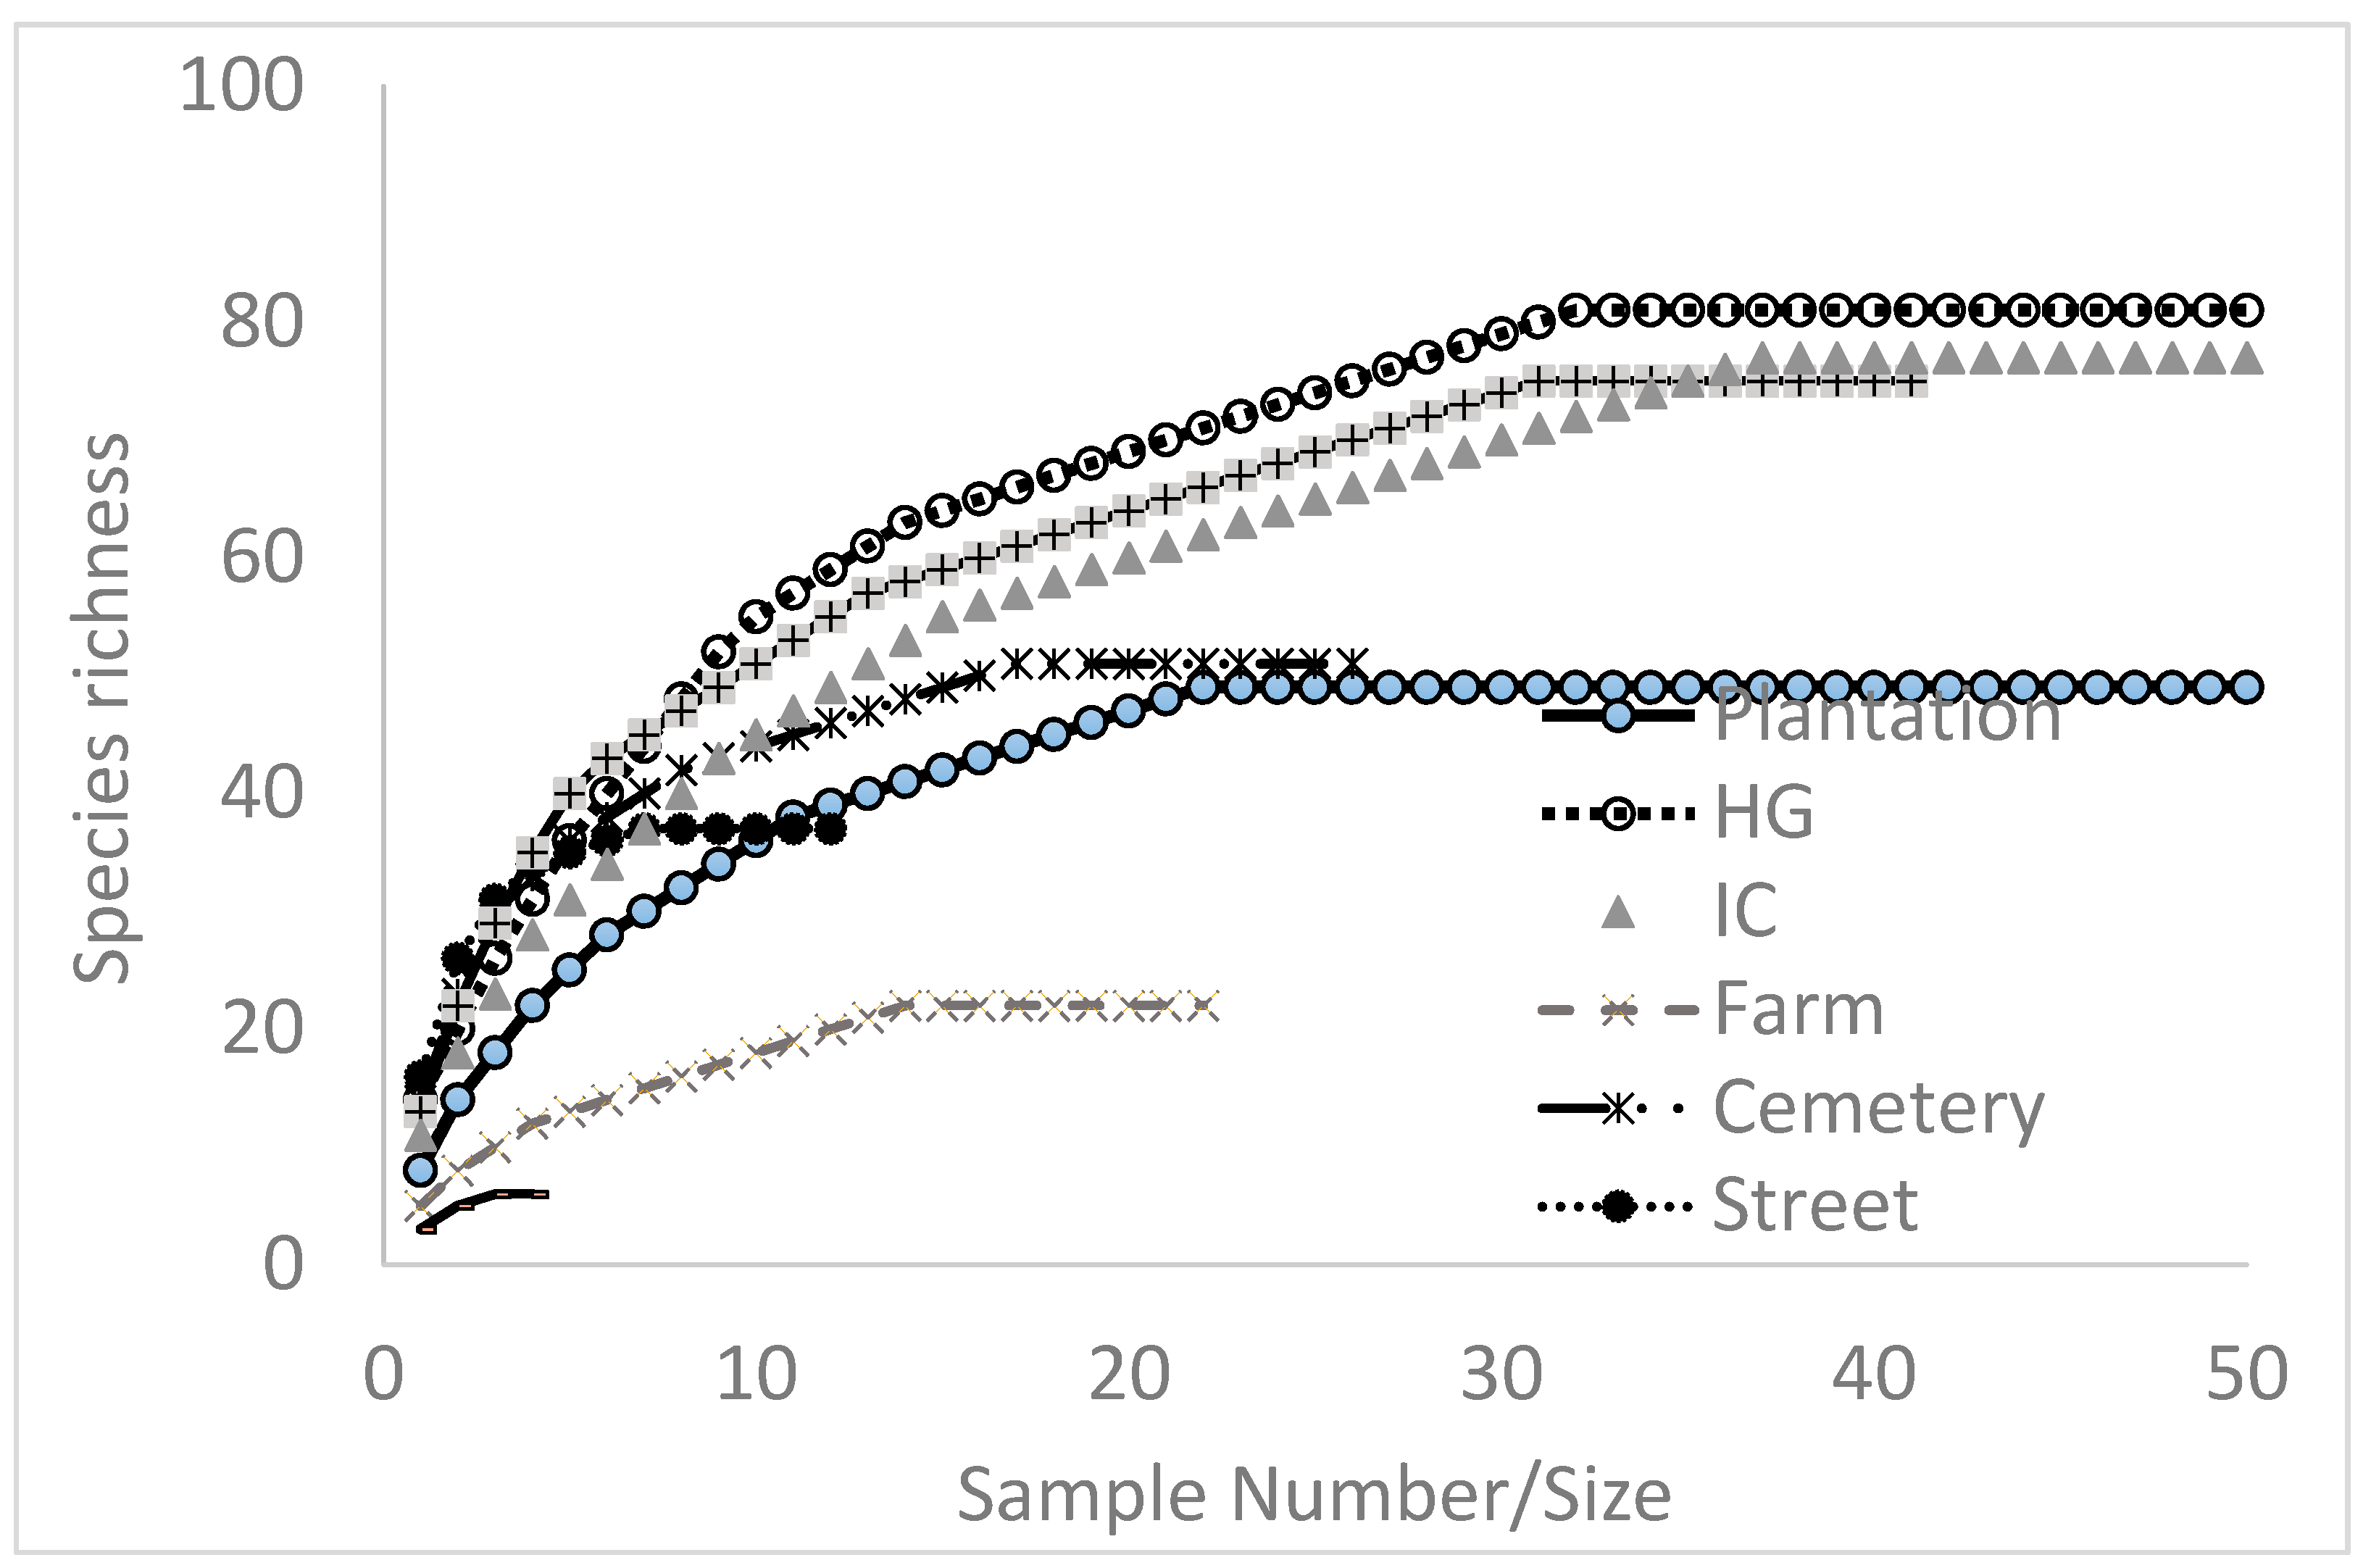
Overall, 176 species in 46 families were enumerated in Kumasi. Species richness differed significantly among green space types and urban zones. The species accumulation curves for the different green space types are presented (Figure 2), indicating the increment in the number of species with sampling effort. The study further indicates that sampling was adequately done. Home gardens, public parks, and institutional compounds were the most species rich; 80, 79, and 75, respectively (Figure 2, Table 1). The natural forest, however, had the highest species richness, as well as the highest Simpson’s and Shannon’s diversity indices (Table 1).
Table 2 provides a list of the five most common species in each of the green space types. Mostly edible tree species are found in the home gardens, whereas species of aesthetic and shade values predominate along streets and within institutional compounds. Correspondence analysis reveals similarity among several green space types (Figure 3). About 51% of the association was well-represented in two dimensions. Dimension 1 (x-axis) representing the UGS type explained 28.5% of the total variation. Cemetery and natural forest were more similar in species composition courtesy of the predominance of native species, while home gardens (HG) and farmlands are also more similar in species composition due to the dominance of fruit and other agroforestry tree species. Common ornamentals and readily establishing exotic species result in species composition similarity among streets, plantations, institutional compounds (IC), and public parks (Figure 3, Table 2). Dimension 2 (y-axis), representing species, accounted for 22.1% of the total variation. The rule of thumb for the interpretation of the biplot is that species near each other are the most similar, UGS near each other are also the most similar, and species near a particular UGS type are most closely associated with or occur in that UGS type.
3.2. Urban Forest Structure and Diversity
The estimated total tree population in the study area is about 3,564,277 ± 27,888, with a mean of 377 trees ha−1. The number of trees per unit area differed significantly among the green space types (Table 3, p < 0.0001). Plantations had the highest tree density of 825 trees ha−1, followed by public parks with 383 trees ha−1 and by institutional compounds with 321 trees ha−1. Farmlands had the lowest tree density of 175 trees ha−1.
Basal area and DBH were also significantly different (p > 0.0001) among green spaces and urban zones. The mean DBH and basal area of the studied plots were 33.3 cm and 55.5 m2 ha−1, respectively. Public parks, natural forest, cemeteries, and institutional compounds had the largest stand basal areas, while grassland, home gardens, and farmland had the smallest basal areas. The natural forest had the largest sized trees, with a mean DBH of 47.5 cm (Table 3).
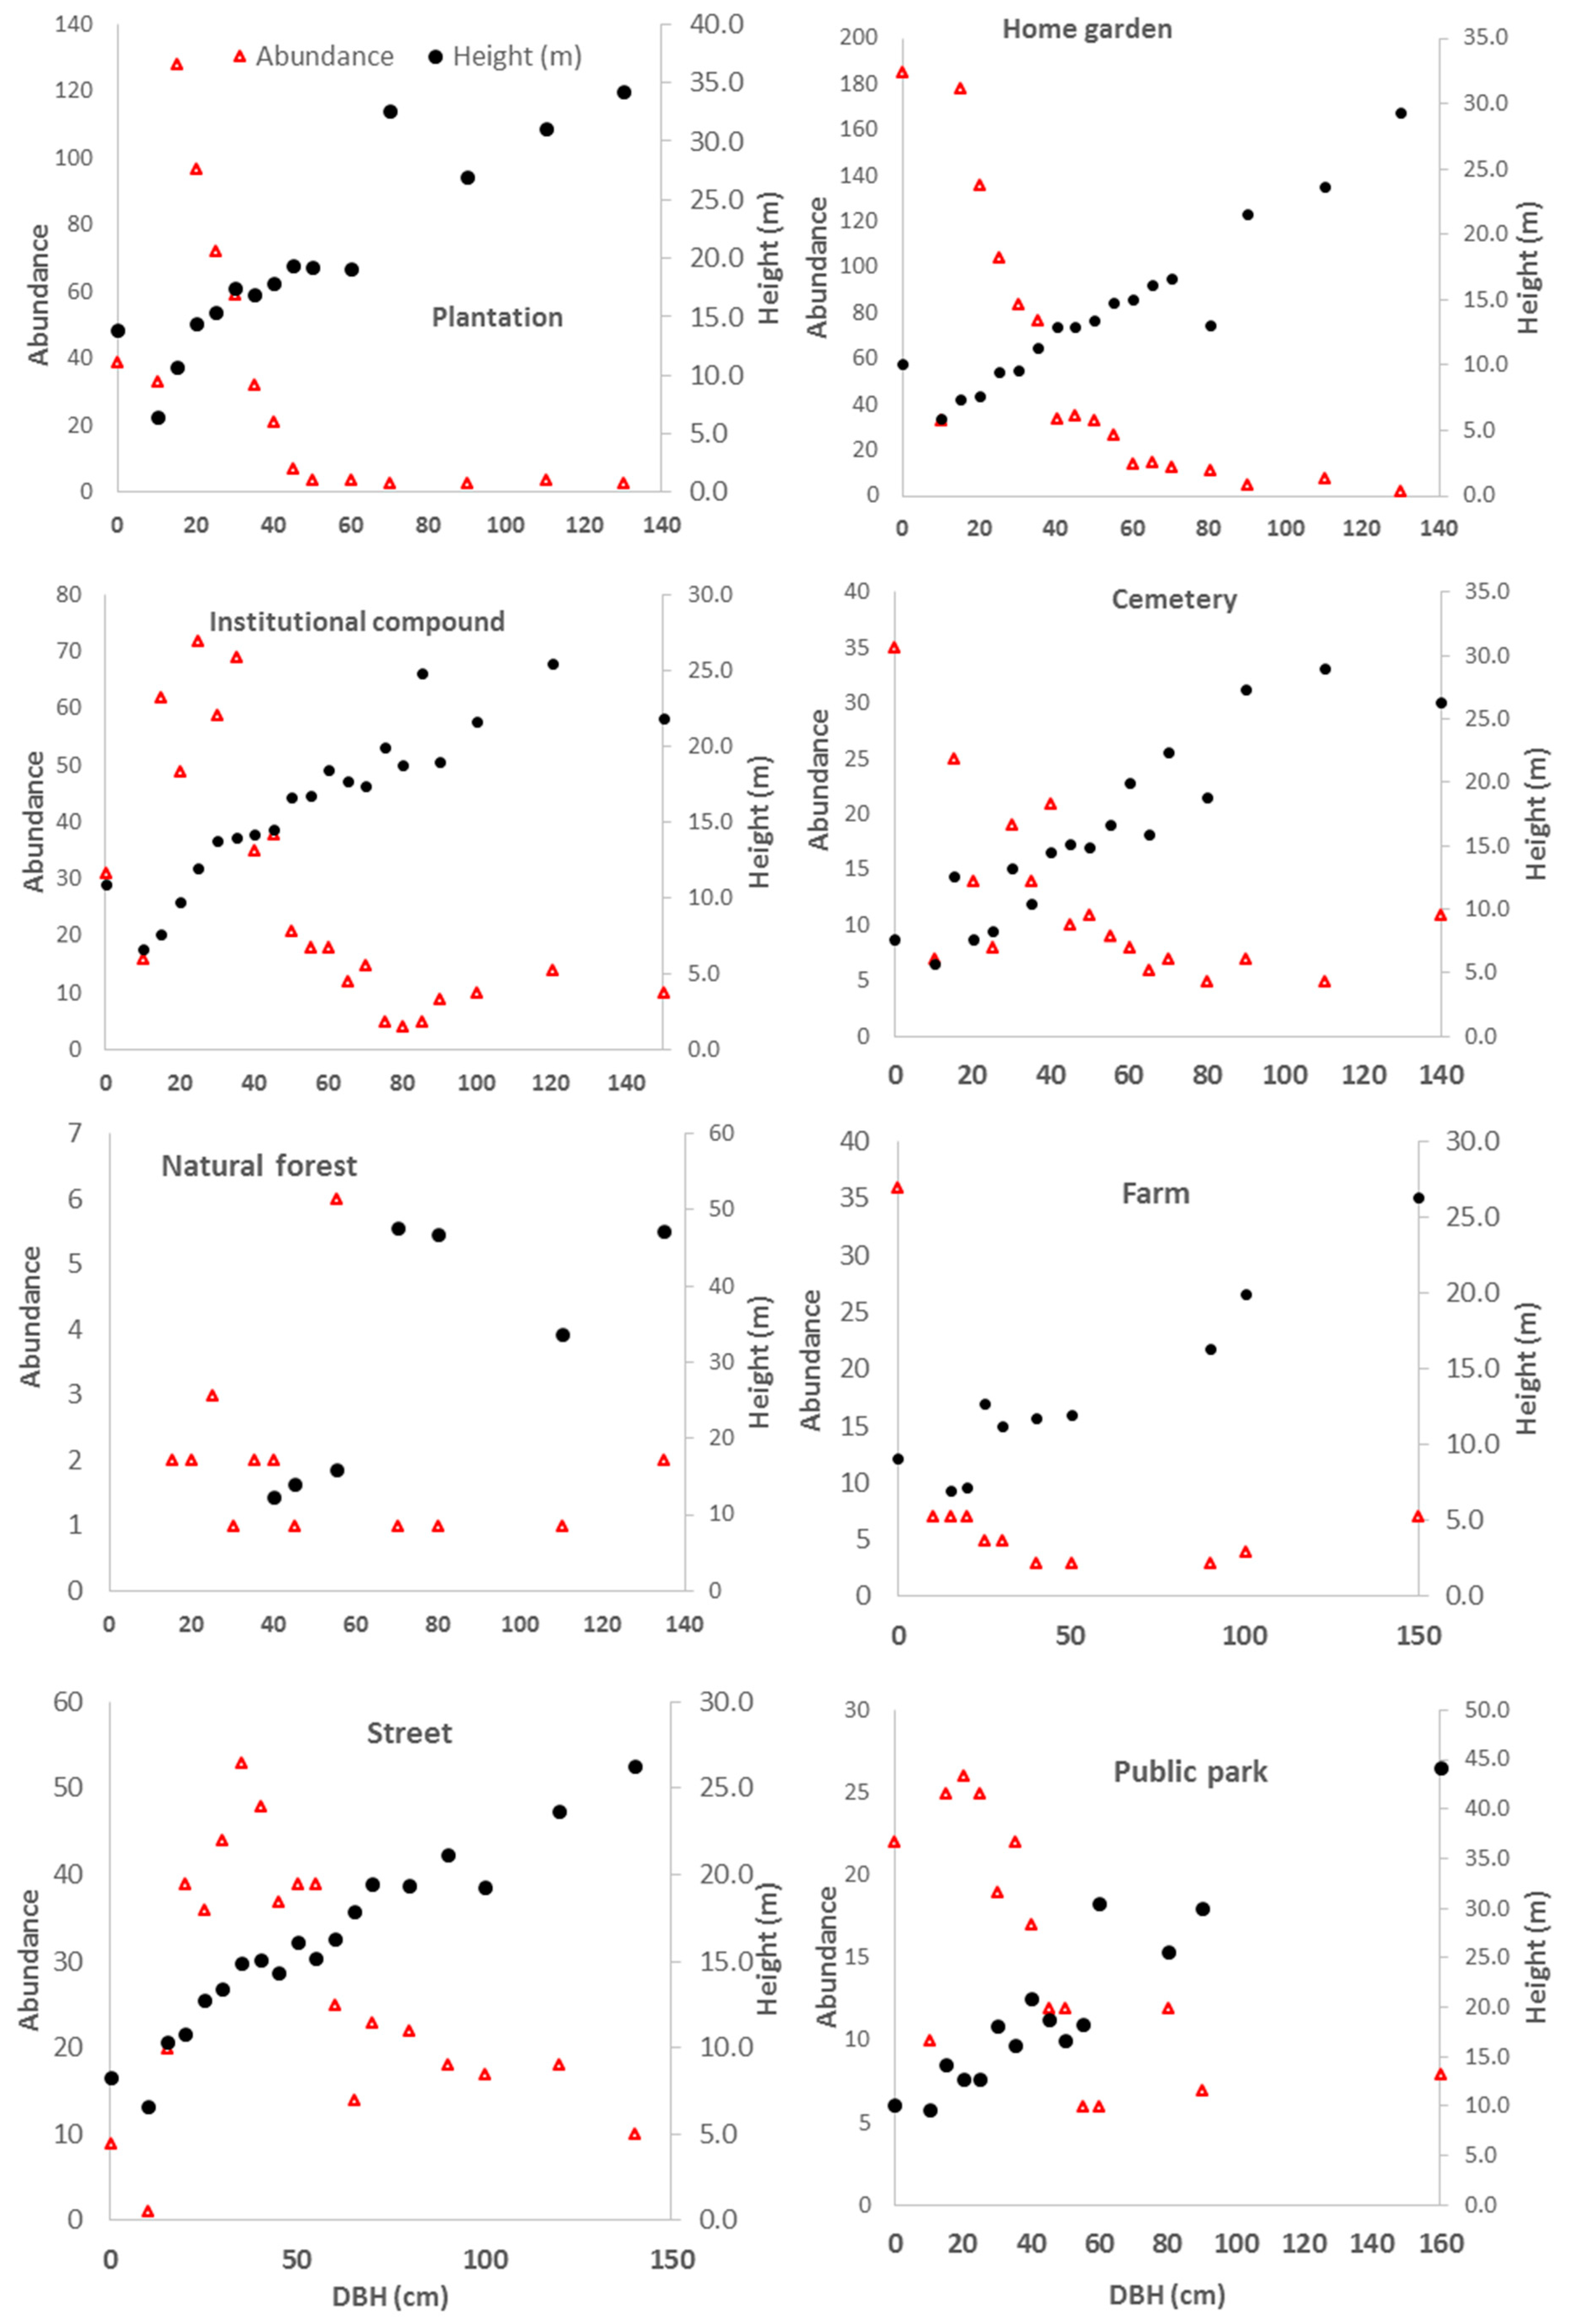
Analysis of the diameter-size class distribution of the urban forest of Kumasi revealed a modified reverse J-shaped curve (Figure 4). Trees with extremely small girth sizes (DBH < 10 cm) were few, since the urban forest in many cases lacks understory vegetation. However, the medium diameter class (DBH > 10 cm) peaked at the DBH = 20 cm with over 400 trees and declined progressively till DBH = 50 cm, where the number of trees per DBH class appears to stabilize. Among green space types, some, such as plantations, institutional compounds, and streets, depicted a similar modified reverse J-model in their diameter distributions, while in others, such as cemeteries and home gardens, the reverse J-shaped model was clearly depicted (Figure 5). This suggests that the reverse J-shaped model does not describe the structure of all forest types. The urban landscape is a complex mixture of planted and conserved self-established trees of native species origin. Besides, due to the different levels of exposure to stress (e.g., pollution), it is unlikely that there is equal mortality among diameter classes.
Similarly, both the species richness and Shannon diversity index were left skewed, with peaks at DBH = 25 and 30 cm, respectively. Species richness ranged between 60 species in DBH = 25 cm and 19 species in DBH > 130 cm (Figure 4). Likewise, the Shannon index was 3.47 in DBH < 25 cm and 2.45 in the DBH > 130 cm.
3.3. The Structure and Composition of the Urban Zones
The species richness and diversity of the HDUZ, LDUZ, and natural forest were significantly different. Species richness and diversity of the HDUZ was less than the LDUZ (p < 0.0001, n = 1, X2 = 15.70). Species richness and Shannon’s diversity index were 109 and 3.5 for the HDUZ, 141 and 3.7 for the LDUZ, and 96 and 3.8 for the natural forest, respectively.
Overall, there were more species per unit area in the HDUZ (0.25 ha−1) compared to the LDUZ (0.18 ha−1) and the neighboring natural forest (0.11 ha−1). The native tree species composition was less than 50% in the HDUZ, slightly above 50% in the LDUZ, and about 95% in the natural forest (Figure 6). As a result, the HDUZ and LDUZ are more similar in composition, with high adjusted Jaccard’s and Sørenson’s indices, while the HDUZ and natural forest are the most dissimilar, with low indices and number of shared species (Table 4).
The tree density was higher in the HDUZ (366 trees ha−1) than the LDUZ (351 trees ha−1), while the sizes of trees in the LDUZ (DBH = 45.6 cm) were significantly larger (p = 0.0144) in girth and height compared to those of the HDUZ (DBH = 40.8 cm).
3.4. Carbon Storage among Diameter Classes
Although lower diameter classes had the highest tree densities and species diversity (richness), the amount of carbon sequestered was low compared to trees in the upper diameter classes (Figure 7). The carbon density of the trees in the city increases exponentially with the girth (size) of the trees. It ranges between 11 kg ha−1 for plants in the Arecaceae family, who’s DBHs were not measured to over 500 kg ha−1 for the largest sized trees in the city. Overall, trees with DBH > 60 cm store over 54% of the total aboveground vegetation carbon (1.2 million t) of Kumasi (Figure 7). However, this diameter class constitutes only 17 and 9% of the total species richness and abundance of trees in the city, respectively. Areas with small-sized trees have a greater potential for carbon sequestration than areas with large-sized trees.
4. Discussion
In this paper, spatially extensive data were used to identify variations in the structure, floristic, and functional composition of forest patches in Kumasi. These variations among green space types imply prominent differences in the population and ecosystem functions and call for different management and conservation strategies.
4.1. Species Diversity and Composition among Green Space Types
Inventory of the woody vegetation in Kumasi revealed a degree of species diversity among green spaces. Global urban forest inventory data is scarce because of the difficulty in operationalizing the concept [36]. The findings of this study represent perhaps the first comprehensive urban tree inventory in Ghana at a citywide scale. The species richness of 176 in Kumasi is numerically comparable or divergent to the species richness, diversity, and composition of other traditional land uses and national parks in Ghana. It is greater than the tree species richness of 73 in Kakum National Park [37] and 70 in the Boabeng-Fiama monkey sanctuary [38], and similar to the 171 species in the Tano Offin globally significant biodiversity area (GBSA) [39], as well as the 126 and 133 species found in the natural forest and fallow lands, respectively, within the high forest zone of Ghana [40]. Urban areas are comprised of modified abiotic and biotic environments which create room for species of native and exotic origins, as well as species of different guild compositions, to thrive [41,42]. This explains why the species richness and diversity of Kumasi is comparatively higher than other habitat types.
The overall species richness and Shannon index of 176 and 3.70, respectively, compare favorably well with tree diversity data of other cities in the region. In Abuja, Nigeria, the species richness and Shannon index of 69 and 3.56, respectively, were recently reported [43], while in Lome, Togo, 297 tree species in 141 genera and 48 families were recorded, with 69% of the species being alien [44]. Similarly, within the campus of the Valley View University, near Accra, 108 plant species in 51 families were recorded, of which 89% were native to the thickets of the Accra plains [45]. The high diversity and richness values in Kumasi conform with recent findings that cities in Africa support an extremely high diversity, even when compared to neighboring natural forest [43,44]. The relatively high presence of non-native species may be linked to the city’s culture and history of development. Historically, when Kumasi was designated the “Garden city” of West Africa, several parks and green belts were created for agricultural production, entertainment (sports) for the British imperialists, and the enhancement of environmental quality [46]. In these green belts and parks, exotic vegetable and ornamental species were cultivated to beautify the residential areas and provide fresh food for the European settlers [47]. The inter-city differences in the diversity and composition of woody species may, however, be attributed to the morphology and age of the city, the natural ecological factors, and the building and population densities.
Among green spaces, there were significant differences in species diversity and composition in Kumasi. These differences reflect human management and stratified ecological conditions within the urban landscape. On farmlands and cemeteries, certain species may be selectively preserved because of the desired key services they confer on society. Natural forests and public parks are mostly protected areas, with the latter intended for recreational use. Consequently, these spaces are moderately disturbed and comprise native species such as Triplichiton scleroxylon, Morinda lucida, and a host of others. Vegetation near residential, institutional, and commercial buildings, as well as on streets, was dominated by a mix of species planted for their aesthetic, amenity, and alimentary values. It is worth noting that the top five most common species in the home gardens are all edible (Table 2). These findings agree with other studies which found that Terminalia spp., Gmelina arborea, Tectona grandis, Delonix regia, and Elaeis guineensis species were the most common species in urban areas in the tropical rainforest zone of West Africa [7]. The variations in species composition among the different green space types underscore the multidimensional attribute of the urban forest and its potential to provide multiple products and services to satisfy multiple societal and personal needs. These divergent forces underpinning the composition of the urban forest will have cascading effects on the urban forest structure.
4.2. The Forest Structure and Carbon Storage in Green Spaces of Kumasi
The forest structure is described by its tree density, basal area, and height and DBH class distributions. The mean tree density and basal area of the urban forest of Kumasi somewhat deviated from what is commonly reported for natural and plantation forests around the country. The mean basal area and density of trees in the rain forest of Ghana are 23.8 m2 ha−1 and 487 trees ha−1, respectively [48]. This deviation may be attributed to the assorted conservation or protection of large girthed trees in natural forest relics, cemeteries, public parks, institutional compounds, and farmlands in Kumasi. However, the tree density of Kumasi is similar to the 141 trees acre−1 (348 trees ha−1) in Gainesville, Florida, USA [6]. Basal area and tree density differed among green space types (Table 3). These differences reflect the degree of stress, anthropogenic disturbance, and history of urban development. Whereas natural forest and public parks may be maintained as default establishment of tree species with limited stress and human interference, in green spaces such as home gardens, institutional compounds, streets, and plantations, desired species for specified purposes are usually planted to meet individual and community amenity values. The local government in Kumasi recently launched a project to plant over one million trees along streams and major streets in the city. Trees along streets and near residential areas are more susceptible to stress, hence are more dynamic in population and structure [10].
In many studies, the reverse J-shaped model perfectly describes the structure of the tropical forest in Africa [49,50]. Ecologically, the reverse J-shaped model is ascribed to equal mortality among the various diameter classes. In Kumasi, the diameter class distribution of the trees followed a modified reverse J-shaped curve. Furthermore, while in some green spaces, the actual reverse J-shaped curve applied, in some others, it did not. These trends in Kumasi can be attributed to the complex combination of forest and non-forest tree species in the different green space types, as well as the presence of natural and plantation forest types. The findings in Kumasi are, however, consistent with others which posited that the reverse J-shaped curve is not the only model that describes the forest structure [51].
At a citywide scale, it was found that species richness and diversity decreased with increasing diameter class. This is consistent with the findings in a Madagascar rainforest, which showed that diversity and richness decreased with the increasing girth of trees [52]. The forest structure of Kumasi, to a large extent, is similar to that of neighboring forest, i.e., showing similarities in diameter, height, and basal area distribution. Similarly, the carbon storage in trees increased with increasing diameter class in Kumasi, although large-sized trees were comparatively fewer than small-sized trees. Carbon storage is a function of size (girth), wood density, and height [29,53]. Small-sized trees, therefore, store less carbon compared to large-sized trees. Although evidence from the tropical forest indicates no relationship between diversity and forest carbon storage [54], data in Kumasi seem to show that tree species diversity within diameter classes may be inversely related to carbon storage. The present study did not categorically estimate other climate mitigation services, such as evaporative cooling and shading resulting from urban tree cover, as chronicled in other studies [55,56,57]. Nonetheless, it can be inferred that, given the wide diversity of these broad-leaf tree species in Kumasi, the urban forest would be contributing massively to mitigating heat island effects. The findings highlight the importance of the urban landscape in biodiversity conservation and enhancing ecosystem function at the city, national, and regional scales.
4.3. Implications for Conservation
Some species listed by the IUCN as vulnerable and endangered are recorded in the forest of Kumasi. These include Adansonia digitata, Afzelia africana, Albizia ferruginea, Antiaris toxicaria, Chlorophora excelsa, Entandrophragma spp., Hallea spp., Hymenostegia aubrevillei, Khaya senegalensis, Prosopis africana, Rauwolfia vomitoria, Samanea dinklagei, and Terminalia ivorensis [58]. Eighteen important Ghanaian timber species were also recorded in the city. These include Chlorophora excelsa, Antiaris toxicaria, Entandrophragma spp., Albizia spp., Pycnantus angolensis, Ceiba pentandra, and a host of others. These were mostly in the upper diameter (>60 cm) classes. Only Albizia zygia, Alstonia boonei, and Mammea africana were found in the lower diameter (<20 cm) classes. This is in accordance with studies in cities which concluded that urban green spaces are repositories of biological diversity, of which at least 8% native bird and 25% native plant species are present [59]. Forests in/near urban areas are targeted for conservation because they harbor biodiversity, including IUCN vulnerable and endangered species [60]. Indeed, significant numbers of birds, mammals, reptiles, amphibians and invertebrates have been reported near some urban centers in Ghana [61]. These show that urban green spaces provide habitats for trees and several fauna species.
In Kumasi, the presence of large-sized native tree species in the natural forest, cemeteries, public parks, and farmlands mimics old-growth forests. Old-growth forests are frequently targeted for conservation since they harbor a large proportion of vulnerable species (disturbance sensitive) and species of restricted distribution [49]. In addition, the high abundance of small-sized trees in Kumasi suggest its urban forest, if maintained and managed adequately, can be sustainable. The wide variation in the structural attributes of the urban forest of Kumasi, as well as patch sizes, is fundamental to supporting high biological diversity and hence warrants being conserved. However, considering that urban biodiversity is determined to a large extent by human preferences, high tree diversity may not imply high overall faunal diversity [62]. To enhance the biological diversity of Kumasi and other urban areas further, the following suggestions may be pursued:
- Deliberate efforts to expand the urban forest in Kumasi and indeed across Ghana and Africa ought to be pushed forward. This requires planting and conserving a wide variety of native species as well as well-adapted economically-beneficial exotic species, especially in the HDUZ (core) areas of the city.
- Although invasive species are currently not studied within Kumasi, it is worth noting that some exotic species could potentially be invasive. Therefore, practitioners should judiciously select species when implementing urban afforestation programs.
- Grasslands and farmlands which are commonly found along wetlands in Kumasi could be planted with trees of assorted species mixes and excluded or protected from build-up development. In this regard, a form of urban agroforestry could be practiced, while at the same time helping urbanites adhere to the 100 m no development zones near water bodies in urban areas in Ghana.
- Biodiversity in public parks and wetlands within Kumasi could be further guided and protected by formidable policies. This will perhaps require bye-laws enacted by the metropolitan authorities in conjunction with the communities.
- Considering that home gardens support a high wealth of diversity and are at risk of being cleared for further housing development as and when the economic situation of the land owner permits, it is suggested that clear policy directions be enacted, demanding every parcel of land designated for housing to maintain a certain minimum amount of green cover and tree cover.
- Both in situ and ex situ conservation measures ought to be adopted to conserve indigenous species in these landscapes, especially rare species and/or shade-tolerant species.
- Stakeholders in urban forest (ry) need to explore better ways of making urban biodiversity profitable in order to generate income and enhance environmental sustainability. Examples are adhering to best management practices within no-development zones along waterbodies and using these riverine corridors for tourism to generate income.
5. Conclusions
Urban forestry is emerging as a means to enhance urban environmental sustainability and resilience, especially in developing countries. This study discusses the structure and diversity in relation to carbon storage of the urban forest of Kumasi. The species richness and diversity of the city is similar and sometimes higher than that of other landscapes and national parks within the same ecoregion in the country. Structurally, a modified reverse J-shaped model described the distribution of trees in the city and varied among green space types. The modification was due to the inclusion of palms and non-traditional timber species that are a rudimentary part of the urban forest. It is concluded that the urban forest structure is unique and different from that of other forest types.
While species richness and diversity decreases with increasing diameter class, carbon storage increases with increasing diameter class. The selective preservation of certain species and natural processes in the urban spaces accounts for these trends. Carbon storage is a function of tree size and not necessarily tree density. Hence, a few large trees stored more carbon than a bunch of small trees. These findings provide baseline information about the forest structure and species composition and should be the basis for urban planning decision making regarding green urbanism in Kumasi and other cities in Ghana and Africa.
Integrated and coordinated efforts by the local government, urban planners, traditional leaders, ecologists, and environmentalists, as well as the general public, ought to be harnessed to facilitate adequate conservation and utilization of urban forest towards coping with environmental hazards, minimizing poverty, and increasing food security. Further research could be tailored towards the structure, diversity, and function of urban forest in relation to poverty reduction, food security, and public health. Further research should also emphasize tree compositional and structural relationships with microclimatic regulation and shade benefits within urban landscapes in cities in Africa.
Author Contributions
B.F.N. designed the study, collected the data, and wrote the paper; D.C.-C. and M.D. provided guidance and supervision. All authors reviewed the paper.
Funding
The study was funded by Foundation Fiat Panis, the German Federal Ministry of Economic Corporation via the German Academic Exchange Service (DAAD), and the German Federal Ministry of Education and Research (BMBF) through the BiomassWeb project.
Acknowledgments
I am greatly indebted to the funders of this study. I am equally grateful to numerous persons who assisted in many diverse ways. Many thanks to Jonathan Dabo of CSIR-FORIG, Degan Amissah, formerly of the KNUST Department of Biology and Asare of KNUST Faculty of Pharmacy, for assisting with identification of the flora. To Bertrand Yosangfo, Callistus Nero, and Isaac Boateng, your assistance with vegetation data collection is greatly appreciated. We are grateful to two anonymous reviewers for their useful comments and suggestions.
Conflicts of Interest
Authors declare no conflicts of interest.
References
- Ghana Statistical Service. 2010 Population and Housing Census Final Results Ghana Statistical Service; Ghana Statistical Service: Accra, Ghana, 2012. [Google Scholar]
- United Nations. World Urbanization Prospects; United Nations: New York, NY, USA, 2014. [Google Scholar]
- Nero, B.F. Urban green space dynamics and socio-environmental inequity: Multi-resolution and spatiotemporal data analysis of Kumasi, Ghana. Int. J. Remote Sens. 2017, 38, 6993–7020. [Google Scholar] [CrossRef]
- Nero, B.F. Urban Green Spaces Enhance Carbon Sequestration and Conserve Biodiversity in Cities of the Global South: Case of Kumasi Ghana; University of Bonn: Bonn, Germany, 2017. [Google Scholar]
- Konijnendijk, C.C.; Ricard, R.M.; Kenney, A.; Randrup, T.B. Defining urban forestry—A comparative perspective of North America and Europe. Urban For. Urban Green. 2006, 4, 93–103. [Google Scholar] [CrossRef]
- Escobedo, F.; Seitz, J.A.; Zipperer, W. Gainesville’s Urban Forest Structure and Composition; University of Florida IFAS Extension: Gainesville, FL, USA, 2009; pp. 1–3. [Google Scholar]
- Fuwape, J.A.; Onyekwelu, J.C. Urban Forest Development in West Africa: Benefits and Challenges. J. Biodivers. Ecol. Sci. 2011, 1, 77–94. [Google Scholar]
- Sanders, R.A. Some determinants of urban forest structure. Urban Ecol. 1984, 8, 13–27. [Google Scholar] [CrossRef]
- Mcbride, J.R.; Jacobs, D.F. Urban forest structure: A key to urban forest planning. Calif. Agric. 1979, 33, 24. [Google Scholar]
- Sæbø, A.; Benedikz, T.; Randrup, T.B. Selection of trees for urban forestry in the Nordic countries. Urban For. Urban Green. 2003, 2, 101–114. [Google Scholar] [CrossRef]
- Buckelew Cumming, A.; Nowak, D.J.; Twardus, D.B.; Hoehn, R.E.; Mielke, M.; Rideout, R. The Urban Forest of Wisconsin 2002—Pilot Monitoring Project 2002; United States Forest Service: Washington, DC, USA, 2007. [Google Scholar]
- Escobedo, F.J.; Nowak, D.J.; Wagner, J.E.; Luz de la Maza, C.; Rodriguez, M. The socioeconomics and management of Santiago de Chile urban forest. Urban For. Urban Green. 2006, 4, 105–114. [Google Scholar] [CrossRef]
- Nowak, D.J.; Crane, D.E.; Stevens, J.C.; Hoehn, R.E.; Walton, J.T.; Bond, J. A Ground-Based Method of Assessing Urban Forest Structure and Ecosystem Services. Aboric. Urban. For. 2008, 34, 347–358. [Google Scholar]
- Nowak, D.J.; Crane, D.E. Carbon storage and sequestration by urban trees in the USA. Environ. Pollut. 2002, 116, 381–389. [Google Scholar] [CrossRef]
- Nielsen, A.B.; Östberg, J.; Delshammar, T. Review of urban tree inventory methods used to collect data at single-tree level. Arboric. Urban. For. 2014, 40, 96–111. [Google Scholar]
- Alonzo, M.; Mcfadden, J.P.; Nowak, D.J.; Roberts, D.A. Mapping urban forest structure and function using hyperspectral imagery and lidar data. Urban For. Urban Green. 2016, 17, 135–147. [Google Scholar] [CrossRef] [Green Version]
- Davies, Z.G.; Edmondson, J.L.; Heinemeyer, A.; Leake, J.R.; Gaston, K.J. Mapping an urban ecosystem service: Quantifying above-ground carbon storage at a city-wide scale. J. Appl. Ecol. 2011, 48, 1125–1134. [Google Scholar] [CrossRef]
- Kim, G. Assessing Urban Forest Structure, Ecosystem Services, and Economic Benefits on Vacant Land. Sustainability 2016, 8, 679. [Google Scholar] [CrossRef]
- Schreyer, J.; Tigges, J.; Lakes, T.; Churkina, G. Using airborne LiDAR and QuickBird data for modelling urban tree carbon storage and its distribution—A case study of Berlin. Remote Sens. 2014, 6, 10636–10655. [Google Scholar] [CrossRef]
- Food and Agriculture Organization of the United Nations (FAO). Urban and Peri-Urban Forestry in Africa: The Outlook for Woodfuel; FAO: Rome, Italy, 2012. [Google Scholar]
- Department for International Development (DFID). Forest Inventory Project, Ghana; DFID: London, UK, 2004. [Google Scholar]
- Treue, T. National Forest Inventory Continued (1989–1997). In Politics and Economics of Tropical High Forest Management; Kluwer Academic Publishers: South Holland, The Netherlands, 2001; pp. 37–38. [Google Scholar]
- Owusu, K. Changing Rainfall Climatology of West Africa: Implications for Rainfed Agriculture in Ghana and Water Sharing in the Volta Basin; University of Florida: Gainesville, FL, USA, 2009. [Google Scholar]
- Manu, A.; Twumasi, Y.A.; Coleman, T.L. Is It the Result of Global Warming or Urbanization? The Rise in Air Temperature in Two Cities in Ghana. In Proceedings of the 5th FIG Regional Conference, Accra, Ghana, 8–11 March 2006. [Google Scholar]
- Kumasi Metropolitan Assembly (KMA). The Composite Budget of the Kumasi Metropolitan Assembly (KMA) for the 2013 Fiscal Year; KMA: Kumasi, Ghana, 2013. [Google Scholar]
- Adarkwa, K.K. The role of Kumasi in national development—Kumasi as a central place. In Future of the Tree: Towards Growth and Development of Kumasi; Adarkwa, K.K., Ed.; University Printing Press: Kumasi, Ghana, 2011; pp. 14–34. [Google Scholar]
- Hawthorne, W.; Gyakari, N. Photoguide for the Forest Trees of Ghana; Trees Spotters’s Field Guide for Identifying the Largest Trees; Oxford Forestry Institute: Oxford, UK, 2006. [Google Scholar]
- Oteng-Amoako, A.A. 100 Tropical African Timber Trees from Ghana: Tree Description and Wood Identification with Notes on Distribution, Ecology, Silviculture, Ethnobotany, and Wood Uses; Forest Research Institute of Ghana: Kumasi, Ghana, 2002. [Google Scholar]
- Chave, J.; Réjou-Méchain, M.; Búrquez, A.; Chidumayo, E.; Colgan, M.S.; Delitti, W.B.C.; Duque, A.; Eid, T.; Fearnside, P.M.; Goodman, R.C.; et al. Improved allometric models to estimate the aboveground biomass of tropical trees. Glob. Chang. Biol. 2014, 20, 3177–3190. [Google Scholar] [CrossRef] [PubMed]
- Food and Agriculutre Organization of the United Nations (FAO). Estimating Biomass and Biomass Change of Tropical Forests; FAO: Rome, Italy, 1997. [Google Scholar]
- Orwa, S.; Mutua, A.; Kindt, R.; Jamnadass, R.H.; Simons, A. Agroforestree Database: A Tree Reference and Selection Guide, Version 4.0; World Agroforestry Center: Nairobi, Kenya, 2009. [Google Scholar]
- Martin, A.R.; Thomas, S.C. A reassessment of carbon content in tropical trees. PLoS ONE 2011, 6. [Google Scholar] [CrossRef] [PubMed]
- Chao, A.; Chazdon, R.L.; Colwell, R.K.; Shen, T.J. Abundance-based similarity indices and their estimation when there are unseen species in samples. Biometrics 2006, 62, 361–371. [Google Scholar] [CrossRef] [PubMed]
- Chao, A.; Chazdon, R.L.; Shen, T.J. A new statistical approach for assessing similarity of species composition with incidence and abundance data. Ecol. Lett. 2005, 8, 148–159. [Google Scholar] [CrossRef]
- Koleff, P.; Gaston, K.J.; Lennon, J.J. Measuring Beta Diversity for Presence-Absence Data. J. Anim. Ecol. 2003, 72, 367–382. [Google Scholar] [CrossRef]
- Konijnendijk, C.C.; Gauthier, M. Urban Forestry for Multifunctional Urban Land Use; RUAF Foundation: Leusden, The Netherlands, 2014. [Google Scholar]
- Pappoe, A.N.M.; Armah, F.A.; Quaye, E.C.; Kwakye, P.K.; Buxton, G.N.T. Composition and stand structure of a tropical moist semi-deciduous forest in Ghana. Plant Sci. 2010, 1, 95–106. [Google Scholar]
- Kankam, B.O.; Saj, L.; Sicotte, P. Short-term variation in forest dynamics: Increase in tree diversity in Boabeng-Fiama, monkey sanctuay, Ghana. Ghana J. For. 2013, 29, 19–33. [Google Scholar]
- Enninful, R. Assessment of Floral Compostion, Structure and Natural Regeneration of the Tano Offin Globally Significant Biodiversity Area; Kwame Nkrumah University of Science and Technology: Kumasi, Ghana, 2013. [Google Scholar]
- Anglaaere, L.C.N.; Cobbina, J.; Sinclair, F.L.; McDonald, M.A. The effect of land use systems on tree diversity: Farmer preference and species composition of cocoa-based agroecosystems in Ghana. Agrofor. Syst. 2011, 81, 249–265. [Google Scholar] [CrossRef]
- McKinney, M.L. Urbanization as a major cause of biotic homogenization. Biol. Conserv. 2006, 127, 247–260. [Google Scholar] [CrossRef]
- McKinney, M.L. Effect of urbanization on species richness: A review of plants and animals. Urban Ecosyst. 2008, 11, 161–176. [Google Scholar] [CrossRef]
- Agbelade, A.D.; Onyekwelu, J.C.; Oyun, M.B. Tree Species Richness, Diversity, and Vegetation Index for Federal Capital Territory, Abuja, Nigeria. Int. J. For. Res. 2017, 2017. [Google Scholar] [CrossRef]
- Raoufou, R.; Kouami, K.; Koffi, A. Woody plant species used in urban forestry in West Africa: Case study in Lomé, capital town of Togo. J. Hortic. For. 2011, 3, 21–31. [Google Scholar]
- Simmering, D.; Addai, S.; Geller, G.; Otte, A. A university campus in peri-urban Accra (Ghana) as a haven for dry-forest species. Flora Veg. Sudano-Sambesica 2013, 16, 10–21. [Google Scholar]
- Quagraine, V.K. Urban landscape depletion in the Kumasi Metropolis. In Future of the Tree: Towards Growth and Development of Kumasi; Adarkwa, K.K., Ed.; University Printing Press: Kumasi, Ghana, 2011; pp. 212–233. [Google Scholar]
- Asomani-Boateng, R. Urban Cultivation In Accra: An Examination of The Nature, Practices, Problems, Potentials And Urban Planning Implications. Habitat Int. 2002, 26, 591–607. [Google Scholar] [CrossRef]
- Hall, J.B.; Swaine, M.D. Classification and Ecology of Closed-Canopy. J. Ecol. 1976, 64, 913–951. [Google Scholar] [CrossRef]
- Fayolle, A.; Swaine, M.D.; Bastin, J.-F.; Bourland, N.; Comiskey, J.; Dauby, G.; Doucet, J.-L.; Gillet, J.-F.; Gourlet-Fleury, H.S.; Kirunda, O.J.B.; et al. Patterns of tree species composition across tropical African forests. J. Biogeogr. 2014, 41, 2320–2331. [Google Scholar] [CrossRef]
- Kacholi, D.S. Analysis of Structure and Diversity of the Kilengwe Forest in the Morogoro Region, Tanzania. Int. J. Biodivers. 2014, 2014. [Google Scholar] [CrossRef]
- Westphal, C.; Tremer, N.; Von Oheimb, G.; Hansen, J.; Von Gadow, K.; Ha, W. Is the reverse J-shaped diameter distribution universally applicable in European virgin beech forests? For. Ecol. Manag. 2006, 223, 75–83. [Google Scholar] [CrossRef]
- Armstrong, A.H.; Shugart, H.H.; Temilola, E. Characterization of community composition and forest structure in a Madagascar lowland rainforest. Trop. Conserv. Sci. 2011, 4, 428–444. [Google Scholar] [CrossRef]
- Chave, J.; Andalo, C.; Brown, S.; Cairns, M.; Chambers, J.Q.; Eamus, D.; Fölster, H.; Fromard, F.; Higuchi, N.; Kira, T.; et al. Tree allometry and improved estimation of carbon stocks and balance in tropical forests. Oecologia 2005, 145, 87–99. [Google Scholar] [CrossRef] [PubMed]
- Sullivan, M.J.P.; Talbot, J.; Lewis, S.L.; Phillips, O.L.; Qie, L.; Begne, S.K.; Chave, J.; Cuni-Sanchez, A.; Hubau, W.; Lopez, G.; et al. Diversity and carbon storage across the tropical forest biome. Sci. Rep. 2017, 7. [Google Scholar] [CrossRef] [PubMed]
- Rahman, M.A.; Moser, A.; Gold, A.; Rötzer, T.; Pauleit, S. Vertical air temperature gradients under the shade of two contrasting urban tree species during different types of summer days. Sci. Total Environ. 2018, 633, 100–111. [Google Scholar] [CrossRef] [PubMed]
- Rahman, M.A.; Armson, D.; Ennos, A.R. A comparison of the growth and cooling effectiveness of five commonly planted urban tree species. Urban Ecosyst. 2015, 18, 371–389. [Google Scholar] [CrossRef]
- Moser, A.; Rahman, M.A.; Pretzsch, H.; Pauleit, S.; Rötzer, T. Inter- and intraannual growth patterns of urban small-leaved lime (Tilia cordata mill.) at two public squares with contrasting microclimatic conditions. Int. J. Biometeorol. 2017, 61, 1095–1107. [Google Scholar] [CrossRef] [PubMed]
- International Union for Conservation of Nature (IUCN). IUCN Red Lists of Threatened Species; IUCN: Gland, Switzerland, 2013. [Google Scholar]
- Aronson, M.F.J.; La Sorte, F.A.; Nilon, C.H.; Katti, M.; Goddard, M.A.; Lepczyk, C.A.; Warren, P.S.N.; Williams, S.G.; Cilliers, S.; Clarkson, B.; et al. A global analysis of the impacts of urbanization on bird and plant diversity reveals key anthropogenic drivers. Proc. R. Soc. B Biol. Sci. 2014, 281. [Google Scholar] [CrossRef] [PubMed]
- Bulafu, C.; Baranga, D.; Mucunguzi, P.; Telford, R.J.; Vandvik, V. Massive structural and compositional changes over two decades in forest fragments near Kampala, Uganda. Ecol. Evol. 2013, 31, 3804–3823. [Google Scholar] [CrossRef] [PubMed]
- Deikumah, J.P.; Kudom, A.A. Biodiversity Status of Urban Remnant Forests in Cape Coast, Ghana. J. Sci. Technol. 2010, 30, 1–8. [Google Scholar] [CrossRef]
- Faeth, S.H.; Bang, C.; Saari, S. Urban biodiversity: Patterns and mechanisms. Ann. N. Y. Acad. Sci. 2011, 1223, 69–81. [Google Scholar] [CrossRef] [PubMed]
Figure 1.
Urban green space map of Kumasi showing the two urban zones. HDUZ—high density urban zone and LDUZ—low density urban zone.
Figure 1.
Urban green space map of Kumasi showing the two urban zones. HDUZ—high density urban zone and LDUZ—low density urban zone.

Figure 2.
Rarefaction curves of woody species among green spaces in Kumasi. IC = Institutional compound, HG = home garden.
Figure 2.
Rarefaction curves of woody species among green spaces in Kumasi. IC = Institutional compound, HG = home garden.

Figure 3.
Output of correspondence analysis for the tree species in different green spaces (GS) in Kumasi metropolis. Dimension 1 represents green spaces while dimension 2 represents plant species. Chi-square = 11,169.8, Degrees of freedom = 2624. Species names include: AL, Albizia lebbeck; ASe, Acasia senegale; ASo, Acalypha sonderina; AD, Adansonia digita; AdP, Adenanthera pavonina; AfA, Afzelia africana; AF, Albizia ferruginea; AA, A. adianthifolia; AZ, A. zygia; AiC, Alchornea cordifolia; AlP, Allanblackia parviflora; AB, Alstonia boonei; AP, Amphimas pterocarpoides; AO, Anacardium occidentale; AM, Annona muricata; AS, A. squamosal; AnA, Antiaris africana; AT, A. toxicaria; AC, Araucaria columnaris; AI, Artocarpus incisis; AzI Azadirachta indica; AN, Anthocleista vogelii; AV, A. nobilis; Bamboo, Bambusa vulgaris; BN, Baphia nitida; BaS, Baphia spp.; BT, Bauhinia tomentosa; BS, Blighia sapida; BB, Bombax buonopozense; CaC, Callitris cupressiformis; CaP, Calotropis procera; CO, Cananga odorata; CP, Carapa procera; CaN, Cassia nodiflora; C. siamea; CE, Casuarina equisetifolia; CeP, Cecropia peltata; CeO, Cedrela odorata; Ceiba, Ceiba pentandra; CM, Celtis mildbraedii; CEx, Chlorophora excelsa; CZ, Cinnamomum zeylanicum; CL, Citrus limon; CN, C. nobilis; CS, C. sinensis; ClP, Cleistopholis patens; CF, Cnestis ferruginea; CoN, Cocos nucifera; CV, Codiaeum variegatum; CG, Cola gigantea; CoM, C. millenii; CNi, C. nitida, CA, C. acuminata; CMi, Cordia millenii; Cot, Gossypium spp; CC, Crescentea cujete; DO, Daniella ogea; DR, Delonix regia; DE, Duranta erecta; DG, Dialium guineense; DB, Distemonanthus benthamianus; DM, Duboscia macrocarpa; EG, Elaeis guineensis; FEx, Ficus exasperata; FSpp, Ficus spp.; FU, F. umbellata; FE, Funtumia elastica; GM, Garcinia mangostana; GlS, Gliricidia sepium; GA, Gmelina arborea; HL, Hallea ledermannii, HS, H. stipulosa; HB, Hevea brasiliensis; HiB, Hildegardia barteri; HF, Holarrhena floribunda; HyA, Hymenostegia afzelii; HA, Hymenostegia aubrevillei; JC, Jatropha curcas, KC, Khaya cordifolia; KS, K. senegalensis; LS, Lagerstroemia speciose; LaS, Lannea schimperi; LW, L. welwitschii; L_Spp, Livingstonia spp; MB, Macaranga barteri; MH, M. heudelotii; ME, Maesopsis eminii; MA, Mammea africana; Mangifera indica; MD, Margaritaria discoidea; MC, Michelia champaca; MT, Millettia thonningii; MH, Millingtonia hortensis; MM, Monodora myristica; ML, Morinda lucida; MO, Moringa oleifera; MoM, Morus mesozygia; MyA, Myrianthus arboreus; NL, Nauclea latifolia; New_L, Newbouldia lavis; OS, Oncoba spinosa; PB, Parkia biglobosa; PaS, Parkinsonia speciosa; PP, Pelthophorum pterocarpum; PA, Persea americana; PC, Pinus caribaea; Pip_A, Piptadeniastrum africanum; PD, Pithecellobium dulce; PS, P. saman; PlA, Plumera alba; PL, Polyalthia longifolia; PO, P. oliveri; Pro_A, Prosopis africana; PM, Pseudospondias mombin; PG, Psidium guajava; PsS, Psydrax subcordata; PH, Pteleopsis hylodendron; PyA, Pycnanthus angolensis; RV, Rauwolfia vomitoria; RL, Rothmannia longiflora; SD, Samanea dinklagei; SE, Solanum erianthum; SC, Spathodea campanulata; SM, Spondias mombin; SS, Sterculia spp.; TI, Tamarindus indica; Tectona, Tectona grandis; TeI, Terminalia ivorensis; TM, T. montalis; TeC, T. catappa; TS, T. superba; TA, T. angolensis; TT, Tetrapleura tetraptera; ThC, Theobroma cacao; TO, Thuja orientalis; TH, Trichilia heudelotii; Trip_S, Triplochiton scleroxylon; VA, Vernonia amygdalina; VoA, Voacanga africana. GS type; Owabi_NF = Natural forest, HG = Home garden, IC = Institutional compound.

Figure 4.
A unimodal distribution of the number of trees and number of species within Kumasi, Ghana.
Figure 4.
A unimodal distribution of the number of trees and number of species within Kumasi, Ghana.

Figure 5.
The abundance and mean total height of trees in different diameter at breast height (DBH) classes among green spaces of Kumasi, Ghana.
Figure 5.
The abundance and mean total height of trees in different diameter at breast height (DBH) classes among green spaces of Kumasi, Ghana.

Figure 6.
The species richness and proportion of native species in the urban zones in Kumasi. 1 HDUZ—high density urban zone, LDUZ—low density urban zone and natural forest (Owabi sanctuary).
Figure 6.
The species richness and proportion of native species in the urban zones in Kumasi. 1 HDUZ—high density urban zone, LDUZ—low density urban zone and natural forest (Owabi sanctuary).

Figure 7.
The total carbon stored and carbon stock densities for the different diameter classes in the urban forest of Kumasi.
Figure 7.
The total carbon stored and carbon stock densities for the different diameter classes in the urban forest of Kumasi.


Table 1.
Tree species abundance, richness, and diversity indices in different green space types within Kumasi. Chi-square analysis of richness indicates significant differences (p < 0.0001, n = 8, X2 = 139.4).
Table 1.
Tree species abundance, richness, and diversity indices in different green space types within Kumasi. Chi-square analysis of richness indicates significant differences (p < 0.0001, n = 8, X2 = 139.4).
| Greenspace Type | Number of Individuals | Observed Richness, S | Estimated Chao1, Sest | Shannon H | Simpson 1-D | Pielou J (Evenness) |
|---|---|---|---|---|---|---|
| Plantation | 630 | 48 | 73.6 | 2.561 | 0.854 | 0.66 |
| Natural forest | 980 | 96 | 105 | 3.840 | 0.969 | 0.84 |
| Home garden | 1095 | 80 | 98.6 | 3.158 | 0.919 | 0.72 |
| Institutional Compound | 715 | 79 | 101.3 | 3.502 | 0.951 | 0.80 |
| Farm | 100 | 23 | 47.0 | 2.269 | 0.821 | 0.72 |
| Cemetery | 266 | 51 | 81.3 | 3.242 | 0.935 | 0.82 |
| Street | 565 | 37 | 57.2 | 2.809 | 0.903 | 0.78 |
| Public park | 334 | 75 | 127.7 | 3.521 | 0.952 | 0.82 |
| Grassland | 39 | 6 | 8.3 | 0.749 | 0.328 | 0.42 |
| Total | 3757 | 176 | 222.4 | 3.716 | 0.956 | 0.72 |
Table 2.
Top five most common (abundant) species in each green space type in Kumasi.
| UGS | Species |
|---|---|
| Home garden | Oil palm—Elaeis guineensis Jacq., Mango—Mangifera indica L., Pear—Persea americana Mill., Orange—Citrus sinensis (L) Osbeck, Coconut—Cocos nucifera L. |
| Street | Cassia—Cassia siamea Lam., Copper pod tree—Peltophorum pterocarpum (DC.) Backer ex K. Heyne, Cedrela—Cedrela odorata L., Indian almond—Terminalia catappa L., Flamboyant- Delonix regia (Bojer ex Hook). |
| Plantation | Teak—Tectona grandis L. f., Cocoa—Theobroma cacao L., Cassia siamea, Elaeis guineensis, White teak—Gmelina arborea (Roxb) |
| Institutional compound | Cassia siamea, Millettia thonningii (Schumach.) Baker, Weeping willow—Polyalthia longifolia (Sonn.) Thwaites, Elaeis guineensis, Casuarina equisetifolia L. |
| Cemetery | Elaeis guineensis, Brimstone tree—Morinda lucida (Benth.), Cassia siamea, Mangifera indica, Quickstick-Gliricidia sepium (Jacq.) Kunth ex Walp. |
| Public park | Cassia siamea, Elaeis guineensis, Millettia thonningii, Pelthophorum pterocarpum, Delonix regia |
| Farmland | Elaeis guineensis, Morinda lucida, Mangifera indica, African tulip—Spathodea campanulata P. Beauv, Kapok tree—Ceiba pentandra (L.) Gaertn. |
| Grassland | Ceiba pentandra, Pithecellobium dulce (Roxb.) Benth., Cedrela odorata, Mangifera indica, Morinda lucida |
| Natural forest | Cedrela odorata, Elaeis guineensis, Wawa—Triplochiton scleroxylon K. Schum., Funtumia elastic (Preuss) Stapf, Trichilia monodelpha (Thonn.) J. de Wilde |
Table 3.
The structural attributes of the urban forest in Kumasi. Numbers in the same column followed by the same letter are not significantly different at p = 0.05.
Table 3.
The structural attributes of the urban forest in Kumasi. Numbers in the same column followed by the same letter are not significantly different at p = 0.05.
| UGS | Tree Density No. ha−1 | DBH cm | Height m | BA m2 ha−1 | H:DBH m/cm |
|---|---|---|---|---|---|
| Streets | 44.1ab | 15.2bc | 0.34 | ||
| Cemeteries | 261cd | 44.0ab | 13.2cde | 83.8a | 0.30 |
| Farmlands | 175d | 45.5ab | 11.4de | 38.6c | 0.25 |
| Grasslands | 200d | 33.0cd | 12.9cde | 23.4c | 0.39 |
| Home gardens | 240d | 27.1cd | 10.0e | 24.0c | 0.37 |
| Institutional compounds | 321c | 35.3bc | 13.6cd | 71.3ab | 0.39 |
| Natural forest | 246d | 47.5a | 44.5a | 83.5a | 0.94 |
| Plantations | 825a | 23.2d | 14.4bcd | 65.0b | 0.62 |
| Public parks | 484b | 35.6bc | 17.1b | 84.9a | 0.48 |
| Mean | 377 | 33.3 | 13.0 | 55.6 | 0.39 |
| Least Square Difference | 10.6 | 3.5 |
Table 4.
Similarity (Jaccard and Sørenson indices) in species composition among urban zones in Kumasi. Values close to one indicate high similarity and close to zero indicate high dissimilarity. Bootstrap 95% confidence intervals are also shown.
Table 4.
Similarity (Jaccard and Sørenson indices) in species composition among urban zones in Kumasi. Values close to one indicate high similarity and close to zero indicate high dissimilarity. Bootstrap 95% confidence intervals are also shown.
| Urban Zone | Shared Species | Jaccard Index | Sørenson λ Index | ||||
|---|---|---|---|---|---|---|---|
| 95% LL | 95% UL | 95% LL | 95% UL | ||||
| HDUZ–LDUZ | 74 | 0.897 | 0.559 | 2.230 | 0.946 | 0.717 | 1.380 |
| LDUZ–NF 1 | 45 | 0.520 | 0.218 | 1.204 | 0.684 | 0.358 | 1.092 |
| HDUZ–NF | 27 | 0.312 | 0.135 | 0.605 | 0.476 | 0.239 | 0.754 |
1 NF = Natural forest, HDUZ = high density urban zone, LDUZ = low density urban zone. λ LL = Lower limit, UL = Upper limit.
© 2018 by the authors. Licensee MDPI, Basel, Switzerland. This article is an open access article distributed under the terms and conditions of the Creative Commons Attribution (CC BY) license (http://creativecommons.org/licenses/by/4.0/).
Share and Cite
MDPI and ACS Style
Nero, B.F.; Callo-Concha, D.; Denich, M. Structure, Diversity, and Carbon Stocks of the Tree Community of Kumasi, Ghana. Forests 2018, 9, 519. https://doi.org/10.3390/f9090519
AMA Style
Nero BF, Callo-Concha D, Denich M. Structure, Diversity, and Carbon Stocks of the Tree Community of Kumasi, Ghana. Forests. 2018; 9(9):519. https://doi.org/10.3390/f9090519
Chicago/Turabian StyleNero, Bertrand Festus, Daniel Callo-Concha, and Manfred Denich. 2018. "Structure, Diversity, and Carbon Stocks of the Tree Community of Kumasi, Ghana" Forests 9, no. 9: 519. https://doi.org/10.3390/f9090519
Note that from the first issue of 2016, this journal uses article numbers instead of page numbers. See further details here.