Quantitative Assessment of Surface Runoff and Base Flow Response to Multiple Factors in Pengchongjian Small Watershed
by
 ,
,
Lei Ouyang
1,2 ,
,
Shiyu Liu
1,2,*,
Jingping Ye
1,2,
Zheng Liu
1,2,
Fei Sheng
1,2,
Rong Wang
1 and
Zhihong Lu
1 1
School of Land Resources and Environment, Jiangxi Agricultural University, Nanchang 330045, China
2
Key Laboratory of Poyang Lake Watershed Agricultural Resources and Ecology of Jiangxi Province, Nanchang 330045, China
*
Author to whom correspondence should be addressed.
Forests 2018, 9(9), 553; https://doi.org/10.3390/f9090553
Submission received: 22 July 2018
/
Revised: 5 September 2018
/
Accepted: 6 September 2018
/
Published: 10 September 2018
(This article belongs to the Special Issue Afforestation and Reforestation: Drivers, Dynamics, and Impacts)
Abstract
:Quantifying the impacts of multiple factors on surface runoff and base flow is essential for understanding the mechanism of hydrological response and local water resources management as well as preventing floods and droughts. Despite previous studies on quantitative impacts of multiple factors on runoff, there is still a need for assessment of the influence of these factors on both surface runoff and base flow in different temporal scales at the watershed level. The main objective of this paper was to quantify the influence of precipitation variation, evapotranspiration (ET) and vegetation restoration on surface runoff and base flow using empirical statistics and slope change ratio of cumulative quantities (SCRCQ) methods in Pengchongjian small watershed (116°25′48″–116°27′7″ E, 29°31′44″–29°32′56″ N, 2.9 km2), China. The results indicated that, the contribution rates of precipitation variation, ET and vegetation restoration to surface runoff were 42.1%, 28.5%, 29.4% in spring; 45.0%, 37.1%, 17.9% in summer; 30.1%, 29.4%, 40.5% in autumn; 16.7%, 35.1%, 48.2% in winter; and 35.0%, 38.7%, 26.3% in annual scale, respectively. For base flow they were 33.1%, 41.9%, 25.0% in spring; 39.3%, 51.9%, 8.8% in summer; 40.2%, 38.2%, 21.6% in autumn; 24.3%, 39.4%, 36.3% in winter; and 24.4%, 47.9%, 27.7% in annual scale, respectively. Overall, climatic factors, including precipitation and ET change, affect surface runoff generation the most, while ET affects the dynamic change of annual base flowthe most. This study highlights the importance of optimizing forest management to protect the water resource.
1. Introduction
At present, runoff is generally divided into two parts: surface runoff and base flow [1,2,3]. During a rainfall process in a basin, the flow duration curve formed at the outlet of a watershed consists of surface runoff and base flow (Figure 1) [4]. There are many quantitative studies on the effects of precipitation variation and vegetation restoration on surface runoff [5,6,7,8,9,10,11]. Distinct hydrological effects based on different time scales were reported [12]. For instance, Chaplot investigated water and soil resources response to changes in precipitation and air temperature in Iowa (USA), pointing to a considerable effect of precipitation changes with a 170% runoff increase as precipitation increases by 40% [11], while Zhang and Nearing predicted that decreasing precipitation by 7–14% would result in greater runoff (67–82%) [13]. The above two results showed the opposite effects on runoff caused by precipitation, which is mainly due to different topography, forest change, soil condition, temperature as well as other factors like NO3–N loads [9]. Zhang conducted research over Poyang Lake basin and found that contributions of climate change and human activities to streamflow changes were 73.2% and 26.8%, respectively. However, human-induced and climate-induced influences on streamflow were different in different river basins [14]. Similarly, Gu demonstrated that human activities accounted for a low portion (5.5%) in the runoff inputs in Poyang Lake [15]. Interestingly, however, the decrease of streamflow in the Fuhe River (sub-catchment of Poyang Lake) in 2000s was mainly affected by human activities (156.9%), rather than climate change [6]. More recently, Rogger et al. reviewed research gaps in the field of land-use change impacts on floods at the catchment scale [16]. They proposed that land-use change impacts on floods are poorly understood at the catchment scale at present, then suggested possible ways forward for addressing these gaps. Despite numerous works, most research focused on calculating surface runoff in annual scale [8,17,18], but little attention was paid to the seasonal scale. However, a study on the effects of precipitation and evapotranspiration (ET) variation, vegetation restoration on the seasonal surface runoff is of great significance for rationally allocating water resources yearly, especially for watersheds with seasonal droughts. Thus, it is still necessary to further study the influences of precipitation and ET variation, vegetation restoration on seasonal surface runoff.
Base flow is a relatively stable part of streamflow. Base flow studies are not only helpful for reasonable regulation of water quantity and high-efficiency utilization of water resources, but also beneficial for hydrological analysis, evaluation and the management of water resources [19,20]. At present, studies on base flow mainly focus on regression models, improvement of base flow separation methods and influencing factors. The studies of base flow in China began in the 1960s, and mainly dealt with qualitative analysis of base flow evolution principles and its driving factors, base flow separation and estimation. Nonetheless, quantitative studies on the contribution rates of different factors to base flow are rarely reported.
Consequently, with the support of the National Natural Science Foundation of China, taking Pengchongjian small watershed with rich precipitation as a study area, we quantitatively assessed the impacts of multiple factors on both surface runoff and base flow (Figure 2). This study could help to understand how precipitation variation, ET and vegetation restoration affect runoff, and provide scientific foundations for the sustainable utilization of water resources and the evaluation of hydrological benefits for natural forest protection and afforestation projects.
2. Study Area and Methods
2.1. Study Area
Pengchongjian small watershed is located between 116°25′48″–116°27′7″ E and 29°31′44″–29°32′56″ N in Duchang County, Jiujiang City, Jiangxi Province, covering a catchment area of 2.90 km2 (Figure 3). It is high in the north-west and low in the south-east, whose altitude ranges from 80 to 560 meters, belonging to subtropical humid monsoon climate zone with average annual precipitation of 1560 mm. Major exposure strata here are epimetamorphic rock, granite and limestone. Moreover, the watershed is rich in vegetation types, with stand types of 70% Cunninghamia lanceolata (Lamb.) Hook., 20% Quercus acutissima Carruth. and 2% Phyllostachys heterocycla (Carr.) Mitford cv. Pubescens. The watershed is completely closed as there are no inhabitants, water conservancy facilities or soil and water conservation projects. Yet the China fir forest suffered from deforestation in early 1980s, after which the secondary forest has been recovering, which provides an ideal study area for this study. According to the investigating data of forest resources by Wushan forest farm in Duchang County, forest coverage increased from 80% in 1985 to 98% in 2016, and forest stocking volume rose from 1.2 × 10⁴ m3 in 1985 to 2.5 × 10⁴ m3 in 2016. In 1981, a hydrological station was built up at the outlet of the watershed by Jiangxi Province Bureau, and the precipitation and surface runoff have been continuously monitored till now.
2.2. Methods
2.2.1. Data
Data used in this paper include daily precipitation, surface runoff and daily mean temperature at Pengchongjian hydrological station from 1983 to 2014, which was supplied by Jiangxi Province Hydrology Bureau. Base flow were separated from daily surface runoff datasets using the Kalinlin improving method [21]. Seasonal and annual precipitation, surface runoff and base flow during these 30 years were then calculated based on daily statistical data for subsequent trend analysis. Meanwhile, based on the water balance equation in a totally closed small watershed, mean ET is basically equal to mean precipitation minus mean surface runoff.
2.2.2. Trend Analysis
The Mann–Kendall test (MK) is a suitable method to determine the variation trend of hydrological time series [22,23], which has been widely applied for trend and inflection analysis of precipitation and runoff [24,25]. Thus, in this paper, we found a consistent inflection point of the year 2003 both for precipitation and surface runoff. The research period was the divided into baseline period (1983–2003) and changing period (2004–2014), which lays a solid foundation for separating the impacts of multiple factors on surface runoff and base flow in different time scales. The calculation procedures of an MK trend test are given as follows.
For a time series {r1, r2, …, rn−1, rn}, the statistic index UFm is calculated as,
where Sm is deemed as cumulative number of ri > rj (1 ≤ i ≤ j), E(Sm) is averaged Sm, and Var(Sm) represents variance of Sm. The change of UFm reflects the variation in hyro-climate variables. UFm > 0 (<0) means the variables show an increasing (a decreasing) trend. If |UFm| > 1.64, 1.96, 2.58, the change trend is significant at p > 0.1, 0.05 and 0.01, respectively. Contrarily, the value calculated with inverse series (rn, rn−1, …, r2, r1) is termed as UBm. If the exact intersection point of the two lines located within the critical limit line and the trend is significance, the point is deemed as the possible change point [22].
2.2.3. Separating the Effect of ET on Surface Runoff and Base Flow
The slope change ratio of cumulative quantities (SCRCQ) method was proposed to quantitatively assess the factors impacting the streamflow in the Huangfuchuan River Basin, a first-level tributary of the middle reaches of the Yellow River. It is believed that this method can be applied to the quantitative assessment of river runoff changes and its influencing factors in arid and semi-arid regions [26]. Subsequently, similar research on Songhua River basin [27], Miyun Reservoir watershed [28] and some areas of the southern humid areas such as the Yinjiang River watershed [29], Dongting Lake catchment [30], and Ning Jiang River basin [31] had been carried out in China. The cumulative quantities can eliminate the effects of inter-annual fluctuations to some extent, with a high correlation coefficient between year and cumulative quantities, which creates conditions for quantifying analysis [26]. Therefore, using the method of SCRCQ, we calculated the contribution rates of ET to surface runoff and base flow in seasonal and annual scale. Calculation equations are as follows:
where K (mm·year−1) is the slope of the linear relationship between year and cumulative ET in baseline period (labeled by 1) and changing period (labeled by 2), cumulative surface runoff or base flow in baseline period (labeled by 3) and changing period (labeled by 4). CET is the relative contribution rate of ET to surface runoff or base flow. According to the water balance equation in a relatively closed watershed, the change in soil water storage is likely to be small, which is negligible in annual scale [26,28]. Thus, the contribution rates of precipitation variation and vegetation restoration to surface runoff and base flow is equal to 1 − CET.
2.2.4. Excluding the Contribution Rates of Precipitation Variation and Vegetation Restoration
The formation of surface runoff is mainly affected by precipitation and underlying surface conditions. For the same small watershed with no inhabitants and water and soil conservancy projects, underlying surface change can be mainly regarded as vegetation restoration. In this paper, empirical statistics was used to quantitatively assess the two factors (precipitation variation and vegetation restoration) that have significant influence on surface runoff as well as base flow.
Firstly, regression analyses were conducted between observed precipitation, surface runoff and base flow in baseline period when vegetation was less changed, after which a linear Equation (1) could be built. Then, substituting observed mean precipitation in the changing period, when vegetation changes apparently in the equation, a value that represents surface runoff (base flow) produced in the condition of vegetation in baseline period can be obtained which is called simulated surface runoff (base flow). The value of simulated surface runoff (base flow) minus observed mean surface runoff (base flow) in the changing period represents surface runoff (base flow) variation caused by vegetation restoration. Similarly, the value of observed mean surface runoff (base flow) in the baseline period minus simulated surface runoff (base flow) represents surface runoff (base flow) variation caused by precipitation variation. In this way, the impacts of precipitation variation and vegetation restoration on surface runoff and base flow can be quantitatively distinguished. Calculation equations of the contribution rates of precipitation variation and vegetation restoration are listed as follows:
where Q is surface runoff (base flow) [mm], P is precipitation [mm], a and b are parameters.
where and are observed mean surface runoff (base flow) (mm) in baseline period and changing period respectively; , which means simulated surface runoff (base flow), where is observed mean precipitation (mm) in the changing period; is total change in observed mean surface runoff (base flow) comparing baseline period to changing period; and are surface runoff (base flow) changes caused by vegetation restoration and precipitation variation, respectively.
3. Results and Discussion
3.1. Seasonal Distribution of Precipitation, Evapotranspiration (ET), Surface Runoff and Base Flow
Based on daily precipitation, runoff data and base flow separation results of Pengchongjian hydrological station in 1983–2014, the monthly, seasonal (spring is March to May, summer is June to August, autumn is September to November, winter is December to the following February) and annual precipitation, ET, surface runoff and base flow were obtained. In this condition, it was possible to investigate the annual and inter-annual distribution of precipitation, ET and runoff, and the impacts of various factors on surface runoff and base flow in small watershed. Annual mean precipitation, ET, surface runoff and base flow from 1983 to 2014 were 1560.3, 811.9, 743.7 and 353.2 mm, respectively (Table 1). In spring and summer, both parameters except ET accounted for a large proportion in whole year, while a small ratio in autumn and winter. However, the seasonal distribution of ET was relatively even.
3.2. Variations of Precipitation and Surface Runoff
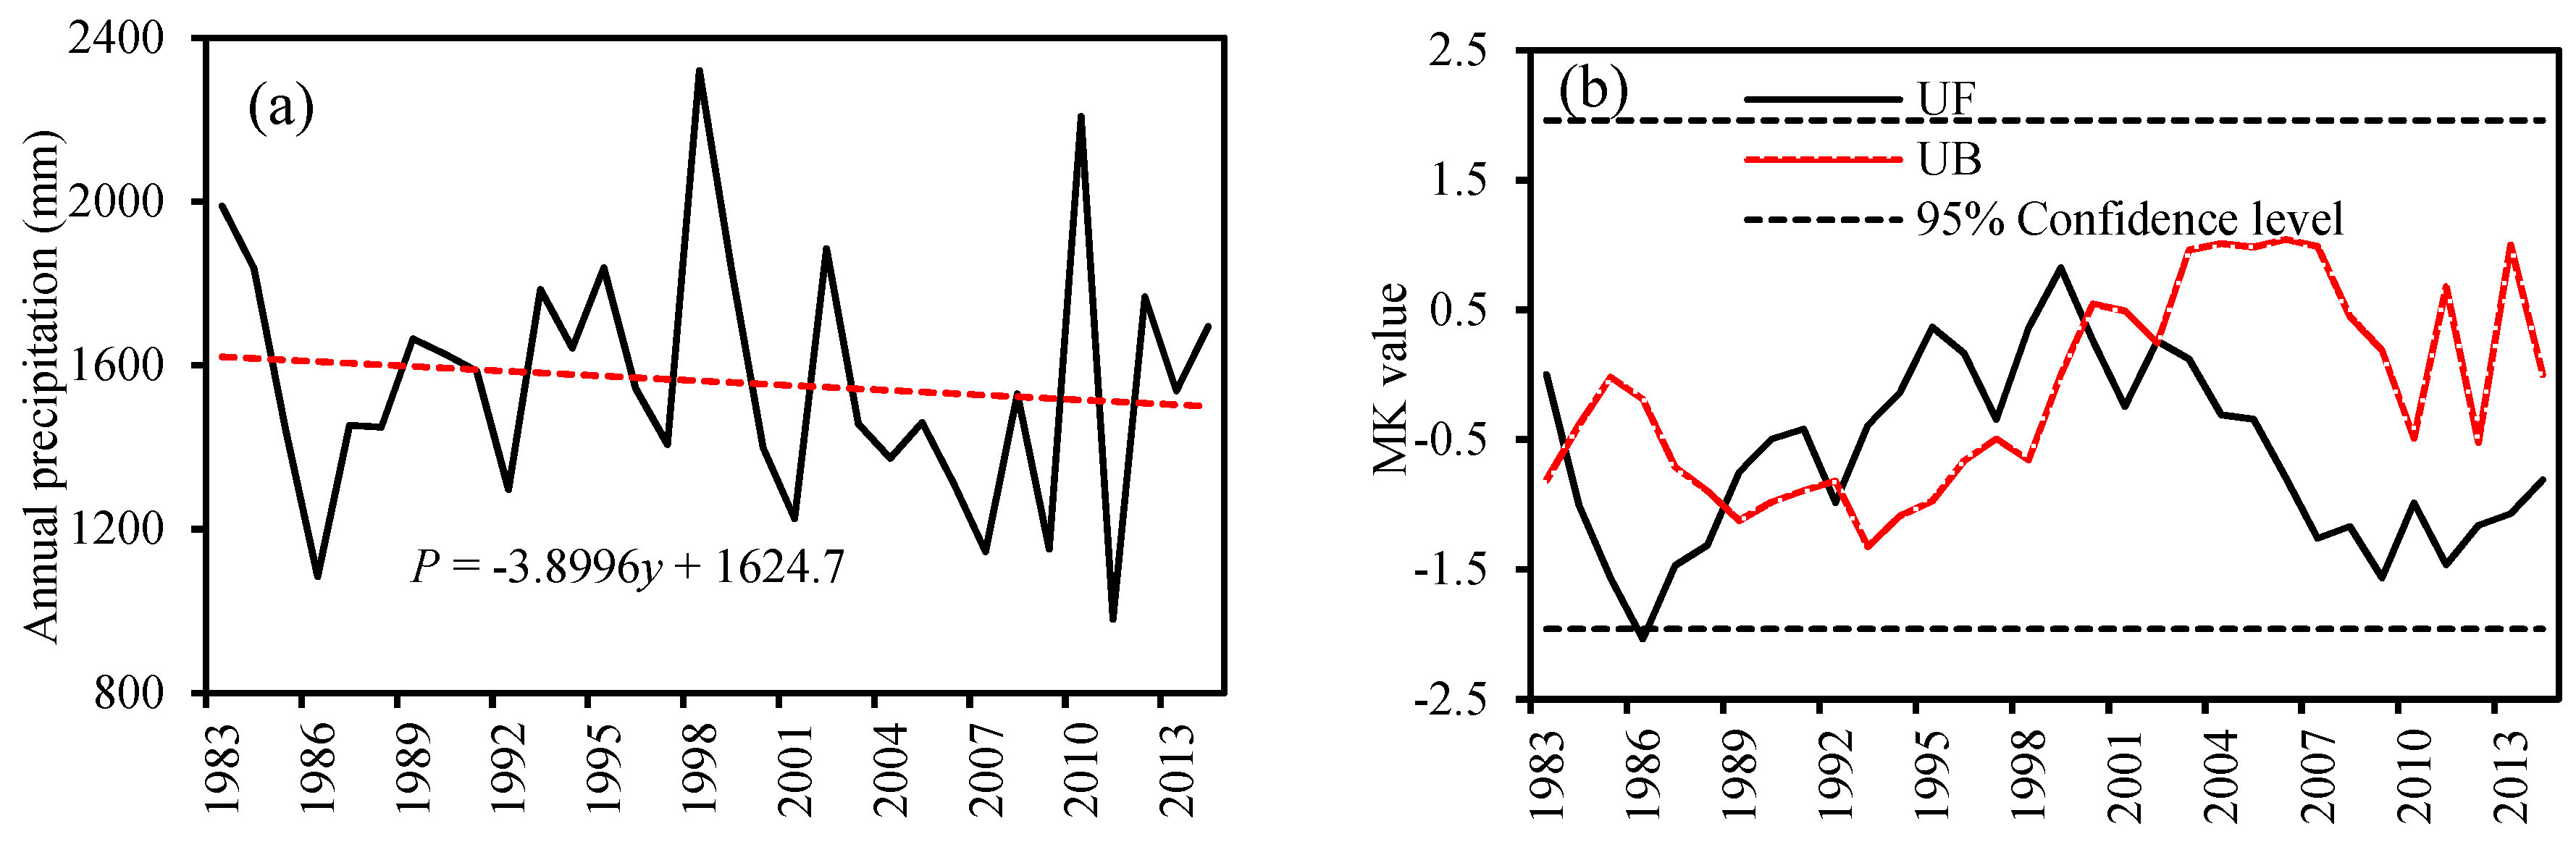
According to the MK test, the annual variation trend of precipitation (P) in Pengchongjian small watershed during 1983–2014 was as follows: (i) precipitation generally showed a fluctuated downward trend (Figure 4a). For example, it declined significantly in 1983–1986, and reached the bottom in 1986 (p > 0.05), while in 1987–2003, it showed a fluctuated rise, reaching the peak in 1998. However, from 2004 to 2009, precipitation began to decline, at the beginning of 2010 a peak (2010) and a valley (2011) appeared, then gradually it increased. (ii) According to the intersection point of UF and UB curves, the t test method was applied. It was also determined that the inflection point of the small watershed was 2003 (Figure 4b).
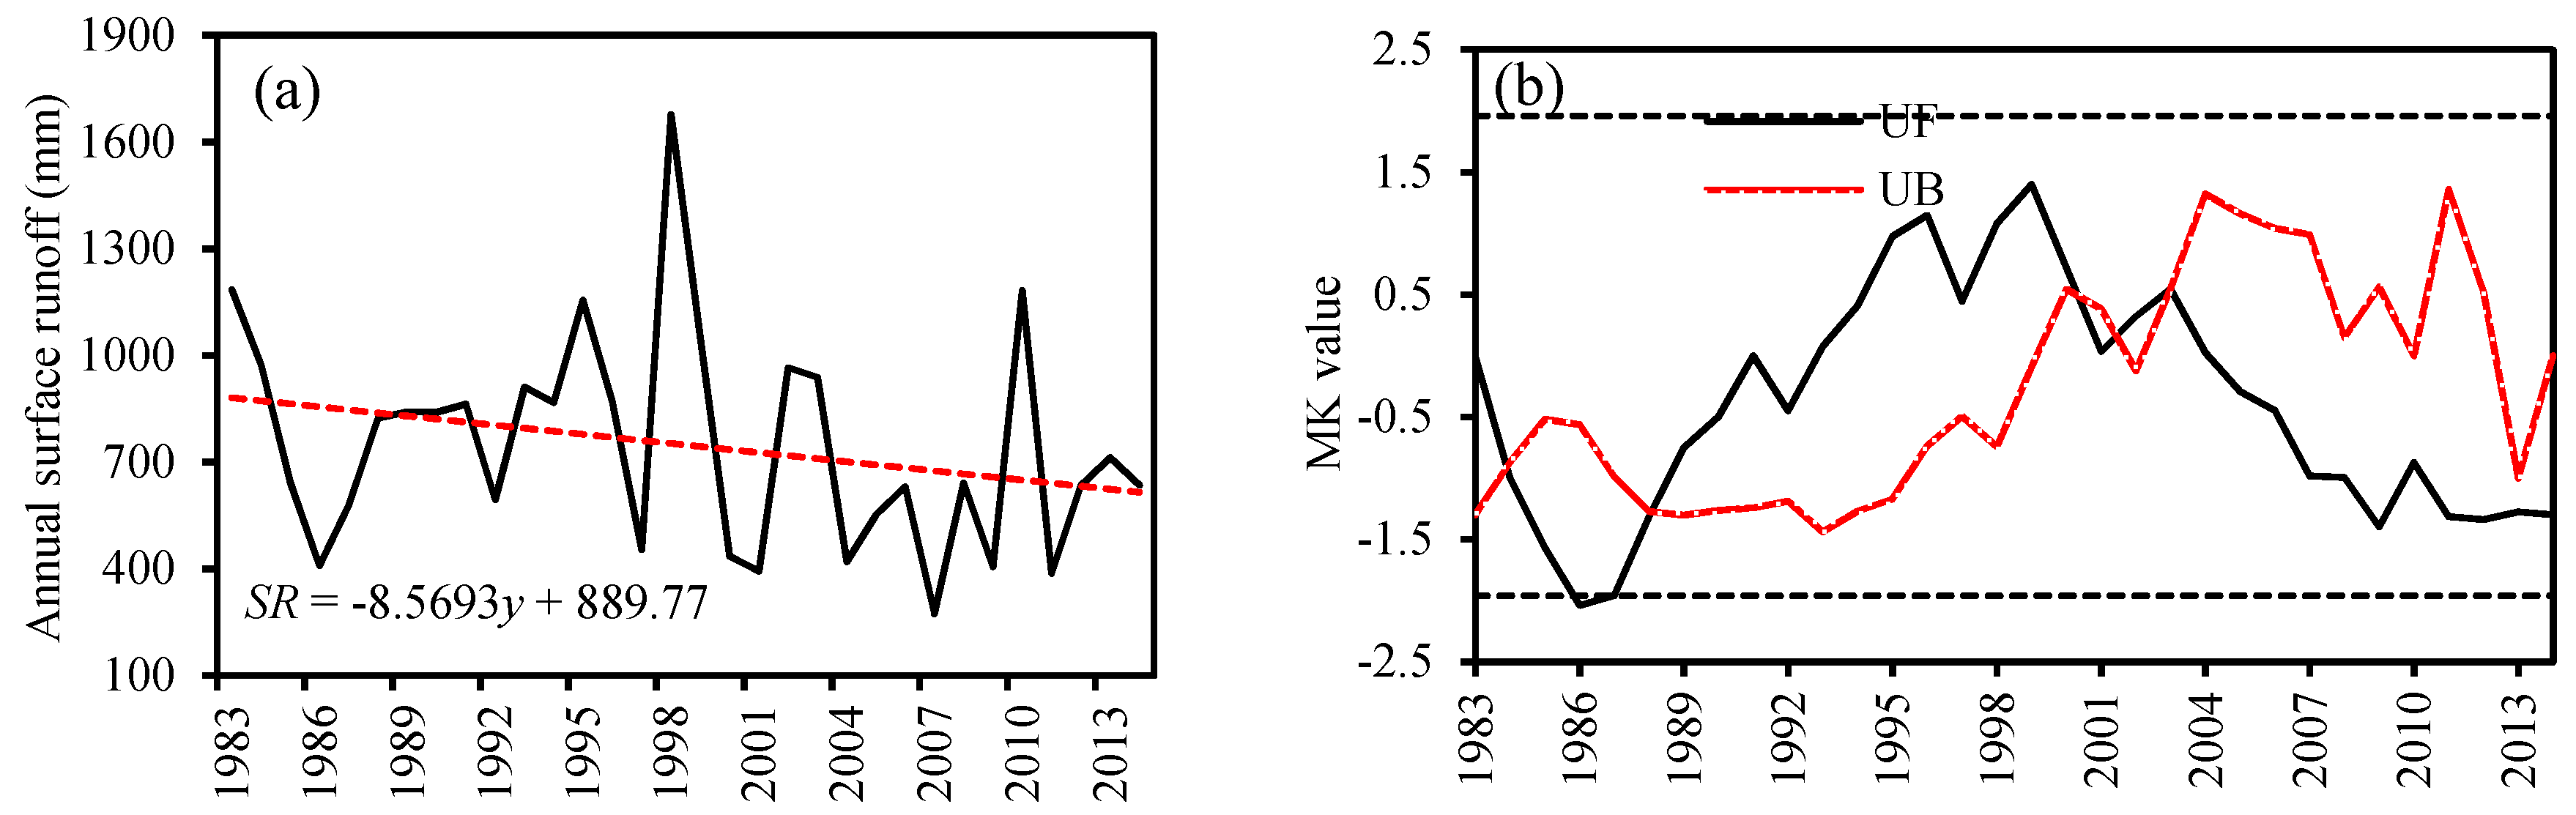
According to the MK test, annual variation trend of surface runoff (SR) in 1983–2014 was as follows: (i) surface runoff showed a fluctuated downward trend (Figure 5a). It decreased significantly in 1983–1986 (p > 0.05), then increased gradually in 1987–2003 and reached the maximum value in 1999; since 2004, surface runoff was relatively small except for 2010. (ii) UF and UB curves have multiple intersections (Figure 5b). In order to remove the invalid mutation point, the t test method was used. Furthermore, surface runoff and precipitation shared the same inflection point of year 2003. In other words, surface runoff change was directly related to precipitation.
On the basis of the trend and inflection point analysis of precipitation and surface runoff, the research periods were divided into 1983–2003 and 2004–2014. The average annual precipitation and surface runoff in 1983–2003 were 1608.2 and 831.9 mm, while in 2004–2014, they were 1468.9 and 588.9 mm. Compared with the baseline period, precipitation and surface runoff in the changing period decreased by 8.7% and 29.2%, respectively, with mean annual reduction of 12.7 and 22.1 mm. The decreasing proportion of surface runoff was larger than that of precipitation. That was to say, besides precipitation, ET and vegetation factors also influenced surface runoff. How to quantitatively distinguish the contribution rates of various factors on surface runoff in a small watershed is a scientific problem that needs to be further investigated.
3.3. Contribution Rates of ET to Surface Runoff and Base Flow
3.3.1. Variation in Temperature and ET
Annual mean temperature from 1983–2014 overall presented an upward trend, with a rate of 0.0349 °C·year−1 (Figure 6a). It reached its highest level of 17.9 °C in year 2013, while in year 1984, its historical low level was 15.9 °C. Compared to the baseline period (1983–2003), annual mean temperature in the changing period (2004–2014) increased by 1 °C. The annual variation of ET is shown in Figure 6b. The fluctuation since the early 21st century was more remarkable than that in the 1980s, and showed an upward trend not as remarkable as that as temperature. However, the rising temperature caused the ET to go up, which would probably affect the process of the water cycle, directly leading to a decrease in surface runoff as well as base flow. Thus, we firstly calculated the contribution rate of ET to surface runoff and base flow decrease by SCRCQ.
3.3.2. Impacts of ET on Surface Runoff and Base Flow
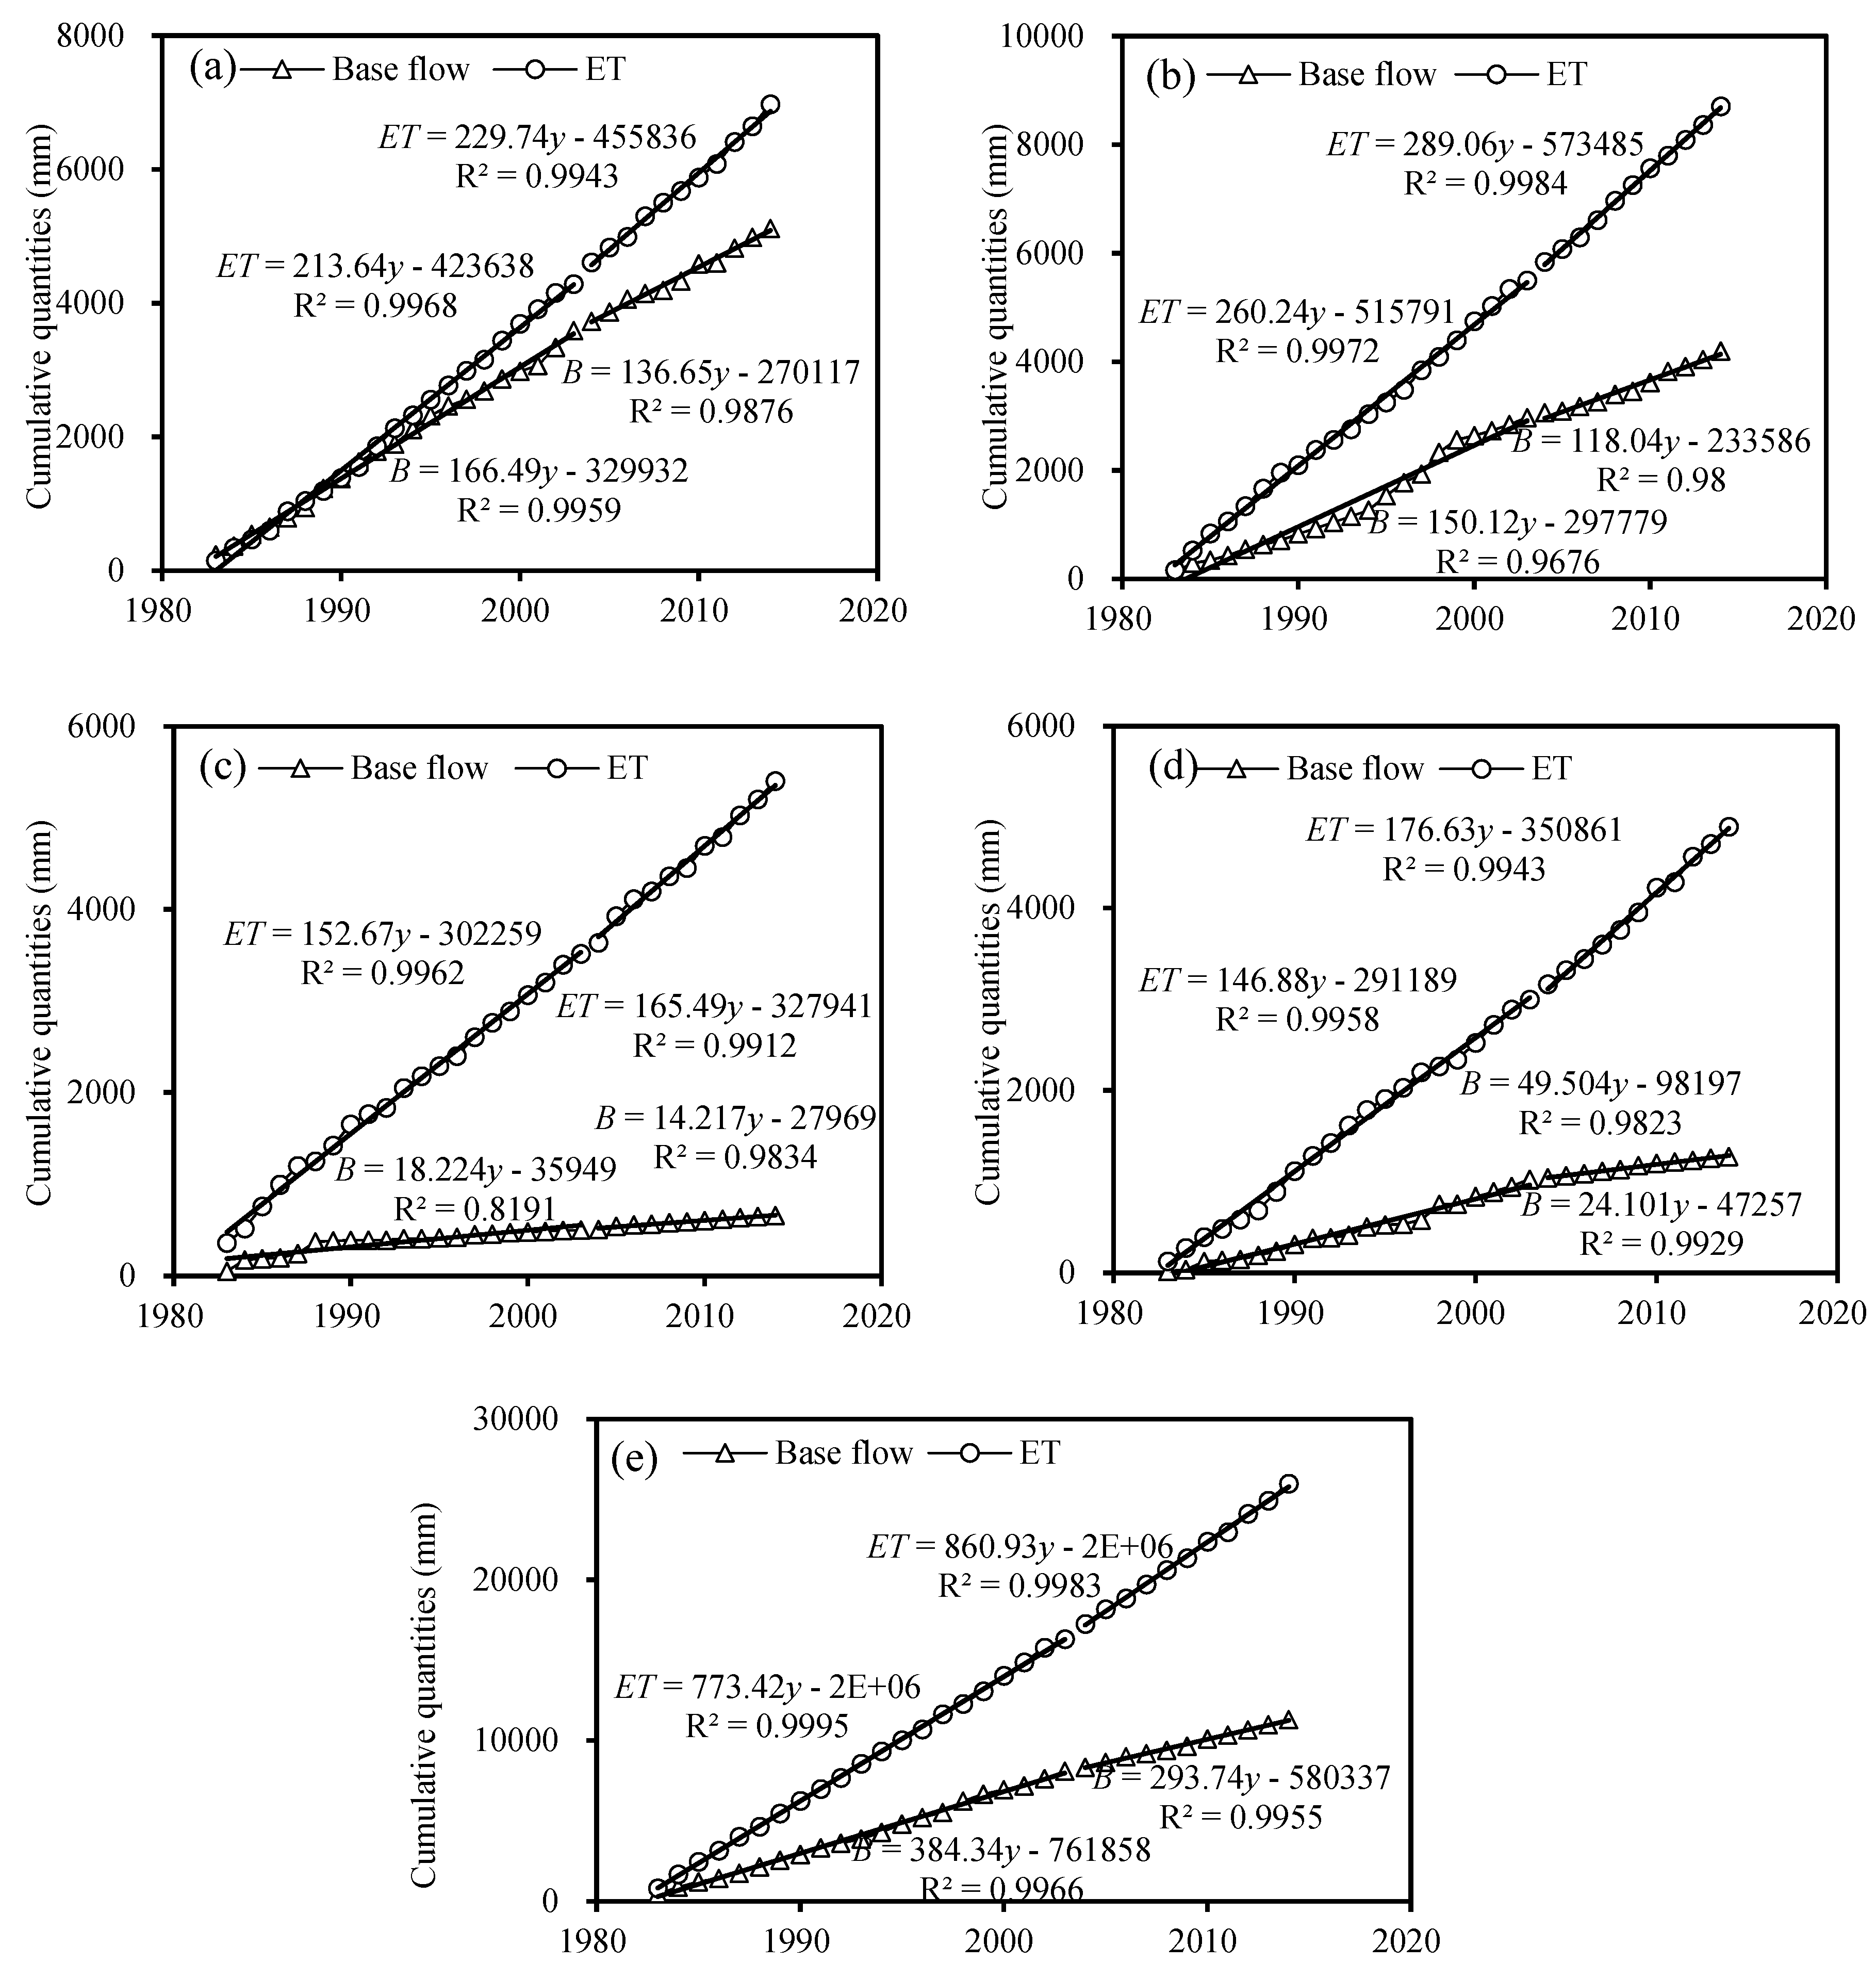
The linear relationships between year and cumulative ET, surface runoff and base flow are shown in Figure 7 and Figure 8. The calculation results of the contribution rates of ET to surface runoff and base flow are shown in Table 2. Annual average ET during the baseline period and changing period were 773.4 and 860.9 mm, while annual mean surface runoff were 831.9 and 588.9 mm, and average base flow were 384.3 and 293.7 mm, respectively. Compared with the baseline period, ET, surface runoff and base flow in changing period increased by 87.5, 243 and 90.6 mm, with corresponding change rates of 11.3%, −29.2% and −23.6%, respectively. This somewhat reflected the fact that surface runoff and base flow declined synchronously with the increase of ET. In annual scale, the contribution rates of ET to the decrease of surface runoff and base flow were 38.7% and 47.9%, which was basically consistent with the conclusion drawn in the Yinjiang basin [29], while quite distinct from that (less than 10%) in the Yellow River basin [32]. This fully illustrated that under the subtropical humid monsoon climate, ET could affect surface runoff and base flow to a greater extent, similar to the conclusion drawn by Chaplot [11]. On a seasonal scale, the contribution rates of ET to the decrease of surface runoff was between 28%~40%, while that to base flow reduction was between 38%~52%. We could deem that the sensitivity of response of base flow to ET is higher than that of surface runoff, as depicted by Lin [33]. Moreover, the contribution rate of ET to base flow in summer was obviously higher than that in other seasons, which may be due to more precipitation, higher temperature and higher ET in summer caused by forest restoration. On the other hand, the variation of average ET, surface runoff and base flow in winter were both 2~3 times that of other seasons compared to the baseline period (Table 2). Meanwhile, the contribution rates of ET to surface runoff and base flow in winter were quite close to that in other seasons, indicating that vegetation accounted for a larger part in water yield when encountering the dry season with less precipitation.
In short, ET impact on surface runoff and base flow could not be negligible whether in annual scale or seasonal scale, especially in winter. The response of dry season runoff to forest change is mainly determined by soil conditions, tree species and vegetation regeneration after disturbances, as well as topography [34], or rather, water consumption (ET) and subsequent changes in soil infiltration and water storage capacity.
3.4. Contribution Rates of Precipitation Variation and Vegetation Restoration to Surface Runoff Decrease
The regression analysis between mean surface runoff and precipitation in seasonal and whole year scale during baseline period were carried out, and the linear equations were shown in Figure 9.
The mean annual and seasonal precipitation during changing period were then substituted into the corresponding equations, and the simulated mean surface runoffs were obtained. The calculation results of contribution rates of precipitation variation and vegetation restoration to surface runoff are shown in Table 3.
Compared to the baseline period, average surface runoff in spring, summer, autumn, winter and the whole year decreased by 100.2, 105.8, 7.5, 36.1 and 243 mm, respectively. The surface runoff decrease caused by precipitation variation was 59.0, 75.7, 3.2, 9.3 and 138.7 mm, respectively, while by vegetation restoration was 41.2, 30.1, 4.3, 26.8 and 104.3 mm. The contribution rates of precipitation variation and vegetation restoration to surface runoff were 42.1%, 29.4% in spring, 45.0%, 17.9% in summer, 30.1%, 40.5% in autumn, 16.7%, 48.2% in winter, and 35.0%, 26.3% in annual scale, respectively (Table 3). Obviously, in seasonal scale, attribution of surface runoff reduction to precipitation in spring and summer was larger than that in autumn and winter, and vice versus for attribution to vegetation restoration. Herein the contribution rate of precipitation in summer reached the maximum, which may be related to much more precipitation, heavier rainfall intensity, and more rainfall days. For this reason, on the contrary, vegetation restoration counted less (only 44% of that in autumn) than precipitation for surface runoff decease in summer (Table 3). The water diminishing effect of vegetation in autumn and winter was significantly strengthened, which is likely because of less precipitation in autumn and winter, and vegetation enriched the understory and forest litter, and enhanced soil infiltration and water storage [34], hence reducing surface runoff. On an annual scale, in contrast to the conclusion that vegetation change induced by human activity dominated surface runoff generation in arid areas of northern China [25,26,31,35,36], we found that for Pengchongjian small watershed, the contribution of precipitation (35%) to surface runoff was nearly close to that of ET (38.7%), followed by vegetation restoration (26.3%). The reason why the results varied, on the one hand, is probably due to distinct climatic conditions, topography, vegetation structure and type. On the other hand, human activity there is relatively slight with no local residents or water conservancy facilities and soil and water conservation projects. In general, climatic factors (including precipitation variation and elevated ET caused by rising temperature) are the major drivers for annual surface runoff, which is in accordance to similar results in Poyang Lake basin, China [15,16,37].
3.5. Contribution Rates of Precipitation Variation and Vegetation Restoration to Base Flow Decrease
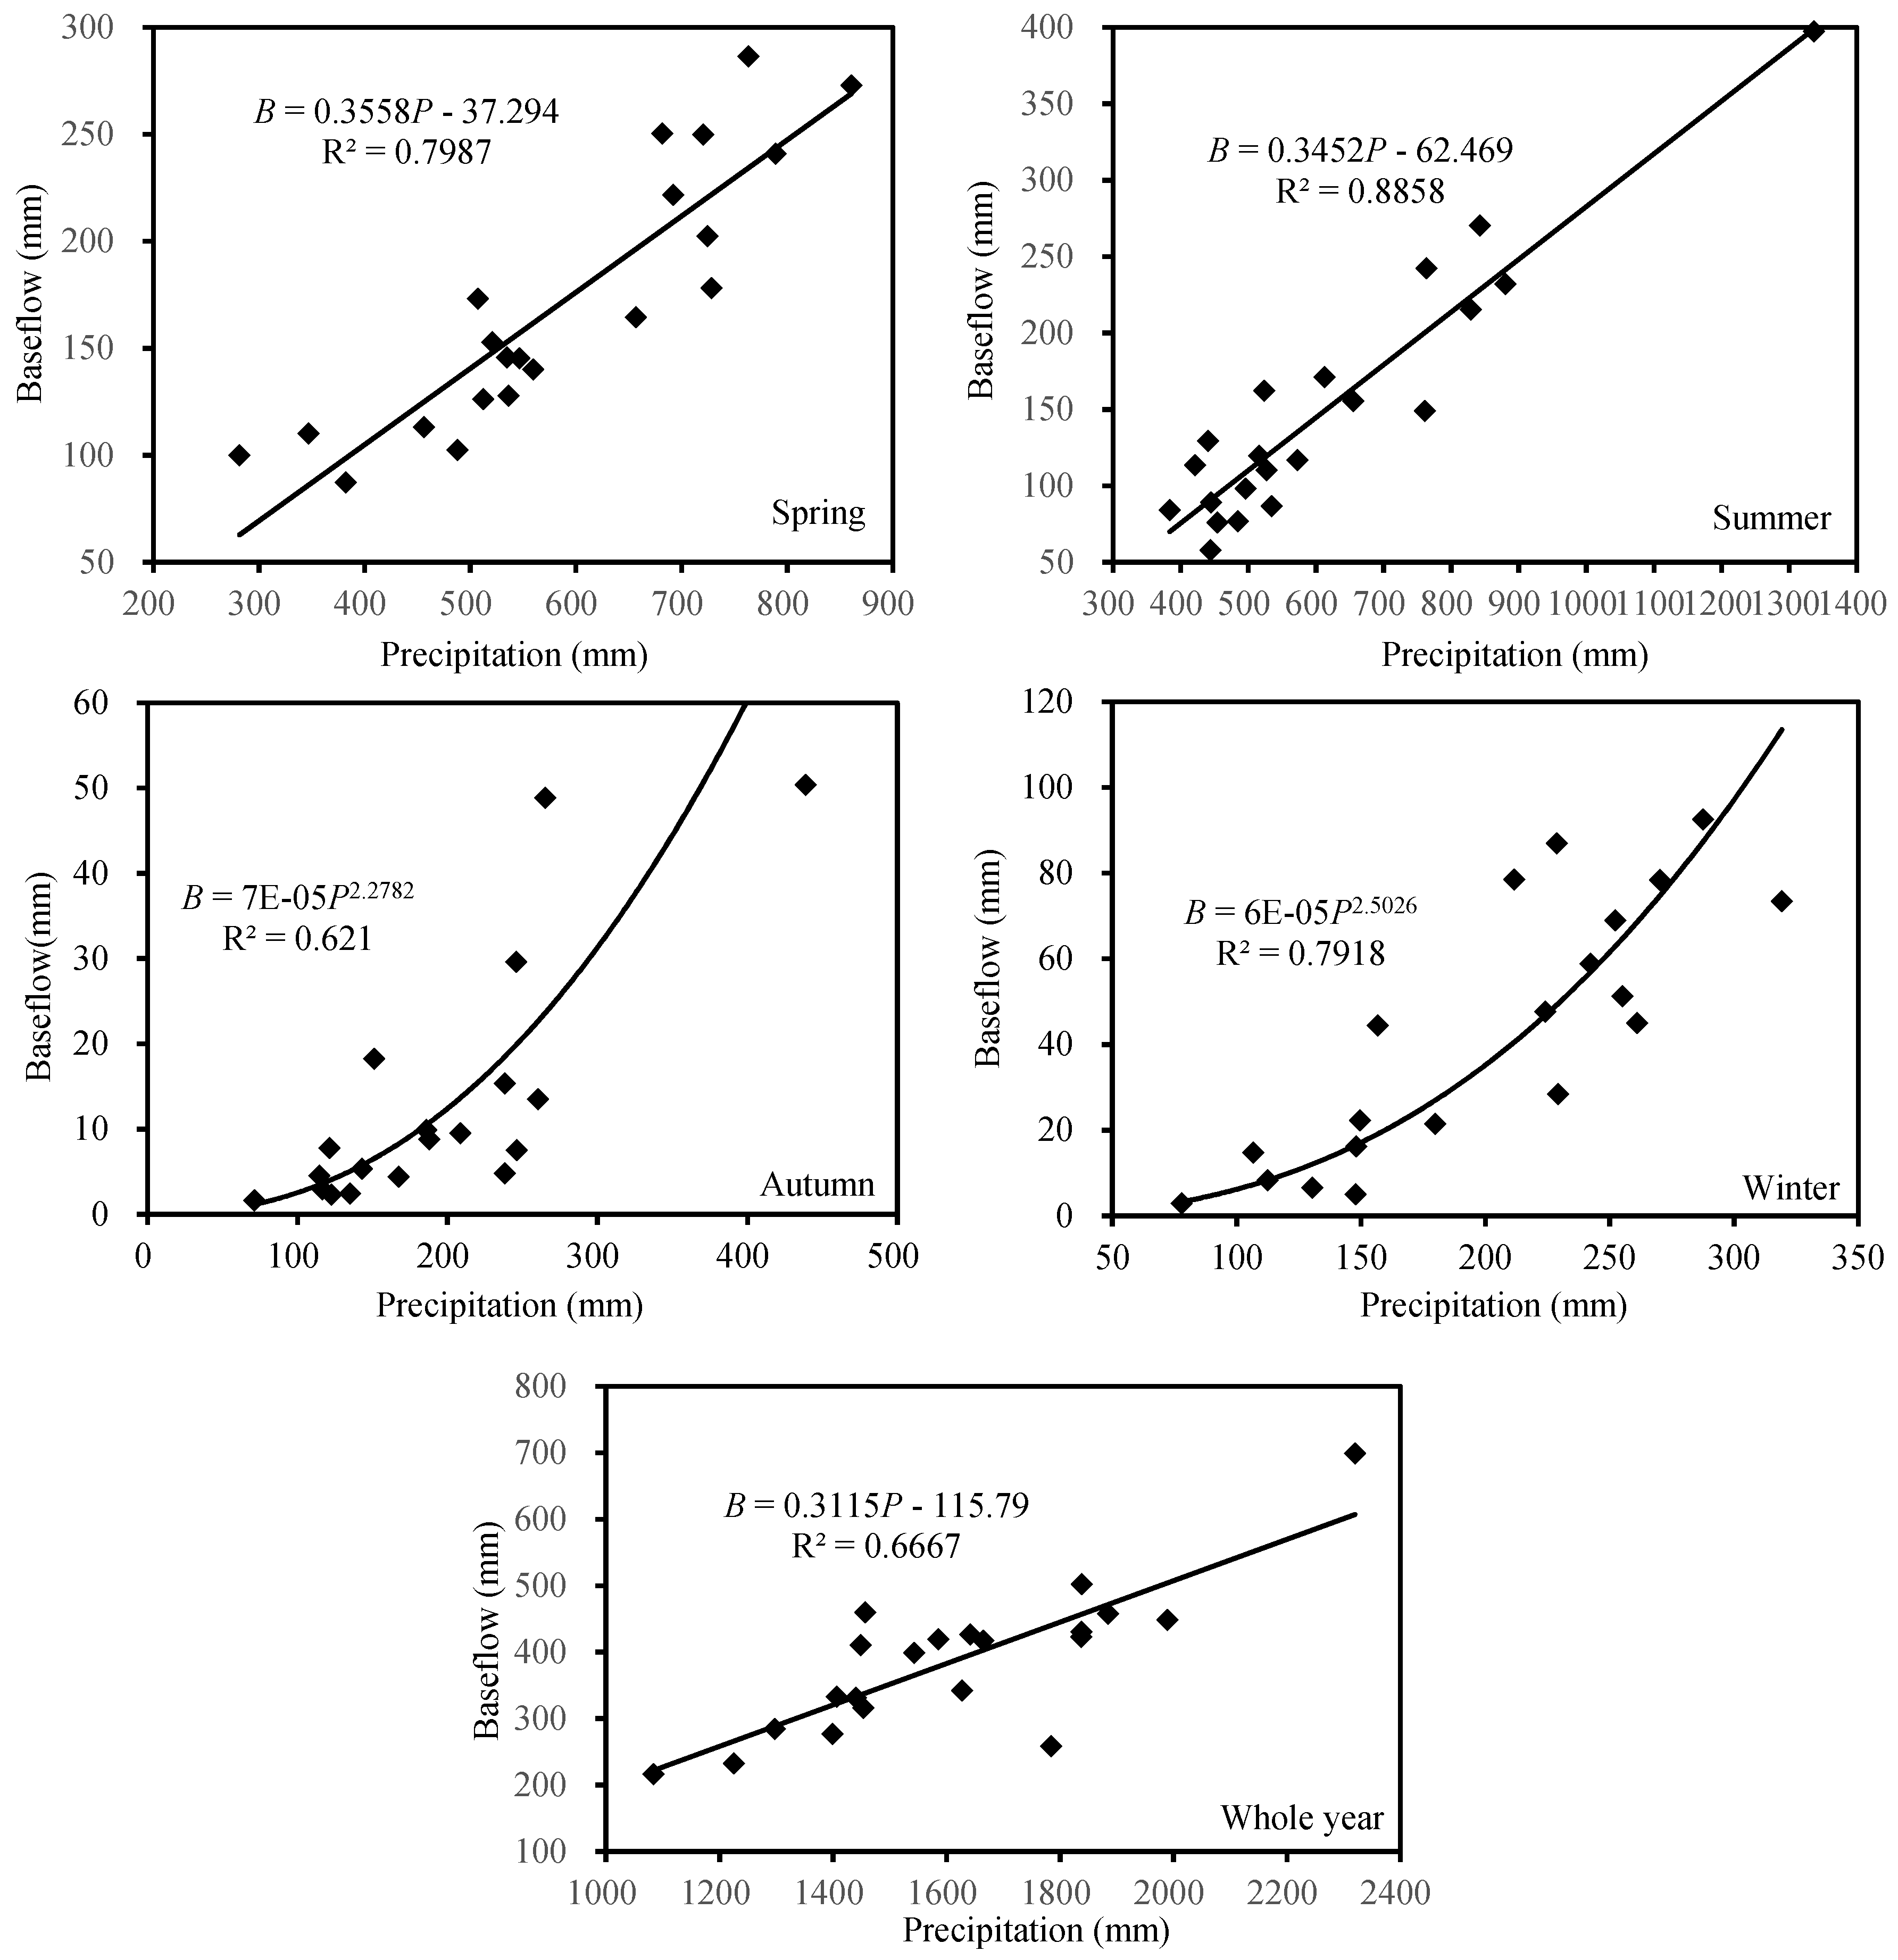
The regression analysis between mean base flow and precipitation in seasonal and whole year scale during the baseline period were carried out, and the linear equations were shown in Figure 10.
The mean annual and seasonal precipitation during the changing period were then substituted into the corresponding equations, and the simulated mean base flow was obtained. The calculation results of contribution rates of precipitation variation and vegetation restoration to base flow are shown in Table 4.
Compared to the baseline period, average base flow in spring, summer, autumn, winter and the whole year decreased by 29.8, 32.1, 4.0, 25.4 and 90.6 mm, respectively. Base flow decrease caused by precipitation variation was 17.0, 26.2, 2.6, 10.2 and 42.5 mm, respectively, while by vegetation restoration it was 12.8, 5.9, 1.4, 15.2 and 48.1 mm. The contribution rates of precipitation variation and vegetation restoration to base flow were 33.1%, 25.0% in spring, 39.3%, 8.8% in summer, 40.2%, 21.6% in autumn, 24.3%, 36.3% in winter and 24.4%, 27.7% on an annual scale, respectively (Table 4). It could be seen that, as with surface runoff, the contribution rate of each factor to the reduction of base flow also showed obvious seasonality. The contribution rate of precipitation variation was the lowest in winter while almost the same in other seasons. The contribution rate of vegetation restoration, however, reached the minimum in summer (only 20%~40% of that in other seasons). Moreover, base flow reduction due to vegetation restoration obviously escalated in winter, which was consistent with the conclusion drawn on surface runoff. On an annual scale, the contribution rate of vegetation restoration to base flow reduction was slightly larger than that of precipitation, but ET still dominated. We know that the increase of vegetation coverage and the improvement of stand quality directly led to the increase of ET and thus base flow decrease. So, we assumed that forest may be a main factor with a negative impact on base flow, as mentioned by Huang [38] and Zhang [39]. Anyhow, ET has an important influence on the dynamic change of base flow. Meanwhile, vegetation plays an irreplaceable role in regulating water flow in dry seasons and improving hydrological ecology in watersheds.
4. Conclusions
In this paper, we quantitively calculated the contribution rates of precipitation variation, vegetation restoration and ET to surface runoff and base flow. The results indicated that each factor played a role in reducing surface runoff and base flow, and their contribution rates varied from season to season. For spring and summer, the contribution rate of precipitation was equal to that of ET, which was slightly larger than vegetation restoration; for autumn and winter; however, the effect of vegetation restoration on water yield was obviously stronger than that in spring and summer. On an annual scale, climatic factors including precipitation and ET change dominated surface runoff generation. Meanwhile, the sensitivity of base flow response to ET was higher than surface runoff, so that ET dominated the dynamic change of annual base flow. As presented in this study, ET change is closely associated with vegetation restoration, which fully illustrates that the protection of natural forest ecosystem and the optimization of forest operation and management are important guarantees for ecological water circulation and the sustainable utilization of forest resources.
Author Contributions
S.L., R.W. and Z.L. (Zhihong Lu) designed this study. Z.L. (Zheng Liu), J.Y. and F.S. collected data and performed the data analysis. L.O. wrote this paper.
Funding
This research was funded by the Chinese Natural Science Foundation Program grant number (No. 31460222).
Acknowledgments
The authors are grateful for the support from Jiangxi Hydrological Bureau and the local government in Duchang County, Jiujiang. We also appreciate the reviewers for their helpful comments in polishing this article.
Conflicts of Interest
The authors declare no conflict of interest.
References
- Smakhtin, V.U. Low flow hydrology: A. review. J. Hydrol. 2001, 240, 147–186. [Google Scholar] [CrossRef]
- Ficklin, D.L.; Robeson, S.M.; Knouft, J.H. Impacts of recent climate change on trends in baseflow and stormflow in United States watersheds. Geophys. Res. Lett. 2016, 43, 5079–5088. [Google Scholar] [CrossRef]
- Guzmán, P.; Batelaan, O.; Huysmans, M.; Wyseure, G. Comparative analysis of baseflow characteristics of two Andean catchments, Ecuador. Hydrol. Process. 2015, 29, 3051–3064. [Google Scholar] [CrossRef] [Green Version]
- Ni, Y.Q.; Zhang, W.H.; Guo, S.L. Discussion on the discharge hydrograph separation methods. Hydrology 2005, 25, 11–23. (In Chinese) [Google Scholar]
- Githui, F.; Gitau, W.; Mutua, F.; Bauwens, W. Climate change impact on SWAT simulated streamflow in western Kenya. Int. J. Climatol. 2009, 29, 1823–1834. [Google Scholar] [CrossRef] [Green Version]
- Ye, X.C.; Zhang, Q.; Liu, J.; Li, X.H.; Xu, C.Y. Distinguishing the relative impacts of climate change and human activities on variation of streamflow in the Poyang Lake catchment, China. J. Hydrol. 2013, 494, 83–95. [Google Scholar] [CrossRef]
- Kuk-Hyun Ahn, V.M. Quantifying the relative impact of climate and human activities on streamflow. J. Hydrol. 2014, 515, 257–266. [Google Scholar]
- Röderstein, M.; Perdomo, L.; Villamil, C.; Hauffe, T.; Schnetter, M. Long-term vegetation changes in a tropical coastal lagoon system after interventions in the hydrological conditions. Aquat. Bot. 2014, 113, 19–31. [Google Scholar] [CrossRef]
- Chaplot, V.; Saleh, A.; Jaynes, D.B. Effect of the accuracy of spatial rainfall information on the modeling of water, sediment, and NO3–N loads at the watershed level. J. Hydrol. 2005, 312, 223–234. [Google Scholar] [CrossRef]
- Alvarenga, L.A.; de Mello, C.R.; Colombo, A.; Cuartas, L.A.; Bowling, L.C. Assessment of land cover change on the hydrology of a Brazilian headwater watershed using the Distributed Hydrology-Soil-Vegetation Model. Catena 2016, 143, 7–17. [Google Scholar] [CrossRef]
- Chaplot, V. Water and soil resources response to rising levels of atmospheric CO2 concentration and to changes in precipitation and air temperature. J. Hydrol. 2007, 337, 159–171. [Google Scholar] [CrossRef]
- Zeng, S.D.; Xia, J.; Du, H. Separating the effects of climate change and human activities on runoff over different time scales in the Zhang River basin. Stoch. Environ. Res. Risk Assess. 2014, 28, 401–413. [Google Scholar] [CrossRef]
- Zhang, X.C.; Nearing, M.A. Impact of climate change on soil erosion, runoff, and wheat productivity in central Oklahoma. Catena 2005, 61, 185–195. [Google Scholar] [CrossRef]
- Zhang, Q.; Liu, J.Y.; Singh, V.P.; Gu, X.H.; Chen, X.H. Evaluation of impacts of climate change and human activities on streamflow in the Poyang Lake basin, China. Hydrol. Process. 2016, 30, 2562–2576. [Google Scholar] [CrossRef]
- Gu, C.J.; Mu, X.M.; Gao, P.; Zhao, G.J.; Sun, W.Y.; Li, P.F. Effects of climate change and human activities on runoff and sediment inputs of the largest freshwater lake in China, Poyang Lake. Hydrol. Sci. J. 2017, 62, 2313–2330. [Google Scholar] [CrossRef]
- Rogger, M.; Agnoletti, M.; Alaoui, A.; Bathurst, J.C.; Bodner, G.; Borga, M.; Chaplot, V.; Gallart, F.; Glatzel, G.; Hall, J.; et al. Land use change impacts on floods at the catchment scale: Challenges and opportunities for future research. Water Resour. Res. 2017, 53, 5209–5219. [Google Scholar] [CrossRef] [PubMed] [Green Version]
- Jiang, S.H.; Ren, L.L.; Yong, B.; Singh, V.P.; Yang, X.L.; Yuan, F. Quantifying the effects of climate variability and human activities on runoff from the Laohahe basin in northern China using three different methods. Hydrol. Process. 2011, 25, 2492–2505. [Google Scholar] [CrossRef]
- Xia, J.; Zeng, S.; Du, H.; Zhan, C.S. Quantifying the effects of climate change and human activities on runoff in the water source area of Beijing, China. Hydrol. Sci. J. 2014, 59, 1794–1807. [Google Scholar] [CrossRef] [Green Version]
- Koskelo, A.I.; Fisher, T.R.; Utz, R.M.; Jordan, T.E. A new precipitation-based method of baseflow separation and event identification for small watersheds (<50 km2). J. Hydrol. 2012, 450, 267–278. [Google Scholar] [CrossRef]
- Rumsey, C.A.; Miller, M.P.; Susong, D.D.; Tillman, F.D.; Anning, D.W. Regional scale estimates of baseflow and factors influencing baseflow in the Upper Colorado River Basin. J. Hydrol. Reg. Stud. 2015, 4, 91–107. [Google Scholar] [CrossRef]
- Ding, Z.L.; Hu, K.D.; Fang, Y.Y. Analysis and discussion of dividing up ground water by the kalinlin improving Method. JiangXi Hydraul. Sci. Technol. 2003, 29, 211–215. (In Chinese) [Google Scholar]
- Chattopadhyay, G.; Chakraborthy, P.; Chattopadhyay, S. Mann-Kendall trend analysis of tropospheric ozone and its modeling using ARIMA. Theor. Appl. Climatol. 2012, 110, 321–328. [Google Scholar] [CrossRef]
- Rahman, M.A.; Yunsheng, L.; Sultana, N. Analysis and prediction of rainfall trends over Bangladesh using Mann-Kendall, Spearman’s rho tests and ARIMA model. Meteorol. Atmos. Phys. 2017, 129, 409–424. [Google Scholar] [CrossRef]
- Nourani, V.; Danandeh Mehr, A.; Azad, N. Trend analysis of hydroclimatological variables in Urmia lake basin using hybrid wavelet Mann–Kendall and Şen tests. Environ. Earth. Sci. 2018, 77, 207. [Google Scholar] [CrossRef]
- Kamruzzaman, M.; Rahman, A.T.M.S.; Ahmed, M.S.; Kabir, M.E.; Mazumder, Q.H.; Rahman, M.S.; Jahan, C.S. Spatio-temporal analysis of climatic variables in the western part of Bangladesh. Environ. Dev. Sustain. 2018, 20, 89–108. [Google Scholar] [CrossRef]
- Wang, S.J.; Yan, Y.J.; Yan, M.; Zhao, X.K. Quantitative estimation of the impact of precipitation and human activities on runoff change of the Huangfuchuan River Basin. J. Geogr. Sci. 2012, 22, 906–918. [Google Scholar] [CrossRef]
- Wang, S.J.; Wang, Y.J.; Ran, L.S.; Su, T. Climatic and anthropogenic impacts on runoff changes in the Songhua River basin over the last 56years (1955–2010), Northeastern China. Catena 2015, 127, 258–269. [Google Scholar] [CrossRef] [Green Version]
- Pang, S.J.; Wang, X.Y. The characteristics and attribution of runoff change in the Miyun reservoir watershed. J. Arid Land Resour. Environ. 2016, 30, 144–148. (In Chinese) [Google Scholar]
- Wu, L.H.; Wang, S.J.; Bai, X.Y.; Luo, W.J.; Tian, Y.C.; Zeng, C.; Luo, G.J.; He, S.Y. Quantitative assessment of the impacts of climate change and human activities on runoff change in a typical karst watershed, SW China. Sci. Total Environ. 2017, 601, 1449–1465. [Google Scholar] [CrossRef] [PubMed]
- Cheng, J.X.; Xu, L.G.; Jiang, J.H.; Tan, Z.Q.; Yu, Q.W.; Fan, H.X. The research of runoff responses to climate change and human activities in the Dongting Lake catchment. J. Agro-Environ. Sci. 2016, 35, 2146–2153. (In Chinese) [Google Scholar]
- Yang, C.X.; Zhang, Z.D.; Zhu, R.X.; Wan, L.W.; Ye, C.; Zhang, J. Response of runoff to climate change and human activities in the river basin of southern humid area-A case study of Ning Jiang. Res. Soil Water Conserv. 2017, 24, 113–119. (In Chinese) [Google Scholar]
- Wang, S.J.; Yan, M.; Yan, Y.X.; Shi, C.X.; He, L. Contributions of climate change and human activities to the changes in runoff increment in different sections of the Yellow River. Quat. Int. 2012, 282, 66–77. [Google Scholar] [CrossRef]
- Lin, P.R.; Rajib, M.A.; Yang, Z.L.; Somos-Valenzuela, M.; Merwade, V.; Maidment, D.R.; Wang, Y.; Chen, L. Spatiotemporal evaluation of simulated evapotranspiration and streamflow over Texas using the WRF-Hydro-RAPID Modeling Framework. J. Am. Water Resour. Assoc. 2018, 54, 40–54. [Google Scholar] [CrossRef]
- Hou, Y.P.; Zhang, M.F.; Meng, Z.Z.; Liu, S.R.; Sun, P.S.; Yang, T.L. Assessing the impact of forest change and climate variability on dry season runoff by an improved single watershed approach: A comparative study in two large watersheds, China. Forests 2018, 9, 46. [Google Scholar] [CrossRef]
- Wu, J.W.; Miao, C.Y.; Zhang, X.M.; Yang, T.T.; Duan, Q.Y. Detecting the quantitative hydrological response to changes in climate and human activities. Sci. Total Environ. 2017, 586, 328–337. [Google Scholar] [CrossRef] [PubMed]
- Xu, X.Y.; Yang, D.W.; Yang, H.B.; Lei, H.M. Attribution analysis based on the Budyko hypothesis for detecting the dominant cause of runoff decline in Haihe basin. J. Hydrol. 2014, 510, 530–540. [Google Scholar] [CrossRef]
- Sun, S.L.; Chen, H.S.; Ju, W.M.; Song, J.; Zhang, H.; Sun, J.; Fang, Y.J. Effects of climate change on annual streamflow using climate elasticity in Poyang Lake Basin, China. Theor. Appl. Climatol. 2013, 112, 169–183. [Google Scholar] [CrossRef]
- Huang, X.; Shi, Z.; Fang, N.; Li, X. Influences of Land Use Change on Baseflow in Mountainous Watersheds. Forests 2016, 7, 16. [Google Scholar] [CrossRef]
- Zhang, Y.K.; Schilling, K.E. Increasing streamflow and baseflow in Mississippi River since the 1940s: Effect of land use change. J. Hydrol. 2006, 324, 412–422. [Google Scholar] [CrossRef]
Figure 1.
Process of water inputs, storage, and losses in watershed.

Figure 2.
Graphical structure of this paper.

Figure 3.
Location map and observation sites in Pengchongjian small watershed.

Figure 4.
Inter-annual variation of observed precipitation (a) and its Mann–Kendall (MK) test results (b) in Pengchongjian small watershed. in 1983–2014.
Figure 4.
Inter-annual variation of observed precipitation (a) and its Mann–Kendall (MK) test results (b) in Pengchongjian small watershed. in 1983–2014.

Figure 5.
Inter-annual variation of observed surface runoff (a) and its MK results (b) in Pengchongjian small watershed in 1983–2014.
Figure 5.
Inter-annual variation of observed surface runoff (a) and its MK results (b) in Pengchongjian small watershed in 1983–2014.

Figure 6.
Variation trend of annual mean temperature (a) and ET (b) from 1983 to 2014.

Figure 7.
Relationships between year and cumulative surface runoff, ET in spring (a), summer (b), autumn (c), winter (d) and whole year (e) during two periods in Pengchongjian small watershed.
Figure 7.
Relationships between year and cumulative surface runoff, ET in spring (a), summer (b), autumn (c), winter (d) and whole year (e) during two periods in Pengchongjian small watershed.
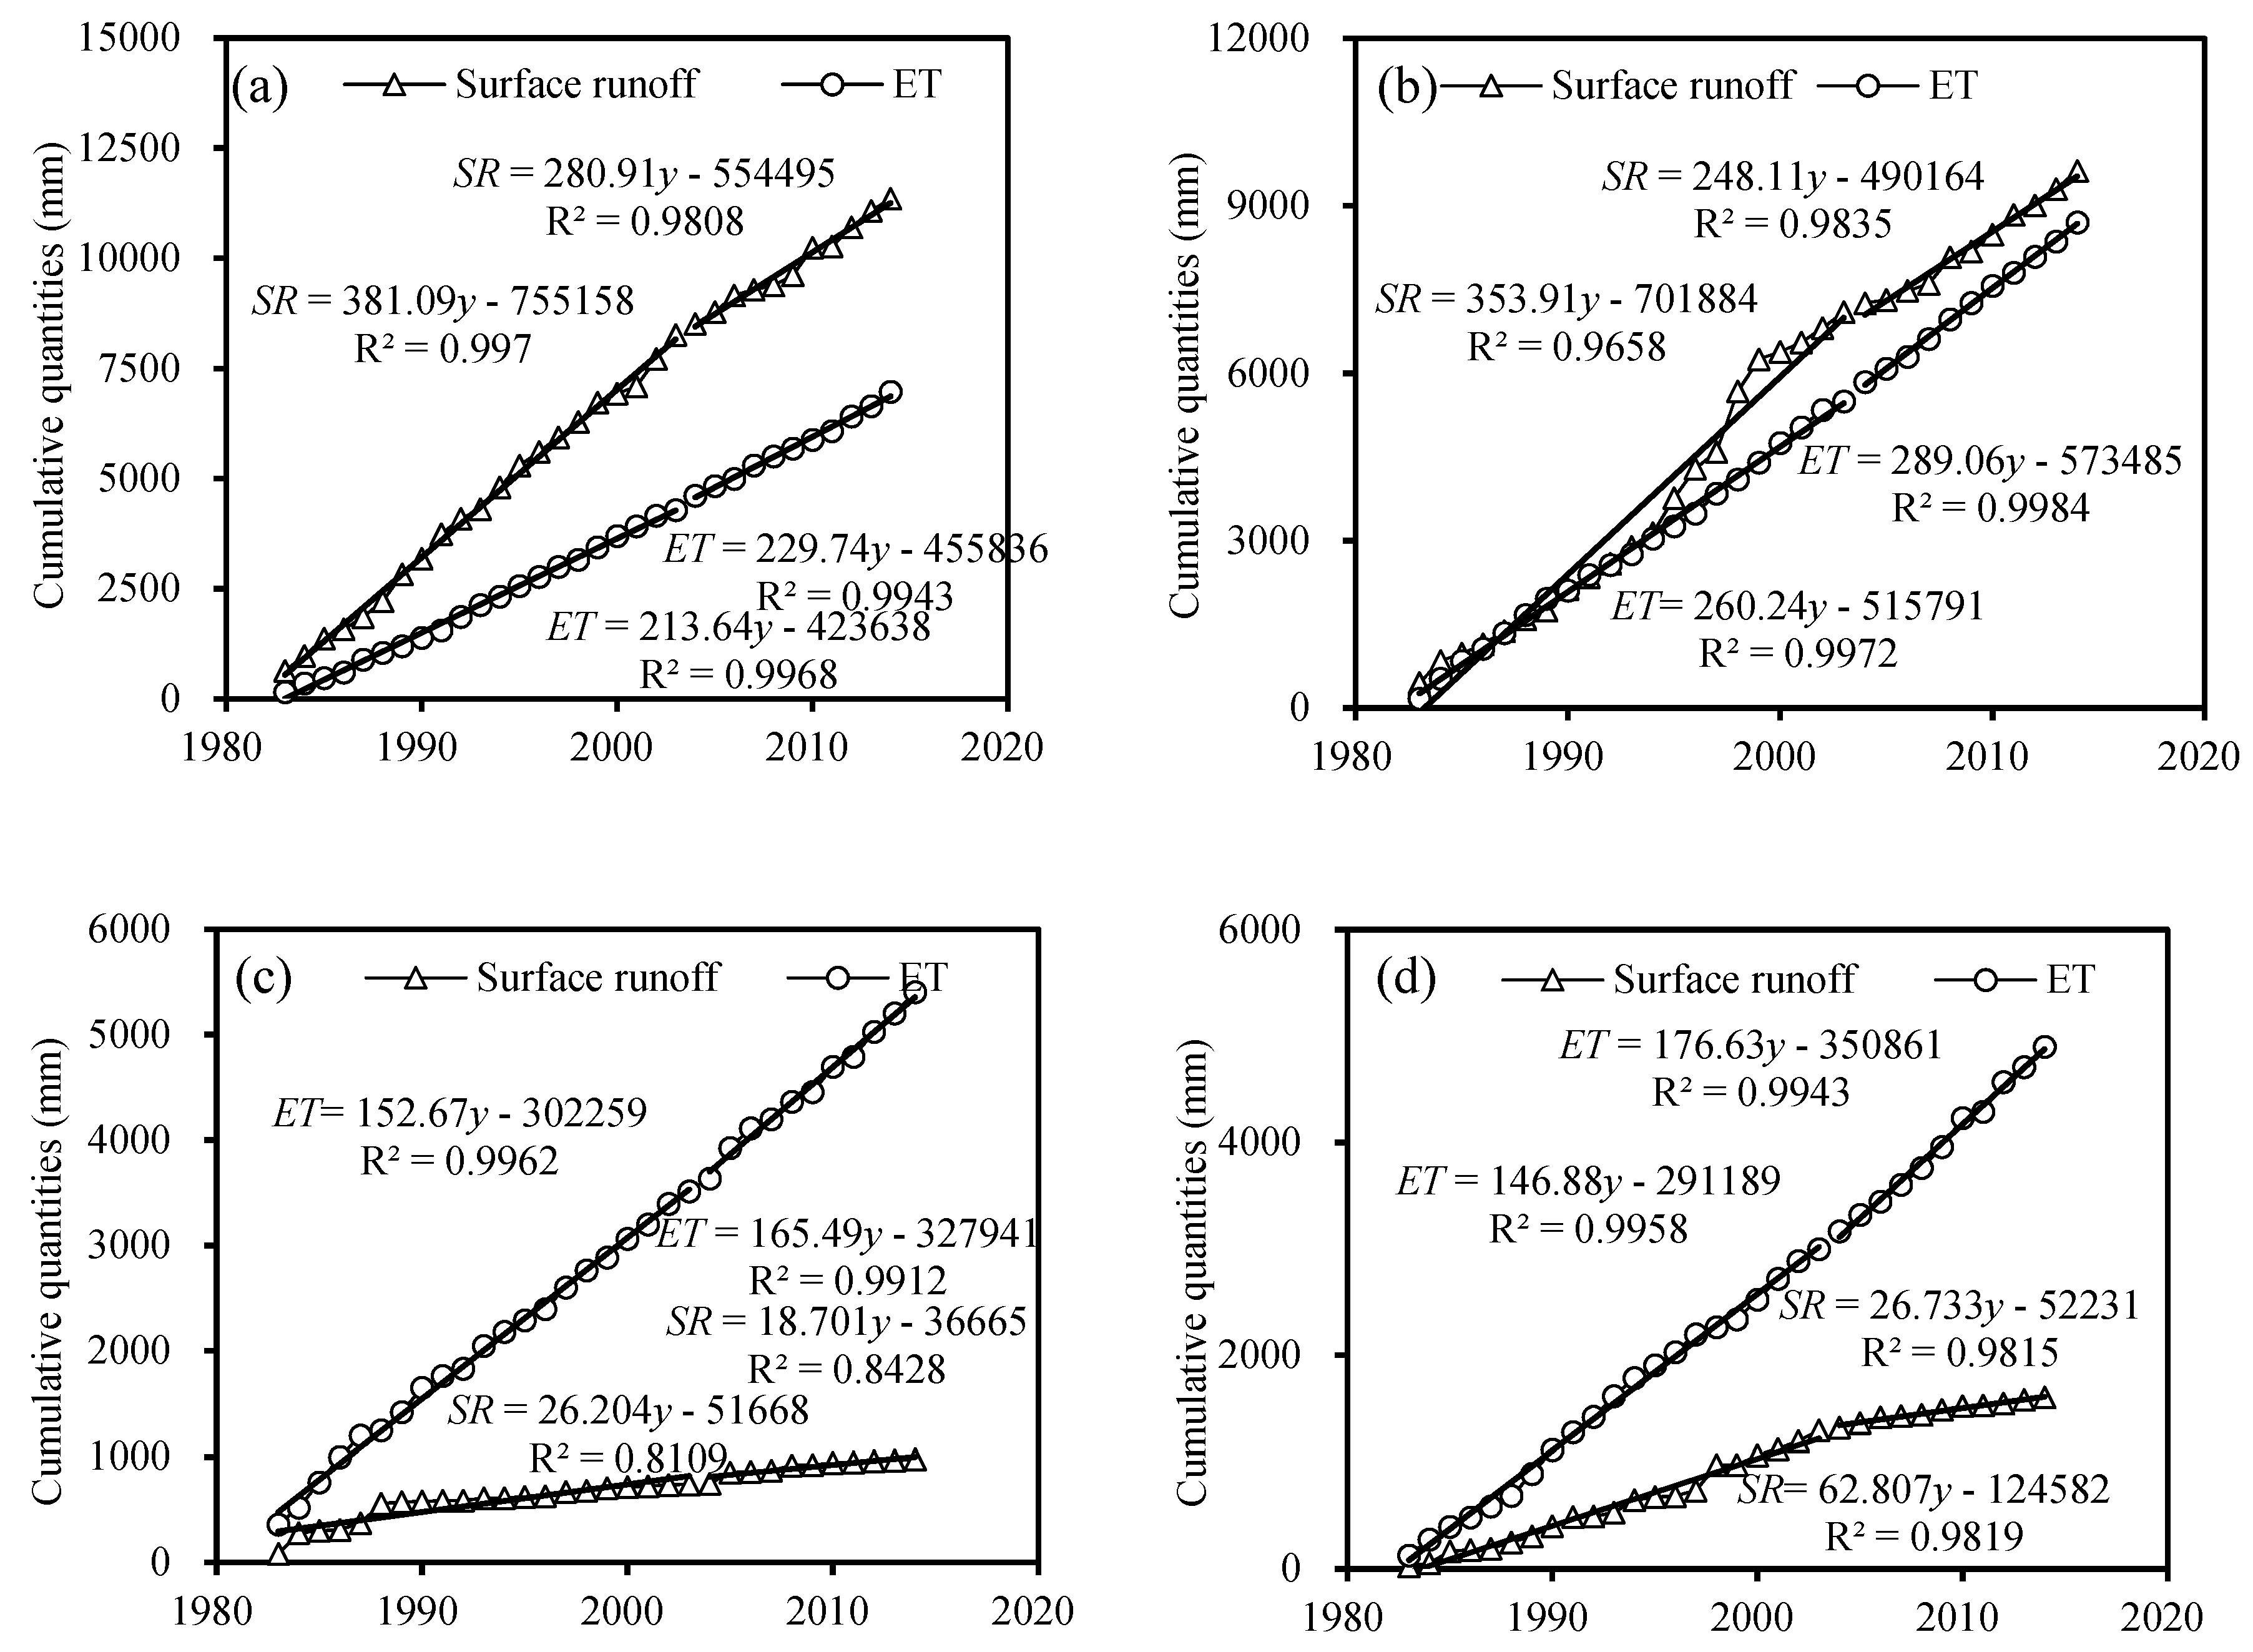

Figure 8.
Relationships between year and cumulative base flow, ET in spring (a), summer (b), autumn (c), winter (d) and whole year (e) during two periods in Pengchongjian small watershed.
Figure 8.
Relationships between year and cumulative base flow, ET in spring (a), summer (b), autumn (c), winter (d) and whole year (e) during two periods in Pengchongjian small watershed.

Figure 9.
Relationship between observed surface runoff and precipitation in seasonal and annual scale during baseline period.
Figure 9.
Relationship between observed surface runoff and precipitation in seasonal and annual scale during baseline period.

Figure 10.
Relationship between observed base flow and precipitation in seasonal and annual scale during baseline period.
Figure 10.
Relationship between observed base flow and precipitation in seasonal and annual scale during baseline period.


Table 1.
Seasonal distribution of precipitation, ET, surface runoff and base flow in Pengchongjian small watershed from 1983 to 2014.
Table 1.
Seasonal distribution of precipitation, ET, surface runoff and base flow in Pengchongjian small watershed from 1983 to 2014.
| Parameters | Spring | Summer | Autumn | Winter | Year |
|---|---|---|---|---|---|
| Precipitation/mm | 564.6 | 589.7 | 199.3 | 206.7 | 1560.3 |
| Annual proportion/% | 36.2% | 37.8% | 12.8% | 13.2% | --- |
| ET/mm | 218.0 | 272.2 | 168.8 | 153.0 | 811.9 |
| Annual proportion/% | 26.9% | 33.5% | 20.8% | 18.8% | --- |
| Surface runoff/mm | 354.8 | 300.9 | 34.3 | 53.7 | 743.7 |
| Annual proportion/% | 47.7% | 40.5% | 4.6% | 7.2% | --- |
| Base flow/mm | 159.9 | 131.2 | 19.1 | 43.0 | 353.2 |
| Annual proportion/% | 45.3% | 37.1% | 5.4% | 12.2% | --- |
Table 2.
Slopes of the relations between year and cumulative quantities of ET (K1,2), surface runoff (K3,4), base flow (K’3,4) and contribution rates of ET to surface runoff and base flow decrease.
Table 2.
Slopes of the relations between year and cumulative quantities of ET (K1,2), surface runoff (K3,4), base flow (K’3,4) and contribution rates of ET to surface runoff and base flow decrease.
| Slope (mm·year−1) | Spring | Summer | Autumn | Winter | Whole Year |
|---|---|---|---|---|---|
| K1 | 213.6 | 260.2 | 152.7 | 146.9 | 773.4 |
| K2 | 229.7 | 289.1 | 165.5 | 176.6 | 860.9 |
| ΔKET | 0.075 | 0.111 | 0.084 | 0.202 | 0.113 |
| K3 | 381.1 | 353.9 | 26.2 | 62.8 | 831.9 |
| K4 | 280.9 | 248.1 | 18.7 | 26.7 | 588.9 |
| ΔKSR | −0.263 | −0.299 | −0.286 | −0.575 | −0.292 |
| K’3 | 166.5 | 150.1 | 18.2 | 49.5 | 384.3 |
| K’4 | 136.7 | 118 | 14.2 | 24.1 | 293.7 |
| ΔKB | −0.179 | −0.214 | −0.220 | −0.513 | −0.236 |
| CET to surface runoff (%) | 28.5 | 37.1 | 29.4 | 35.1 | 38.7 |
| CET to base flow (%) | 41.9 | 51.9 | 38.2 | 39.4 | 47.9 |
Note: ΔKET, ΔKSR, ΔKB is the variation rate of slopes of ET, surface runoff and base flow compared to baseline period, respectively.
Table 3.
Calculating results of contribution rates of precipitation variation and vegetation restoration to surface runoff decrease.
Table 3.
Calculating results of contribution rates of precipitation variation and vegetation restoration to surface runoff decrease.
| Time Scale | Simulated Mean Surface Runoff (mm) | Observed Mean Surface Runoff (mm) | Impact of Precipitation Variation | Impact of Vegetation Restoration | ||
|---|---|---|---|---|---|---|
| Variation (mm) | Contribution (%) | Variation (mm) | Contribution (%) | |||
| Spring | 322.1 | 280.9 | −59.0 | 42.1 | −41.2 | 29.4 |
| Summer | 278.2 | 248.1 | −75.7 | 45.0 | −30.1 | 17.9 |
| Autumn | 23.0 | 18.7 | −3.2 | 30.1 | −4.3 | 40.5 |
| Winter | 53.5 | 26.7 | −9.3 | 16.7 | −26.8 | 48.2 |
| Year | 693.2 | 588.9 | −138.7 | 35.0 | −104.3 | 26.3 |
Note: The observed mean surface runoff during baseline period is 381.1, 353.9, 26.2, 62.8 and 831.9 mm in spring, summer, autumn, winter and whole year respectively.
Table 4.
Calculated results of contribution rates of precipitation variation and vegetation restoration to base flow decrease.
Table 4.
Calculated results of contribution rates of precipitation variation and vegetation restoration to base flow decrease.
| Time Scale | Simulated Mean Base Flow (mm) | Observed Mean Base Flow (mm) | Impact of Precipitation Variation | Impact of Vegetation Restoration | ||
|---|---|---|---|---|---|---|
| Variation (mm) | Contribution (%) | Variation (mm) | Contribution (%) | |||
| Spring | 149.5 | 136.7 | −17.0 | 33.1 | −12.8 | 25.0 |
| Summer | 123.9 | 118.0 | −26.2 | 39.3 | −5.9 | 8.8 |
| Autumn | 15.6 | 14.2 | −2.6 | 40.2 | −1.4 | 21.6 |
| Winter | 39.3 | 24.1 | −10.2 | 24.3 | −15.2 | 36.3 |
| Year | 341.8 | 293.7 | −42.5 | 24.4 | −48.1 | 27.7 |
Note: The observed mean base flow during baseline period is 166.5, 150.1, 18.2, 49.5 and 384.3 mm in spring, summer, autumn, winter and whole year respectively.
© 2018 by the authors. Licensee MDPI, Basel, Switzerland. This article is an open access article distributed under the terms and conditions of the Creative Commons Attribution (CC BY) license (http://creativecommons.org/licenses/by/4.0/).
Share and Cite
MDPI and ACS Style
Ouyang, L.; Liu, S.; Ye, J.; Liu, Z.; Sheng, F.; Wang, R.; Lu, Z. Quantitative Assessment of Surface Runoff and Base Flow Response to Multiple Factors in Pengchongjian Small Watershed. Forests 2018, 9, 553. https://doi.org/10.3390/f9090553
AMA Style
Ouyang L, Liu S, Ye J, Liu Z, Sheng F, Wang R, Lu Z. Quantitative Assessment of Surface Runoff and Base Flow Response to Multiple Factors in Pengchongjian Small Watershed. Forests. 2018; 9(9):553. https://doi.org/10.3390/f9090553
Chicago/Turabian StyleOuyang, Lei, Shiyu Liu, Jingping Ye, Zheng Liu, Fei Sheng, Rong Wang, and Zhihong Lu. 2018. "Quantitative Assessment of Surface Runoff and Base Flow Response to Multiple Factors in Pengchongjian Small Watershed" Forests 9, no. 9: 553. https://doi.org/10.3390/f9090553
Note that from the first issue of 2016, this journal uses article numbers instead of page numbers. See further details here.