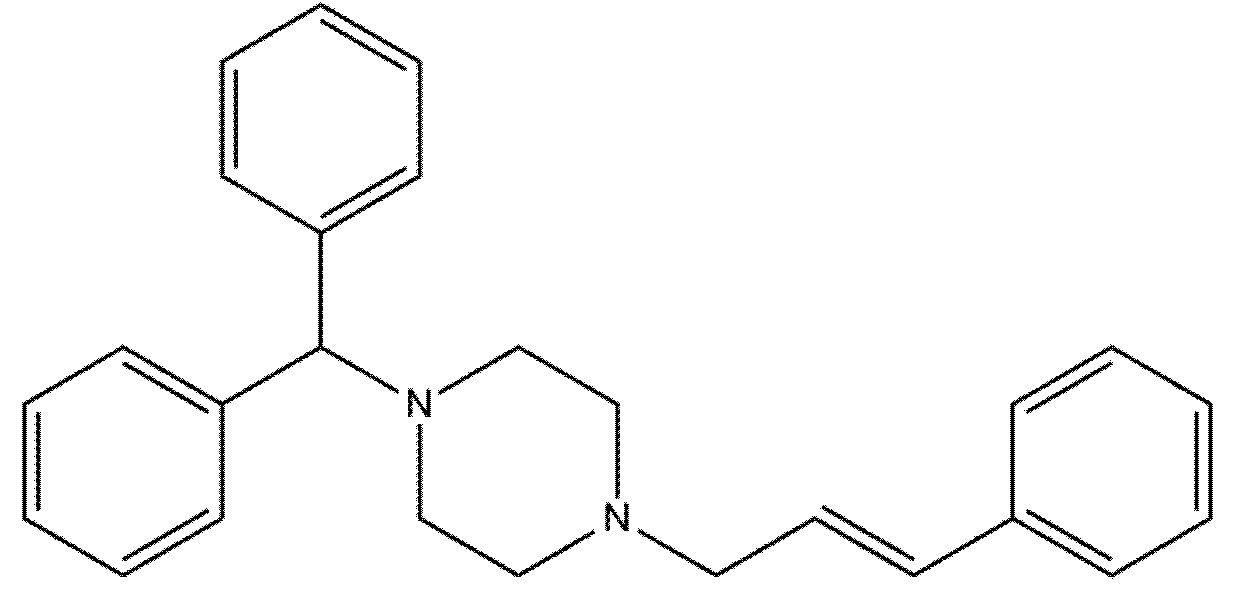
Cinnarizine was used as a model drug compound in the present study. Cinnarizine is an interesting model drug to use in SNEDDSs due to its relatively high lipid solubility (
Table 5) and a low and variable bioavailability. The bioavailability of cinnarizine from a conventional capsule and from an aqueous suspension formulation has been determined previously to be 0.8% ± 0.4% and 8% ± 4% in dogs (
n = 4, mean ± SEM), respectively [
21].
3.1. Selection of Excipients
The selection of excipients was motivated by the need to develop SNEDDSs with well-defined compositions. Therefore, only excipients with compositions were selected wherein the components could be analyzed, and/or where lipolysis in the gastro-intestinal tract can be considered to be minor.
Sesame oil was selected as the main lipid component of the SNEDDSs. Sesame oil is a vegetable oil used in food and can also be purchased as a Ph. Eur. grade product.
Oleic acid was selected because cinnarizine has a high solubility in oleic acid [
22]. The properties of oleic acid vary with pH. The pK
a value of oleic acid in water is 9.85 [
23], but the apparent pK
a shifts to lower values when oleic fatty acid is incorporated into mixed bile acid/phospholipid micelles (pK
a 6.5) [
24]. The properties of ionized and protonated oleic acid are very different. Above the pK
a, oleic acid acts like a conventional ionic hydrophobic surfactant whereas below the pK
a, the properties of oleic acid resemble oil and oil droplets are formed when oleic acid is mixed with water [
25]. For this reason, oleic acid is believed to behave like oil in the SNEDDSs at low pH (e.g., fasted stomach) and as a co-surfactant at neutral pH (e.g., fed stomach and fasted/fed intestine).
Cremophor RH40 was selected as the main hydrophilic surfactant. It has previously been used in SMEDDS formulations e.g., the marketed Sandimmune Neoral and Kaletra [
26]. The components present in Cremophor RH40 include amphiphilic mono-, di- and tri-fatty acid (hydroxystearic acid) esters of polyethoxylated glycerol and polyethylenoxide, and in addition non-fatty acids esterified materials including glycerol polyoxyethylene ether and free polyethylene glycol [
27]. Cremophor RH40 has a HLB between 14 and 16, and the CMC is reported to be 0.039%
w/
v [
28].
In vitro lipolysis studies have shown that Cremophor RH40 is only hydrolysed to a minor extent (7.5%) [
27]. In contrast, other surfactants are substrates for lipases
in vitro e.g., Cremophor EL [
27] and Labrafil M2125CS [
29]. The use of hydrolysable surfactants results in the generation of a very complex mixture of lipolysis products during lipolysis. Such complex mixtures are difficult to mimick in mechanistic studies without the use of enzymes. Due to the limited lipolysis of the surfactant mixture in Cremophor RH40, it is expected to pass the gastrointestinal tract basically unaltered, resulting in a less complicated system.
Brij 97 was selected as an add-on surfactant. Brij 97 is a polyethylene monooleyl glycol ether and belongs to the group of polyoxyethylene alkyl ethers which are non-ionic surfactants [
28]. Brij 97 is called an add-on surfactant here since it is in fact not a co-surfactant, because by definition a co-surfactant is a surface active agent that lowers the interfacial energy, but it cannot form micellar aggregates by itself [
30]. Brij 97 is a hydrophilic surfactant with a HLB of 12.4 [
28] and a CMC of 0.22 mM [
31]. Brij 97 is a non-digestible surfactant [
27] and is therefore expected to pass the gastrointestinal tract unaltered.
As hydrophilic co-solvents, PEG400 and ethanol were included in the formulations. Both can increase the solubility of the drug compound in the preconcentrate. They were included to aid the dispersion of the preconcentrate in an aqueous environment [
32]. Furthermore, ethanol was used to obtain a homogeneous preconcentrate. A maximum of 10% of each co-solvent was used, since it is well known that co-solvents lose their solubilization capacity after dispersion of the system because they dilute into the aqueous continuum [
32]. As a result, the drug compound may precipitate.
3.2. Miscibility of Excipients and Identification of Nanoemulsifying Mixtures
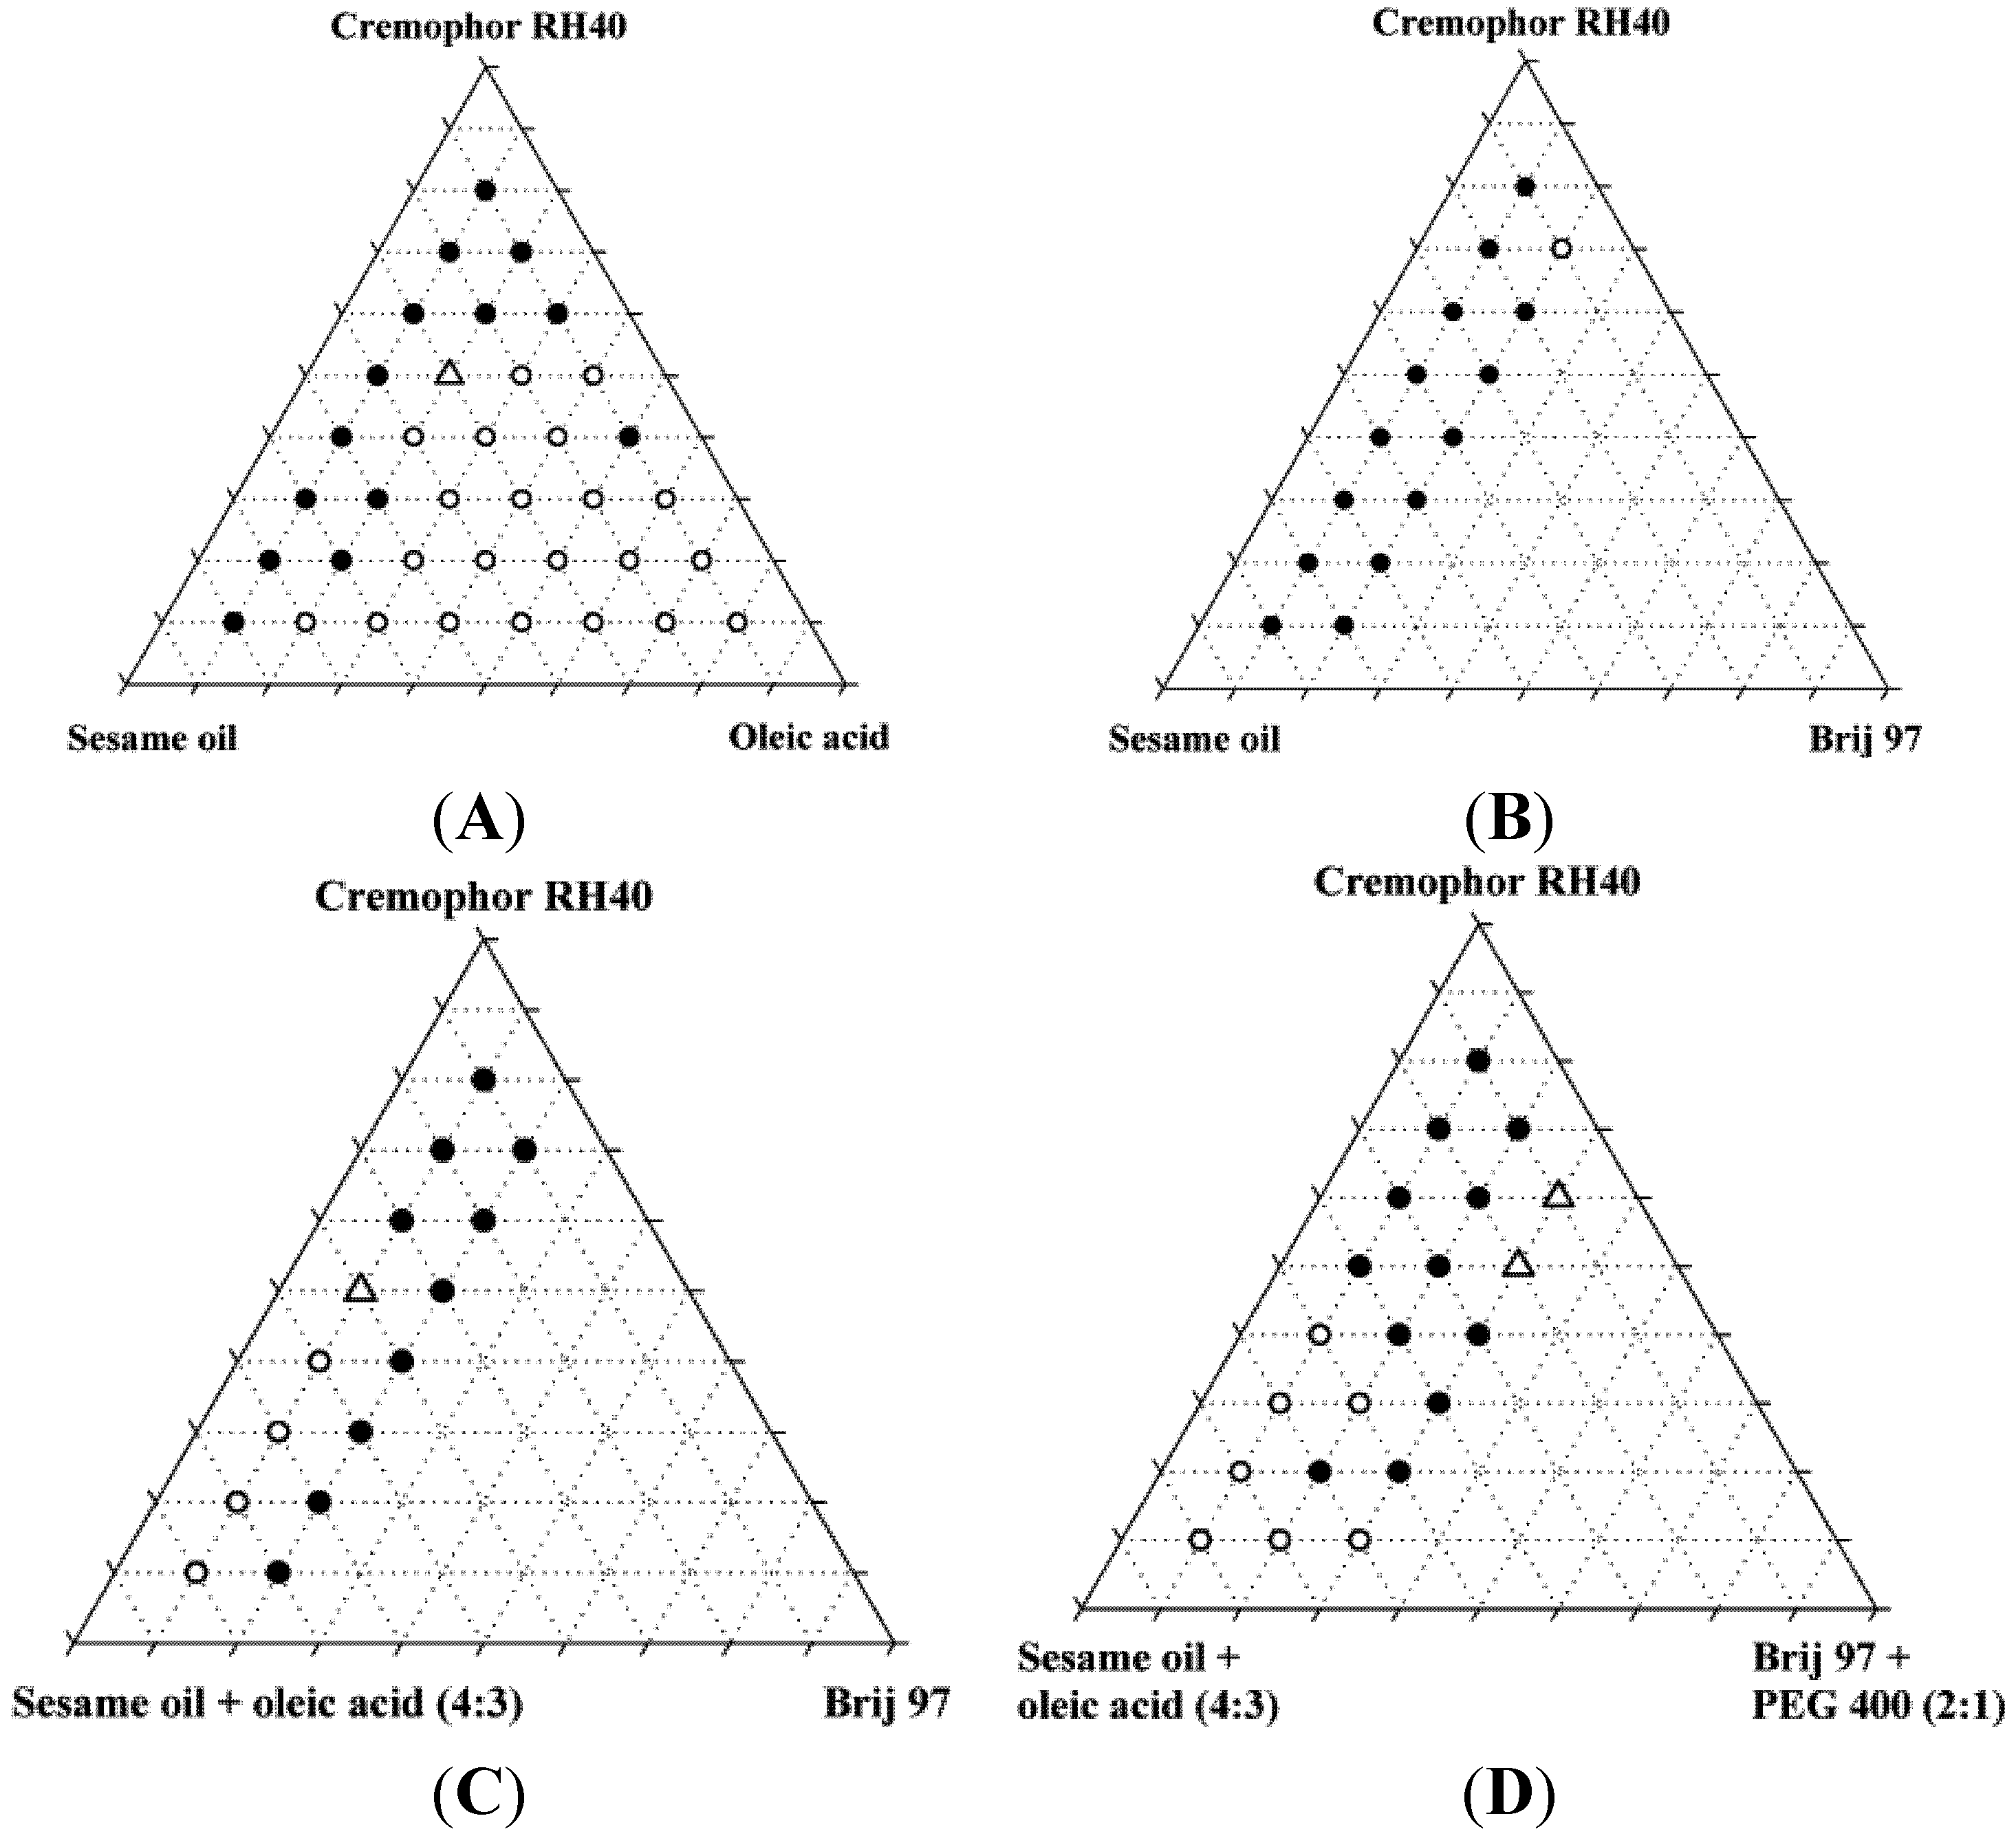
The miscibility of the excipients in the four systems was investigated and additionally, the miscibility of the systems was investigated after addition of 10% (
w/
w) ethanol (
Figure 2). A maximum content of 20% Brij 97 and 10% PEG400 was selected due to toxicity considerations and the risk of precipitation, respectively.
The miscibility of the excipients was poor in the absence of ethanol. Only two of the original 87 mixtures were homogeneous, and neither of these two mixtures was found to form nanoemulsions upon dispersion; instead, they formed coarse emulsions with a milky appearance. Upon addition of 10% ethanol, the number of homogeneous mixtures increased to 37 out of 87 of which four were found to form nanoemulsions when diluted with water. Ethanol is generally a good solvent for lipids and in the present study, it was able to increase the solubility of the lipids and surfactants in each other. Ternary diagrams where the points represent the mixtures investigated, are shown in
Figure 2.
Figure 2.
Miscibility of SNEDDS excipients depicted in pseudo-ternary diagrams. Additionally, these mixtures all contained 10% w/w ethanol. Solid circles are inhomogeneous mixtures, open circles are homogeneous mixtures, open triangles are homogeneous mixtures that forms nanoemulsions in water at a concentration of 1% (w/w).
The reason for the relatively low number of homogeneous mixtures forming nanoemulsions was probably that co-surfactants e.g., 2-monoacylglycerides [
26] were not used in the development of these SNEDDSs. The use of a co-surfactant can reduce the surface tension and reduce the bending stress of the interface, which aids the formation of nanoemulsions [
33,
34]. Furthermore, the area of nanoemulsion forming mixtures of oil, surfactant and co-surfactant in triangular diagrams is smaller when long chain triglycerides are used as compared with medium chain triglycerides [
35,
36].
The compositions of the four homogeneous mixtures (SNEDDSs) that were able to form nanoemulsions are shown in
Table 4. Hereafter these systems are referred to as SNEDDS I, SNEDDS II, SNEDDS III, and SNEDDS IV. None of these four SNEDDSs fit into the Lipid Formulation Classification System (LFCS) put forward by Pouton 2006 [
12], either they have too high a content of hydrophilic surfactant or too high a content of oil to fit into the various classes. Problems with assigning lipid-based formulations into the LFCS have been reported previously [
26] and this emphasizes the complexity of lipid-based drug delivery systems.
3.3. Solubility of Cinnarizine in SNEDDSs, Excipients and Buffer
The solubilities of cinnarizine in SNEDDS I-IV, sesame oil and oleic acid are shown in
Table 5. The solubility of cinnarizine in 100 mM TRIS maleate buffer was 0.39 ± 0.1 µg/mL (
n = 3). The solubility of cinnarizine in oleic acid obtained in this study (335 ± 3 mg/g at 37 °C) was somewhat higher than the solubility reported in a previous study (237 mg/g at 25 °C) [
22]. The difference in temperature between these two measurements may cause the observed difference. Additionally a probable explanation is that oleic acid is a product of natural origin and therefore variations in composition between different suppliers may be expected. The oleic acid used in this study is 90% pure whereas the European Pharmacopeia specifies an oleic acid content between 65% to 88%.
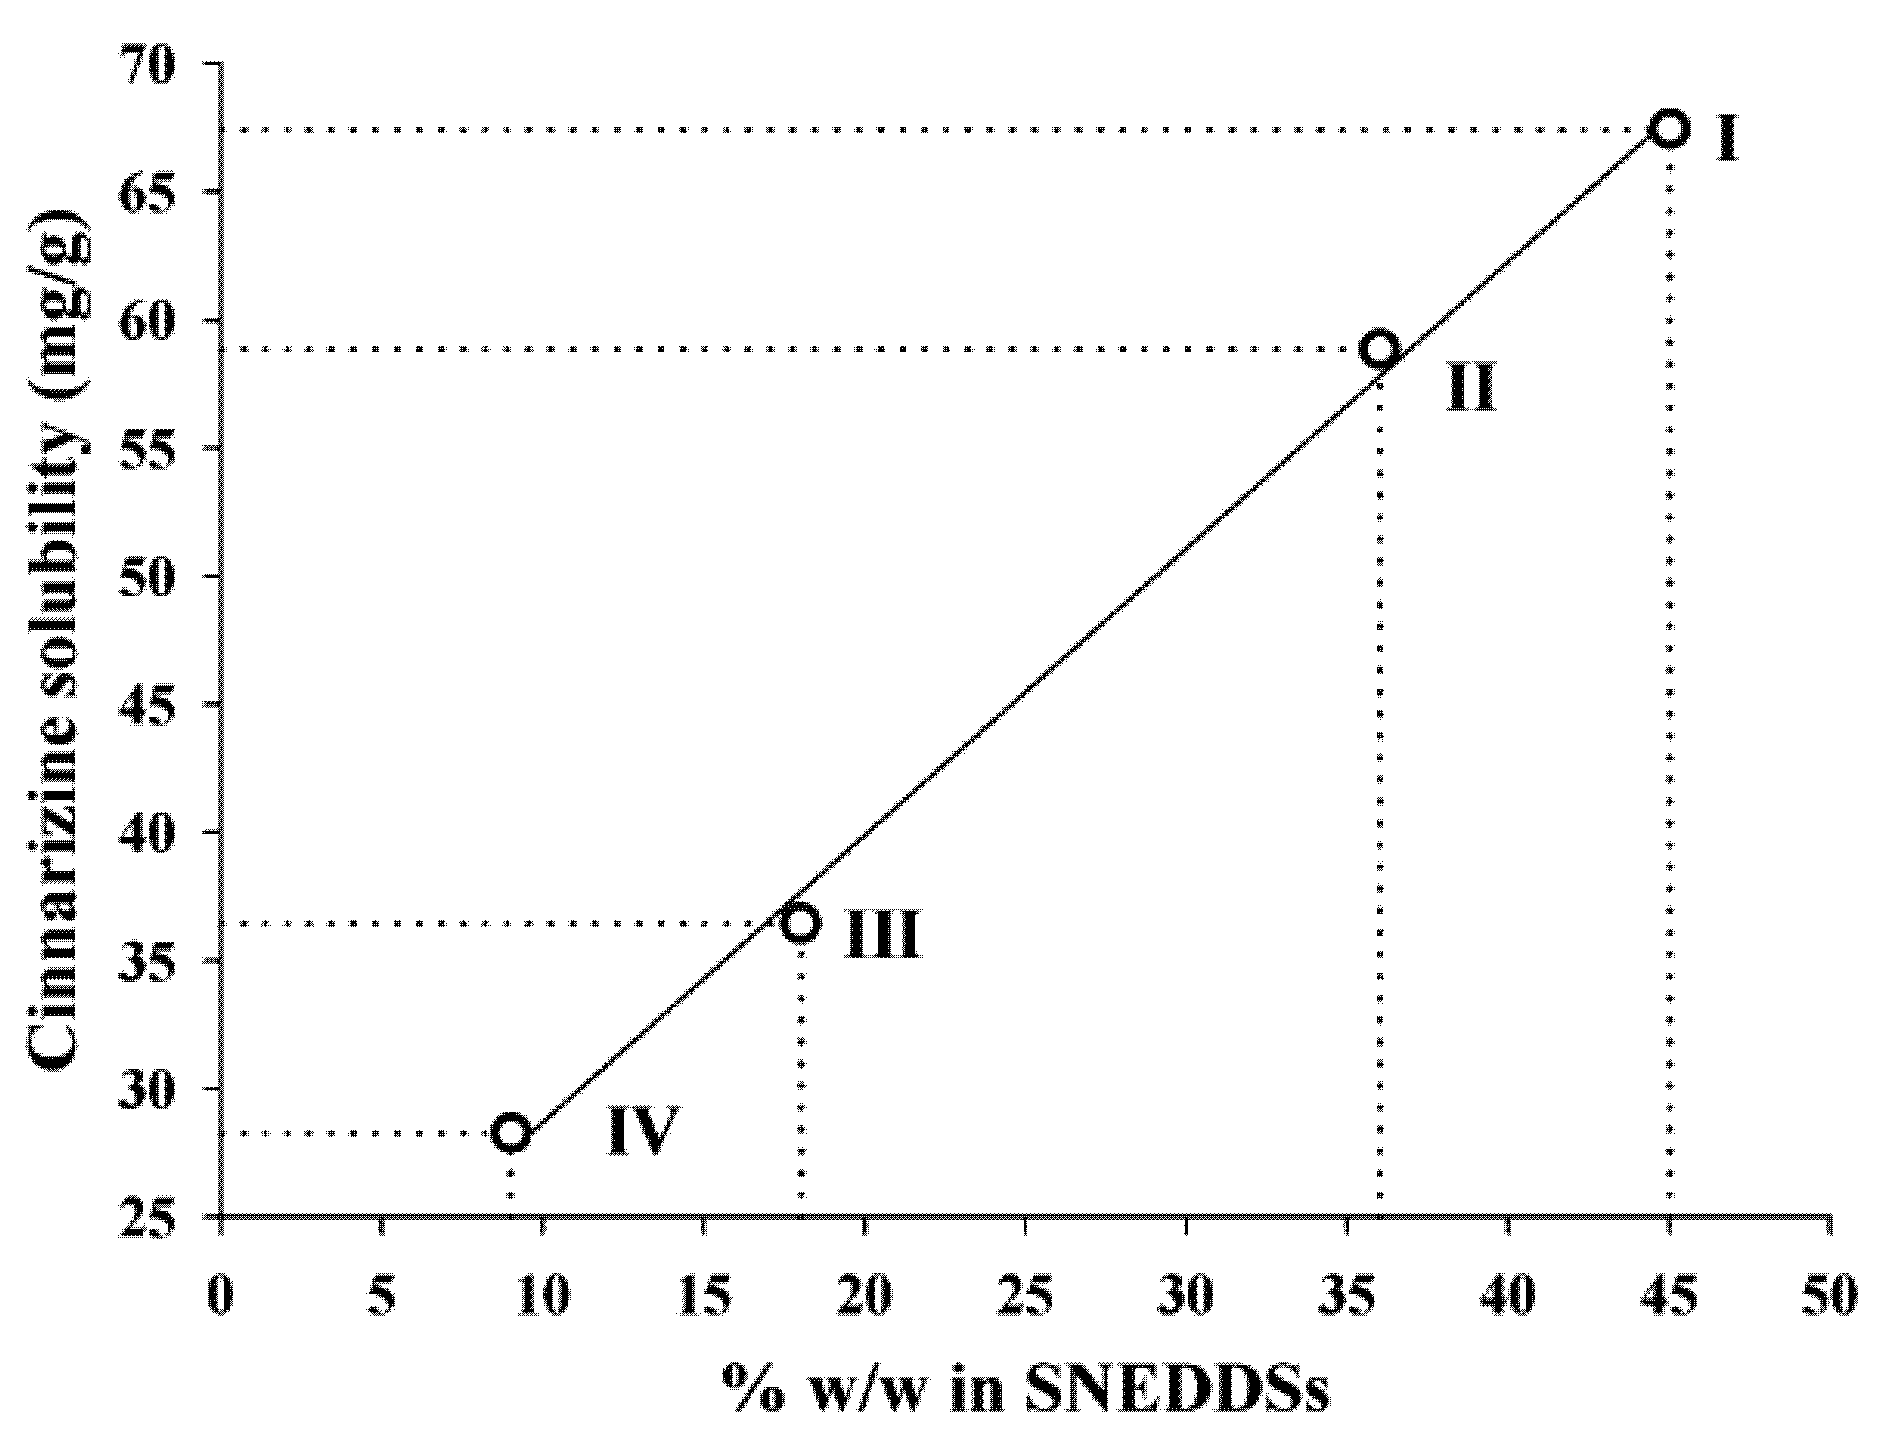
The solubility of cinnarizine in the SNEDDSs was linearly dependent on the total lipid content in the SNEDDSs (
Figure 3). The correlation coefficients (
r2) of the relation between solubility and amount of oleic acid + sesame oil were 0.997. Sesame oil and oleic acid are the most lipophilic excipients in the four SNEDDSs. Due to the lipophilic nature of cinnarizine (log P
Oct/W 5.77 [
16]), these two excipients are important solvents of cinnarizine. However, due to the high solubility of cinnarizine in oleic acid this is probably the excipient that has the most significant impact on cinnarizine solubility in the SNEDDSs. The lipids are not expected to loose their capacity to keep cinnarizine in solution upon dispersion of the SNEDDSs because they are insoluble in water.
Figure 3.
Relation between the cinnarizine solubility in SNEDDS at 25 °C and the total amount (% w/w) of lipid (sesame oil + oleic acid content), r2 = 0.997.
Figure 3.
Relation between the cinnarizine solubility in SNEDDS at 25 °C and the total amount (% w/w) of lipid (sesame oil + oleic acid content), r2 = 0.997.
3.4. Colloidal Dispersion of SNEDDSs
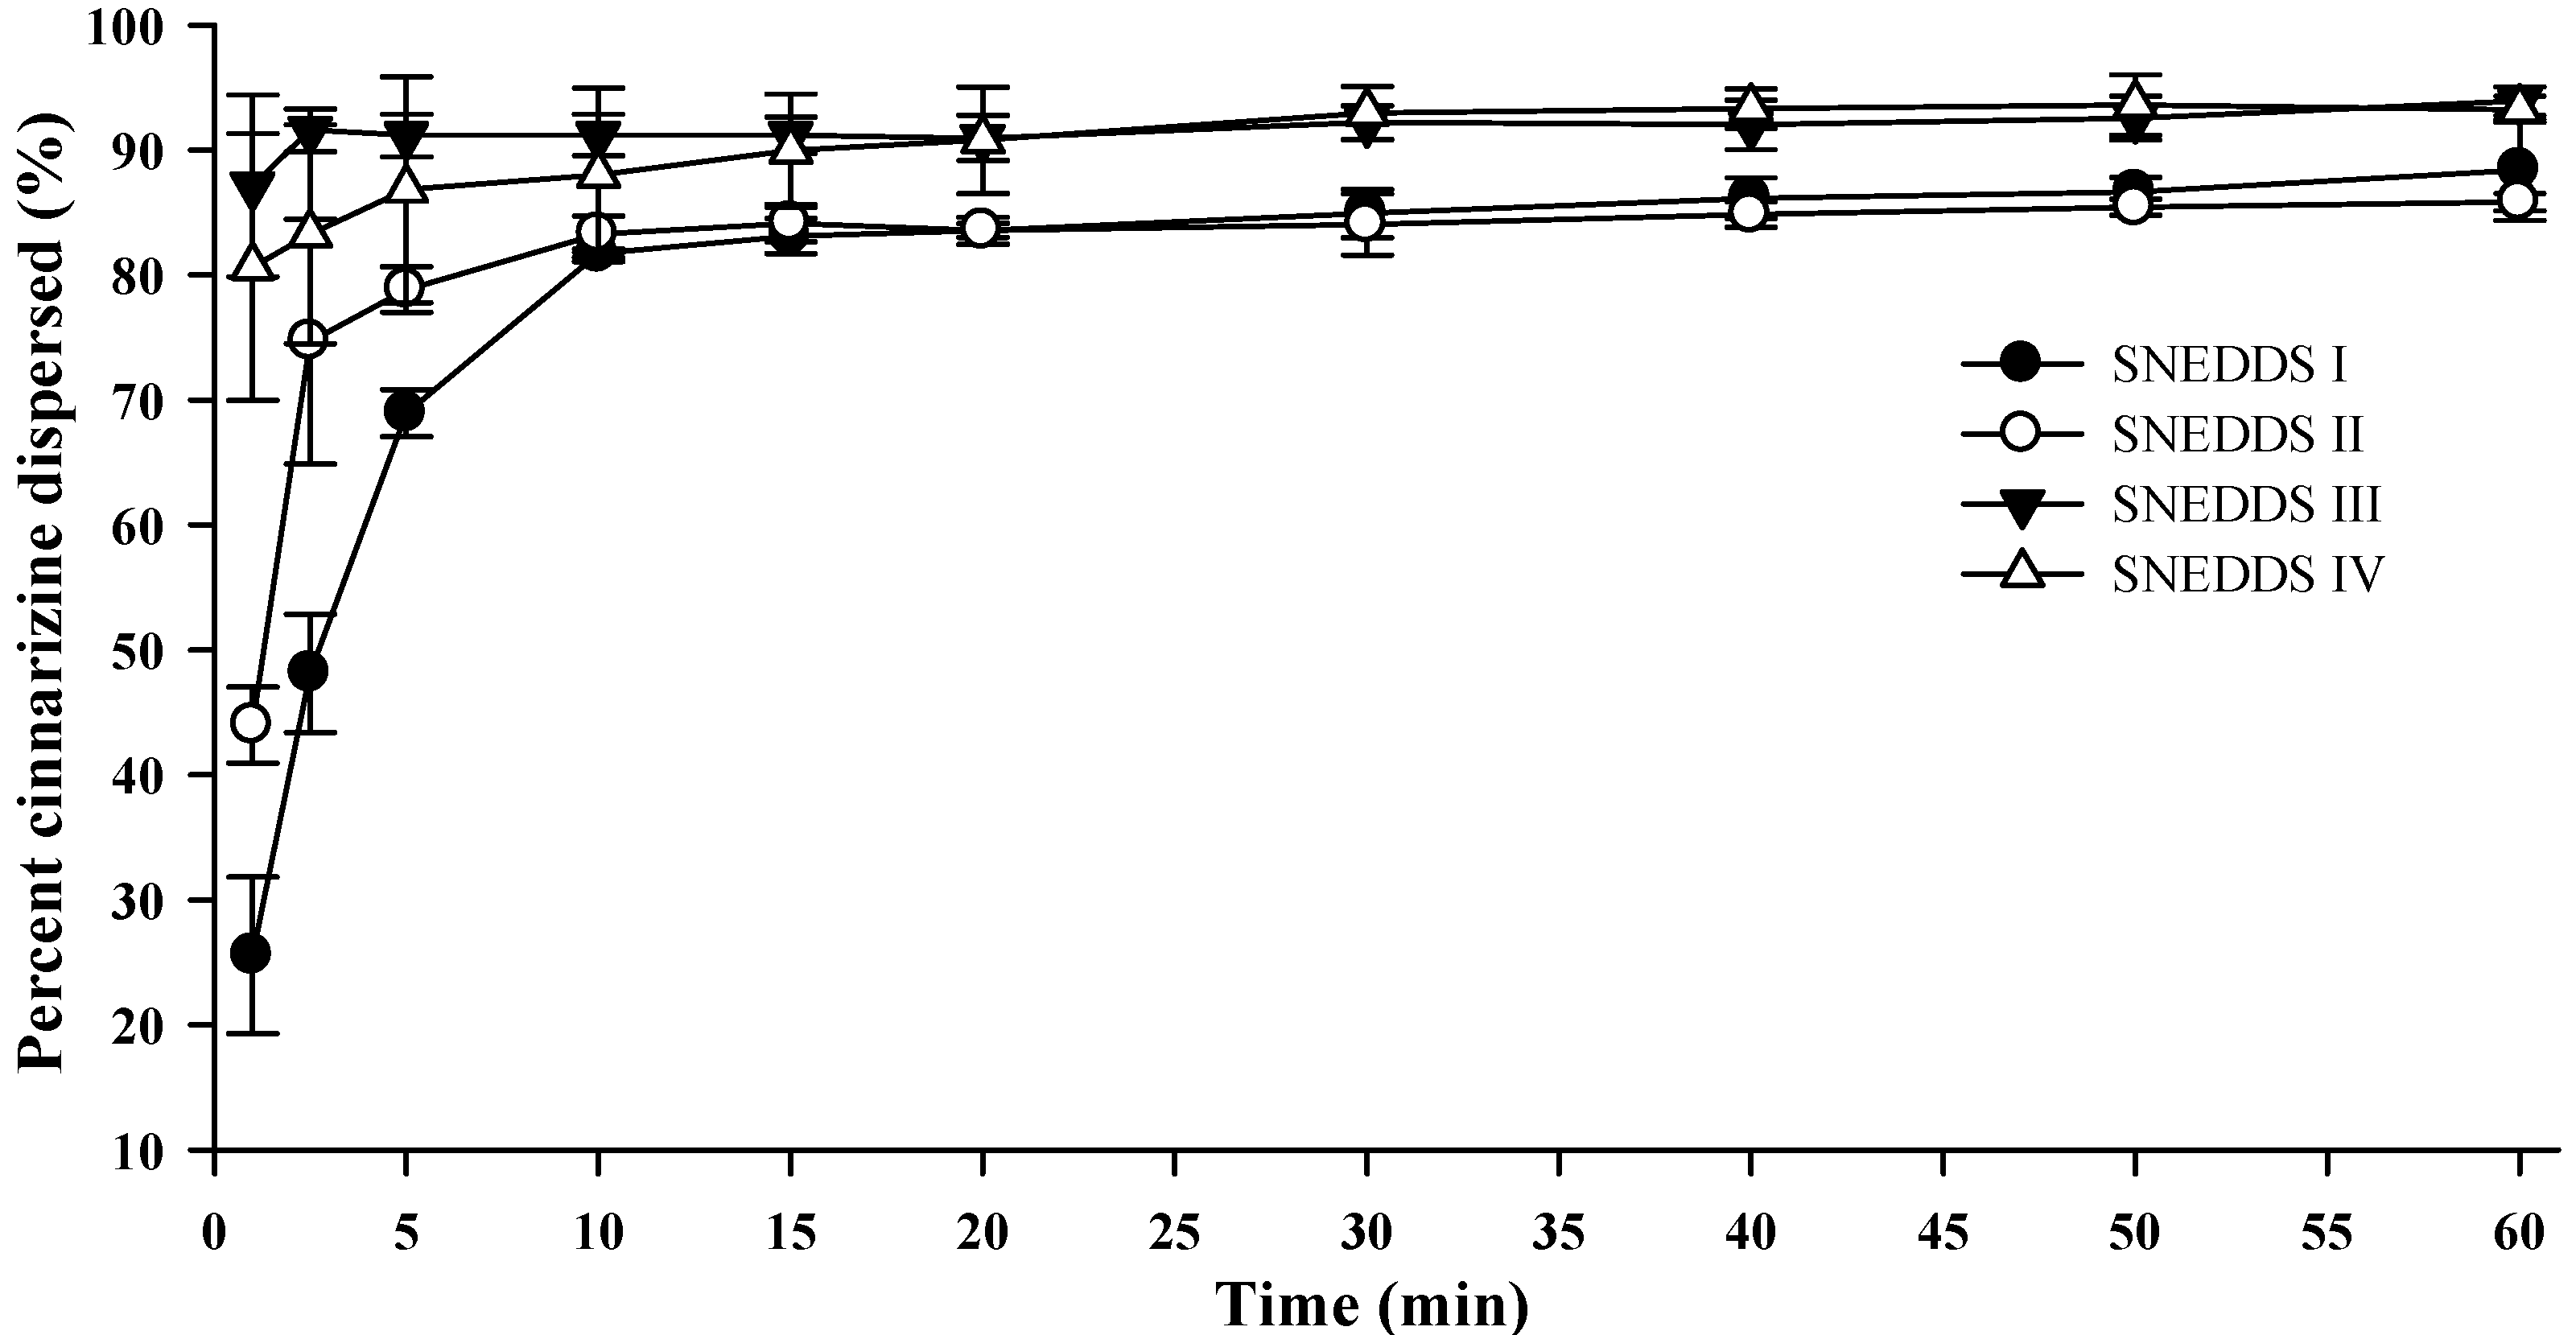
Upon colloidal dispersion of SNEDDSs in FaSSGF (pH 1.6), cinnarizine was dispersed quickly and efficiently (
Figure 4). Eighty percent of the dose was dispersed within 10 min for all four SNEDDSs. Precipitation of cinnarizine was not observed during the experiment (60 min) as was expected due to the high solubility of cinnarizine in water at low pH (853 µg/mL, pH 1.3 [
37]). The release of cinnarizine was fastest from SNEDDSs III and IV and followed by SNEDDSs II and I, in that order. The dispersion time, defined as the time where formulation was no longer visible in the dissolution vessel, was 9.7 ± 1.5, 10.3 ± 2.0, 1.7 ± 0.6, and 1.8 ± 0.4 min (average ± S.D.,
n = 3) for SNEDDS I, II, III and IV, respectively. The faster dispersion of SNEDDS III and IV can be attributed to the higher content of hydrophilic surfactants and/or the addition of the co-solvent PEG 400. The dispersion time will be a function of the ease of emulsification, which is affected by how well water can penetrate the surface of the SNEDDS [
36].
Figure 4.
Dispersion of cinnarizine during dispersion of 1 g SNEDDS containing 25 mg cinnarizine per gram in fasted state simulated gastric fluids at pH 1.6 and 37 °C (n = 3).
Figure 4.
Dispersion of cinnarizine during dispersion of 1 g SNEDDS containing 25 mg cinnarizine per gram in fasted state simulated gastric fluids at pH 1.6 and 37 °C (n = 3).
3.5. Droplet Sizes of SNEDDSs
The droplet size of the four SNEDDSs dispersed at 2%, 1% and 0.4% (
w/
w), in 100 mM TRIS maleate buffer (pH 6.5) was measured by DLS. Data confirmed that nanoemulsions were formed in the dispersion range investigated and that the developed systems were SNEDDSs since the droplet size was unaffected by the level of dispersion (data not shown). Distinguishing between SNEDDSs and SMEDDSs is controversial and subject to debate in the literature [
38]. However, two tests can be performed to distinguish between nano- and microemulsions. First of all, the degree of dispersion of nanoemulsions does not impact droplet size and droplet distribution, whereas microemulsions change droplet size distribution with dispersion degree, and destruction of the one phase system can be observed [
8]. Secondly the formation of nanoemulsions is dependent on the order of mixing of the components, surfactants and oil have to be premixed before mixing with water [
8]. Conversely, the order of mixing does not alter the outcome of the system for microemulsions. The droplet size of nanoemulsions and microemulsions lies in the same range (10 to 300 nm [
8,
39] in diameter) and the size can therefore not be used to distinguish between the two.
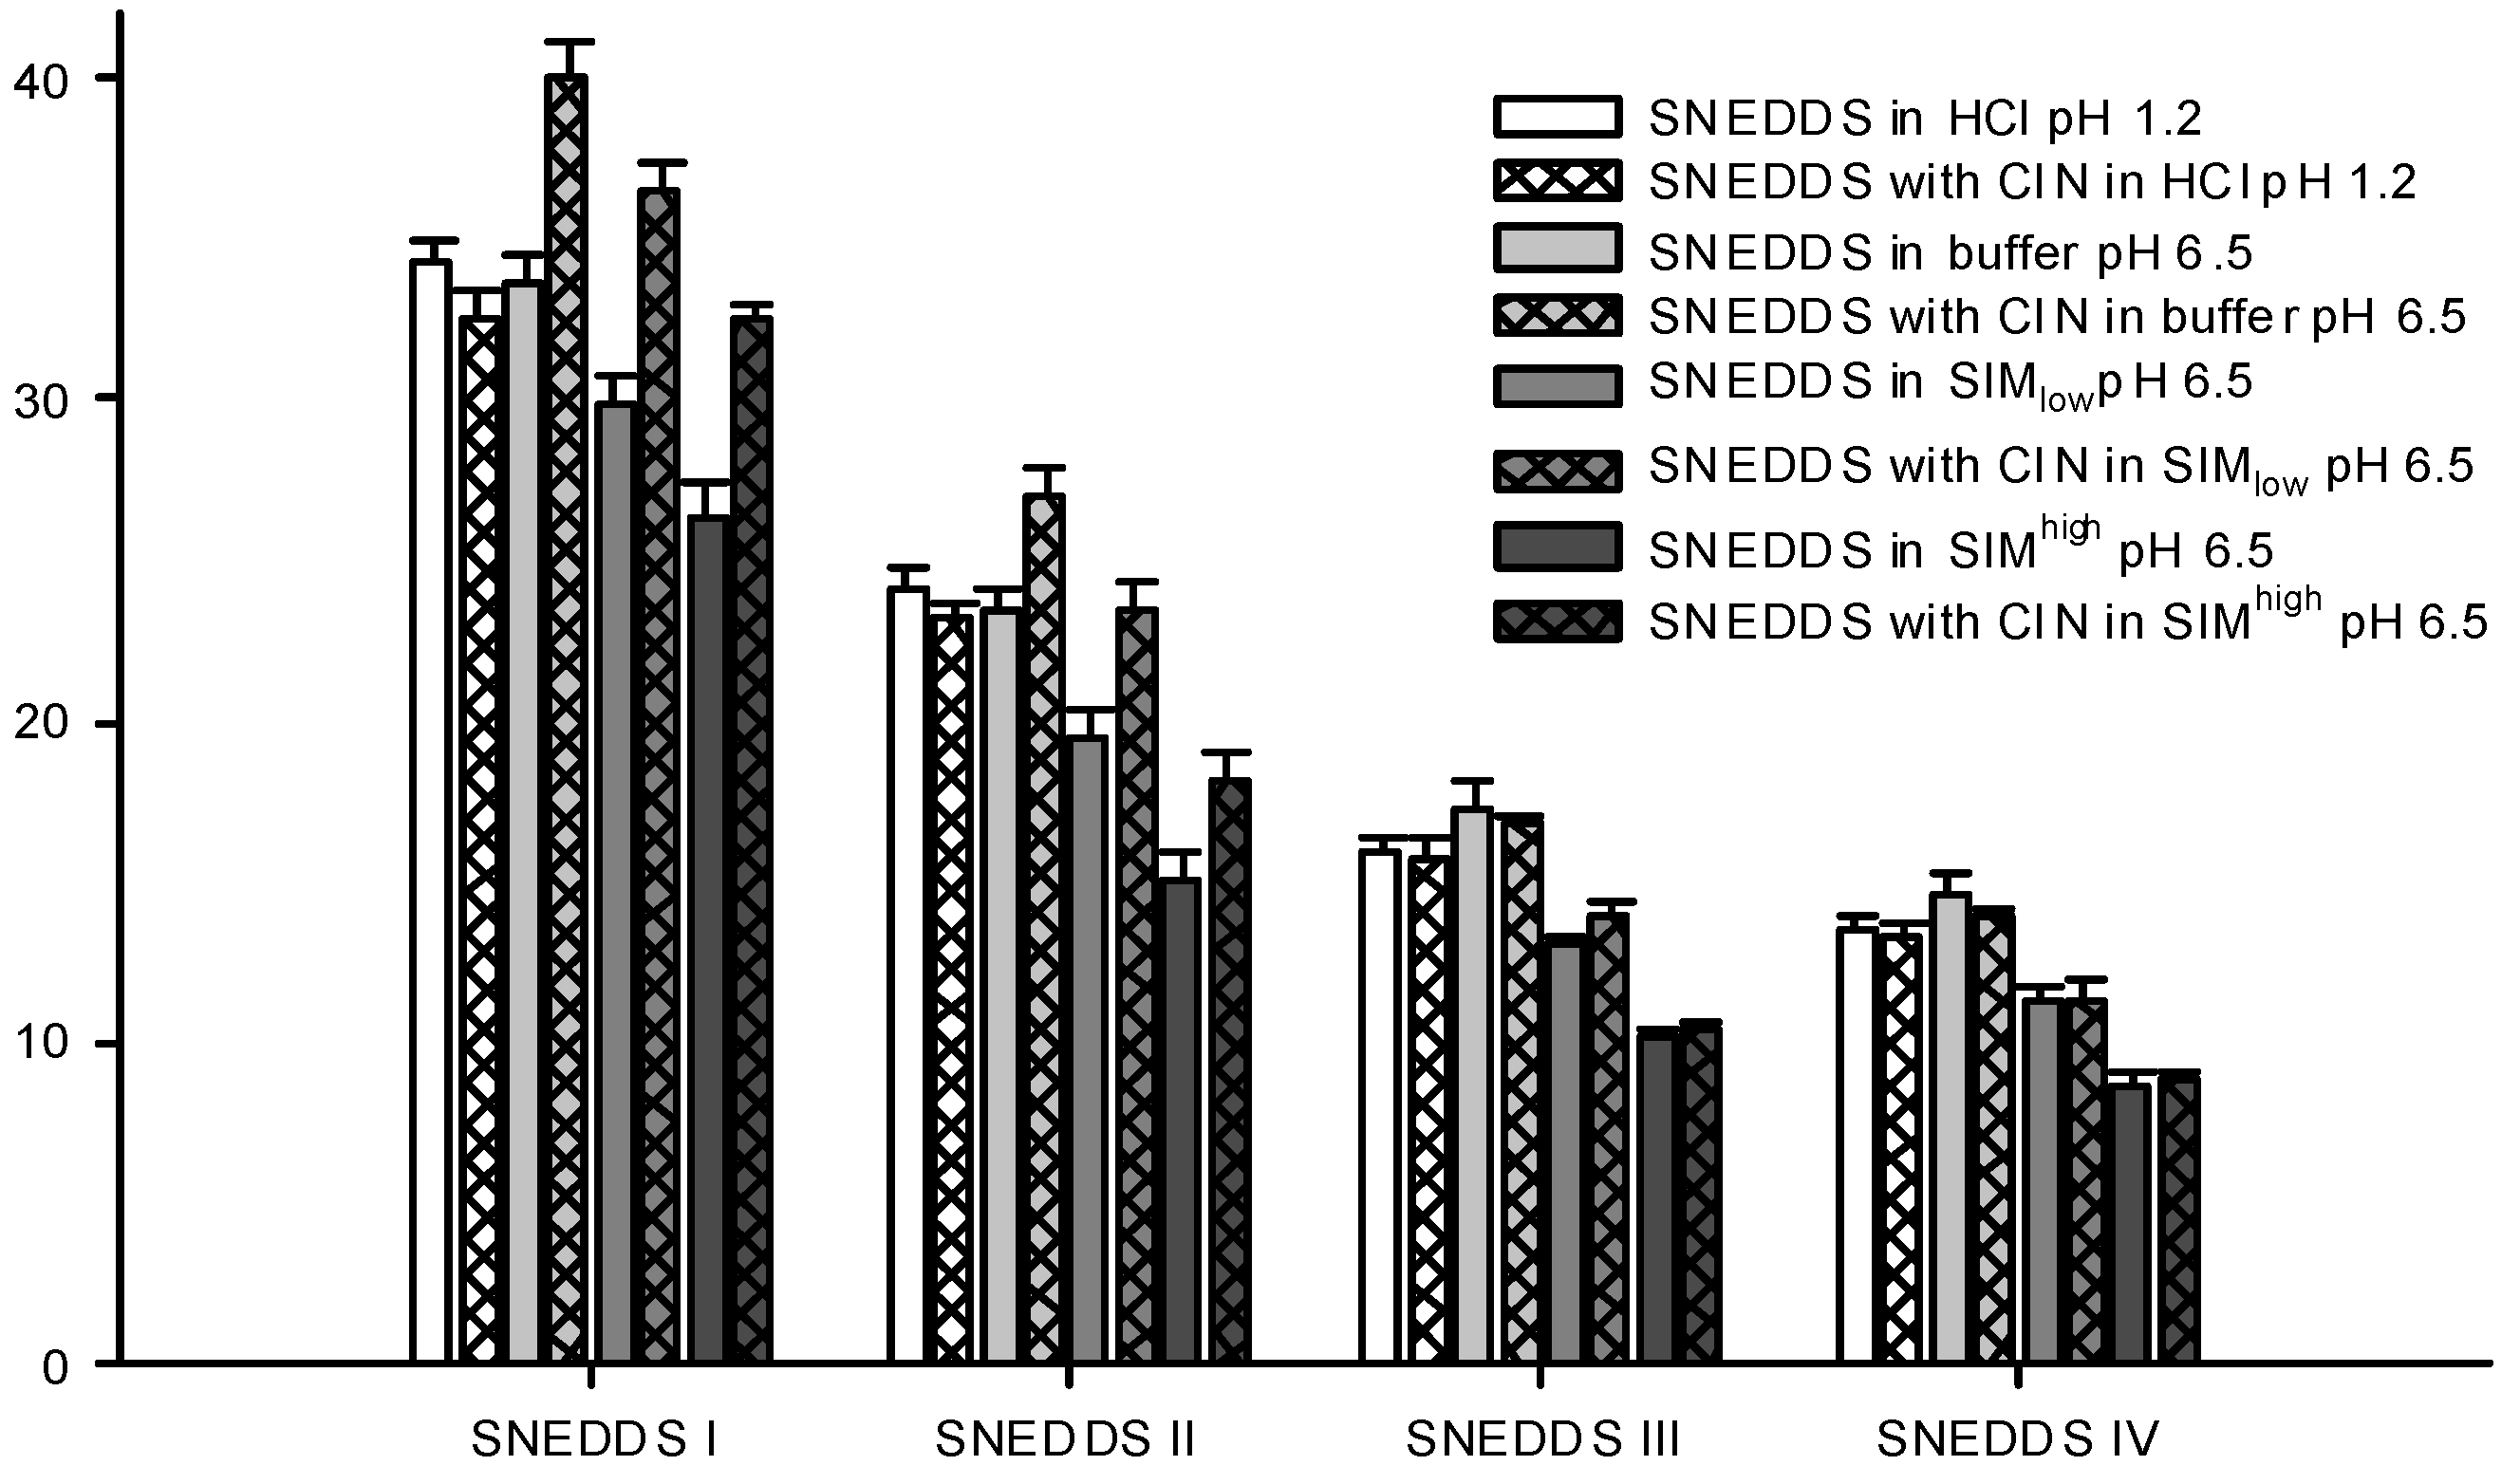
The droplet size distributions of the formed nanoemulsions differed between the four SNEDDSs. SNEDDS III and IV formed the smallest nanoemulsion droplets and their sizes were in the same range, whilst SNEDDS I formed the largest droplets (
Figure 5). This difference in size between the different formulations was consistent across all dispersion media. Apparently, larger amounts of lipid in the formulation produced larger droplet sizes and when lipid was replaced by surfactant smaller droplet sizes were obtained. This is consistent with previous investigations where a decrease in droplet size was observed with an increase in the surfactant to lipid ratio [
40,
41,
42].
Table 6 shows the PDI values for the droplet size measurements shown in
Figure 5 and generally when SNEDDSs were dispersed in buffer and HCl the PDI values were low indicating a monomodal droplet distribution. A relation between the droplet sizes of the dispersed SNEDDSs and the cinnarizine dispersion (
Figure 4) was evident. Cinnarizine disperses fastest from SNEDDSs III and IV and these also have the smallest droplet size. This is probably an effect of the higher content of surfactants in these two SNEDDSs, which facilitate fast emulsification and the formation of smaller droplet sizes.
Figure 5.
Particle sizes of formed nanoemulsions in various media determined by DLS. SNEDDSs with cinnarizine (25 mg/g SNEDDS) and without cinnarizine were dispersed in the media, 1% (w/w) at 37 °C. The bars represent mean ± SD (n = 3), between two and four measurements obtained on each sample.
Figure 5.
Particle sizes of formed nanoemulsions in various media determined by DLS. SNEDDSs with cinnarizine (25 mg/g SNEDDS) and without cinnarizine were dispersed in the media, 1% (w/w) at 37 °C. The bars represent mean ± SD (n = 3), between two and four measurements obtained on each sample.
Table 6.
Obtained polydispersity indexes from the droplet size measurements shown in
Figure 5.
Table 6.
Obtained polydispersity indexes from the droplet size measurements shown in Figure 5.
| Media | PDI (Polydispersity Index) |
|---|
| | SNEDDS I | SNEDDS II | SNEDDS III | SNEDDS IV |
| SNEDDS in HCl pH 1.2 | 0.052 ± 0.006 | 0.088 ± 0.014 | 0.033 ± 0.006 | 0.030 ± 0.006 |
| SNEDDS with cinnarizine in HCl pH 1.2 | 0.093 ± 0.012 | 0.039 ± 0.006 | 0.078 ± 0.008 | 0.071 ± 0.017 |
| SNEDDS in buffer pH 6.5 | 0.054 ± 0.009 | 0.040 ± 0.012 | 0.043 ± 0.018 | 0.059 ± 0.024 |
| SNEDDS with cinnarizine in buffer pH 6.5 | 0.056 ± 0.008 | 0.047 ± 0.008 | 0.025 ± 0.005 | 0.099 ± 0.061 |
| SNEDDS in SIMlow pH 6.5 | 0.097 ± 0.018 | 0.139 ± 0.058 | 0.223 ± 0.089 | 0.175 ± 0.040 |
| SNEDDS with cinnarizine in SIMlow pH 6.5 | 0.080 ± 0.022 | 0.118 ± 0.023 | 0.178 ± 0.034 | 0.144 ± 0.031 |
| SNEDDS in SIMhigh pH 6.5 | 0.147 ± 0.016 | 0.158 ± 0.006 | 0.140 ± 0.049 | 0.168 ± 0.015 |
| SNEDDS with cinnarizine in SIMhigh pH 6.5 | 0.113 ± 0.010 | 0.158 ± 0.007 | 0.225 ± 0.038 | 0.117 ± 0.032 |
Differences in droplet size were not observed between the measurements at pH 1.2 (0.1 M HCl) and 6.5 (100 mM buffer) despite oleic acid becoming partly ionized at pH 6.5. One explanation to this could be that there is no difference between ionized and non-ionized oleic acids distribution in the nanoemulsion droplets. This is in accordance with previous findings where oleic acid was associated with the surface of the emulsion droplets of a submicron-emulsion both in the ionized and un-ionized state [
43].
Sizes were measured for the dispersed SNEDDSs both with and without cinnarizine (25 mg cinnarizine per gram SNEDDS). Adding cinnarizine to the SNEDDSs increased the droplet size of SNEDDS I and II dispersed in buffer, SIM
low and SIM
high, whereas the droplet size measured after dispersion of SNEDDS III and IV seemed unaffected in all four media (
Figure 5). At pH 1.2, the addition of cinnarizine had no effect on the droplet size of any of the SNEDDSs. Cinnarizine has a high solubility at pH 1.2, but a low solubility in the buffer at pH 6.5; at the former pH it has two positive charges and at the latter only one. Thus, more cinnarizine will distribute into the aqueous continuum at pH 1.2 and less will be dissolved inside the nanoemulsion droplets. As a result, cinnarizine takes up less space in the nanoemulsion droplets. This explanation has been confirmed by Pulsed Field Gradient NMR studies [
44]. It was found that the diffusion coefficient of cinnarizine in a nanoemulsion in HCl resembled the diffusion coefficient of a solution of cinnarizine in HCl. The preference of cinnarizine for the nanoemulsion droplets is smaller for SNEDDS III and IV due to their higher content of hydrophilic excipients.
Similar results regarding drug effect on droplet size increase have been reported in the literature; an increase in droplet size was observed with increasing drug loading for a microemulsion formulation containing nicardipine hydrochloride [
45] and in another study, increased droplet size of nanoemulsions was observed when the poorly soluble compound halofantrine was incorporated, whereas no change was observed with another poorly soluble compound, probucol [
41]. The increase in droplet size was only observed when the nanoemulsion containing halofantrine was dispersed in a media resembling SIM
high but not in saline. The difference in droplet size was only statistically significant for the nanoemulsion with the highest lipid content of the investigated nanoemulsions. Therefore, change in droplet sizes of nanoemulsions with incorporation of drug compound may depend on the dispersion media, the nature of the drug compound as well as on the nanoemulsion composition. The cause of the droplet size changes observed for cinnarizine incorporation in SNEDDS I and II, but not SNEDDS III and IV, is thus not clear. One explanation could be that more nanoemulsion droplets are available from SNEDDSs III and IV compared to I and II due to their smaller droplet size. As a result, fewer cinnarizine molecules are incorporated into each nanoemulsion droplet since the same number of cinnarizine molecules needs to get solubilized as the concentration of SNEDDS and cinnarizine is the same in the samples.
The droplet sizes of the SNEDDSs were determined in two different simulated intestinal media. One reflecting the fasted state SIM
low (5 mM bile acid) and one reflecting the fed state SIM
high (15 mM bile acid). These levels are in good agreement with the bile acid levels reported in man, ranging from 1.5 to 5.9 mM and 0.5 to 24 mM in the fasted and fed state, respectively [
46]. When the SNEDDSs were dispersed in SIM at pH 6.5, a decrease in droplet size was observed compared with plain buffer at pH 6.5 (
Figure 5). This decrease was observed both in the presence and absence of cinnarizine. Furthermore, the PDI values were increased as compared to SNEDDSs dispersed in buffer indicating a multimodal droplet size distribution (
Table 6). However, we were not able to obtain two distinct droplet sizes probably because their size distributions are overlapped. The decrease in droplet size of the dispersed SNEDDSs in simulated intestinal media is most likely caused by the solubilization of oleic acid by the mixed bile acid/phosphatidylcholine micelles thereby reorganizing oleic acid from the nanoemulsion droplets resulting in a decrease in droplet size. In addition, solubilization of cinnarizine into the mixed bile acid/phosphatidylcholine micelles can displace cinnarizine from the nanoemulsion droplets and thereby decrease the size of the droplets. This explanation is further supported by the observation of a more pronounced decrease in particle size observed in SIM
high at the higher bile acid level (15 mM) compared to SIM
low (5 mM). This finding is apparently in contrast with a previous study where a difference in droplet size of nanoemulsions was not observed when dispersed in saline and in simulated intestinal media [
41]. However, the nanoemulsions of the previous study contained a mixture of mono-, di-, and tri-glycerides as the lipid phase, which may be solubilized by mixed bile salt micelles to a lesser extent.
3.6. Cryo-TEM of SNEDDSs
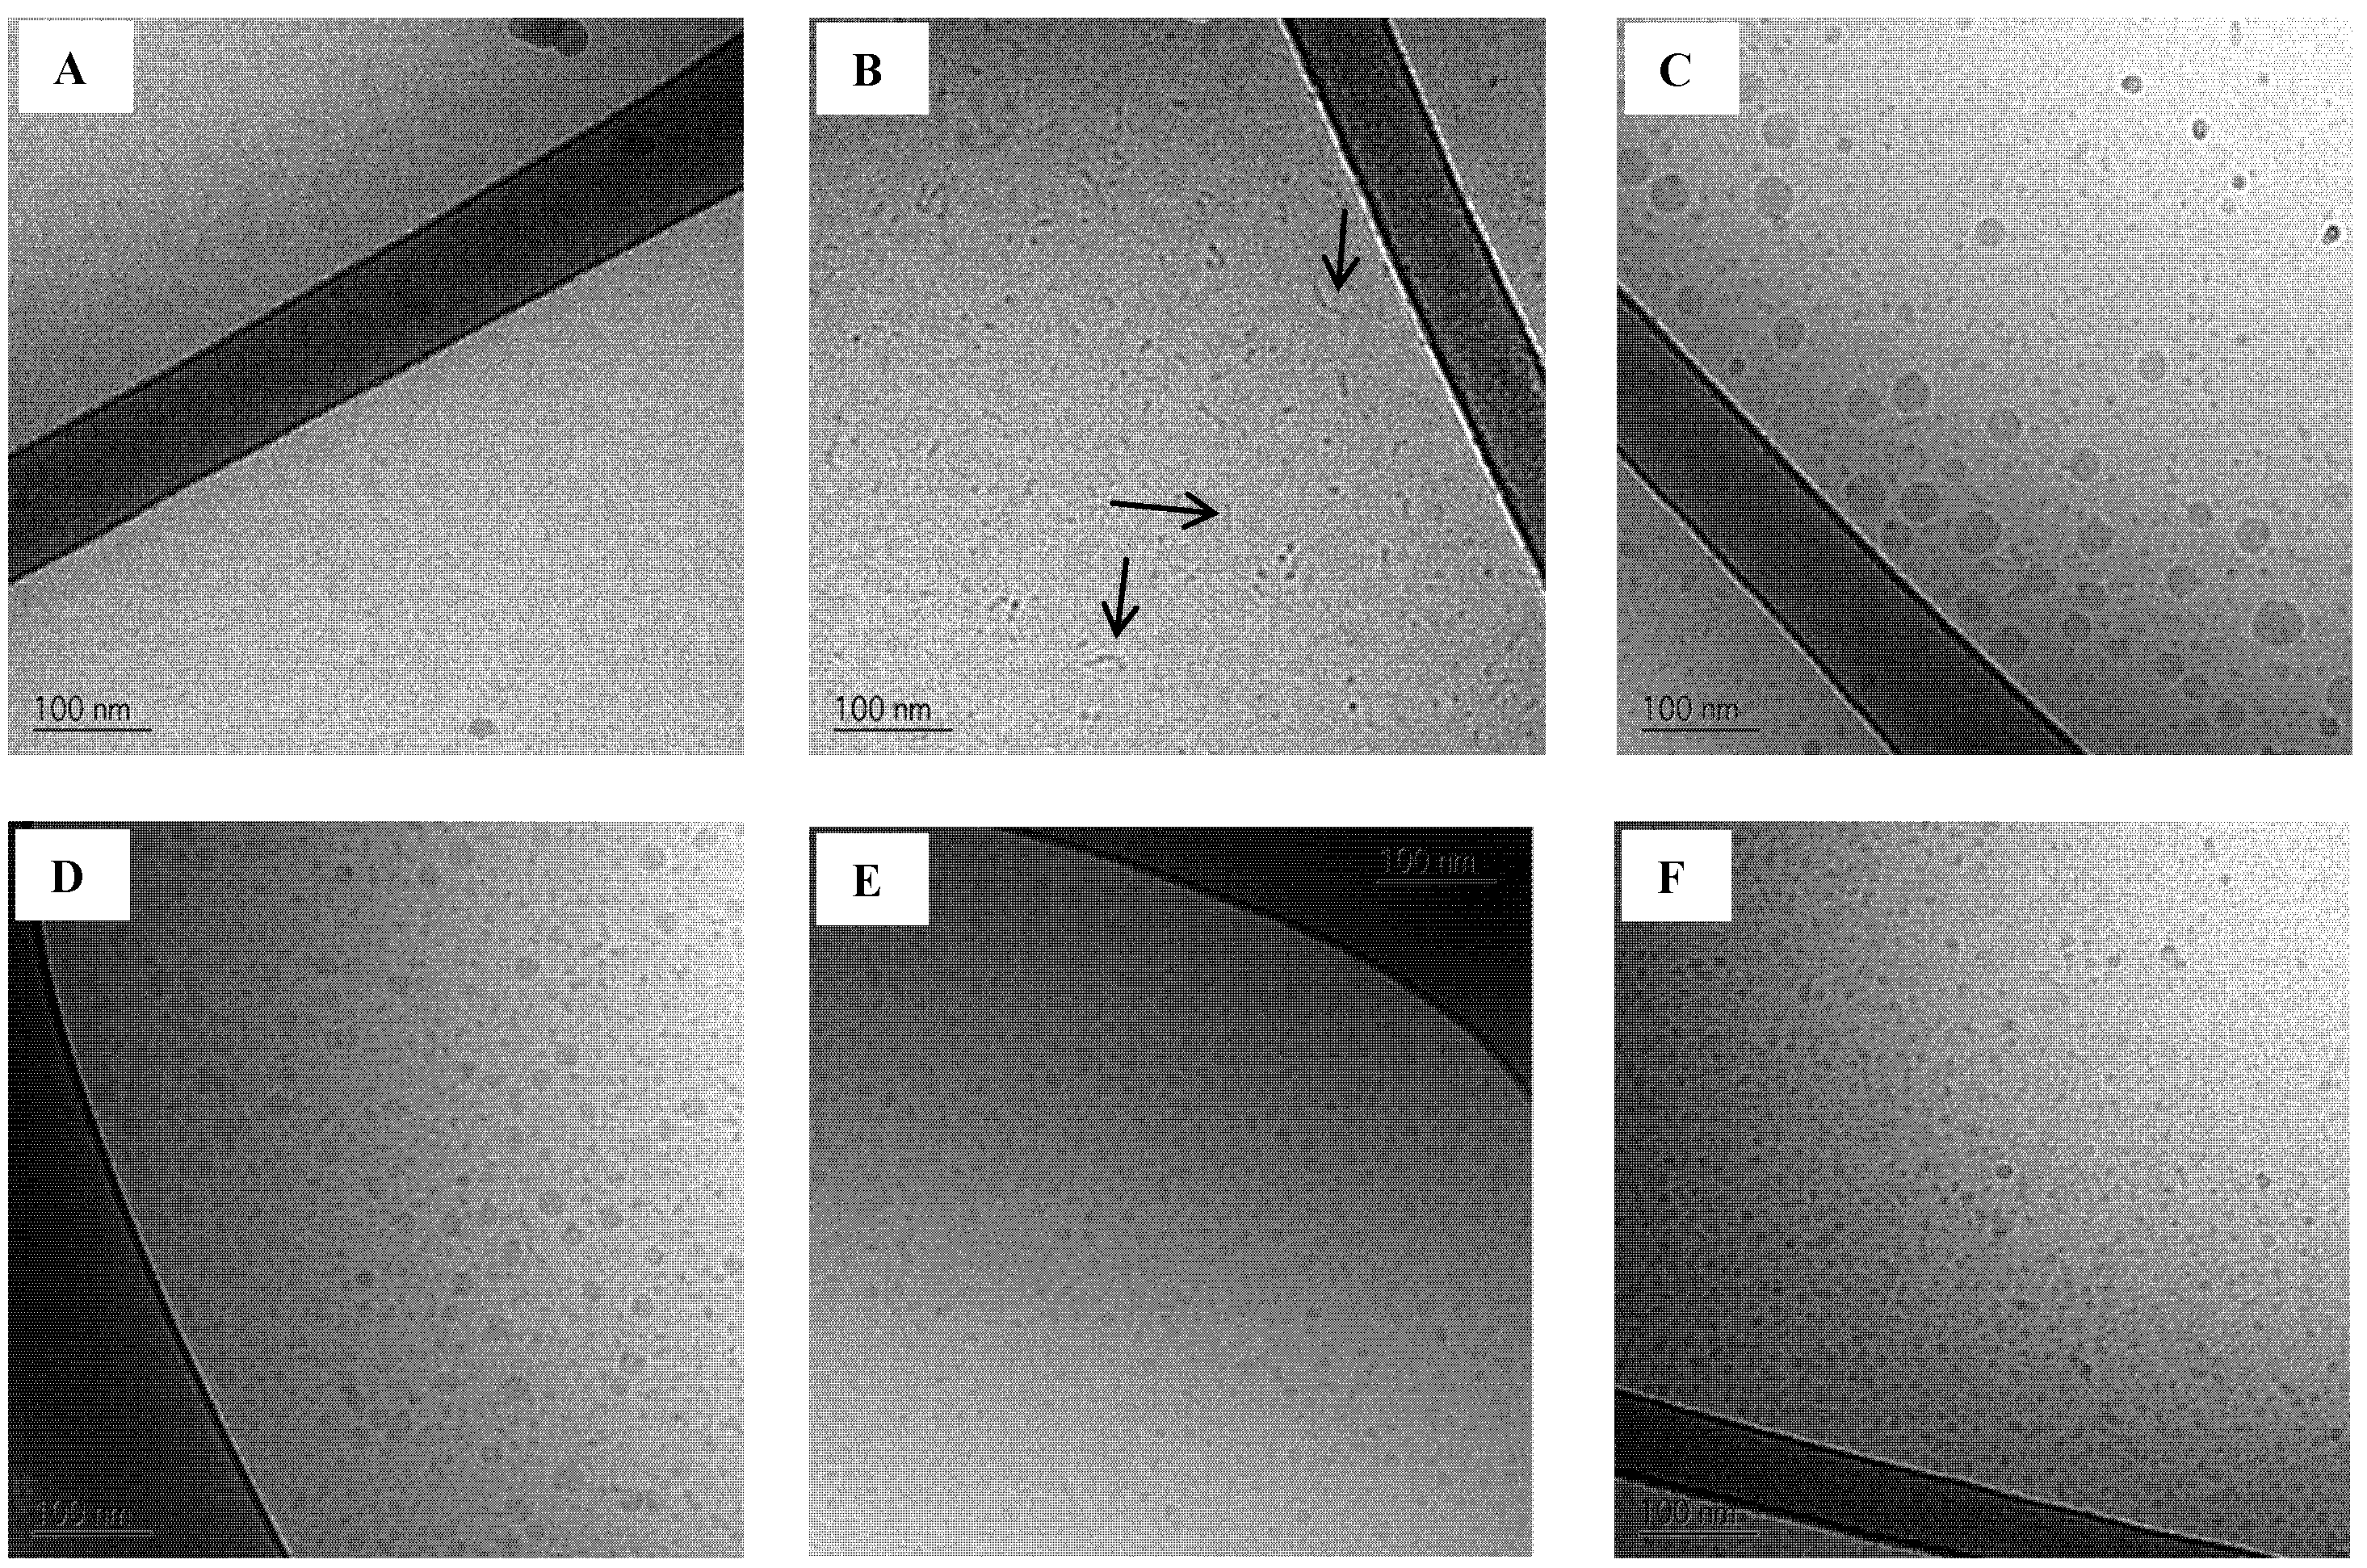
Cryo-TEM images of the four SNEDDSs dispersed in SIM
low (1%
w/
w) containing 5 mM sodium taurocholate and 1.25 mM phosphatidylcholine are shown in
Figure 6C–F. Images of plain buffer and SIM
low are also shown as background reference (
Figure 6A,B, respectively). SIM
low contains mixed taurocholate/phosphatidylcholine micelles and their rod like structure is evident on the image (
Figure 6B). The finding of rod like structures of bile acid and phospholipid micelles is in accordance with previous studies [
42,
43].
Figure 6.
Cryo-TEM images of background (A: trizma maleate buffer pH 6.5 and B: SIMlow pH 6.5, arrows are pointing at the rod like structures) and SNEDDSs dispersed (1% w/w) in SIMlow pH 6.5;C: SNEDDS I;D: SNEDDS II;E: SNEDDS III and F: SNEDDS IV).
Figure 6.
Cryo-TEM images of background (A: trizma maleate buffer pH 6.5 and B: SIMlow pH 6.5, arrows are pointing at the rod like structures) and SNEDDSs dispersed (1% w/w) in SIMlow pH 6.5;C: SNEDDS I;D: SNEDDS II;E: SNEDDS III and F: SNEDDS IV).
When SNEDDSs are dispersed in SIM
low there is no evidence of rod-like structures. This finding further strengthens the theory that surfactants from the SNEDDSs interact with the mixed micelles in the intestinal simulated media. The Cryo-TEM images of the SNEDDSs in SIM
low show for SNEDDS I and II the coexistence of two droplet size populations (
Figure 6C,D, respectively), whereas only one droplet size population is seen in SNEDDS III and IV (
Figure 6E,F). The existence of two distinct droplet size distributions was expected from the PDI values obtained from DLS measurements (see above). (
Table 6 and
Table 7). It is not uncommon to overlook the presence of smaller droplets when bigger droplets are present when using DLS [
47,
48]. Two droplet size populations were probably seen due to the presence of more surfactant than necessary to cover the surface of the lipid content. As a result, surfactant aggregates with a distinct droplet size are also present in the nanoemulsions formed from SNEDDSs I and II. From SNEDDSs III and IV the low content/amount of lipid forms nanoemulsion droplets in the same range of the surfactant aggregates and therefore two distinct sizes are not observed.
Table 7.
Droplet sizes of dispersed intact SNEDDS and SNEDDS composed of 50% or 100% mimicked digested sesame oil in SIM (1% (w/w). The SNEDDSs and the mimicked digested SNEDDSs contained 25 mg cinnarizine per gram. Measurements were performed at 37°C and the results are presented as the hydrodynamic diameter (nm)a,b.
| SNEDDS | Media | Population 1 | Population 2 | Population 3 | PDI |
|---|
| Size (mean ± SD)
c | % vol (range) | Size (mean ± SD)
c | % vol (range) | Size (mean ± SD)
c | % vol (range) | Mean ± SD |
|---|
| I | Intact in SIMlow | 36.4 ± 0.9 (10/10) | 100 | - | - | - | - | 0.080 ± 0.022 |
| | 50% digested in SIMlow | 18.9 ± 1.3 (10/10) | 99.2–100 | 668 ± 517 (5/10) | 0.1–0.7 | 4721 ± 474 (3/10) | 0.1 | 0.385 ± 0.168 |
| | 100% digested in SIMlow | 23.6 ± 1.4 (10/10) | 97.6–98.6 | 313 ± 47 (10/10) | 1.4–2.4 | - | - | 0.499 ± 0.057 |
| | Intact in SIMhigh | 32.4 ± 0.6 (9/9) | 100 | - | - | - | - | 0.113 ± 0.010 |
| | 50% digested in SIMhigh | 11.9 ± 2.3 (16/16) | 17.2–100 | 3.4 (2/16) | 14.4–82.8 | 71 ± 44 (3/16) | 0.1–4.6 | 0.960 ± 0.139 |
| | 100% digested in SIMhigh | 31.6 ± 4.7 (10/14) | 11.7–100 | 2.8 (1/14) | 74.1 | 10.2 ± 0.4 (8/14) | 25.9–100 | 0.190 ± 0.012 |
| II
d | Intact in SIMlow | 23.3 ± 1.1 (10/10) | 100 | - | - | | | 0.118 ± 0.023 |
| | 50% digested in SIMlow | 16.4 ± 1.0 (10/10) | 99.4–100 | 655 (1/10) | <0.1 | 3387 ± 1560 (9/10) | <0.1–0.6 | 0.223 ± 0.031 |
| | 100% digested in SIMlow | 24.2 ± 2.6 (7/7) | 98.6–99.3 | 605 ± 269 (7/7) | 0.7–1.4 | | | 0.313 ± 0.007 |
| | Intact in SIMhigh | 18.1 ± 1.1 (10/10) | 54.8–100 | 5.1 (2/10) | 27.4–45.2 | | | 0.158 ± 0.007 |
| | 50% digested in SIMhigh | 9.8 ± 0.4 (16/16) | 100 | - | - | - | - | 0.205 ± 0.083 |
| | 100% digested in SIMhigh | 9.1 ± 1.3 (10/10) | 86.2–100 | 26.0 (2/10) | 13.2–13.8 | 129 ± 7.8 (4/10) | 0.1–0.2 | 0.283 ± 0.022 |
| III | Intact in SIMlow | 13.9 ± 0.4 (10/10) | 100 | | | 4954 (2/10) | <0.1 | 0.178 ± 0.034 |
| | 50% digested in SIMlow | 12.2 ± 0.3 (10/10) | 99.9–100 | 581 ± 132 (3/10) | <0.1 | 4742 ± 649 (4/10) | <0.1 | 0.196 ± 0.055 |
| | 100% digested in SIMlow | 15.1 ± 2.3 (10/10) | 60.2–100 | 6.7 (1/10) | 39.8 | 2480 ± 2306 (8/10) | 0.1–0.2 | 0.341 ± 0.047 |
| | Intact in SIMhigh | 10.4 ± 0.3 (10/10) | 100 | - | - | | | 0.225 ± 0.038 |
| | 50% digested in SIMhigh | 8.7 ± 0.4 (7/7) | 100 | - | - | | | 0.184 ± 0.055 |
| | 100% digested in SIMhigh | 7.8 ± 0.2 (16/16) | 100 | - | - | - | - | 0.123 ± 0.045 |
| IV | Intact in SIMlow | 11.4 ± 0.5 (10/10) | 100 | - | - | - | - | 0.144 ± 0.031 |
| | 50% digested in SIMlow | 11.2 ± 0.2 (13/13) | 100 | | | 5161 ± 91 (3/13 | <0.1 | 0.218 ± 0.067 |
| | 100% digested in SIMlow | 10.5 ± 0.5 (13/13) | 99.9–100 | 334 ± 183 (6/13) | <0.1–0.1 | 5025 ± 369 (4/13) | <0.1 | 0.231 ± 0.084 |
| | Intact in SIMhigh | 8.8 ± 0.2 (13/13) | 100 | | | - | - | 0.117 ± 0.032 |
| | 50% digested in SIMhigh | 8.2 ± 0.2 (16/16) | 100 | - | - | - | - | 0.158 ± 0.058 |
| | 100% digested in SIMhigh | 7.8 ± 0.1 (12/12) | 100 | - | - | - | - | 0.147 ± 0.039 |
3.7. Triglyceride Composition in Sesame Oil
Knowledge of the composition of the sesame oil was required in order to mimic the composition of digested sesame oil. The fatty acid composition can vary with the origin of the oil [
49] and, furthermore, variations between different batches of sesame oil can be anticipated since it is a natural product. Two batches of sesame oil were analyzed and the composition of the sesame oils is shown in
Table 6. The fatty acids are designated as linoleic (L), oleic (O), palmitic (P), and stearic (S) acids. Combining these letters result in the different triglycerides, e.g., OOO is triolein. The composition of triglycerides in the two batches of sesame oil was practically identical; consequently, the results are shown together (
Table 8). The analysis was run in triplicate on each batch and as
Table 6 indicates, the method had a good repeatability. The chromatographic system was not able to distinguish between the triglycerides SOL and POO or between PSL and PPO. These compositions are therefore reported together. Since these triglycerides are only present in minor concentrations, it is not considered to have major impact on the results in the present study.
Table 8.
Composition of triglycerides in refined sesame oil. The fatty acids are designated as linoleic (L), oleic (O), palmitic (P), and stearic (S) acid.
Table 8.
Composition of triglycerides in refined sesame oil. The fatty acids are designated as linoleic (L), oleic (O), palmitic (P), and stearic (S) acid.
| Triglyceride | Compiled data
a |
|---|
| Mean ± SD (
n = 6) |
|---|
| LLL | 11.1 ± 0.14 |
| OLL | 20.1 ± 0.06 |
| PLL | 7.9 ± 0.08 |
| OOL | 20.6 ± 0.13 |
| POL | 10.9 ± 0.05 |
| PPL | 1.6 ± 0.02 |
| OOO | 14.5 ± 0.09 |
| SOL + POO | 7.2 ± 0.04 |
| PSL + PPO | 1.1 ± 0.01 |
| SOO | 3.8 ± 0.04 |
| SSL | 1.2 ± 0.02 |
3.9. Droplet Sizes of Mimicked Digested SNEDDSs
Table 7 shows the droplet sizes of intact and mimicked digested SNEDDS dispersed in SIM
low and SIM
high with cinnarizine determined by DLS. The changes in droplet size induced by digestion vary between the different SNEDDSs. In general, cinnarizine did not affect the changes in droplet size observed as a function of digestion and therefore only the data from measurements of SNEDDSs containing cinnarizine is included in the paper. The droplet sizes of the intact and mimicked digested SNEDDS dispersed in SIM
low and SIM
high without cinnarizine are enclosed as supplementary material and is available electronically.
SNEDDS I and II dispersed in SIMlow, displayed a larger droplet size compared to 50% and 100% mimicked digested SNEDDS, but going from 50% to 100% digestion the droplet size increased slightly. This was also seen for SNEDDS I in SIMhigh. In SIMhigh, the droplet size of SNEDDS II and III decreased when comparing intact to 50% mimicked digestion. However, further digestion (100%) did not change the droplet size. The droplet size of SNEDDS III in SIMlow had a tendency towards a decrease going from 0% to 50% mimicked digestion followed by a tendency to increase going from 50% to 100% mimicked digestion, similar to the observations for SNEDDS I and II. The droplet size in SNEDDS IV was not altered by digestion, probably due to its low content of the digestible excipient sesame oil.
In contrast to measurements made on intact SNEDDSs, measurements on mimicked digested SNEDDSs showed more than one droplet size population and the PDI values obtained from the measurements were generally high (
Table 7). It was mainly larger droplet sizes that represent a small volume fraction (%). These larger droplets do not appear in all measurements; however, they indicate changes in the nanoemulsion systems and formation of larger colloidal structures as a function of digestion. From
Table 7 it is seen that SNEDDS III and IV, containing the highest surfactant levels, do not form larger colloidal structures as a function of digestion when dispersed in SIM
high. This shows that the high level of taurocholic acid together with the surfactants of the formulation is able to solubilize the digestion products without the formation of larger colloidal structures. The low level of taurocholic acid is not sufficient to prevent the formation of larger colloidal structures from digested SNEDDSs III and IV.
3.10. Cryo-TEM of Mimicked Digested SNEDDS
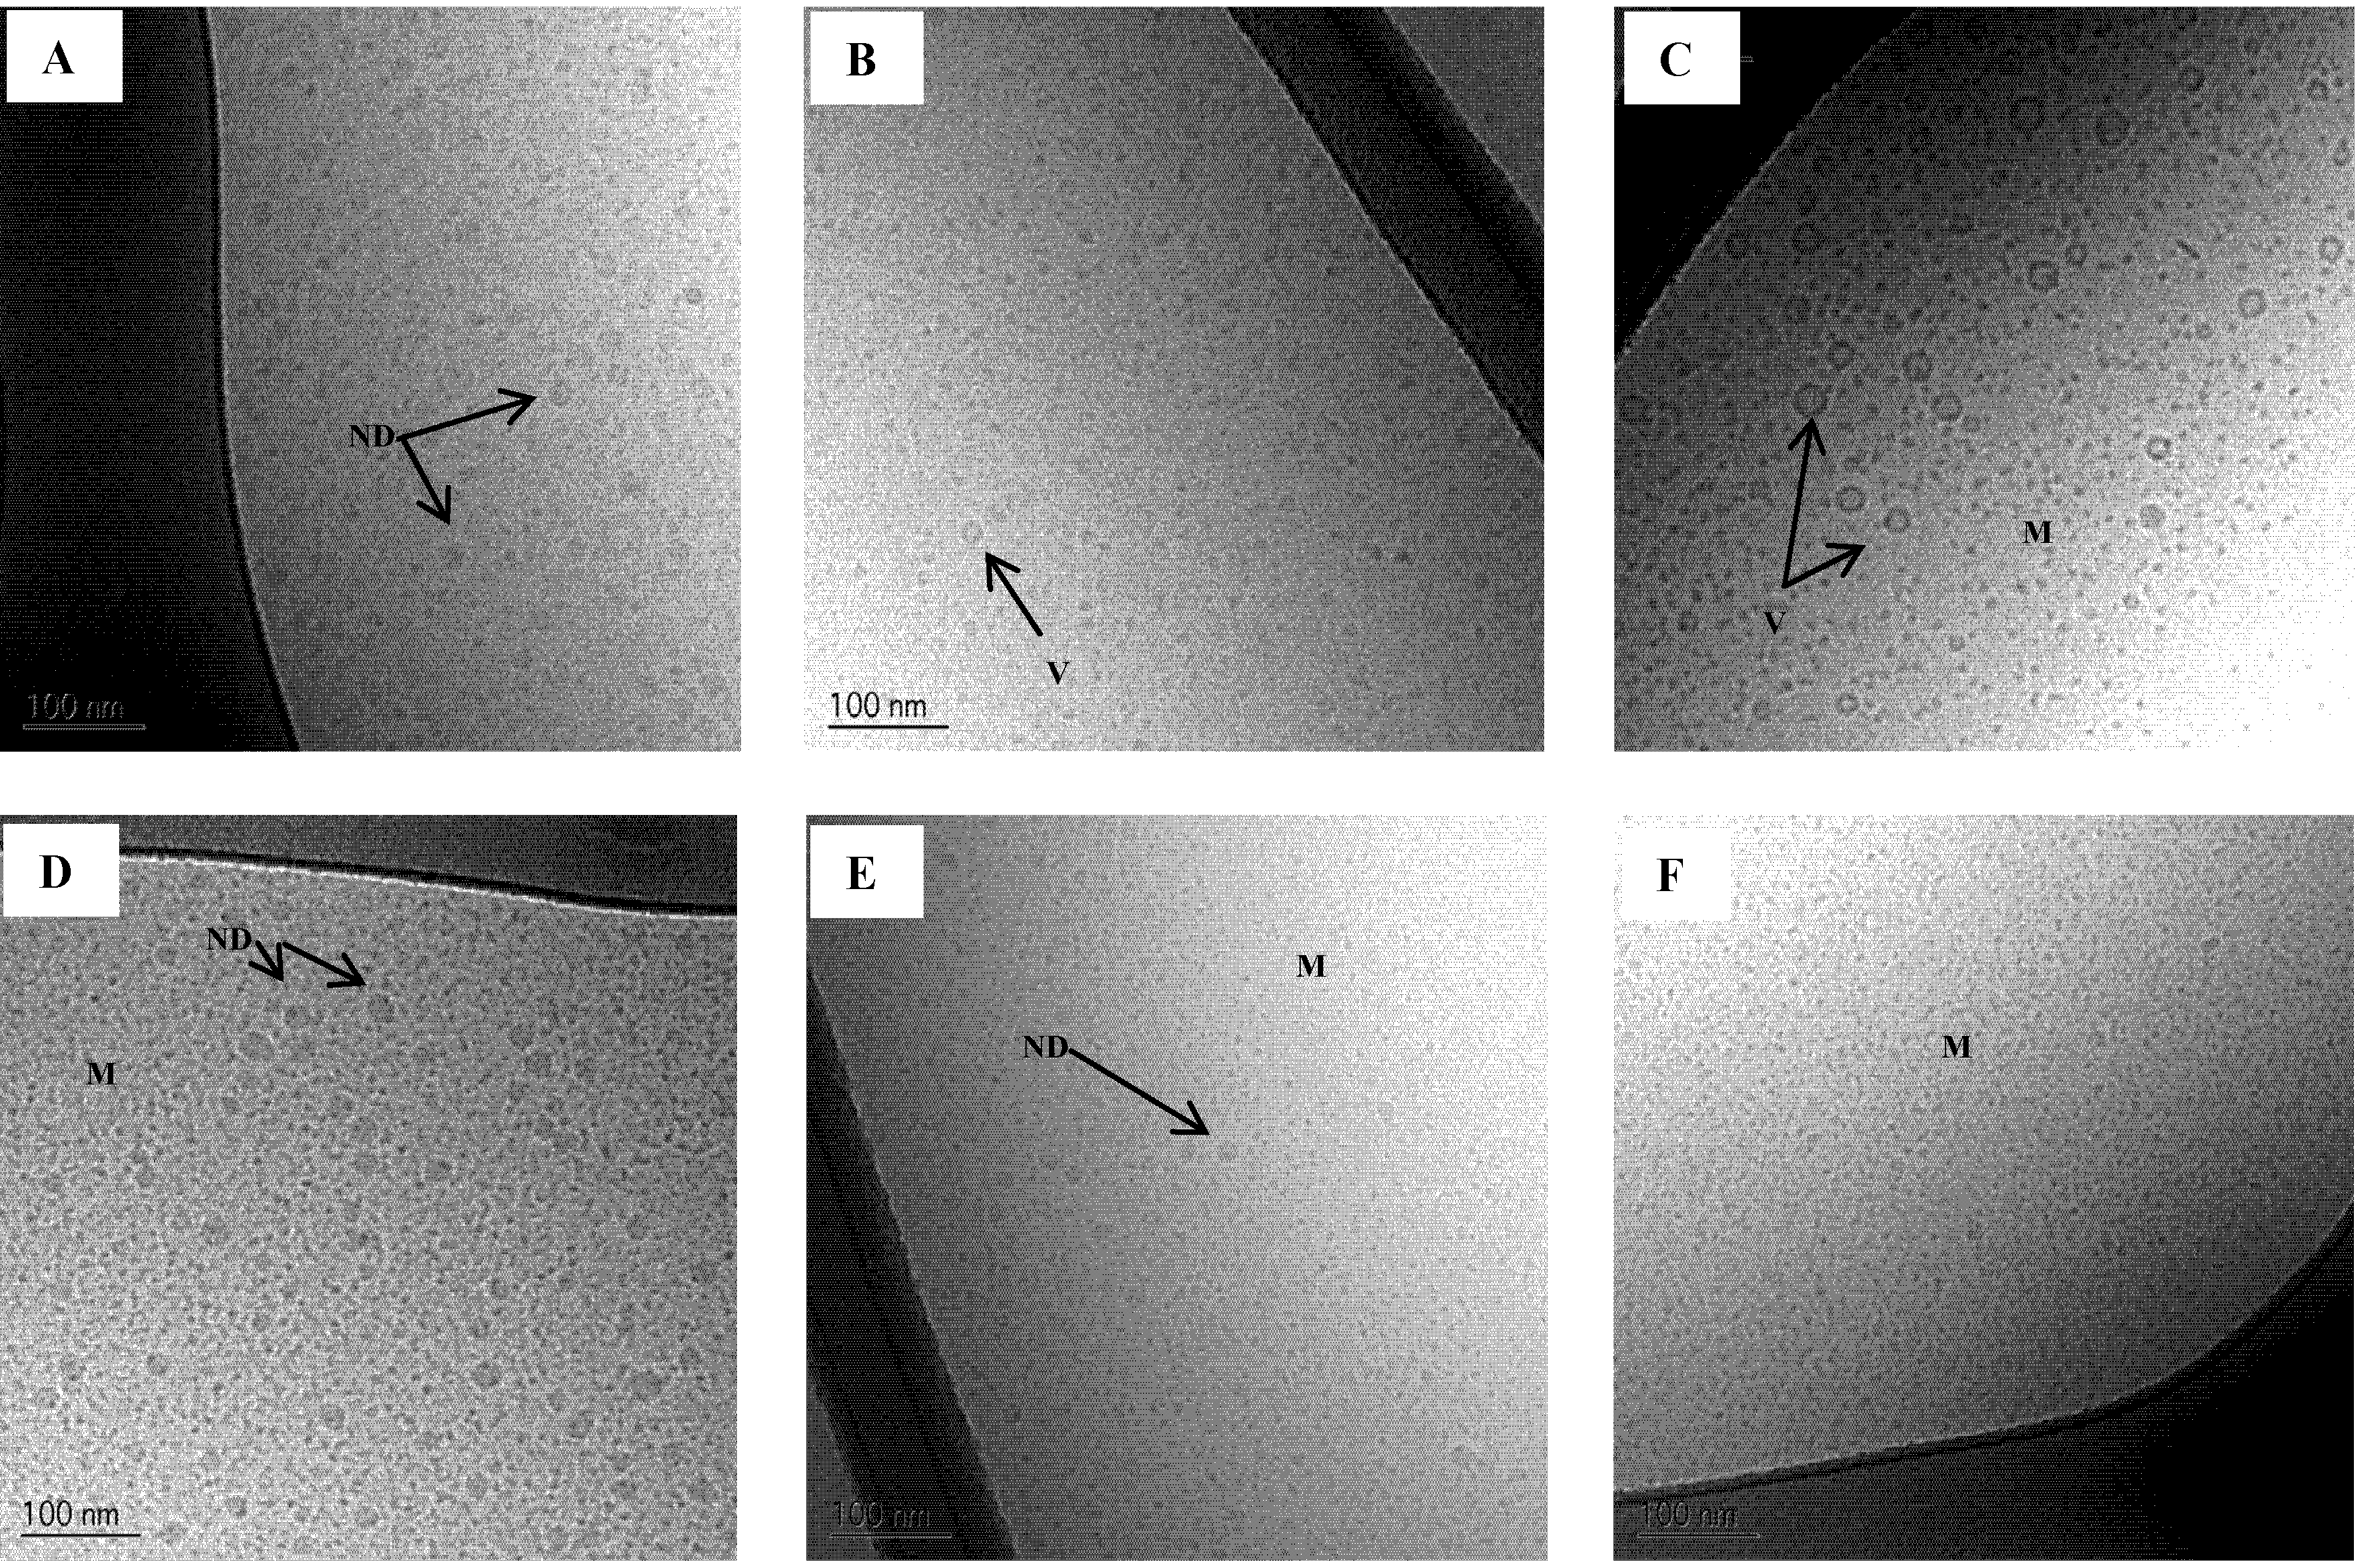
Cryo-TEM images of intact and mimicked digested SNEDDS II dispersed in SIM
low and SIM
high are shown in
Figure 7. The results are in accordance with the result from the DLS measurements. In SIM
low a reduction in droplet size is seen at 50% digestion and then an increase in droplet size is observed at 100% digestion. From the Cryo-TEM images it is evident that the larger structures at 100% digestion are mainly vesicles. From DLS measurements, it is not possible to distinguish between oil droplets or vesicles since it is the hydrodynamic size of the colloids that is determined by this technique. Therefore, the use of an imaging technique to supplement DLS measurements is preferable. At 50% digestion, a few vesicles were also observed in SIM
low.
A few larger oil droplets and vesicles approx. 80–250 nm in diameter were also observed in the 100% mimicked digested sample in SIM
low (
Figure 8). Larger colloidal structures were also observed by DLS, however these appeared to be somewhat bigger than what was seen on the Cryo-TEM images. In contrast, vesicles were not observed in SIM
high when SNEDDS II was digested. After 50% mimicked digestion the droplet size decreased compared to the intact SNEDDS and was unchanged comparing 50% to 100% mimicked digestion. The absence of vesicles when mimicked digested SNEDDS II was dispersed in SIM
high is caused by the higher concentration of bile acid as compared to the SIM
low media. In SIM
high there is sufficient surfactant to keep the lipolysis products solubilized in smaller colloidal structures whereas in SIM
low the amount of surfactant is not sufficient to prevent the formation of larger colloidal structures e.g., vesicles and oil droplets.
Figure 7.
Cryo-TEM images of SNEDDS II intact and mimicked digested in intestinal simulated media. (A) Intact in SIMlow;(B) 50% digested in SIMlow and (C) 100% digested in SIMlow;(D) Intact in SIMhigh;(E) 50% digested in SIMhigh and (F) 100% digested in SIMhigh. ND: Nanoemulsion droplet, M: Micelles, V: Vesicle.
Figure 8.
Cryo-TEM images of SNEDDS II 100% mimicked digested in SIMlow. (A) Oil droplets;(B) and (C) Vesicles. The scale bar is 100 nm.
Figure 8.
Cryo-TEM images of SNEDDS II 100% mimicked digested in SIMlow. (A) Oil droplets;(B) and (C) Vesicles. The scale bar is 100 nm.
The results obtained here substantiate previous results by Fatouros
et al. 2009 using a dynamic
in vitro lipolysis model and Cryo-TEM imaging looking at the morphology during digestion of a SNEDDS in simulated fed and fasted state [
50]. It was found that the simulated fed state resulted in the formation of micelles whereas in the fasted state a mixture of oil droplets, vesicles and micelles was formed [
50]. The extent of digestion was 40% and 50% in the fed and fasted state, respectively. To further validate our approach of making mimicked digested SNEDDSs for mechanistic studies Cryo-TEM images of actually digested SNEDDS from the present study would be needed.
In the present study, the results are snap shots of the digestion of SNEDDSs, however the absorption of digestion products was not taken into account. The absorption of lipolysis products may lead to a higher bile acid to lipolysis products ratio, which may favor micelle formation over vesicle formation. It is therefore anticipated that the rate of digestion of SNEDDSs and the rate of absorption of the digestion products may influence the colloidal systems that the drug compound is absorbed from. For some compounds it has been shown that the nano-structural composition of the media and not just the total surfactant contents has an impact on the solubilization capacity of the specific medium [
51] and that the nano-structural composition can potentially impact the absorption of compounds from such media. For SNEDDS I and II the level of bile salt have a greater impact on the droplet sizes obtained after mimicked digestion than SNEDDS III and IV. This may implicate that the performance of some SNEDDSs may be more dependent on the bile salt level in the intestinal fluids than others. Significant differences in bioavailability between the four SNEDDSs have been obtained [
44]. SNEDDS I and II resulted in lower bioavailability when compared to SNEDDS III and IV. However, exactly what causes the differences
in vivo is not clear cut. Data from studies like the present aids in obtaining a better understanding of SNEDDS formulations and linked to
in vivo data more can be learned on factors important for increasing the bioavailability of poorly water-soluble compounds from SNEDDSs.
