1. Introduction
With the continued increase of vehicle ownership, traffic congestion has become a major issue in urban areas, particularly at major intersections, where large numbers of vehicles are lined up at the intersection, especially in the morning and evening rush hours. In view of unreasonable traffic signal control settings, it is very easy to cause traffic jams, and when the queues accumulate, serious problems of traffic congestion in the area will be caused. Studying methods and measures to prevent spillovers at intersections, has always been an important part of urban traffic control.
At present, there are two main types of methods in solving traffic congestion: (1) Vehicles and traffic signals are independent individuals, and scholars only focus on the traffic signals. (2) Vehicles and traffic signals are no longer split, but are related through a certain communication mode, that is, the Internet of Things; vehicles and traffic signal controllers can realize information traffic.
To solve the aforementioned problems, many alternative methods have been considered over the years. The prevention of overflow at intersections is generally divided into two steps: (1) It is necessary to judge whether there is an overflow at an intersection or there is an overflow trend. (2) Make corresponding decisions according to the judgment results. The method to identify spillovers as described in Reference [
1] is relatively complex, and it is developed with the assumption that the residual queue length at the beginning of red signal phase is known. Meanwhile, the three break points described in References [
2,
3] which indicate a change in traffic state, are difficult to identify when the bus ratio to the traffic flow is high. Sun, proposed a red-band control strategy to ease traffic congestion [
4]. With the control of the red band and the green band, a coordinated control strategy was proposed by Ma [
5]. Based on the cellular transmission model, An, suggested highly random and dynamic characteristics of the spatial and temporal distribution of the evacuation traffic flow [
6]. A fast-predictive control model (MPC) was developed to solve the highway congestion problem [
7]. Hu proposed a new method, called the Cellular Automated Route Network Model, based on Biham, Middleton, and Levine to reduce the probability of traffic jam by predicting it in advance [
8]. Eriskin used the EPS (Elimination Pairing System) system to optimize the traffic signal timing at the intersection of supersaturated points. This method is superior to the traditional Webster method [
9].
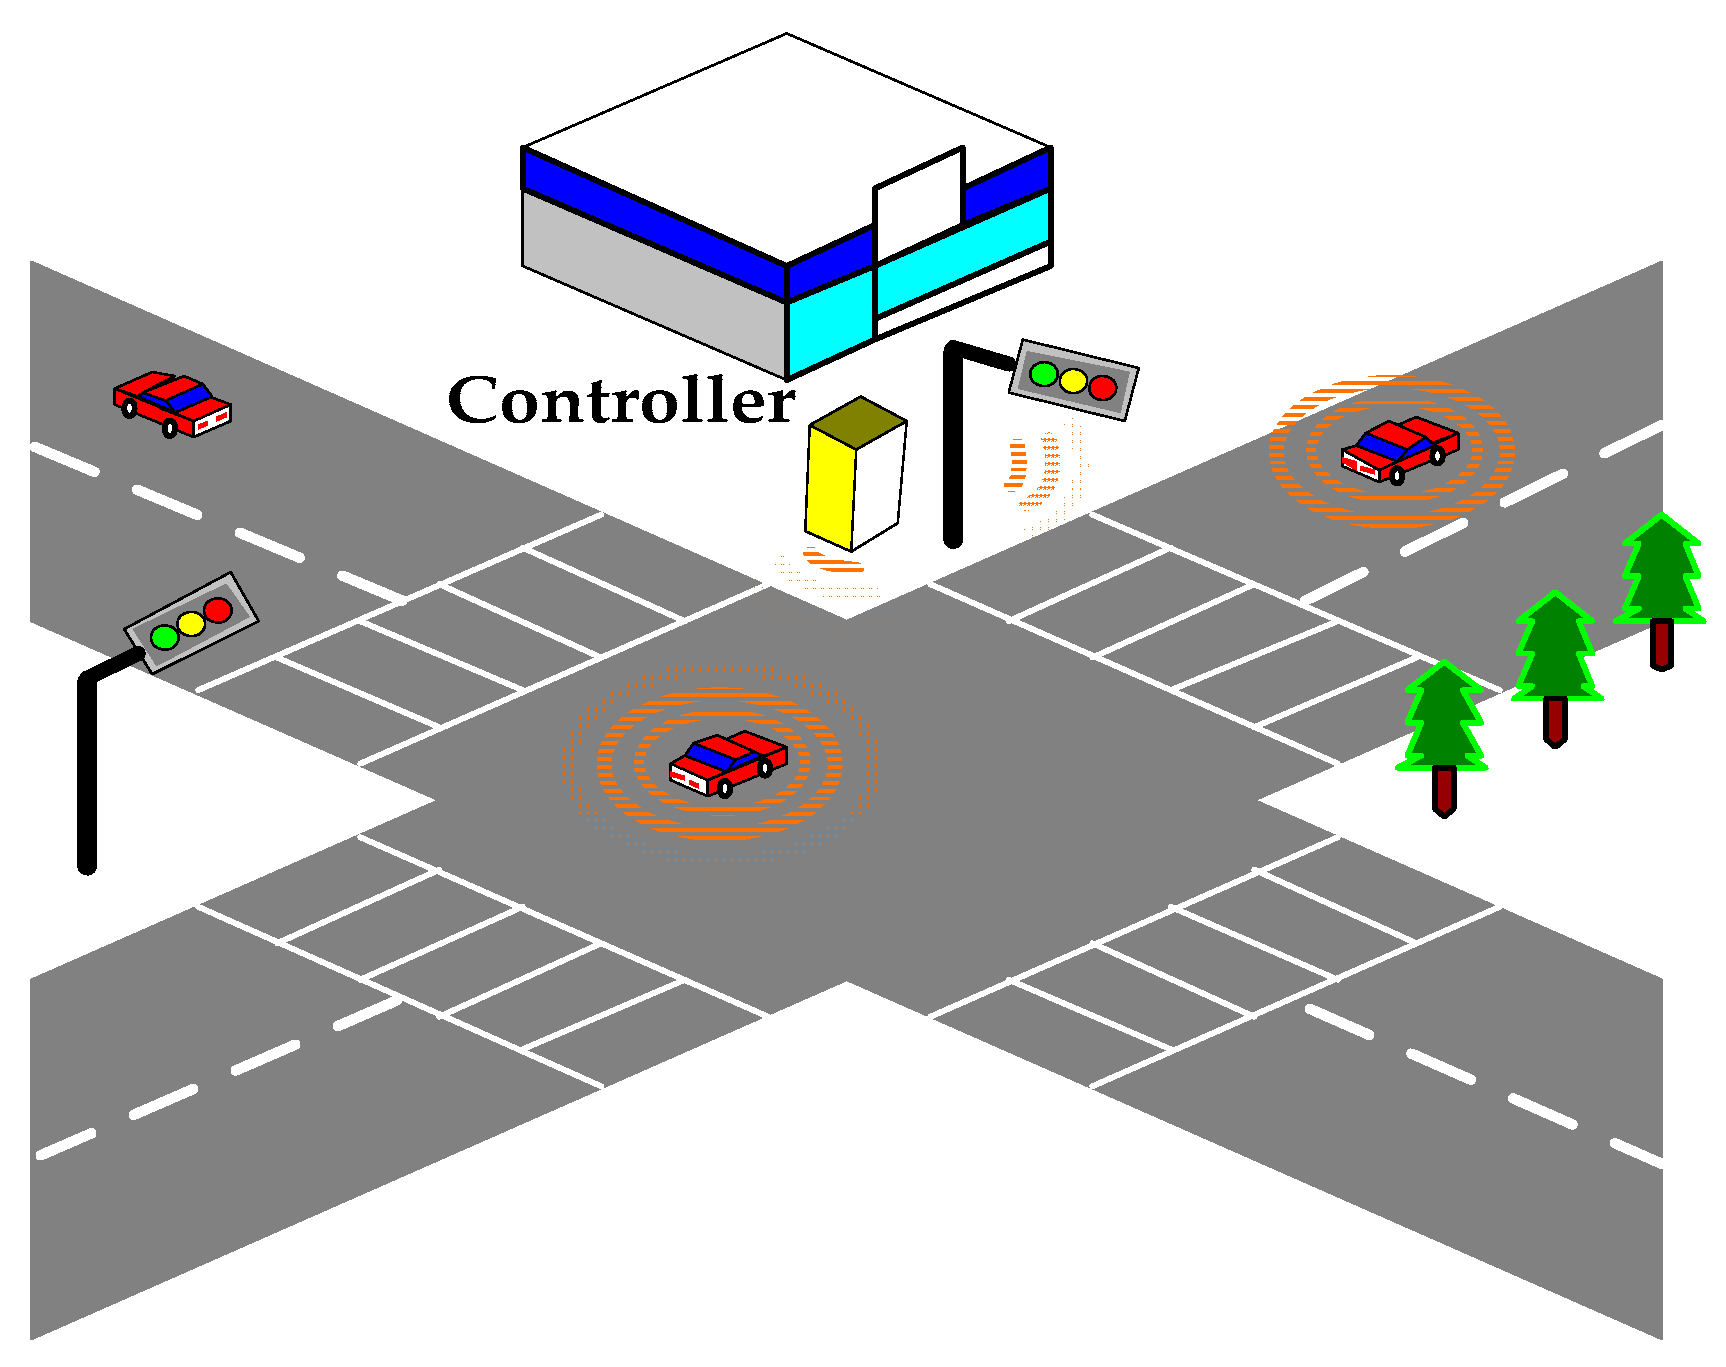
In recent years, with the rise of new technologies such as the Internet of Things, big data, and “Internet +”, the intelligent transportation system has also made great progress in intelligent network connection and vehicle networking. V2X (Vehicle to Everything) network communication technology will become an important technical support for the development of intelligent driving in the future and it will become the basis of the connected vehicle. V2X network connection, is a wireless communication technology based on the Internet of things. It uses D2D (Device to Device) and information communication technology to connect vehicles to the outside world. V2X network communication integrates V2N (Vehicle to Network, vehicle-internet), V2V (Vehicle to Vehicle), V2I (Vehicle to Infrastructure), and V2P (Vehicle to Pedestrian). (1) V2N connects vehicles to the cloud server mainly through the Network, and it can use functions such as entertainment navigation on the cloud server; (2) V2V refers to information exchange with different vehicles; (3) V2I mainly includes the communication between vehicles and Infrastructure, such as road traffic light barriers, and is used to obtain road management information, such as the timing sequence of traffic signals and the location of road obstacles; (4) V2P refers to the interaction between vehicles and pedestrians or non-motor vehicles, mainly providing safety warnings. Connected vehicle refers to a new generation of vehicle which is equipped with advanced on-board sensors and integrates modern communication and network technology, to realize intelligent information exchange and sharing between the vehicle and X (car, road, person, cloud, etc.). In the connected vehicle environment, vehicle information can be obtained in real time through V2I, and the traffic signal controller can control the traffic signal with massive and high-precision data from the Internet of vehicles. Connected vehicle (CV) allows vehicles to transfer data to each other, V2V and V2I. The roadside infrastructure can use the obtained data from V2I to set the traffic signal, corresponding to the traffic demand in real time.
Scholars in China and abroad, have made a lot of efforts and contributions to research on the traffic algorithm of intersections based on the Internet of vehicles, and have provided a lot of experience. Researchers at the University of California, riverside, have designed a speed planning algorithm based on traffic lights to allow vehicles to pass through a single crossing. Agbolosu-Amison et al. proposed an inductive control method using the Internet of vehicles as the sensor. Through the Internet of vehicles, the relevant information on vehicles was obtained, the time of vehicle arrival at the intersection was predicted, and the green time of behavior was dynamically allocated [
10]. Fortelle et al. assumed that the vehicle roads were all connected with the Internet of vehicles and proposed the control idea of vehicle automatic driving through intersections. The relevant information about vehicles was collected, and a solution to avoid potential conflicts when crossing intersections was provided. However, they did not propose specific models and solutions [
11]. Lee et al. proposed a method to realize autonomous driving in the context of the Internet of vehicles and used a genetic algorithm to search the optimal vehicle form speed. However, due to the randomness of genetic algorithms and the limitation of solving large-scale problems, this method was only suitable for intersections with small traffic volumes [
12]. Noah et al. used traffic simulation software to open multiple simulation Windows, to simulate the actual road network and predict the traffic status online, and they obtained the optimal signal timing schemes [
13]. Scholars have done a lot of research on vehicle to internet. From the perspective of the driver, Moayad et al. expounds the internet of vehicles and proposes how to obtain information from the driver in the vehicle cloud system [
14]. They also issues such as privacy, service costs, and supply delays [
15]. Currently in the field of communications, vehicle to internet is forcused on the management of vehicle and drive service needs, and solve the problem by building a model [
16,
17,
18,
19,
20,
21]. Another research hotspot is traffic flow control based on the internet of vehicles. Lee et al. presented a cumulative travel-time responsive (CTR) real-time intersection-controlled algorithm, under the environment of connected vehicles. Using this algorithm, the traffic efficiency and average speed of vehicles at intersections are improved [
22]. Guler et al. used the information from connected vehicles to optimize the efficiency of the intersection [
23]. Compared with the previous method of calculating the minimum green time and the maximum green time using the deterministic model, Zhang et al. used stochastic optimization theory which established a stochastic model to calculate these parameters in real time [
24]. Gu et al. used the technology of connected vehicles to solve the Queue length of the traffic flow, and through the VISSIM simulation, the algorithm was proved to be effective [
25]. Ma et al. realized the dissipation of the queue, by adjusting the inflow and outflow of the intersection. Three evaluation criteria for queue length were proposed [
26]. Queue length is traditionally estimated by using data collected from loop detectors. The traditional input-output model was adopted in literature [
27,
28,
29] for traffic optimization. Reference [
30] used the shockwave model to solve the transportation problem. Loop detectors are widely used due to the quality of the collected data, but its expensive price has become a hindrance to its popularity. Reference [
31] presents a mathematical model, which uses CV to estimate the real-time queue of wireless sensor networks, and the proposed queue estimation model is applicable for adaptive signal control using CV technology in practice. The literature [
32] developed an event-based method, which used both probe trajectory and signal timing data to estimate queue length, and the estimation accuracy under different market penetration rates was examined. Geroliminis presented a mathematical model for real-time queue estimation, using connected vehicle technology from wireless sensor networks [
33]. Zhou used instantaneous and historical car networking data and optimization of phase sequence, and signal timing parameters were optimized online with the goal of minimizing the average waiting time at intersections and maximizing the maximum queue length [
34]. Cai took the road network vehicle travel time as the minimum control target and used adaptive dynamic programming to propose a single intersection adaptive signal control method, based on car networking environment [
35]. Priemer et al. obtained the vehicle position, speed and other data, and used the integer programming model to optimize the signal control parameters of the intersection, to solve the transportation problem [
36].
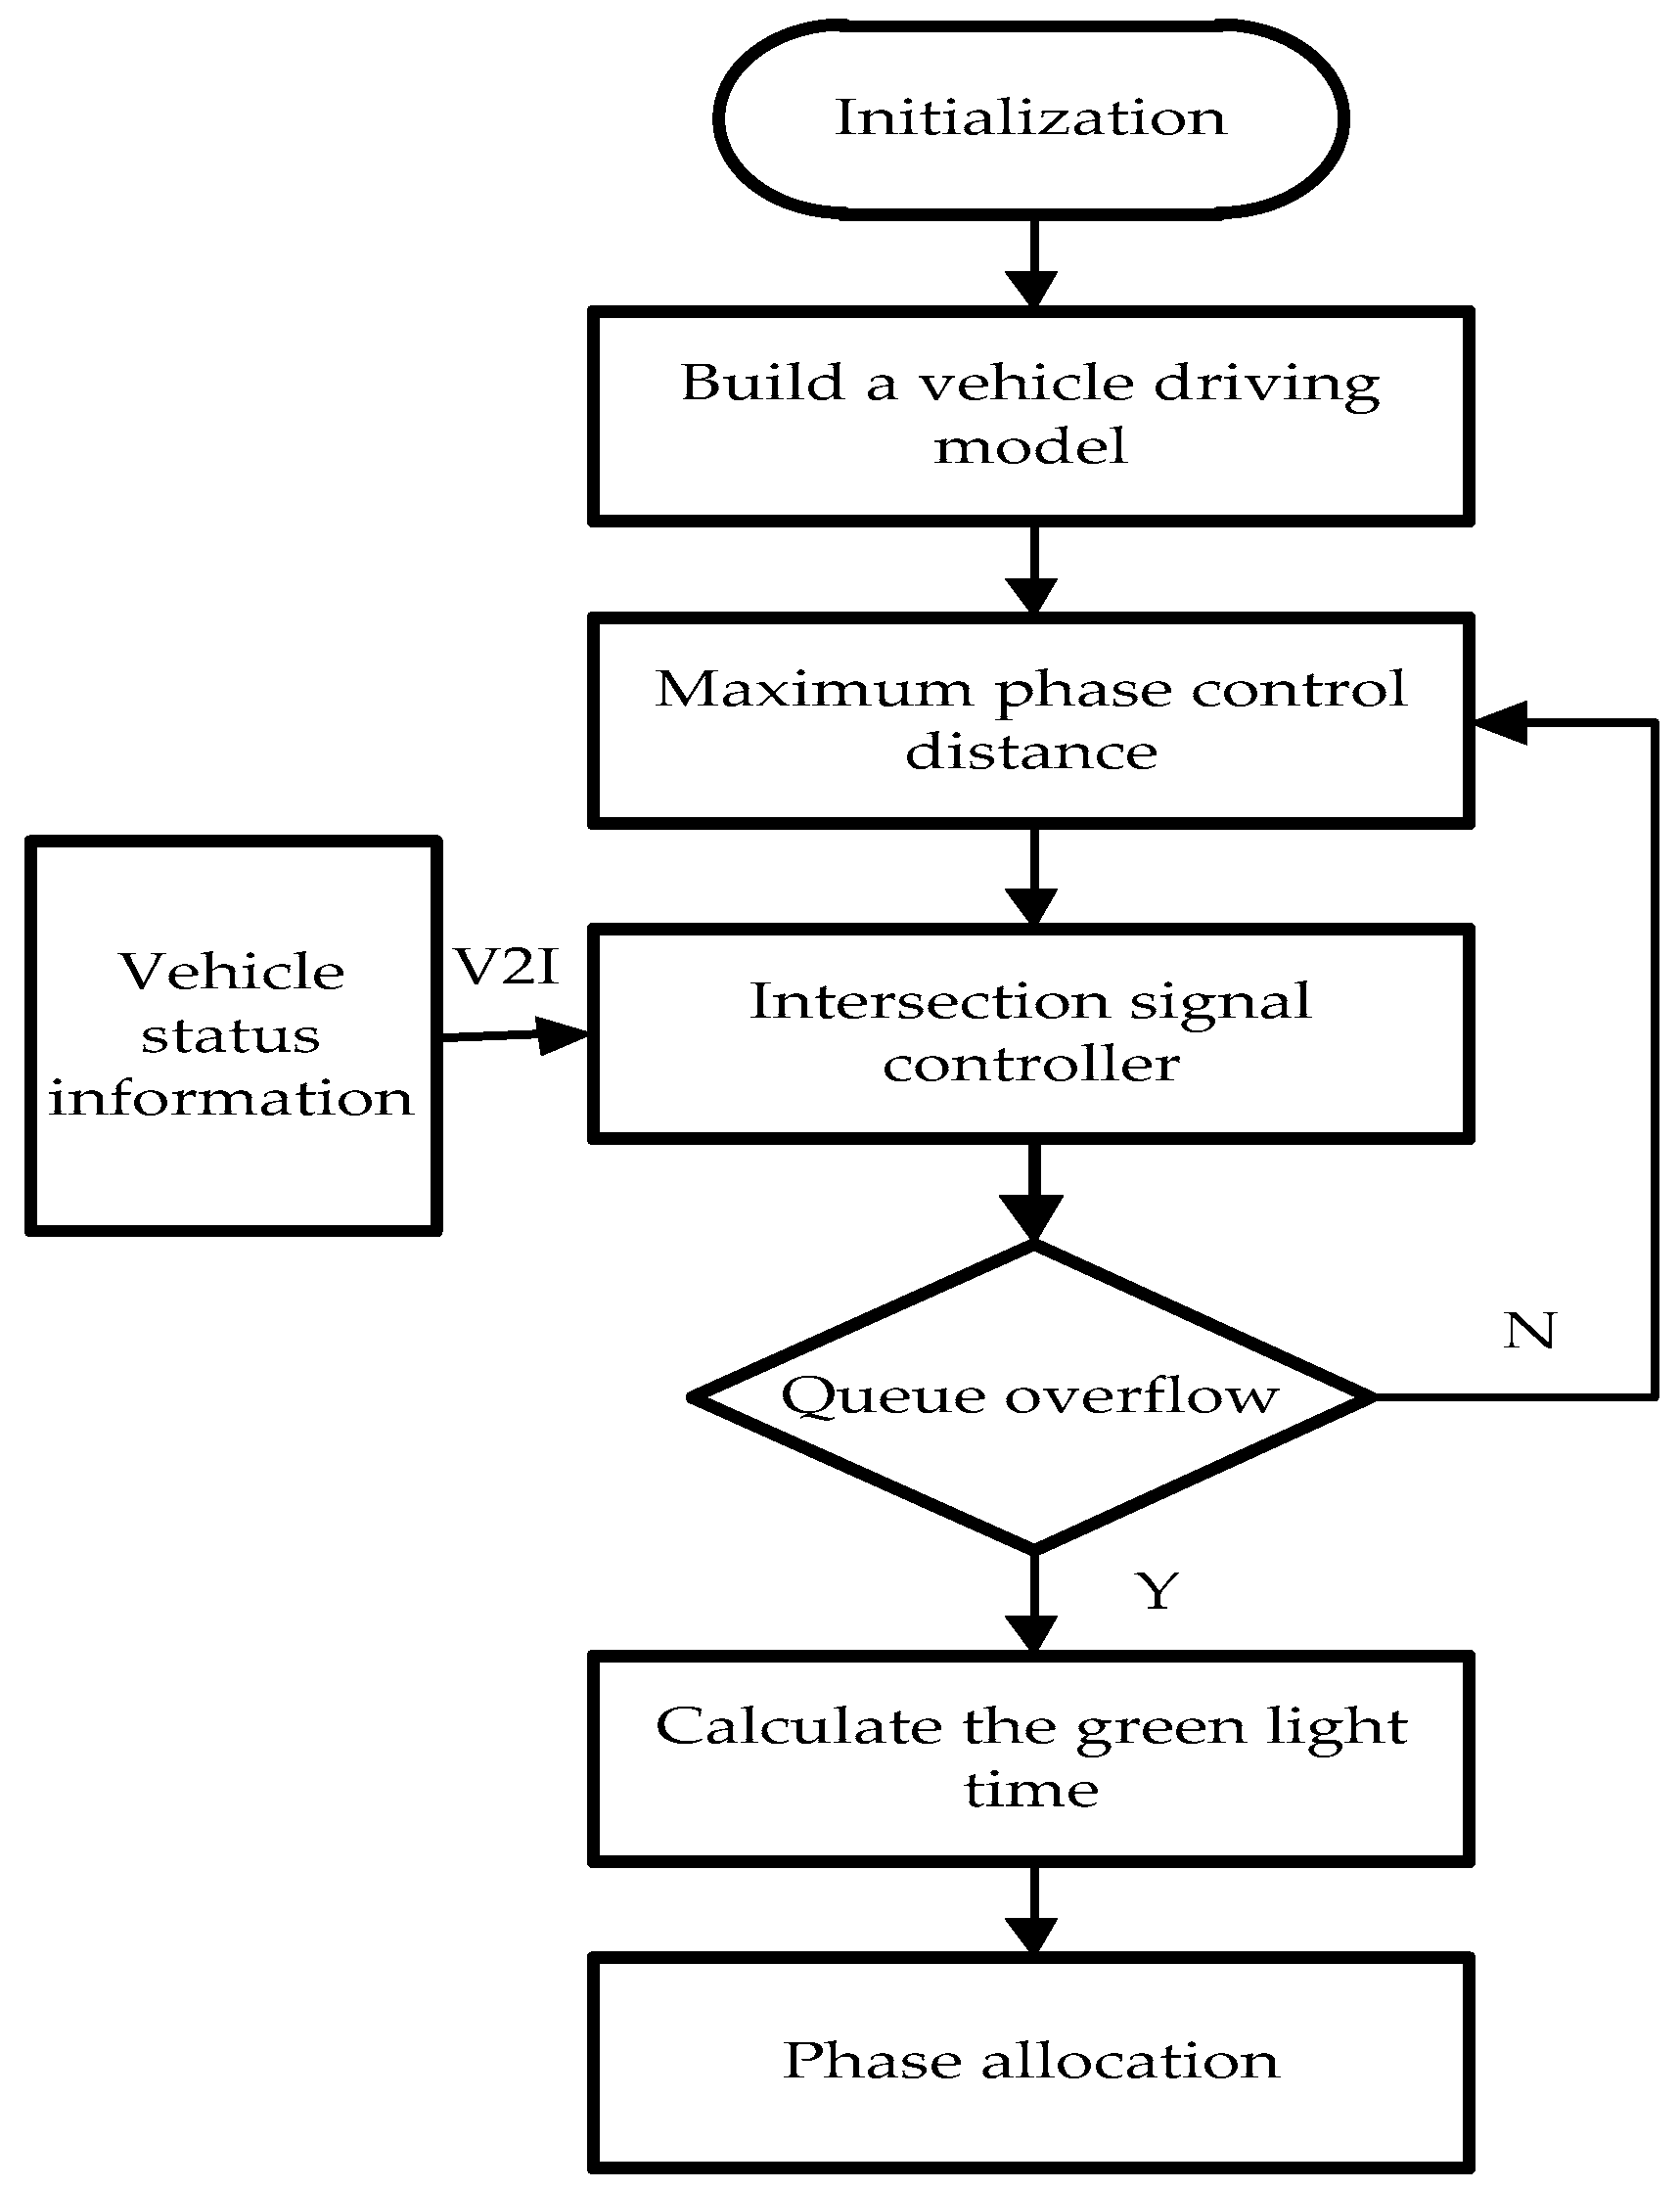
In this paper, the V2I communication technology in the vehicle networking environment was used to realize the information interaction between the vehicle and the traffic signal controller. This paper analyzed the characteristics of the vehicle intersection and established the mathematical model of the vehicle intersection. The maximum queue length of the road is proposed as the evaluation index of road overflow. According to the maximum queue length, the optimal intersection overflow limit point is determined, and the trend of the intersection overflow is determined in advance. When the queue overflows, the phase optimization is performed.
This paper is organized as follows.
Section 2 presents the basic principle of a control system.
Section 3 introduces the developed algorithm and compares the performance of it, for two objective functions: minimizing delay and minimizing number of stops. The signal control model of intersection is derived from
Section 3. Finally,
Section 4 presents the conclusions of this paper and suggestions for further work on this particular topic.
3. Intersection Signal Control Modeling
In this study, the following three assumptions are proposed:
The vehicle controller can provide spatial position and speed information to the intersection signal controller;
Signal controllers of adjacent intersections can interact with each other;
Keeping the same safety distance between the vehicles in line.
3.1. Phase Maximum Control Distance
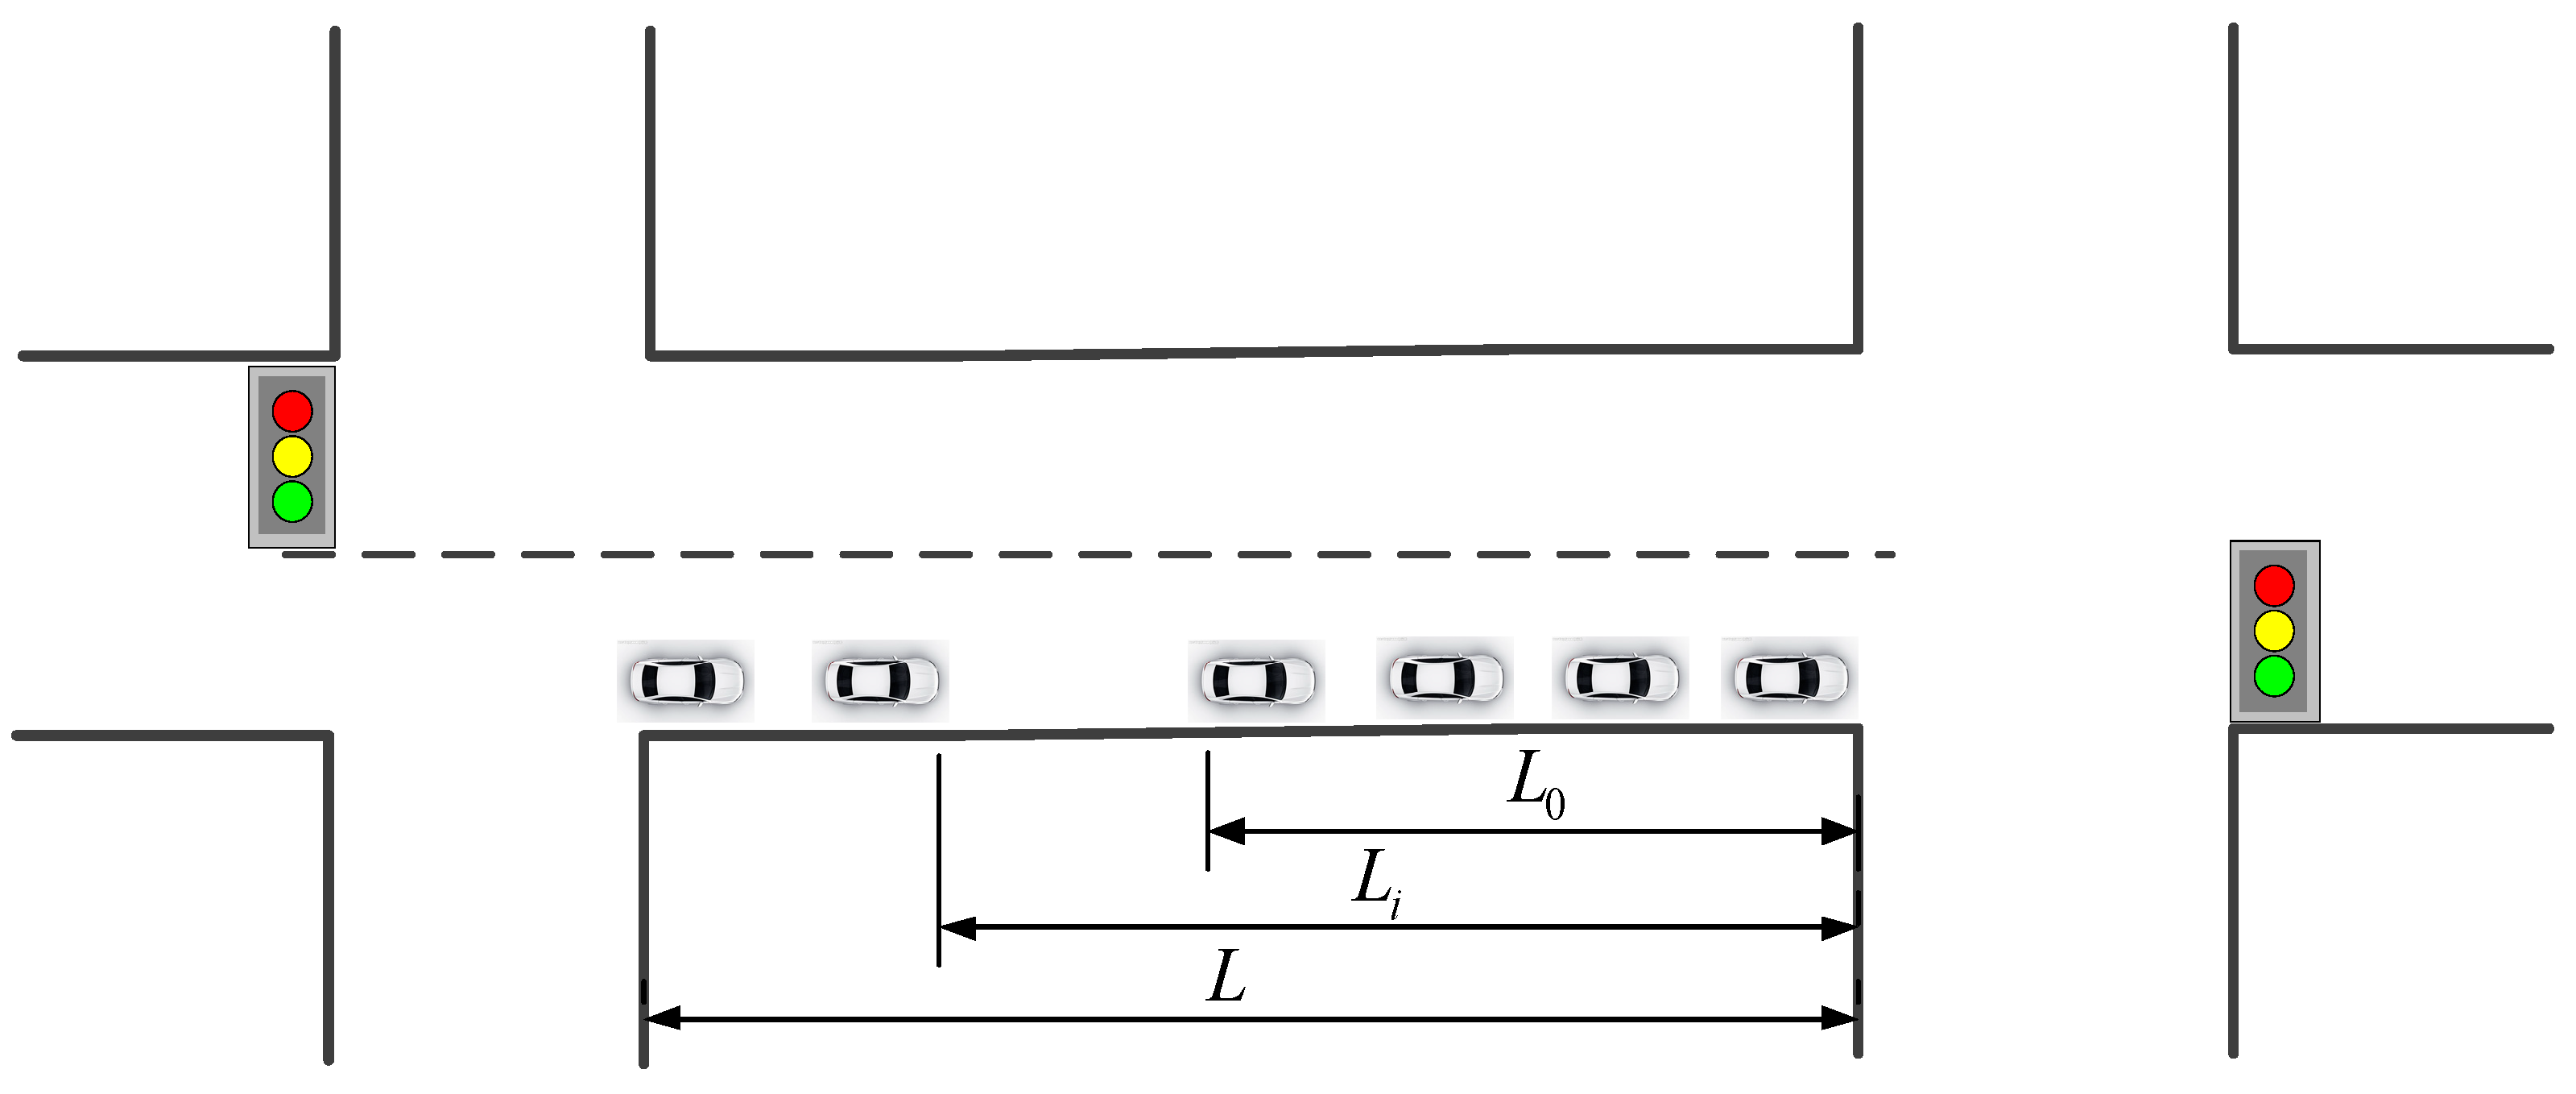
The maximum control distance between the intersection phase, is related to the maximum queue length of the intersection. The maximum queue length is the length of the road between the intersections. Given the different types of vehicles, speed, and acceleration performance of vehicles passing through intersections, the equivalent cars are taken as the research object. The intersections and related parameters, are shown in
Figure 3. In
Figure 3,
L denotes the distance between the intersection of roads,
denotes the intersection of queuing vehicles in front of the length,
denotes the distance between the
i-th vehicle on the road and the stop line of the intersection. And the straight, left-turn lanes are separated.
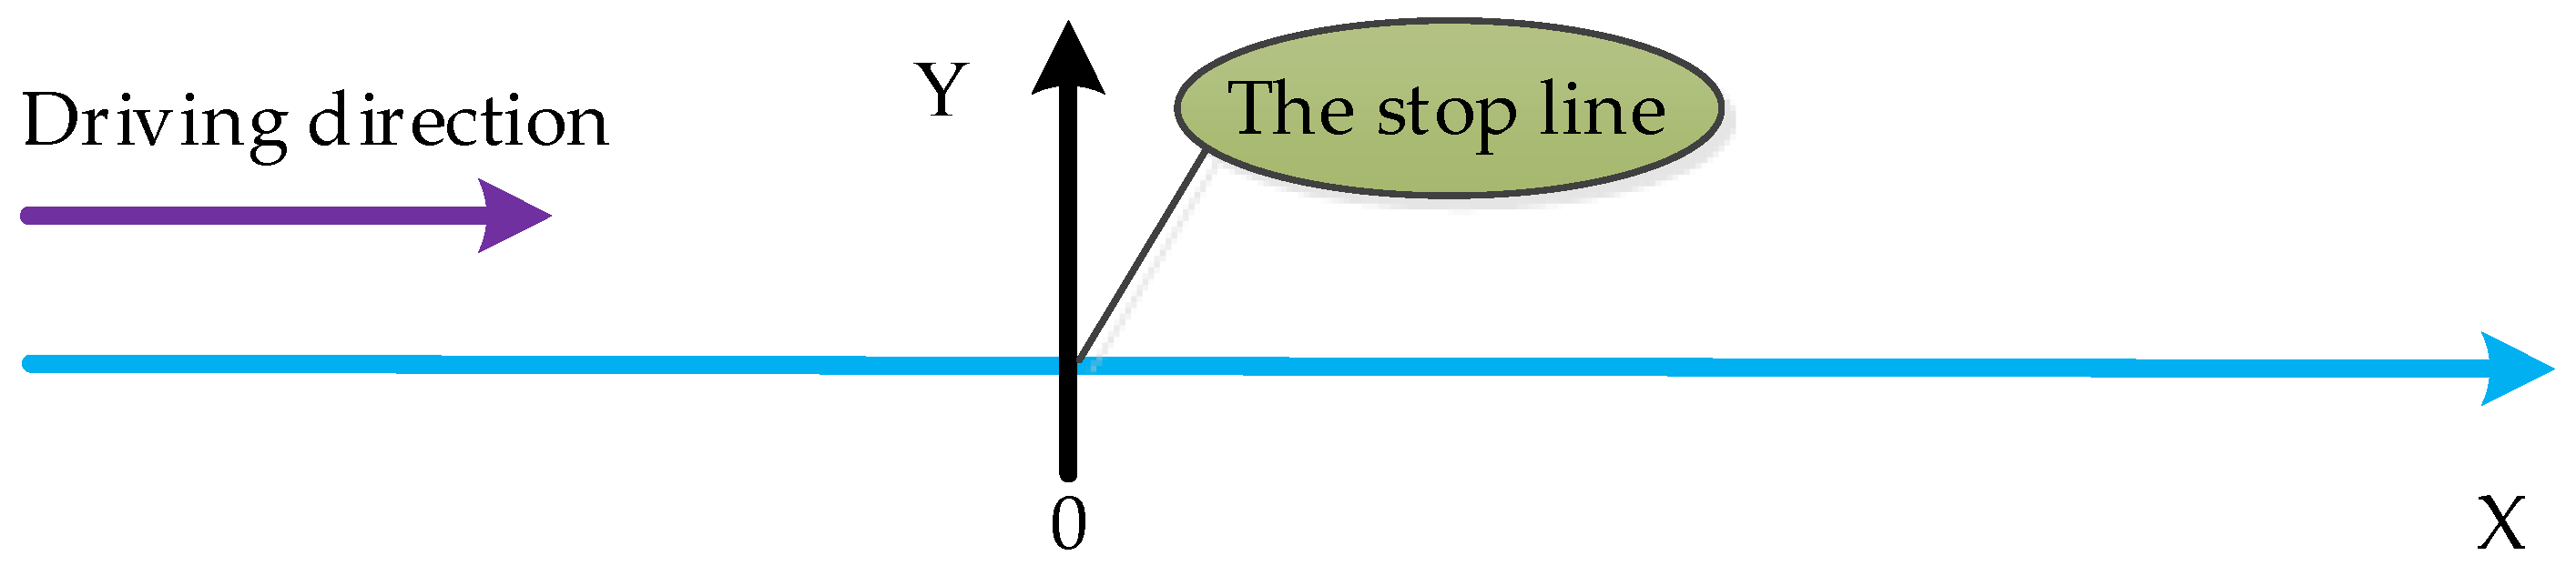
To describe the position of the vehicle on the intersection, we used two coordinates: longitudinal X, lateral Y. X and Y are the local coordinates in the viewpoint of the stop line. In
Figure 4, the axis X indicates the road traveled by the car. The origin o indicates the position of the intersection stop line, and the positive direction of the axis X is the direction of driving.
The calculation of the phase maximum control distance, is determined by the vehicle traveling model, and the specific steps are as follows.
Assume that the green light moment is . The vehicle starting delay is T. The vehicle acceleration is , and the location of the n-th car at the time of t is . Thus, the starting time of the n-th car is .
The coordinates of the stop line of the intersection are (0, 0). Assume that the coordinates of the vehicle are , so the position of the n-th car can be calculated according to (1) before the car startup.
The start of the car is moving backwards from the first car. So, the starting time of vehicles, for different positions is calculated as follows:
Suppose the vehicle drives at a uniform acceleration after startup. The position of the car at moment
t can be expressed as follows:
Then the vehicle’s driving model shows as follows:
However, the vehicle’s driving, needs to be limited by the maximum speed of the roads. Assuming the road’s limitation of maximum speed is
km/h, the car will be uniformly accelerated to
, and keeping the speed
for forward driving. The time for uniform acceleration of the car is as follows:
where:
is the time when the
n-th car reaches the speed limitation.
When the green light is on, the model of the car driving through the intersection is as follows:
when meeting the condition that the
n-th vehicle is located at the stop line of the end of
(green light). That is, (6) satisfies ①
, ②
, ③
, then the current phase maximum number of vehicles can be obtained, as shown in (7). The distance between the initial position of the
n-th car and the intersection is the phase maximum control distance.
when
n is solved, the position of the vehicle can be obtained through the vehicle positioning module, and the corresponding phase maximum control distance is obtained as follows:
3.2. Intersection Queue Overflow Judgment
The maximum phase control distance was used as the standard to determine whether the current phase vehicle queue will overflow. The initial queue length was compared with the maximum control distance between the phase, to determine whether the current phase allowed vehicles to pass through the intersection. The following two situations were considered.
1.
That is, the initial queue length is less than the phase maximum control distance. This situation indicates that the current phase allows the vehicle to pass through the intersection, and the green time may still be in surplus after the queuing vehicles pass the intersection. That is, (6) satisfies ① ② . Then the time of initial queue length through intersection can be calculated.
The remaining time
of the green light is as follows:
In the remaining time, to ensure that as many vehicles as possible go through the intersection, the vehicle in the rear will be able to implement the vehicle speed guidance. When the vehicle speed is guided, it is necessary to judge whether the vehicle can pass the intersection at the current vehicle speed, and the speed of the approaching i-th car is . There are,
If , the current speed at a constant speed can be used to cross the intersection;
If , the current speed cannot meet the requirements of the vehicle through the intersection, the vehicle should be accelerated to , to ensure that it can safely pass the intersection.
The setting of guide speed needs to be satisfied:
From (11), the speed
can be obtained as follows:
It is important to note that the guide speed limited condition is .
2.
That is, the initial queue length is more than the phase maximum control distance. When this situation occurs, the current phase is not sufficient to adjust the vehicle through the intersection. At this point, it is necessary to judge whether the queue length is overflowing. Queuing vehicles through the intersection of computing time with (9), the calculated time is represented as .
When the number of queuing vehicles is greater than the largest phase control vehicles, signal controller starts overflow decision function. Then calculate the vehicle’s biggest difference between queue length and phase control of each cycle. If the difference value is negative, regard as zero, and save the difference analysis on vehicle queue change trend. The specific steps are as follows:
- Step 1:
The maximum control distance of intersection phase is assumed as
. The measured vehicle queue length of each cycle was
,
,
, ….
. The queue length of the vehicle can be calculated by the position coordinates of the vehicle at the end of the queue; then get the vehicle queue length and maximum control distance differential record, as shown in
Table 1.
- Step 2:
In order to prevent the overflow of road queues, we need to find an optimal overflow control threshold value, which needs to be obtained according to the actual traffic conditions of the intersection roads. If 70% of the road length is the control limit , when the differential is reached , we need to take control measures.
- Step 3:
When the control threshold of the intersection overflow is obtained, the overflow of the intersection can be judged according to the detection of the queue length. To eliminate the contingency of queuing, it is necessary to wait for at least one cycle, when the vehicle is detected at the overflow control limit. Then check whether the vehicle queuing trend continues to rise, if it continues, the judgment will be determined to overflow. Then the controller optimizes current phase and continues to detect the difference until it approaches zero.
3.3. Signal Optimization Method
When there is an overflow trend in the queue, the traffic signal needs to be optimized to make the current phase green time of the queue vehicle with overflow trend, to satisfy the queuing requirement as much as possible without overflow. This is related to the current phase of the largest green time , and the current queuing vehicles through the intersection of timing . The calculation of is given below.
Current Phase Maximum Green Time Calculation
The maximum green time of the current phase depends on the current phase green time and the maximum allowable green time of other phases, that is:
where,
is the phase free time for all other straight lanes at an intersection, and
is the phase free time for all other left lanes at an intersection.
Time
is the difference between the current phase green light time and the minimum green light time of the left phase. The minimum green time is denoted by
and its value can be determined by the time of the left queue vehicle passing the intersection. It is calculated according to the queue length detected and the Formula (6), and the calculation formula of
is as follows.
where,
is the current green time to left phase.
Time is the difference between the current phase green time of the direct line and the corresponding minimum green time. The minimum green time of the direct lane can be determined according to the time of the pedestrian crossing at the intersection, which is represented as .
The calculation of
involves the width of the lane, which may vary from region to region. According to the “Code for Urban Road Engineering Design” [
37], the length of a single motor lane is shown in the
Table 2.
The width of a single lane can be obtained from
Table 2, and the product of the number of lanes is the width of the pavement, which represent as
. It is related to the gender and age of pedestrians in the pedestrian crossing. According to the literature [
38], the walking speed of the old man was selected, i.e., 1.292 m/s to calculate the time at the intersection namely, the minimum green time, and the calculation formula is as follows:
The formula for calculating
is as follows:
If Equations (14) and (16) are taken into Equation (13), can be obtained.
3.4. Signal Optimization
The current queuing vehicles through the intersection of time
(at this point,
) compared with the current phase of the maximum green time; then get the current phase of the optimal control of green time as below:
where,
is the current optimal control green time.
When the equals to , the current phase green time requires an extension time of , because does not reach the maximum green time, so the time of the other direct left-turn phase decreases respectively in and , respectively, i.e., , . The proportional coefficients , are taken according to actual vehicle queuing conditions.
When the equals to , the current phase green light time needs to be extended by , and the other straight-line and left-turn phase reduction times are and , respectively.
4. Simulation Analysis
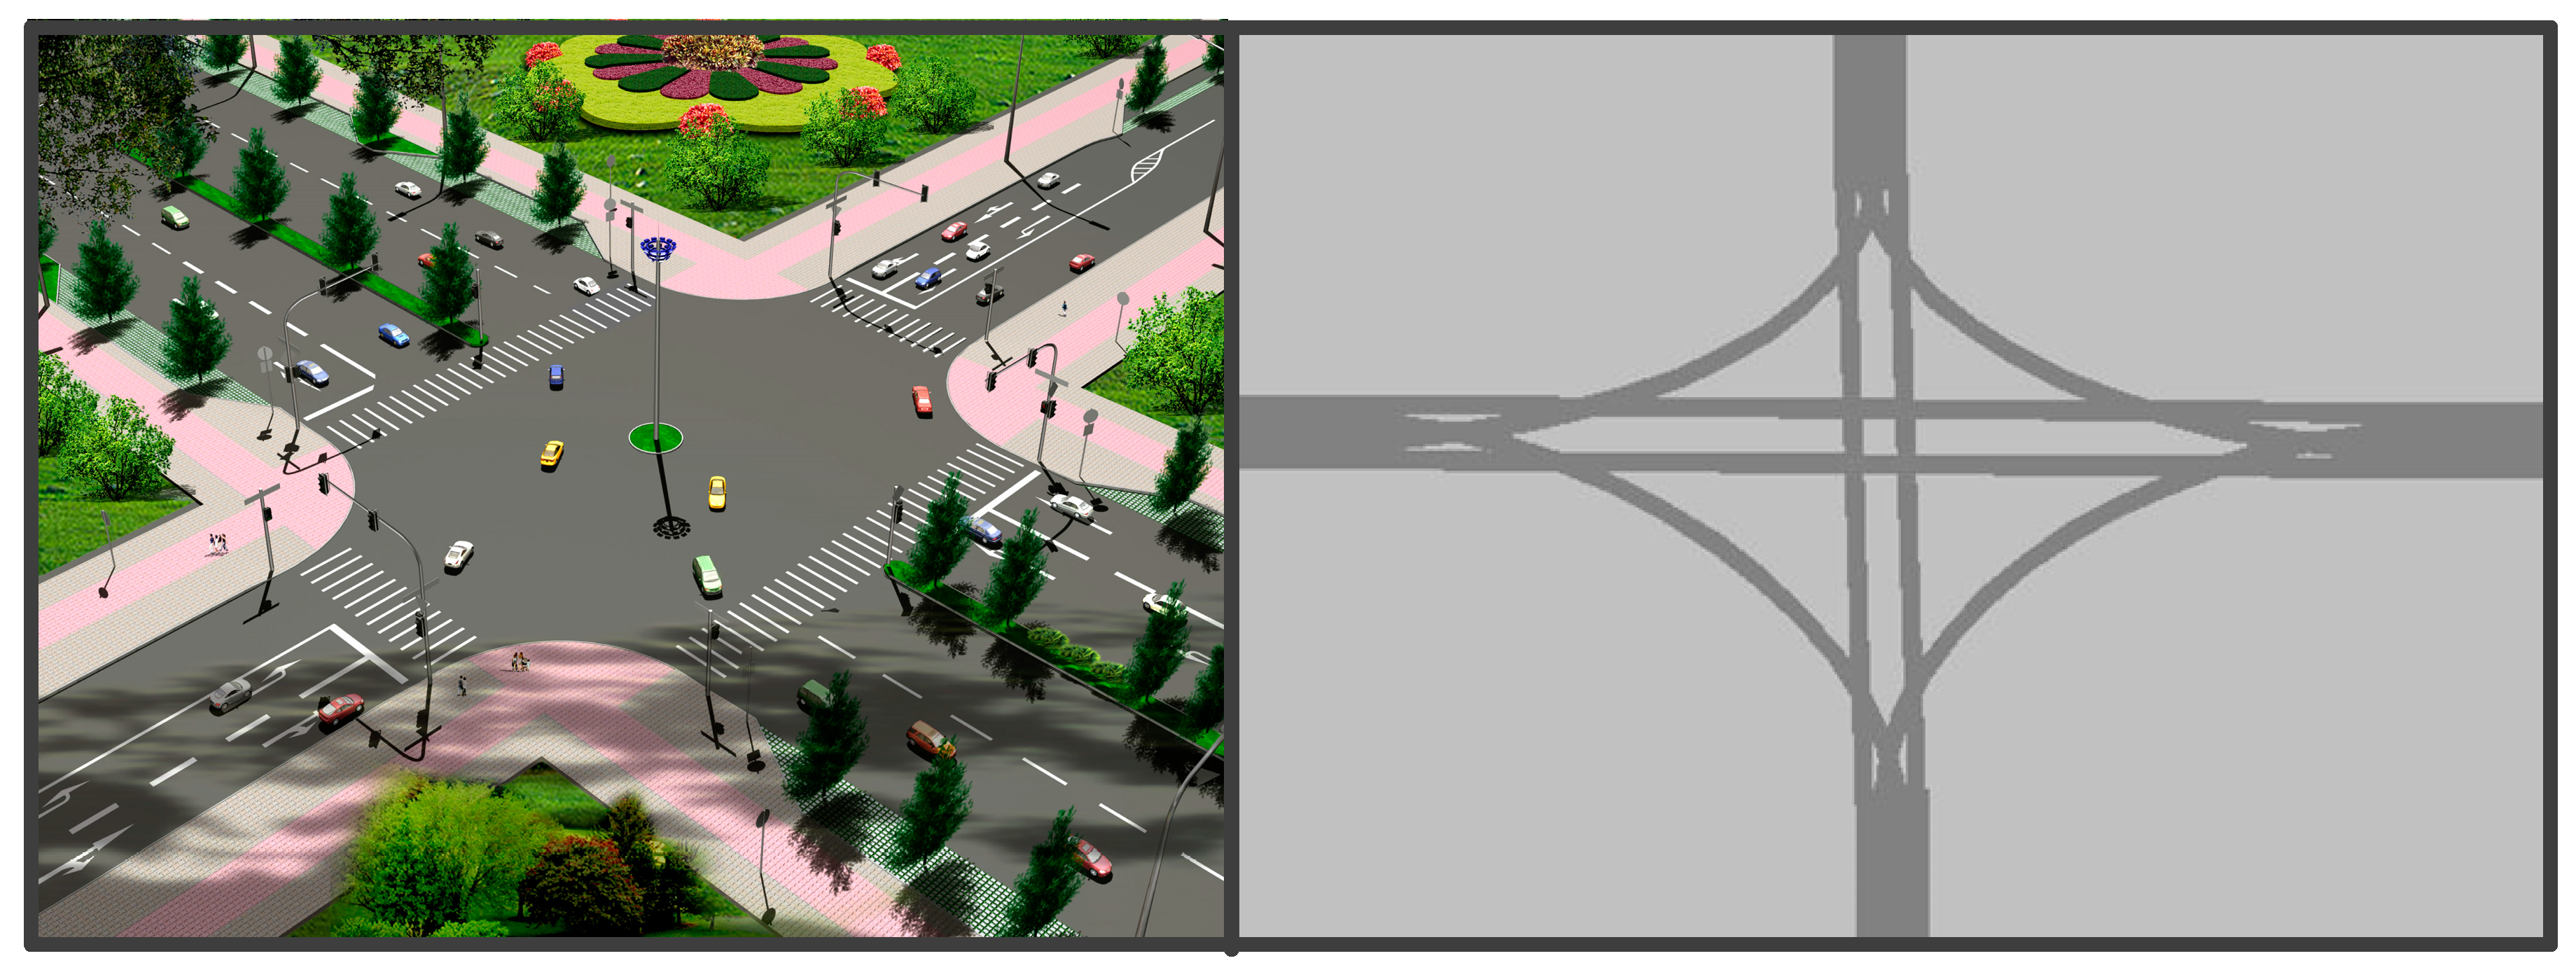
To verify the feasibility of the design method, this paper selected an adjacent intersection of Huangdao District, Qingdao City, Shandong province as the research object. The intersection is two-way four lanes where left turn and straight are separated, and it is easy to cause queuing overflow phenomenon in the peak time. The real scene and simulation scene, are shown in
Figure 5. The simulation settings of VISSIM, are shown in
Table 3. The distribution of the phases at the intersection, is shown in
Figure 6.
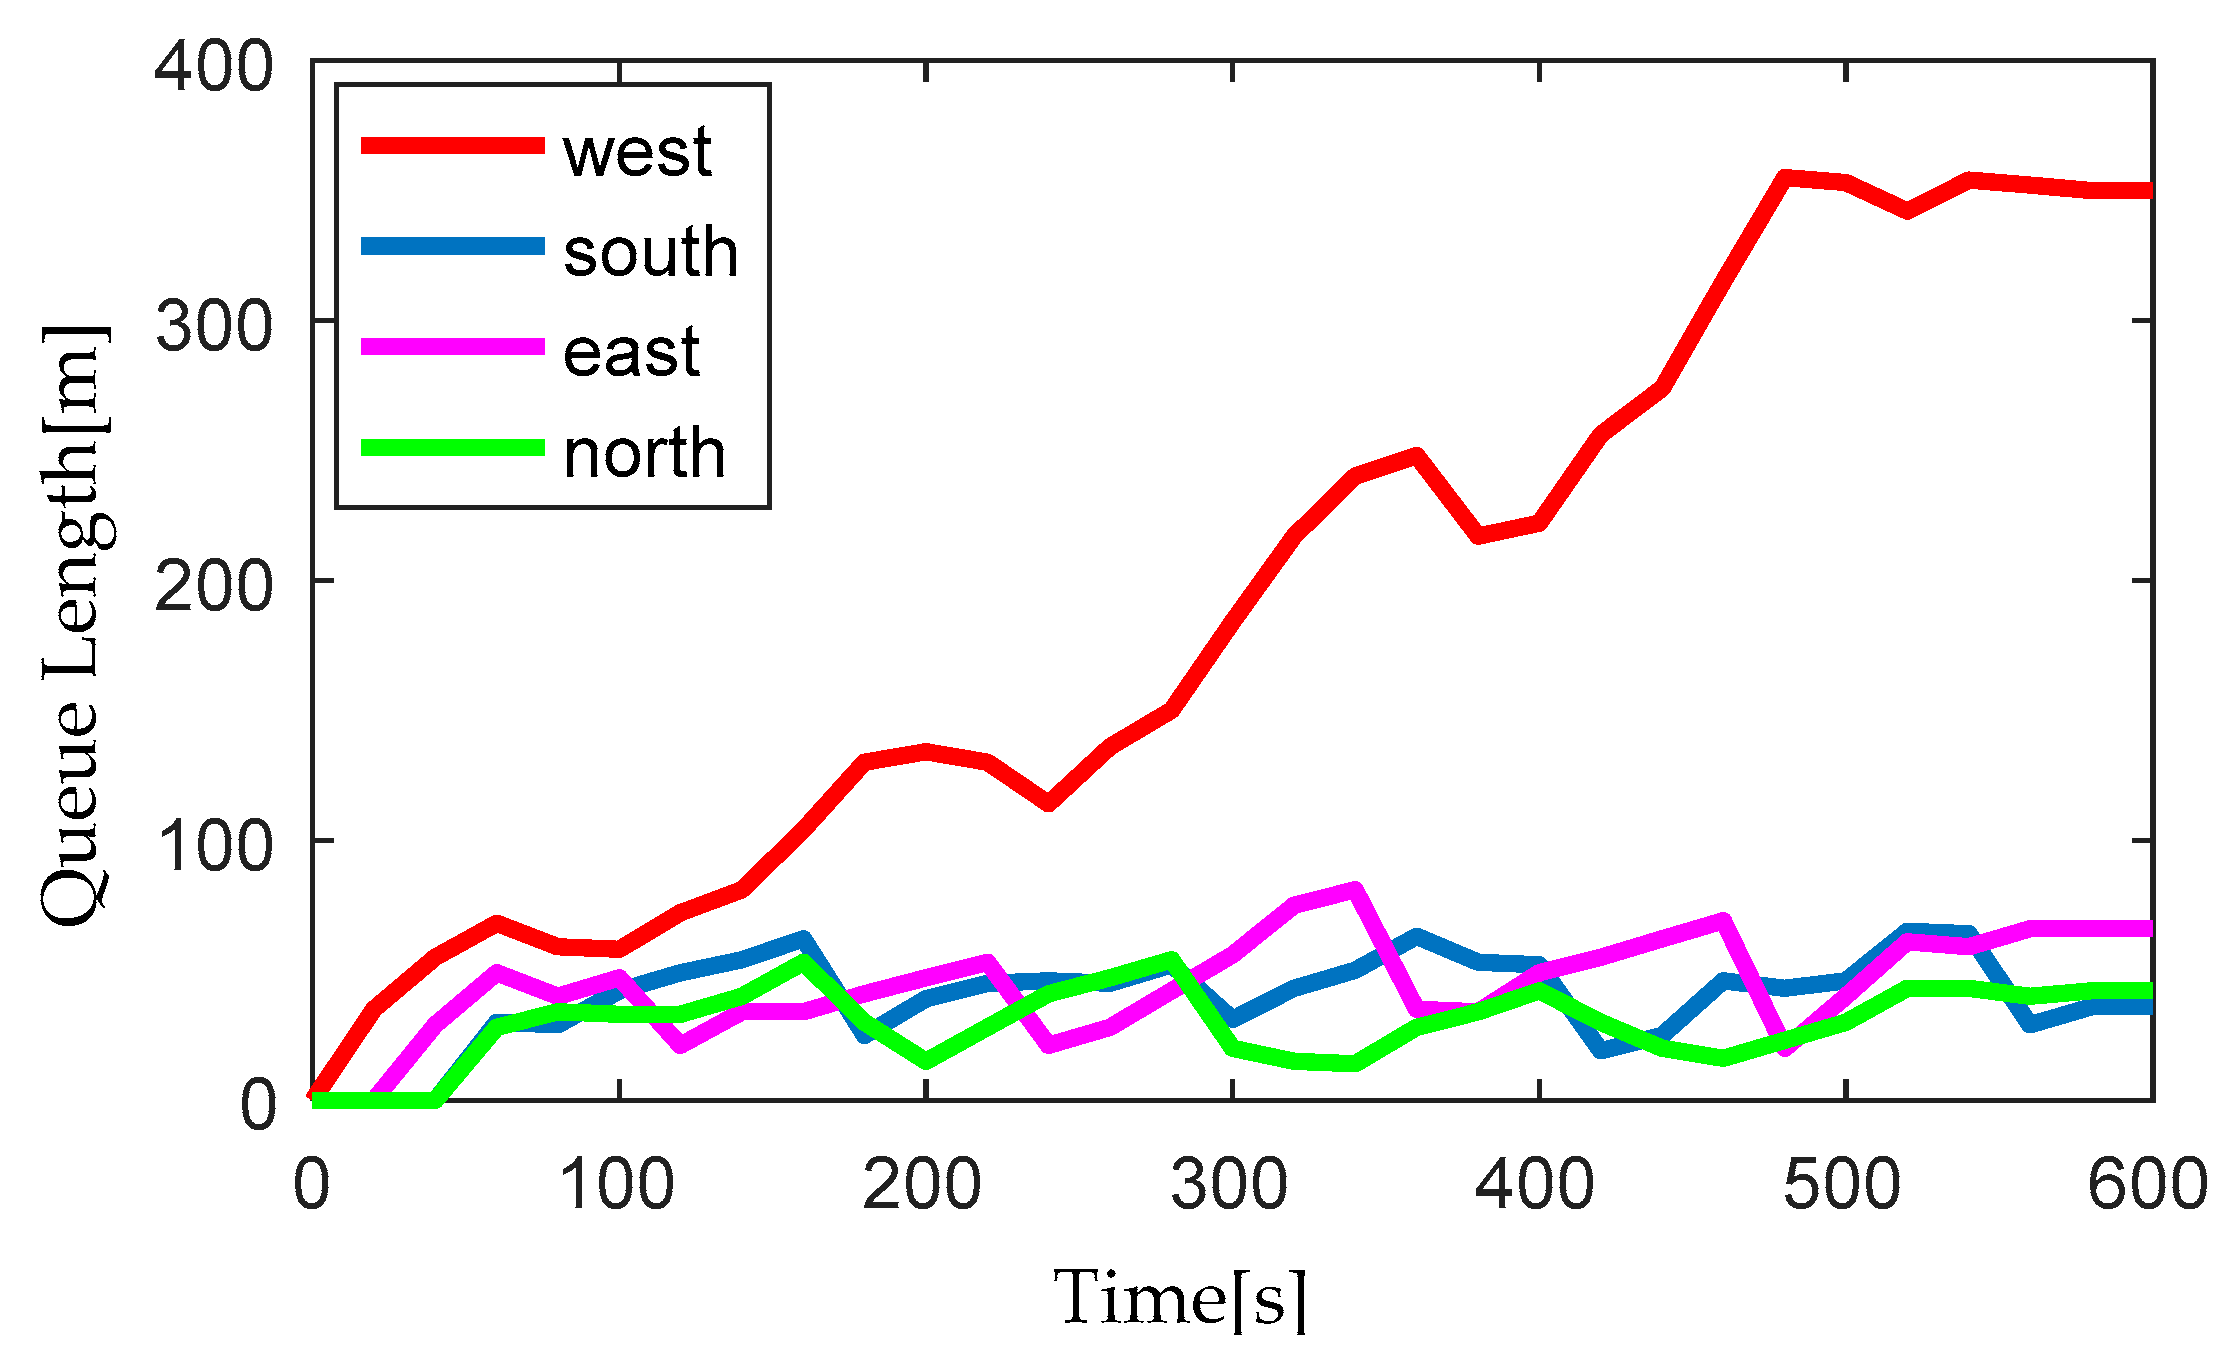
The survey showed that the length of the west approach section is 350 m and the traffic flow in the west straight section was large, which easily causes queuing overflow. The proposed method was used to simulate with VISSIM. The maximum queuing length of each section was taken as the target amount. The simulation results are shown in
Figure 7. As it can be seen from
Figure 7, the west approach spills over in the 500 s and will continue to overflow under uncontrolled conditions, eventually resulting in spillovers. The traffic volume of other roads was in a normal trend, indicating the same at the time of the signal allocation. The volume of traffic on the south and north sections can be self-regulated to ensure normal traffic operation.
In view of the problem of spillover of the west approach at this intersection, it was necessary to determine the position of its overflow limit point. The simulation compared the positions at 60%, 70% and 80% respectively. After setting the detection point on the overflow section, the maximum queue length was still taken as the target detection amount. The simulation results are shown in
Figure 8.
The simulation results of
Figure 8 can be analyzed:
- (1)
When the detector position was at 60% of the road, the blue line in the graph represents the change in the maximum queue length of the road. The initial moment of vehicle queuing was detected to be 320 s, and the arrival time of overflow was detected to be 500 s. The interval time was 180 s, that is, when the detecting point detects the vehicle, overflow will arrive after 1.5 cycles; so, the signal control needs to be implemented in 1.5 cycles.
- (2)
When the detector position was at 70% of the road, the red line in the graph represents the change in the maximum queue length of the road. The initial moment of vehicle queuing was detected to be 440 s, and the arrival time of overflow was detected to be 500 s. The interval time was 60 s, that is, when the detecting point detects the vehicle, overflow will arrive after 0.5 cycles; so the signal control needs to be implemented in 0.5 cycles.
- (3)
Similarly, when the detection point was located at 80% of the road, the signal control needs to be completed within 0.25 cycles.
In order to achieve effective control of the intersection, one cycle interval must be ensured. Therefore, based on the simulation results analysis, the detector should be placed at 60% of the length of the intersection. Accordingly, when the detector detects a queued vehicle, the control phase time is adjusted, and the next cycle begins. The intersection road is two-way four lanes, and the standard width of a single lane is 3.75 m, so the available crosswalk width is 15 m. The shortest time for the pedestrian to pass the crosswalk is as follows:
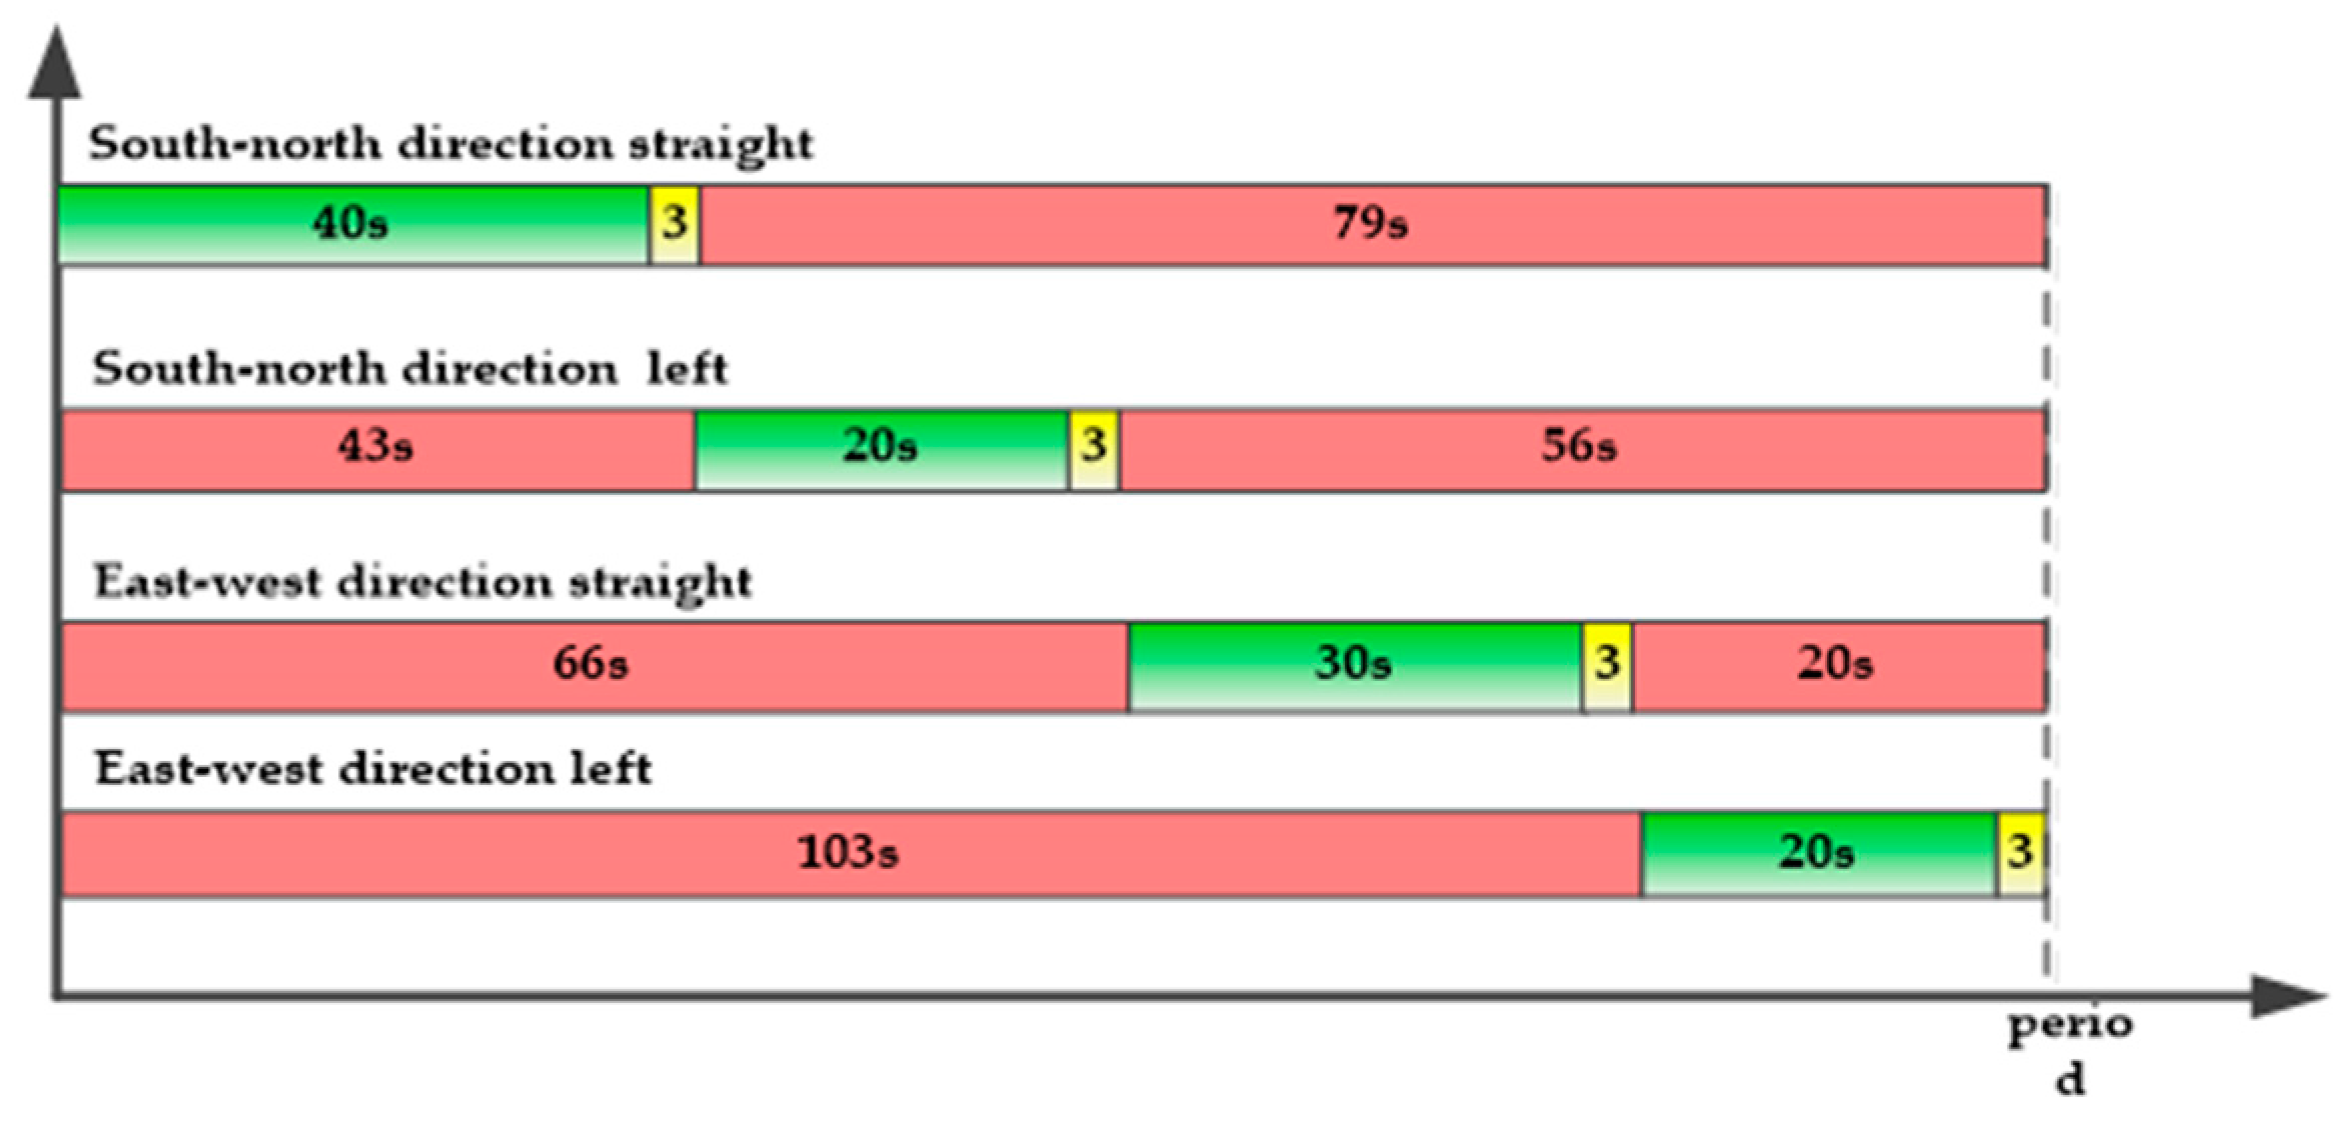
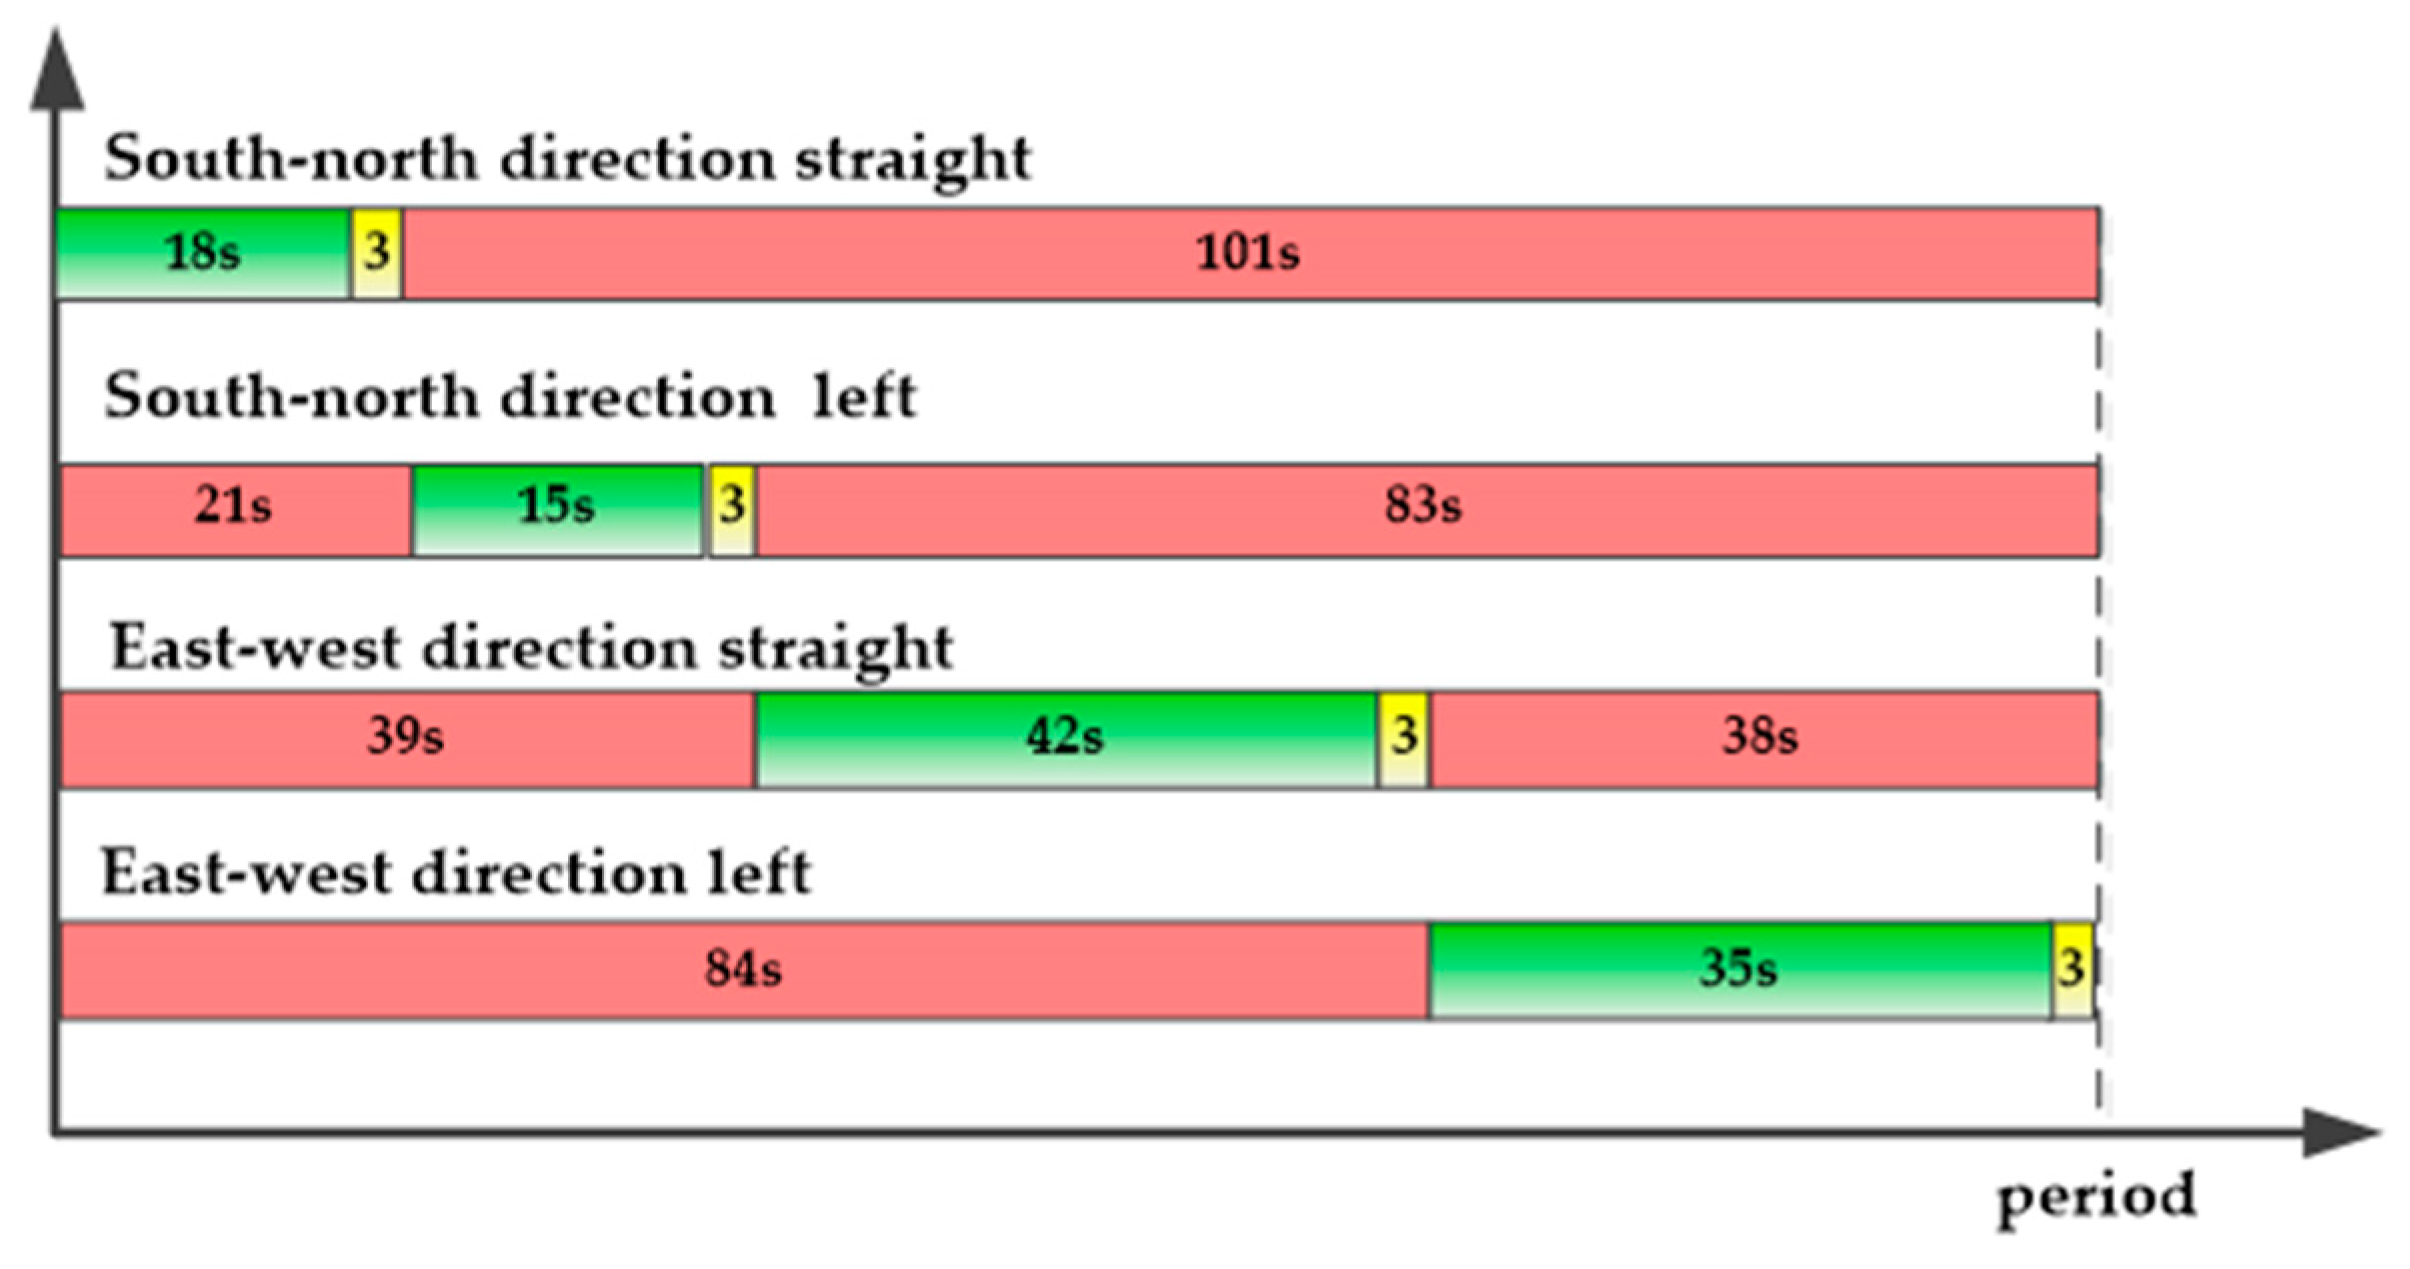
That is, the maximum straight-through phase of the southbound approach time is 40−12 = 28 s. The distribution of the maximum available phase of the southbound approach, is divided into two cases. One is to allocate only the maximum time that the southbound straight-line is allocated to the phase of the overflow, and the timing after the allocation is as shown in
Figure 9. The other phase is the left-turn phase of the southbound phase allotted to the overflow phase. After several simulation tests, the distribution of the timing is determined in
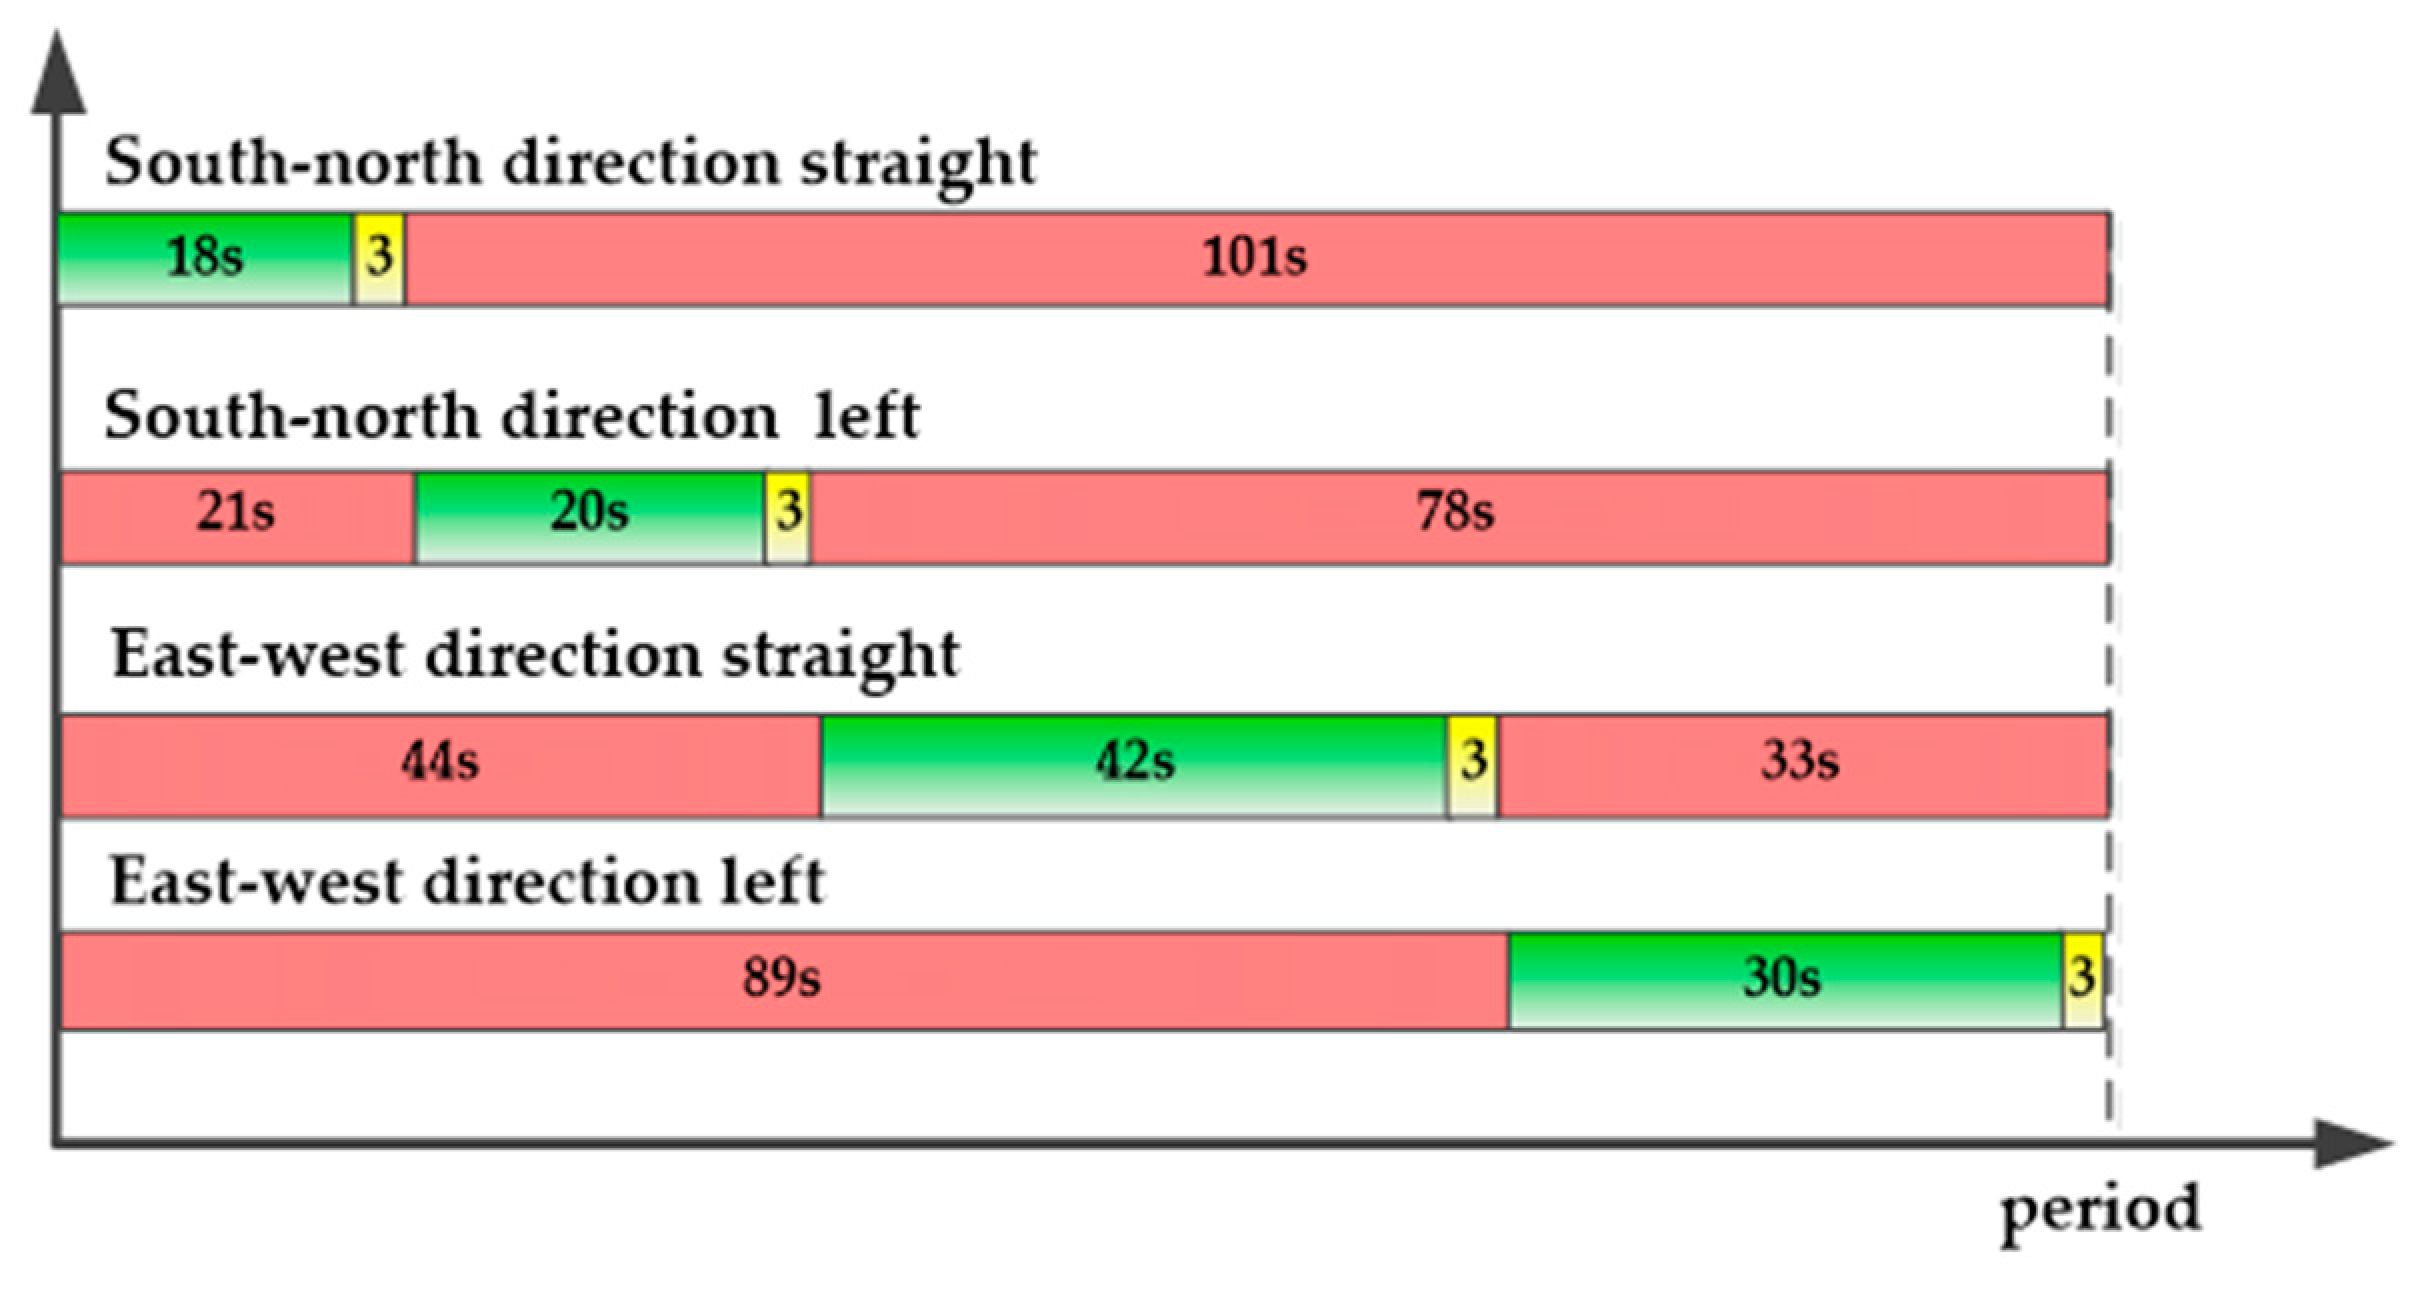
Figure 10. According to the determined overflow limit point at 60% of the road and the phase sequence after the change simulation, the result is shown in
Figure 10.
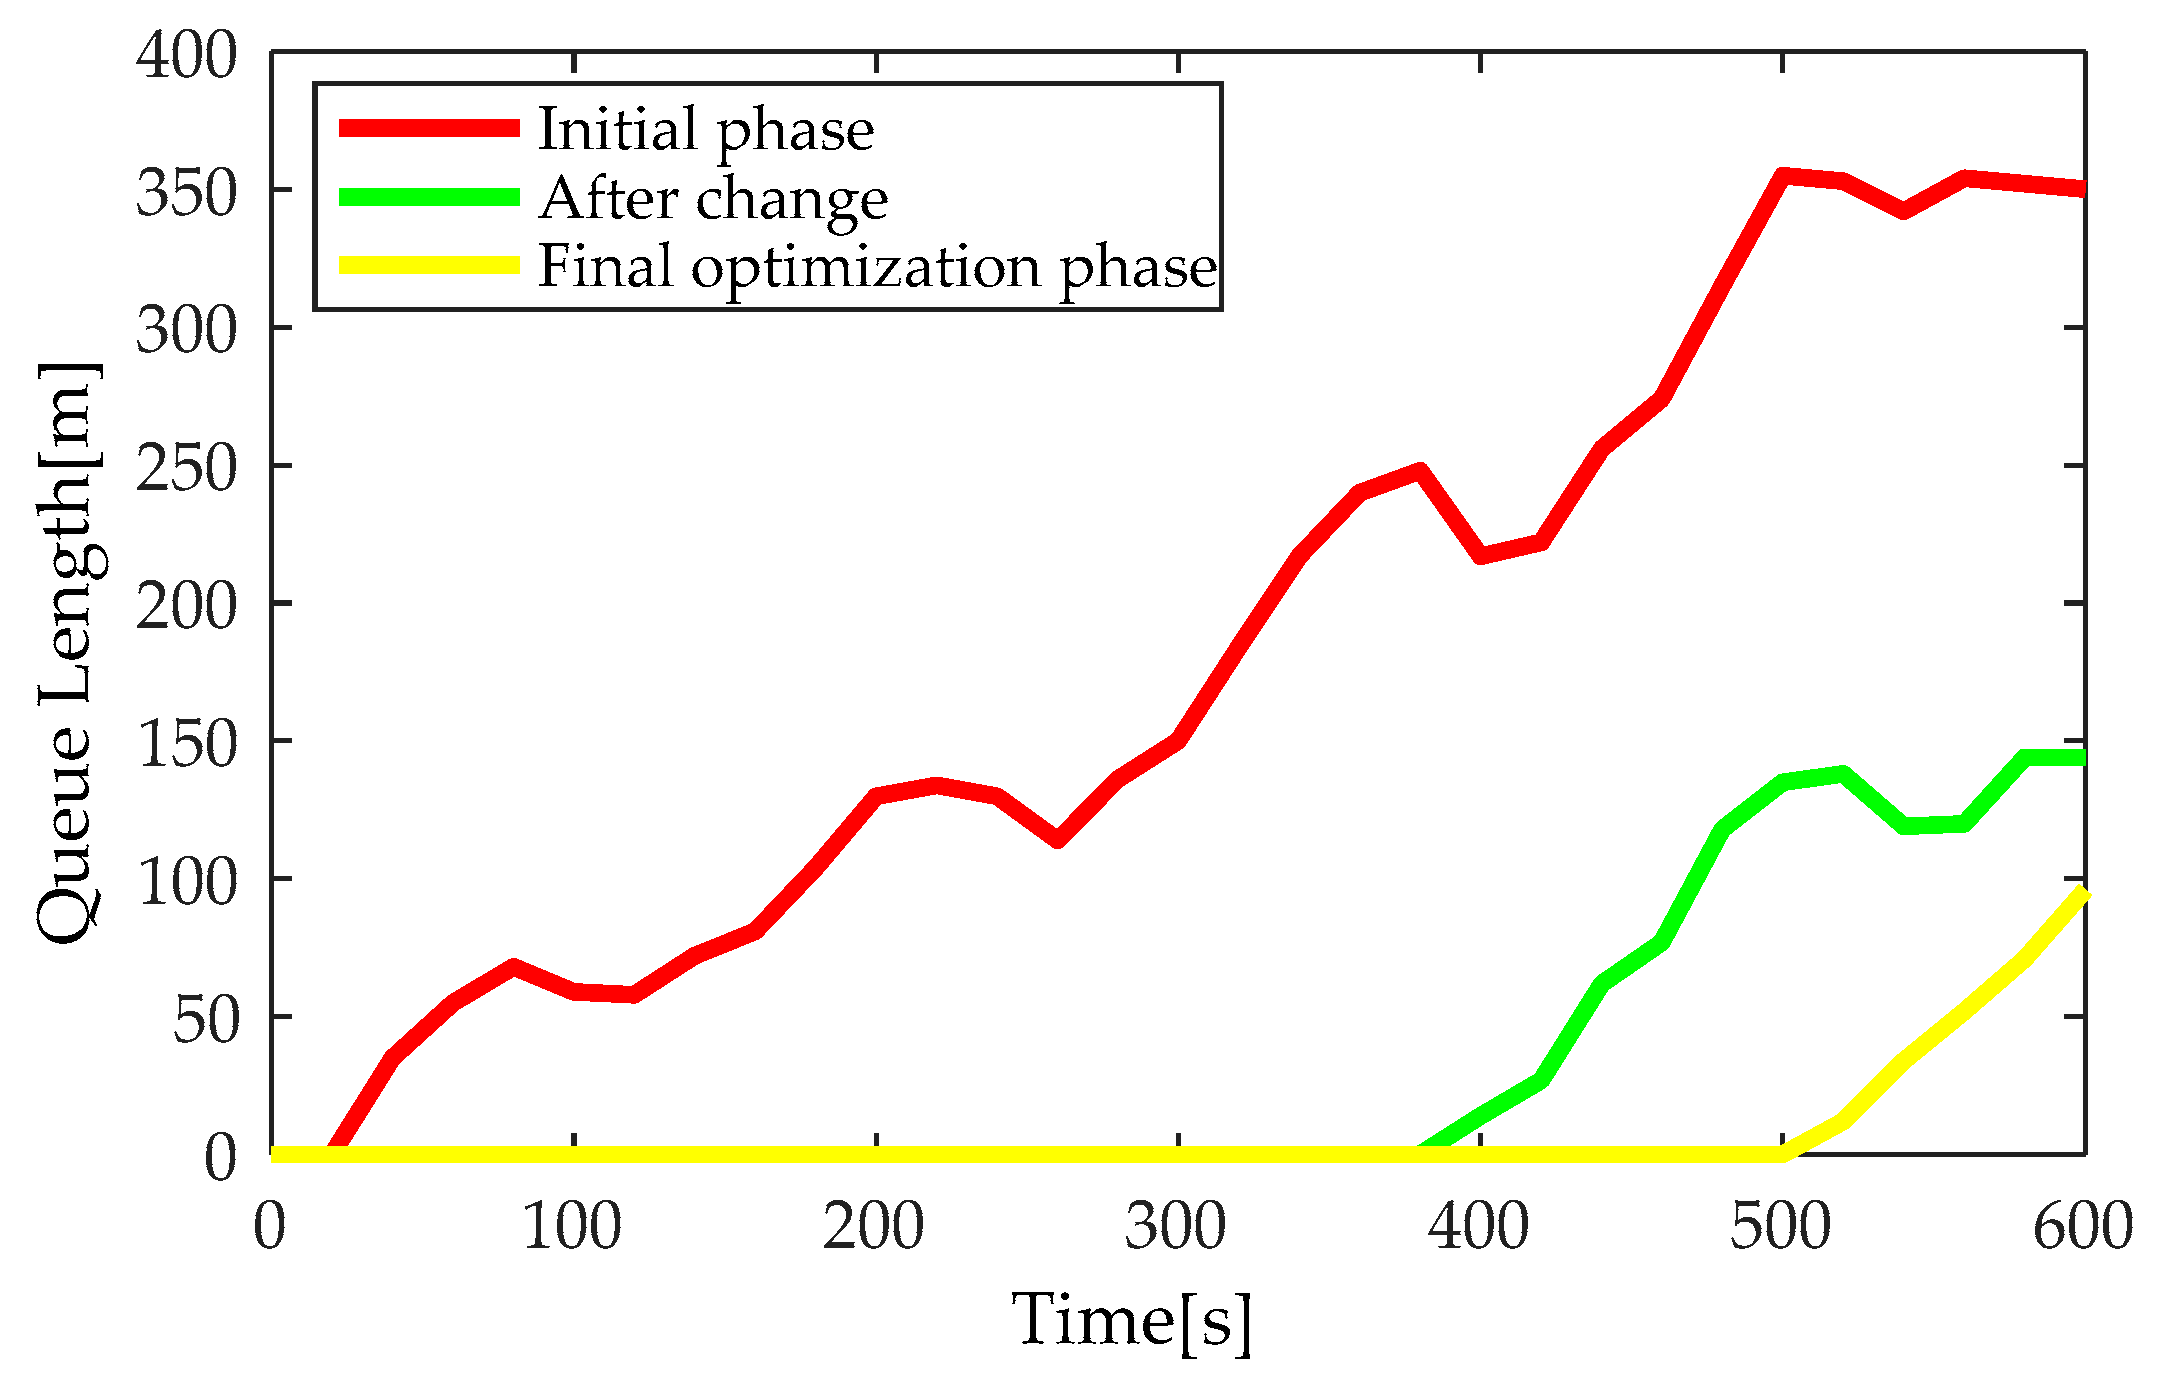
The three curves in the simulation results of
Figure 11, represent the maximum queue length curve (red curve) of the not optimized phase; the maximum queue length curve (green curve), after the maximum approach distribution time of the south entrance to the overflow phase; and the left distribution phase after the phase maximum queue length curve (yellow curve). Optimized green curve before the optimization of the queue length has been greatly improved, and the road will not overflow. To get the best result of optimization, the optimization method of the yellow curve is adopted. This method can improve the maximum queue length of overflow sections, without affecting the traffic of other sections. It is helpful to cope with the overflow behavior caused by peak or sudden time, and the road can be returned to normal when the traffic volume of intersections is reduced.


