Interactive 3D Exploration of RDF Graphs through Semantic Planes

 , , , , and
Abstract
:
1. Introduction
- p0
- Pre-Filtering: When dealing with RDF knowledge bases, the amount of triples contained in the data store may be really high (e.g., DBpedia contains more than 6.6 M triples). Representing in a graphical way such a large amount of data is usually both ineffective (it is hard for the user to retrieve the information he looks for) and inefficient (it is heavy from the point of view of memory occupation and computational resources). Then, a pre-filtering mechanism is required to extract the subgraph that is really relevant for the user from the full knowledge base.
- p1
- Node placement: Node positioning should be smart enough to avoid overlapping with other graphical elements such as edges or labels. The complexity of this task grows with the size of the KB. If possible, linked resources should be placed close to each other to easily gather as much information information as possible in a glimpse.
- p2
- Incremental approach: Often, only a small portion of a large KB needs to be inspected. Creating the visualization that fits the user needs may require a series of steps (e.g., to specify the information that must be represented and how it should be done). Thus, the incremental building of the view should be supported.
- p3
- Filtering: Filtering must be as flexible as possible to focus on the parts considered relevant for a task by hiding/showing information. Providing powerful filtering features in a user-friendly way is often a difficult task. It is, nevertheless, very important because of the close relationship to one of the techniques that are usually used in designing and debugging queries. According to an incremental progressive method, every step consists in applying a new condition to the previous query: in that way, a less error-prone coding technique, while at every step a new filter is applied to results, until the required level of precision is reached in the request.
- p4
- Support for RDFS and OWL: Both RDFS and OWL must be supported. The user should be able to select and filter the graph content by means of concepts such as class, domain and range of properties, datatype and object properties distinction.
- p5
- Support for a high number of scenarios: Semantic Web and Linked Data technologies may be applied to totally different and heterogeneous domains even within the same application. The datasets in the Linked Open Data cloud mainly belong to seven domains (cross-domain, geographic, media, life sciences, government, user-generated content, and publications) [6], while in the Internet of Things (IoT) where SW technologies are often applied, the application domains are more than 50 [7]. Depending on the specific use case, the end user may be interested in completely custom visualization perspectives.
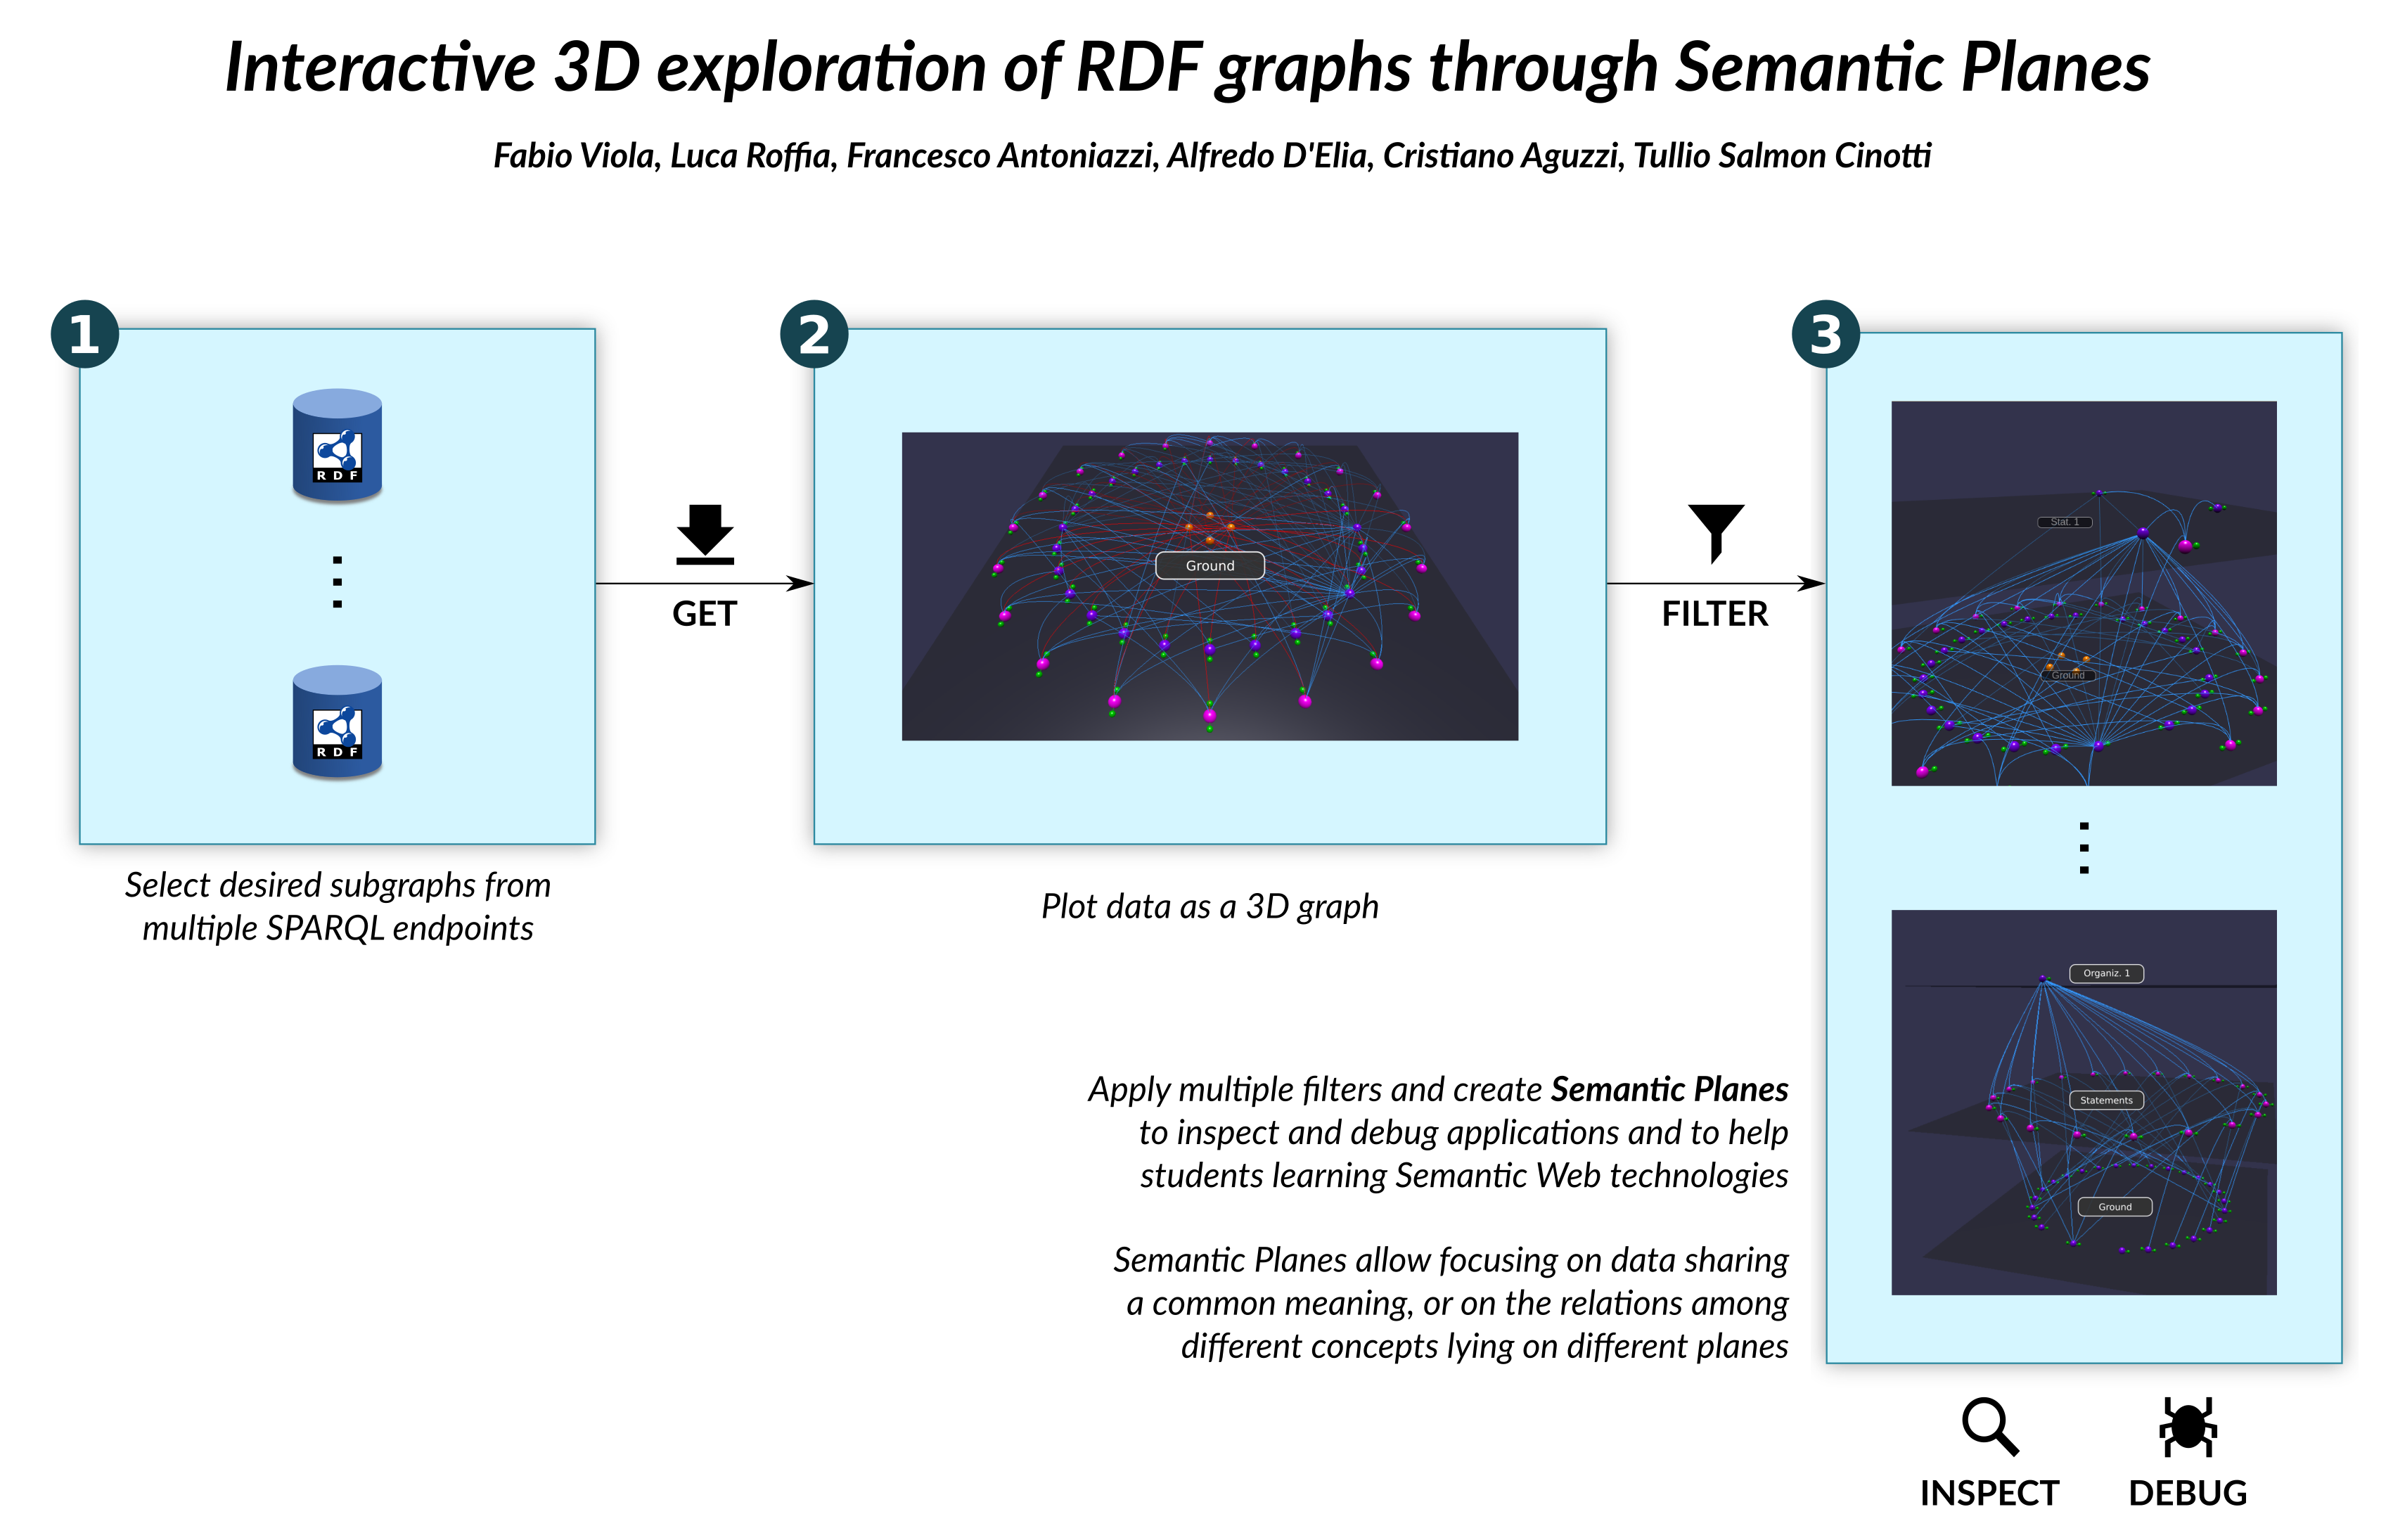
2. Tarsier: Splitting Data among Semantic Planes
2.1. Semantic Planes
- focusing on the information considered meaningful by looking at the related plane, while preserving a non-intrusive view on the rest of the knowledge base;
- focusing on the incoming and outgoing edges of a subgraph (i.e., semantic connection between planes).
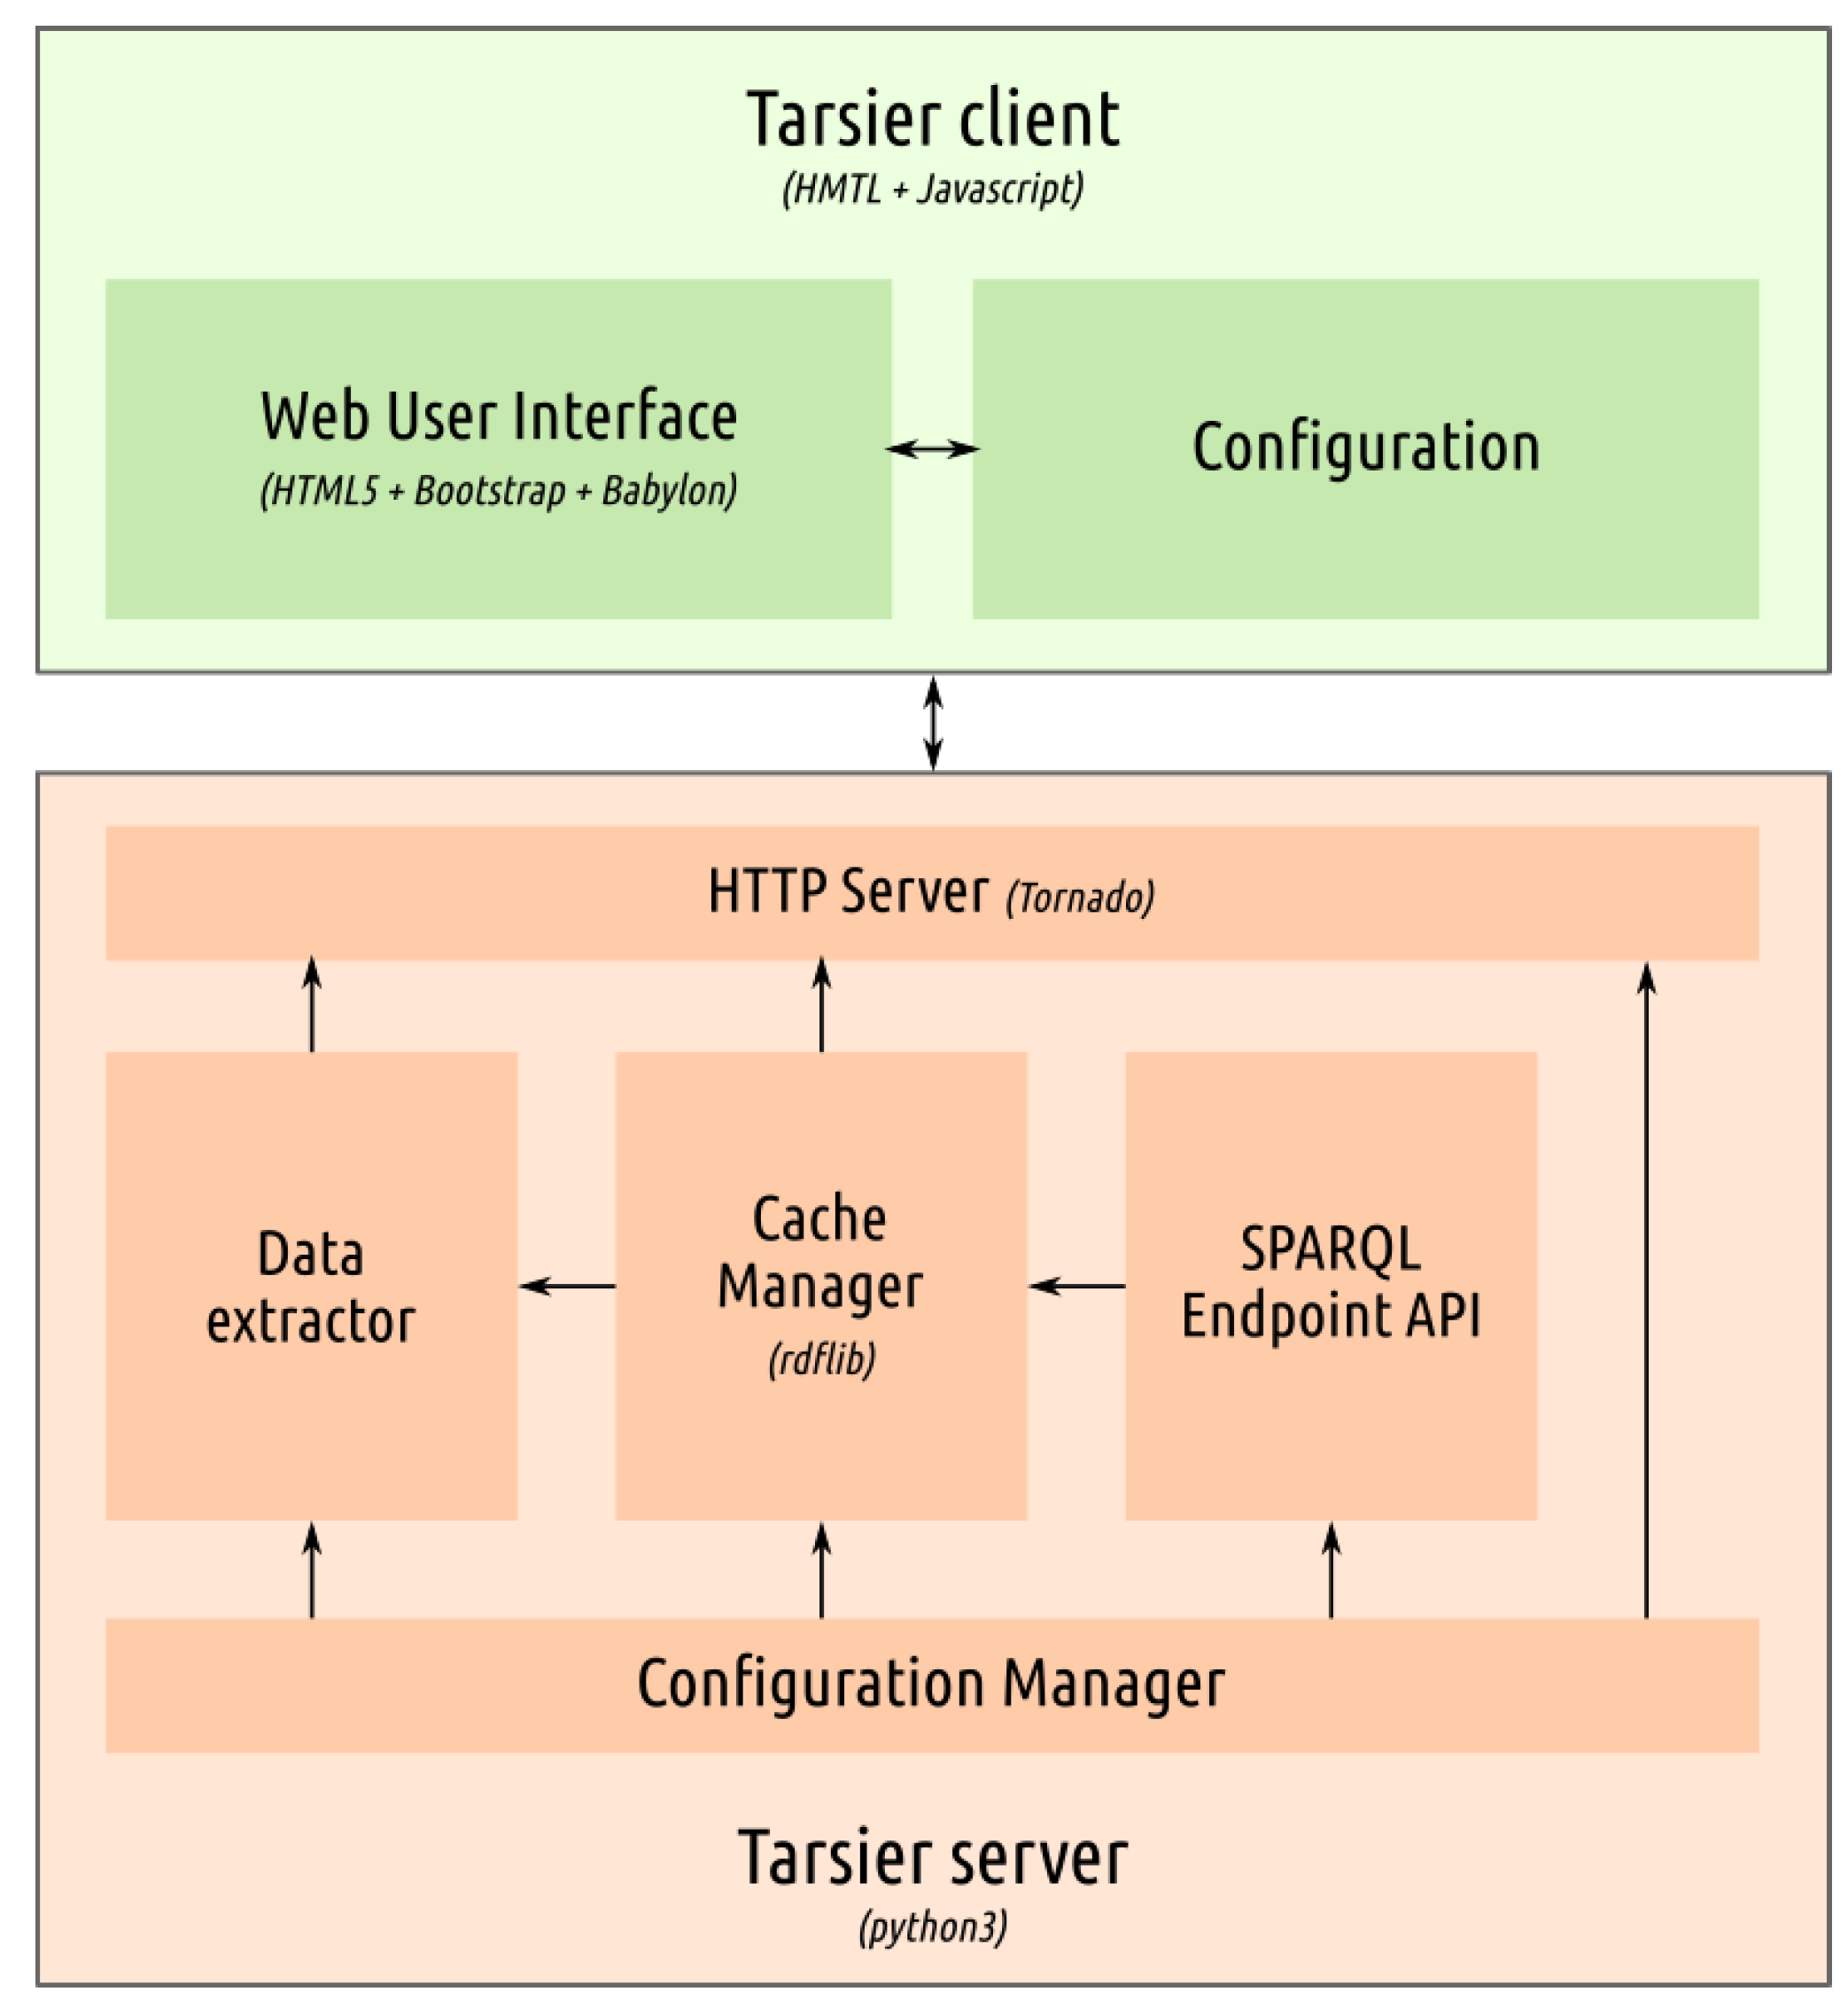
2.2. Tarsier Architecture
- A config manager, through which the server can be configured.
- A client for SPARQL endpoints, to retrieve data from the desired datasets.
- A Cache Manager. Since Tarsier is intended to be used also with dynamic systems where the KB evolves quickly, the application creates a snapshot of the knowledge base: (1) to avoid changes that would disrupt the user process of analysis; and (2) to have a local cache that speeds up every query to data. The user is able to update the local storage producing a new snapshot.
- A data extractor that performs the above-mentioned identification of RDF terms. The resulting information is then organized in a data structure that helps the client to easily retrieve all the elements needed to draw and apply the filters selected by the user. The data extractor performs its task through a set of SPARQL queries detailed in Section 2.5.
- The HTTP interface through which client and server communicate.
2.3. Implementation
2.4. Features
- Initial Knowledge Base :
- Tarsier is a visualization tool for RDF graphs. As such, it allows to view the whole content of a graph through the canvas. However, RDF graphs may be very large, hosting a high number of triples too difficult to represent in an effective way. For this reason, Tarsier supports a pre-filtering of the knowledge base through SPARQL Construct queries (addressing in this way the requirement p0) that can be also loaded from a file. In this way, the user may dominate the complexity of the underlying knowledge base focusing only on the information considered relevant for the current task. An example is shown in Figure 2.
- Support for RDFS and OWL :
- Despite being ontology agnostic (to adapt to different use cases, as suggested by point p5), Tarsier, through its data extractor (see Section 2.5), is able to detect classes, datatype properties and object properties through the use of RDFS and OWL constructs (requirement p4). Comments and labels are also retrieved with the specific predicates.
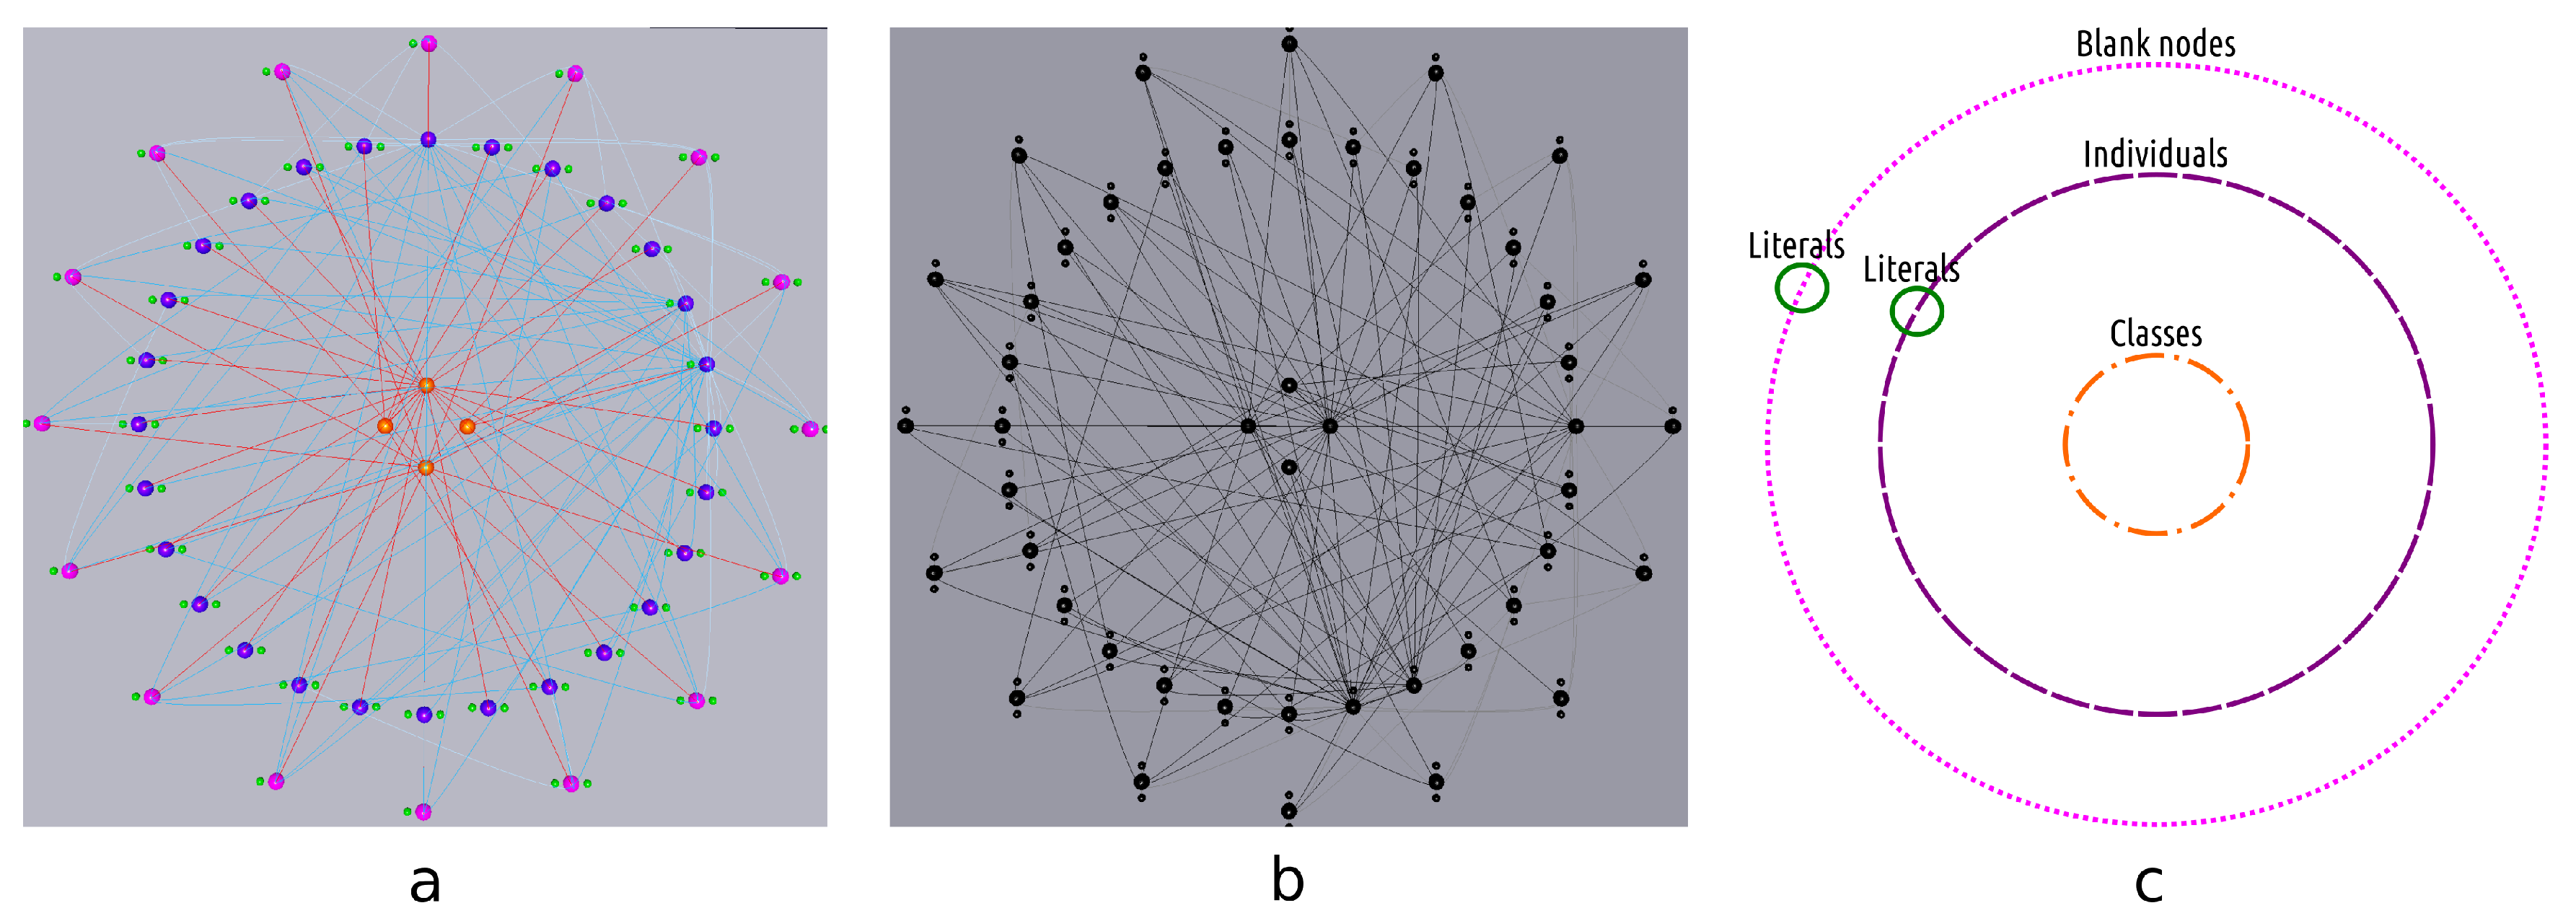
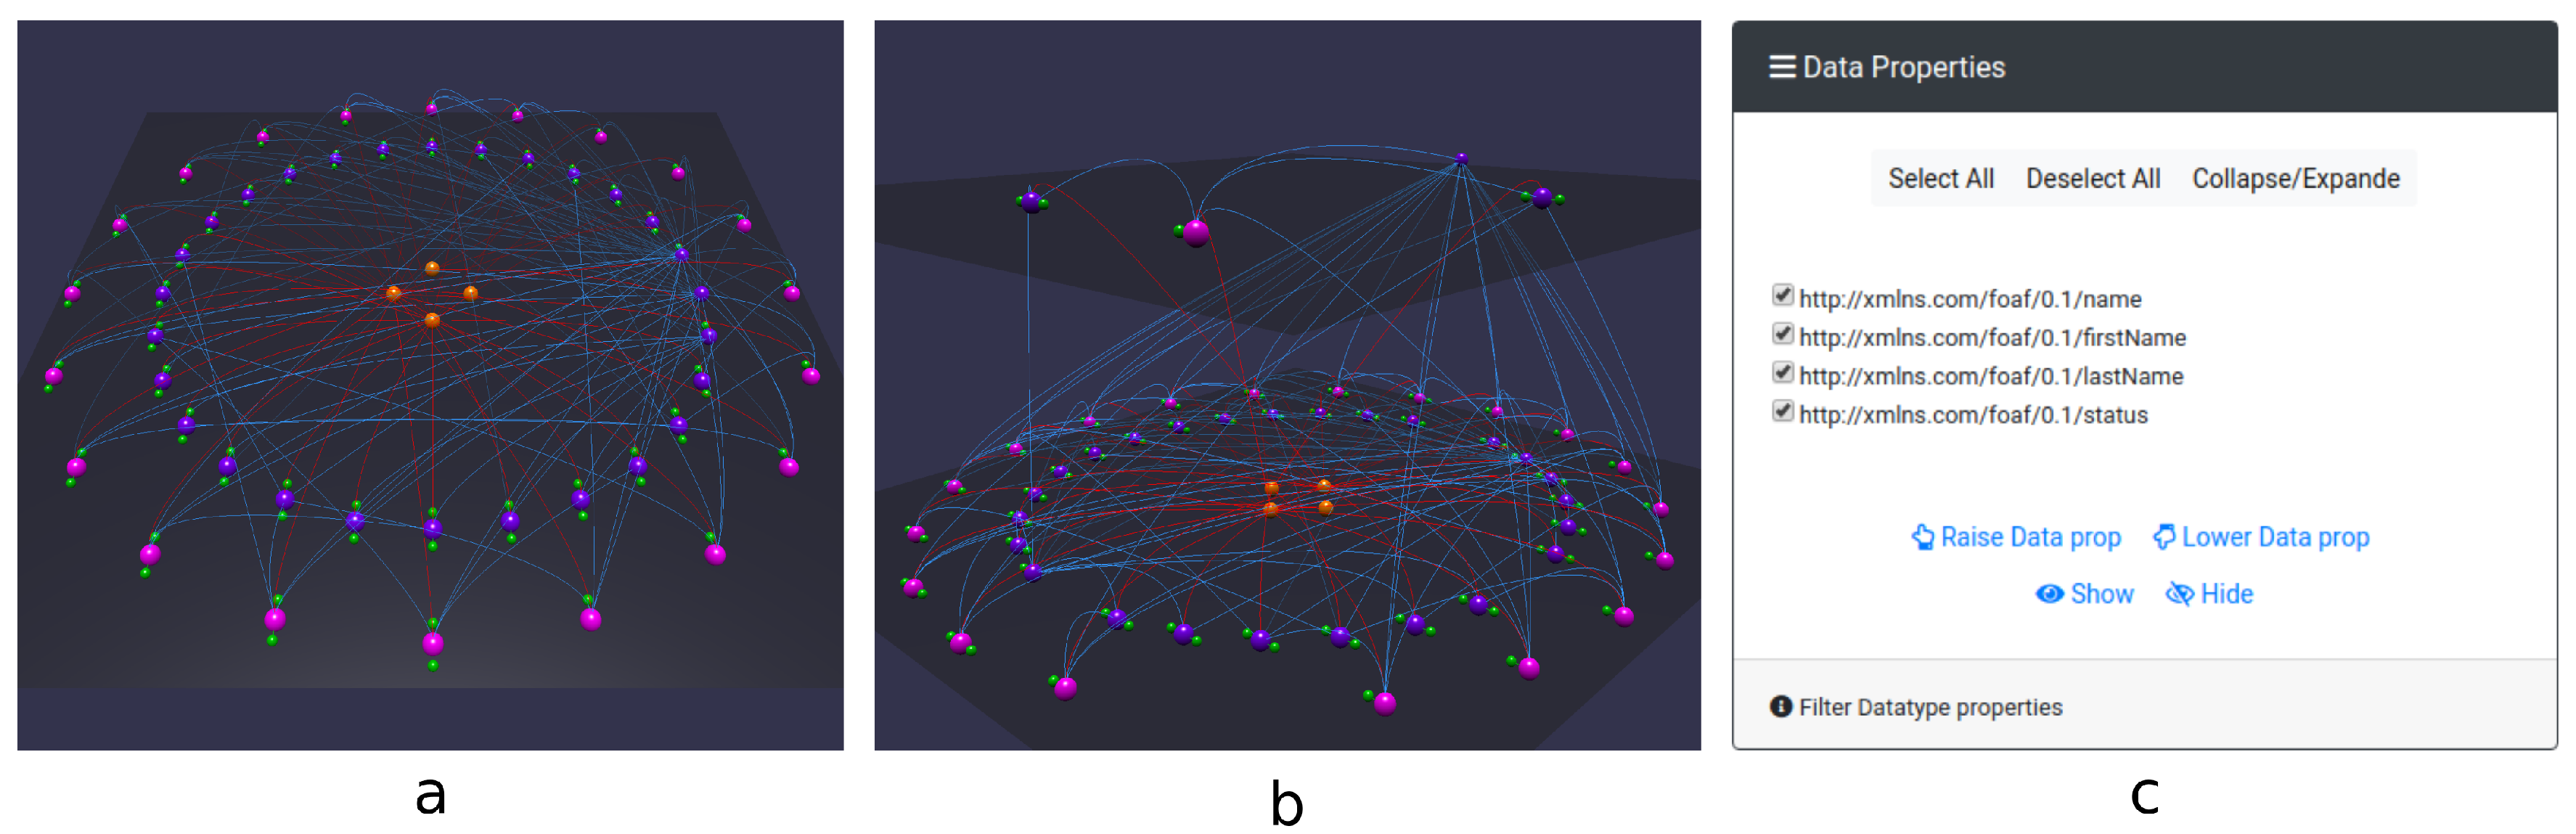
- Visualization techniques :
- Being able to quickly distinguish classes from other resources, datatype from object properties and rdf:type relationships above all may significantly speed up the analysis process (Figure 3a). Therefore, Tarsier adopts a classification algorithm based (mostly) on a set of SPARQL queries (detailed in Section 2.5) to identify classes, instances of classes, blank nodes, object and datatype properties and rdf:type relationships and paint each of them with a different color. Furthermore, a smart placement algorithm allows facing requirement p1, representing items through the following scheme: classes and individuals are represented as equidistant spherical meshes on two different circumferences. The circle dedicated to classes is the innermost, since usually the number of concepts is less than the number of instances. Blank nodes lay on a third circumference. Datatype properties of an instance are equidistant spheres placed on a circumference centered on the instance (Figure 3c). Further research will be carried out to design and test different arrangement methods.
- Filtering :
- The filtering mechanism (Figure 4) implemented by Tarsier allows selecting items through UI or SPARQL queries and decide what action to perform. Selection can be related to classes, instances, datatype or object properties as well as literals, URIs or blank nodes. The action consists in showing or hiding selected meshes as well as moving them across layers. Every filter applies to the current visualization, allowing incremental filtering. This mechanism allows iteratively building a visualization that fits the user need even for novice users. Tarsier’s filtering mechanism meets the requirements identified in points p2 and p3.
2.5. Data Extractor
PREFIX rdf:<http://www.w3.org/1999/02/22-rdf-syntax-ns#>
PREFIX rdfs:<http://www.w3.org/2000/01/rdf-schema#>
PREFIX owl:<http://www.w3.org/2002/07/owl#>
SELECT DISTINCT ?class ?label ?comment
WHERE {
{ ?resource rdf:type ?class .
OPTIONAL { ?class rdf:label ?label } .
OPTIONAL { ?class rdf:comment ?comment }
}
UNION {
?class rdf:type owl:Class .
OPTIONAL { ?class rdf:label ?label } .
OPTIONAL { ?class rdf:comment ?comment }
}
UNION {
?class rdf:type rdfs:Class .
OPTIONAL { ?class rdf:label ?label } .
OPTIONAL { ?class rdf:comment ?comment }
}
}
PREFIX rdf:<http://www.w3.org/1999/02/22-rdf-syntax-ns#>
PREFIX rdfs:<http://www.w3.org/2000/01/rdf-schema#>
PREFIX owl:<http://www.w3.org/2002/07/owl#>
SELECT DISTINCT ?prop ?domain ?range ?label ?commentWHERE { { ?prop rdf:type owl:DatatypeProperty . OPTIONAL{ ?prop rdfs:range ?range } . OPTIONAL{ ?prop rdfs:domain ?domain } . OPTIONAL{ ?prop rdfs:label ?label } . OPTIONAL{ ?prop rdfs:comment ?comment }}
UNION {?s ?prop ?o .
FILTER isLiteral(?o)}
}
PREFIX rdf:<http://www.w3.org/1999/02/22-rdf-syntax-ns#>
PREFIX rdfs:<http://www.w3.org/2000/01/rdf-schema#>
PREFIX owl:<http://www.w3.org/2002/07/owl#>
SELECT DISTINCT ?prop ?domain ?range ?label ?commentWHERE { { ?prop rdf:type owl:ObjectProperty . OPTIONAL { ?prop rdfs:range ?range } . OPTIONAL { ?prop rdfs:domain ?domain } . OPTIONAL { ?prop rdfs:label ?label} . OPTIONAL { ?prop rdfs:comment ?comment }}
UNION { ?s ?prop ?o .FILTER (isIRI(?o) || isBlank(?o))
}
}
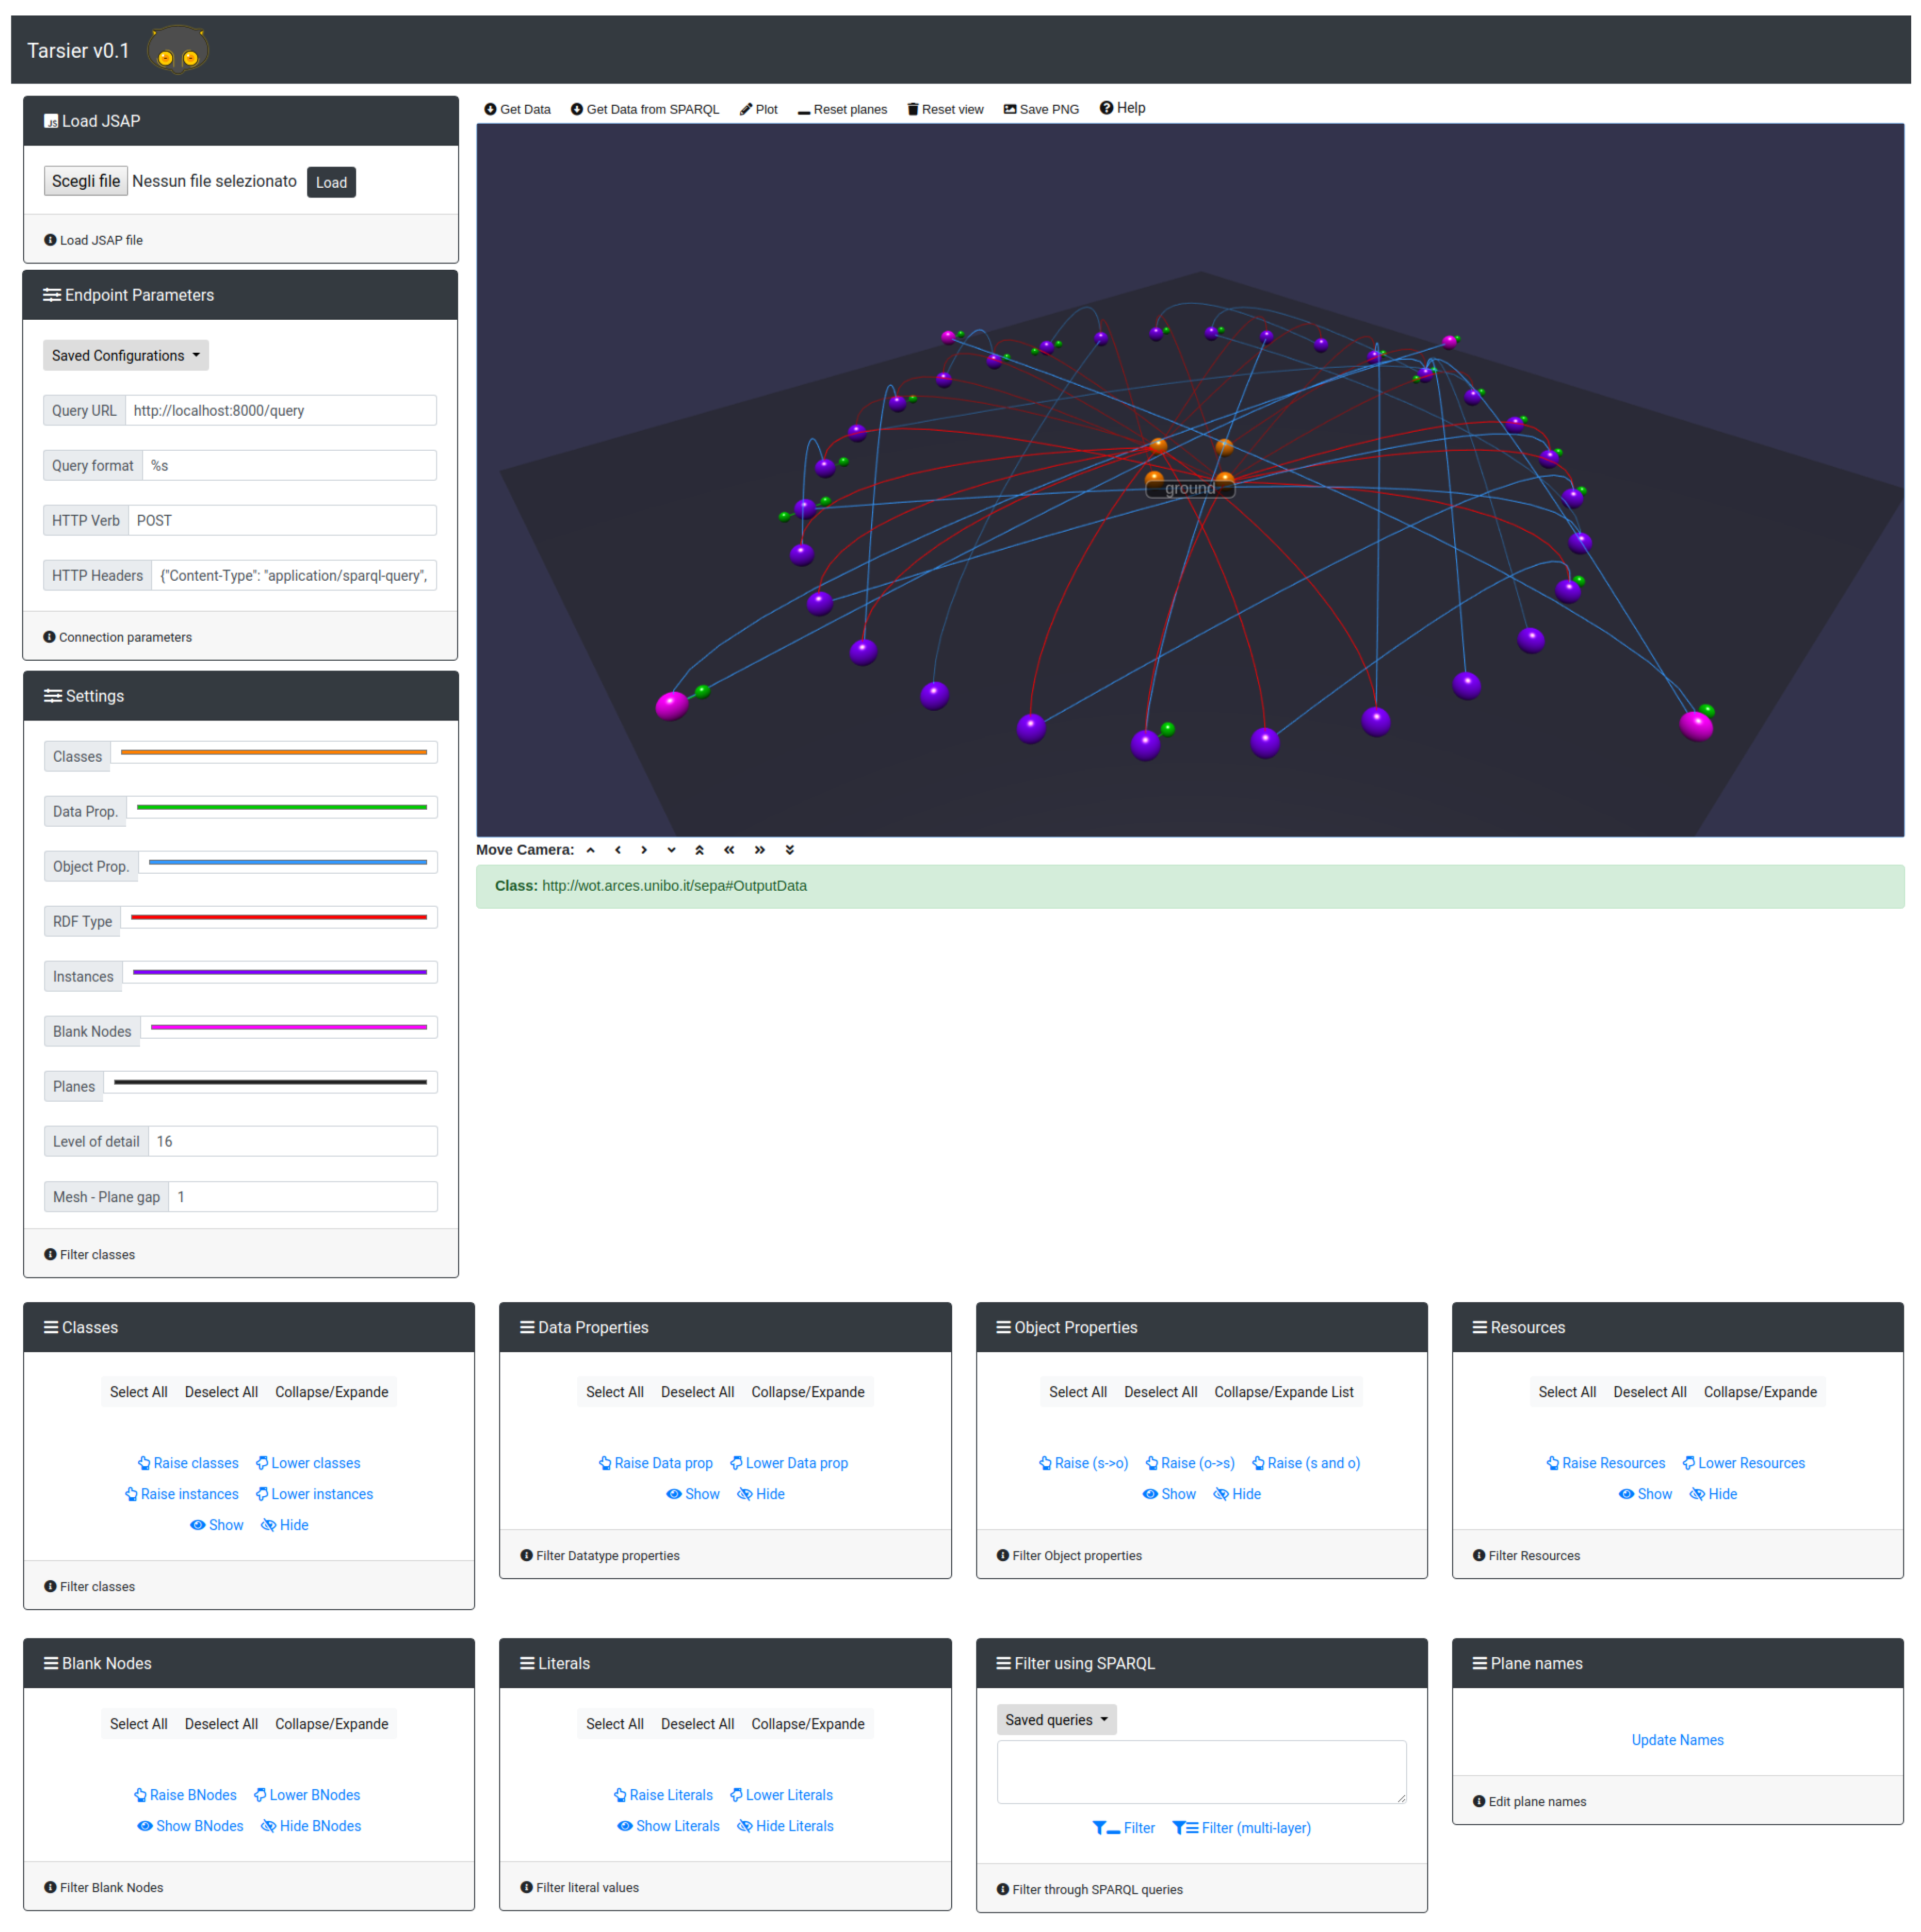
2.6. User Interface
- Classes: Presents a lists of the classes identified by the data extractor using the query in Listing 1. A checkbox is drawn next to each item to select and deselect the related class. On the selected items, the user may act to toggle visibility or move them across layers. Through this box, it is also possible to show/hide and move resources belonging to the selected classes.
- Resources: Contains a list of referents (i.e., IRI resources). As for the classes, the user is allowed to select/deselect items and modify visibility and the layer they belong to.
- Blank Nodes: This panel presents the list of blank nodes found in the knowledge base, along with the buttons to change visibility and layer.
- Object Properties: This box contains the list of object properties detected by the data extractor (with the SPARQL Query of Listing 3). This box allows to select properties and show/hide or move to other layers the subject and/or of the triples with that predicate.
- Data Properties: In this card, all the data properties are shown and the same functionalities of the previous boxes are provided.
- Literals: Through this box, it is possible to see all the literals (i.e., values of the datatype properties) found in the knowledge base and move them or toggle their visibility.
- Filter Using SPARQL: While the previous boxes allow modifying the view without any knowledge of the SPARQL query language, more complex analysis are possible through this card. The results of the SPARQL query are then shown on a new semantic plane or on a set of semantic planes (i.e., one for each variable in the variable list of the query). The text area in this box is also used to input a SPARQL construct query for the initial extraction of the knowledge base.
- Plane names: Moving object from one plane to another causes the creation of semantic planes. The user, who knows the real meaning of a plane, can set and update the name through this box.
3. Use Cases
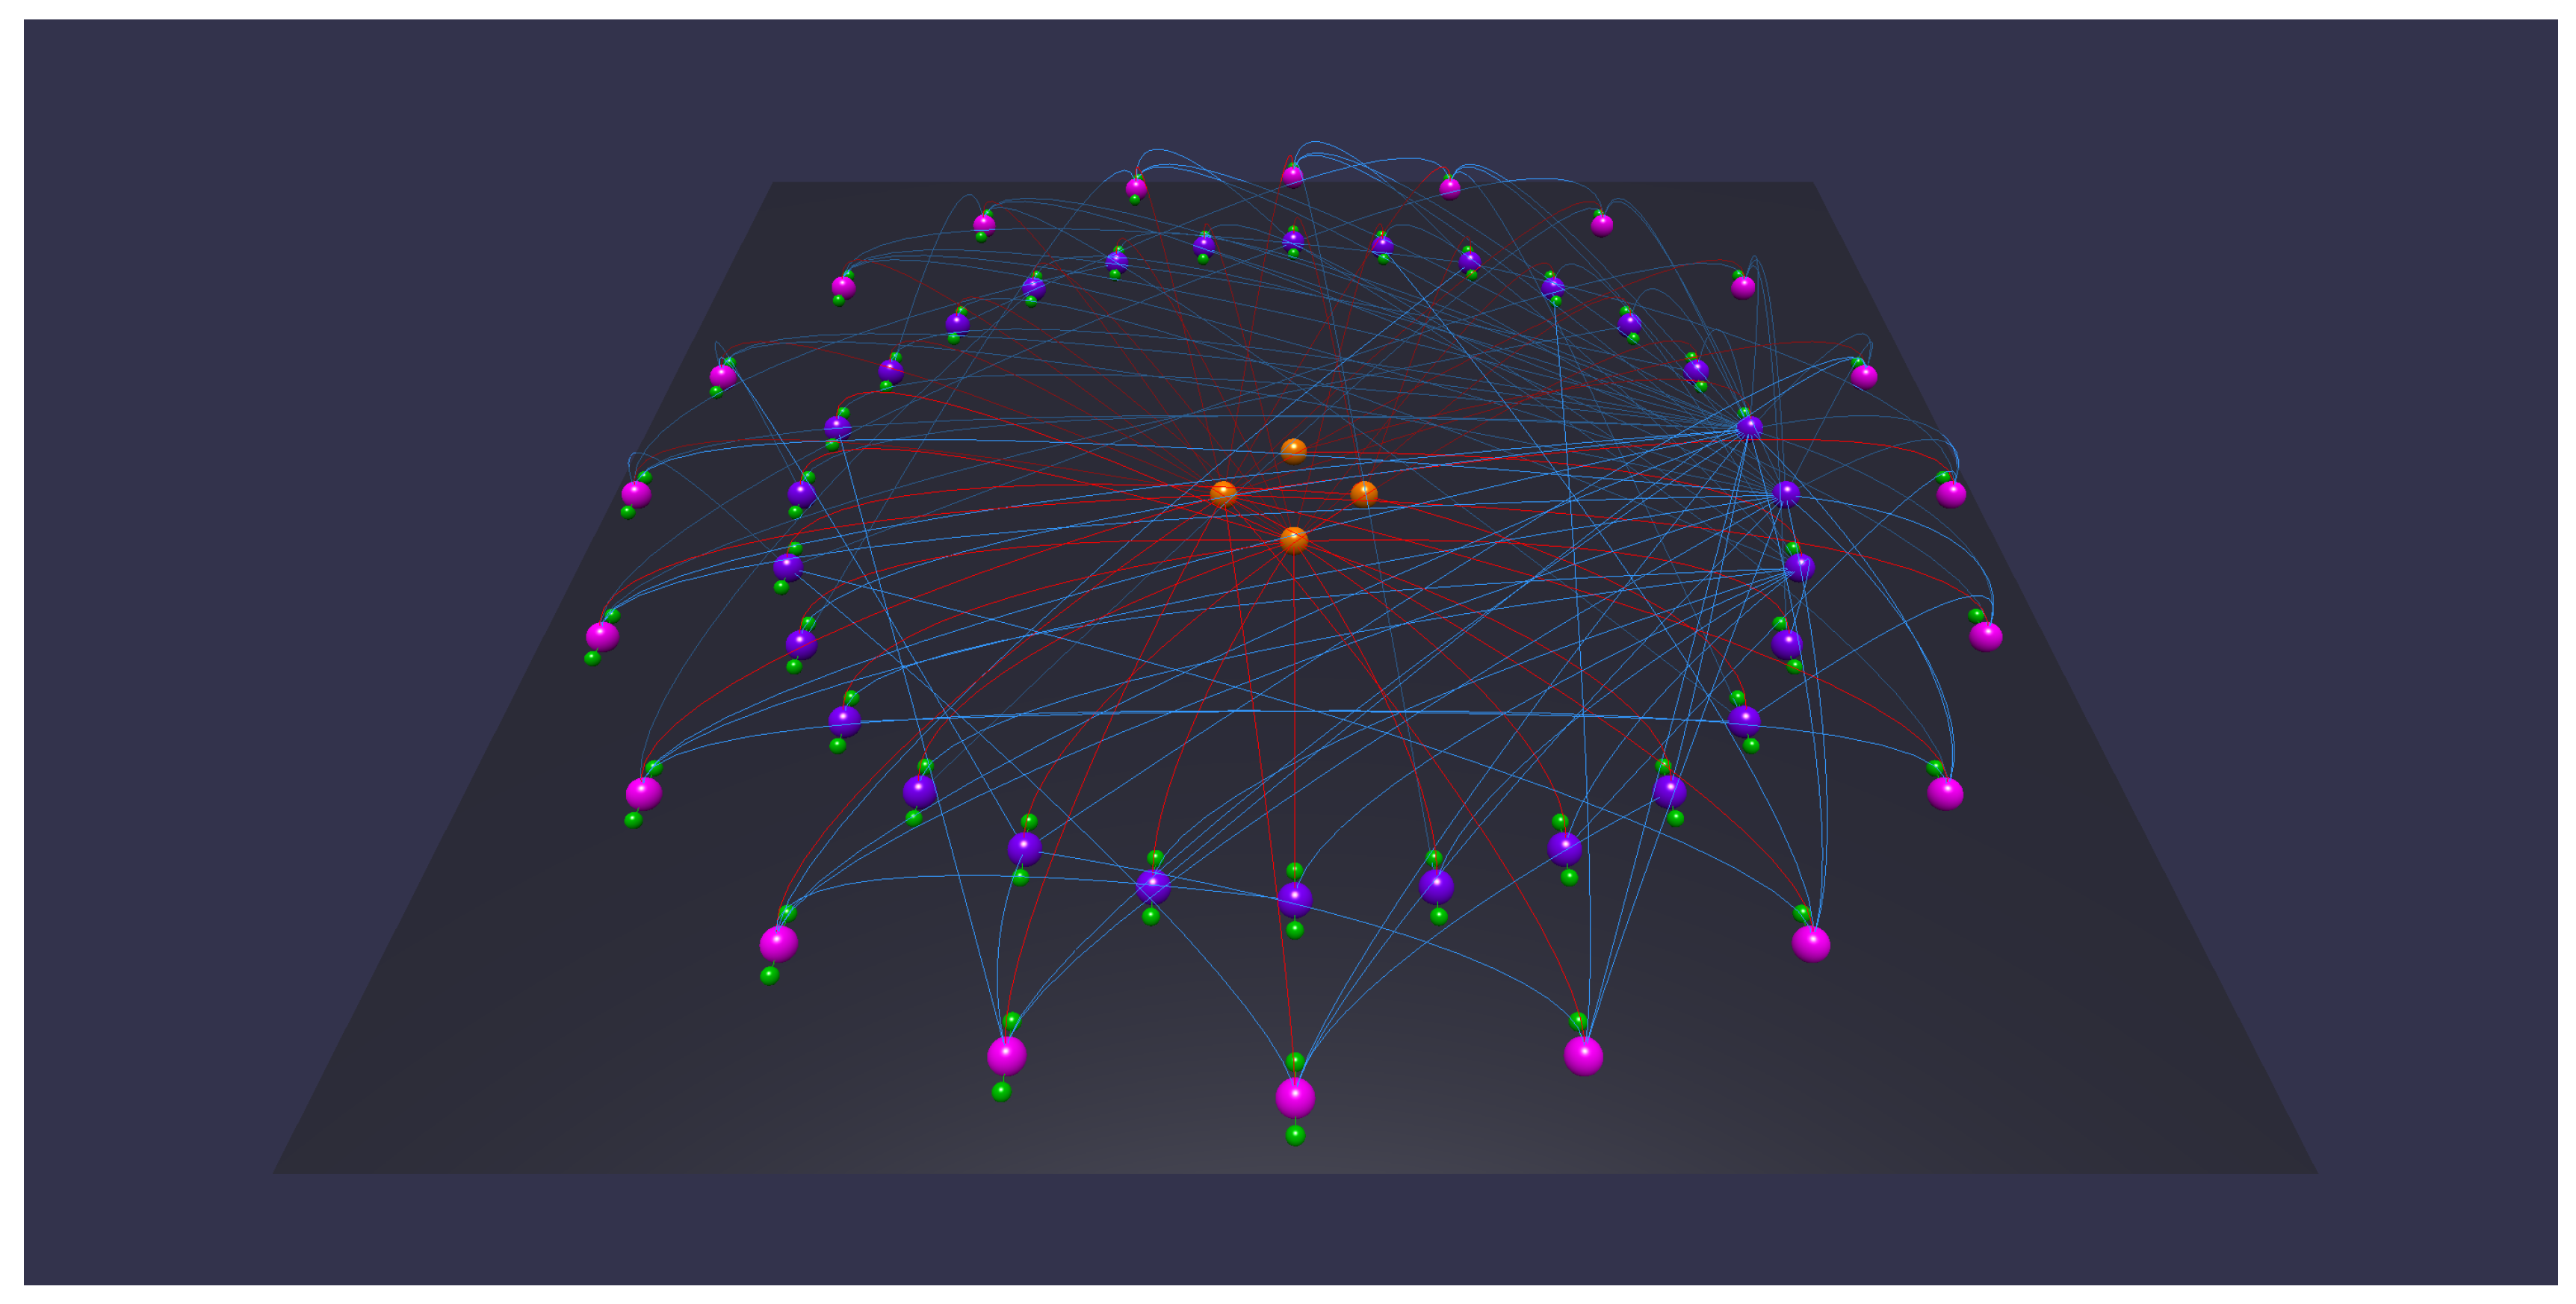
3.1. Use Case #1: Teaching through FOAF
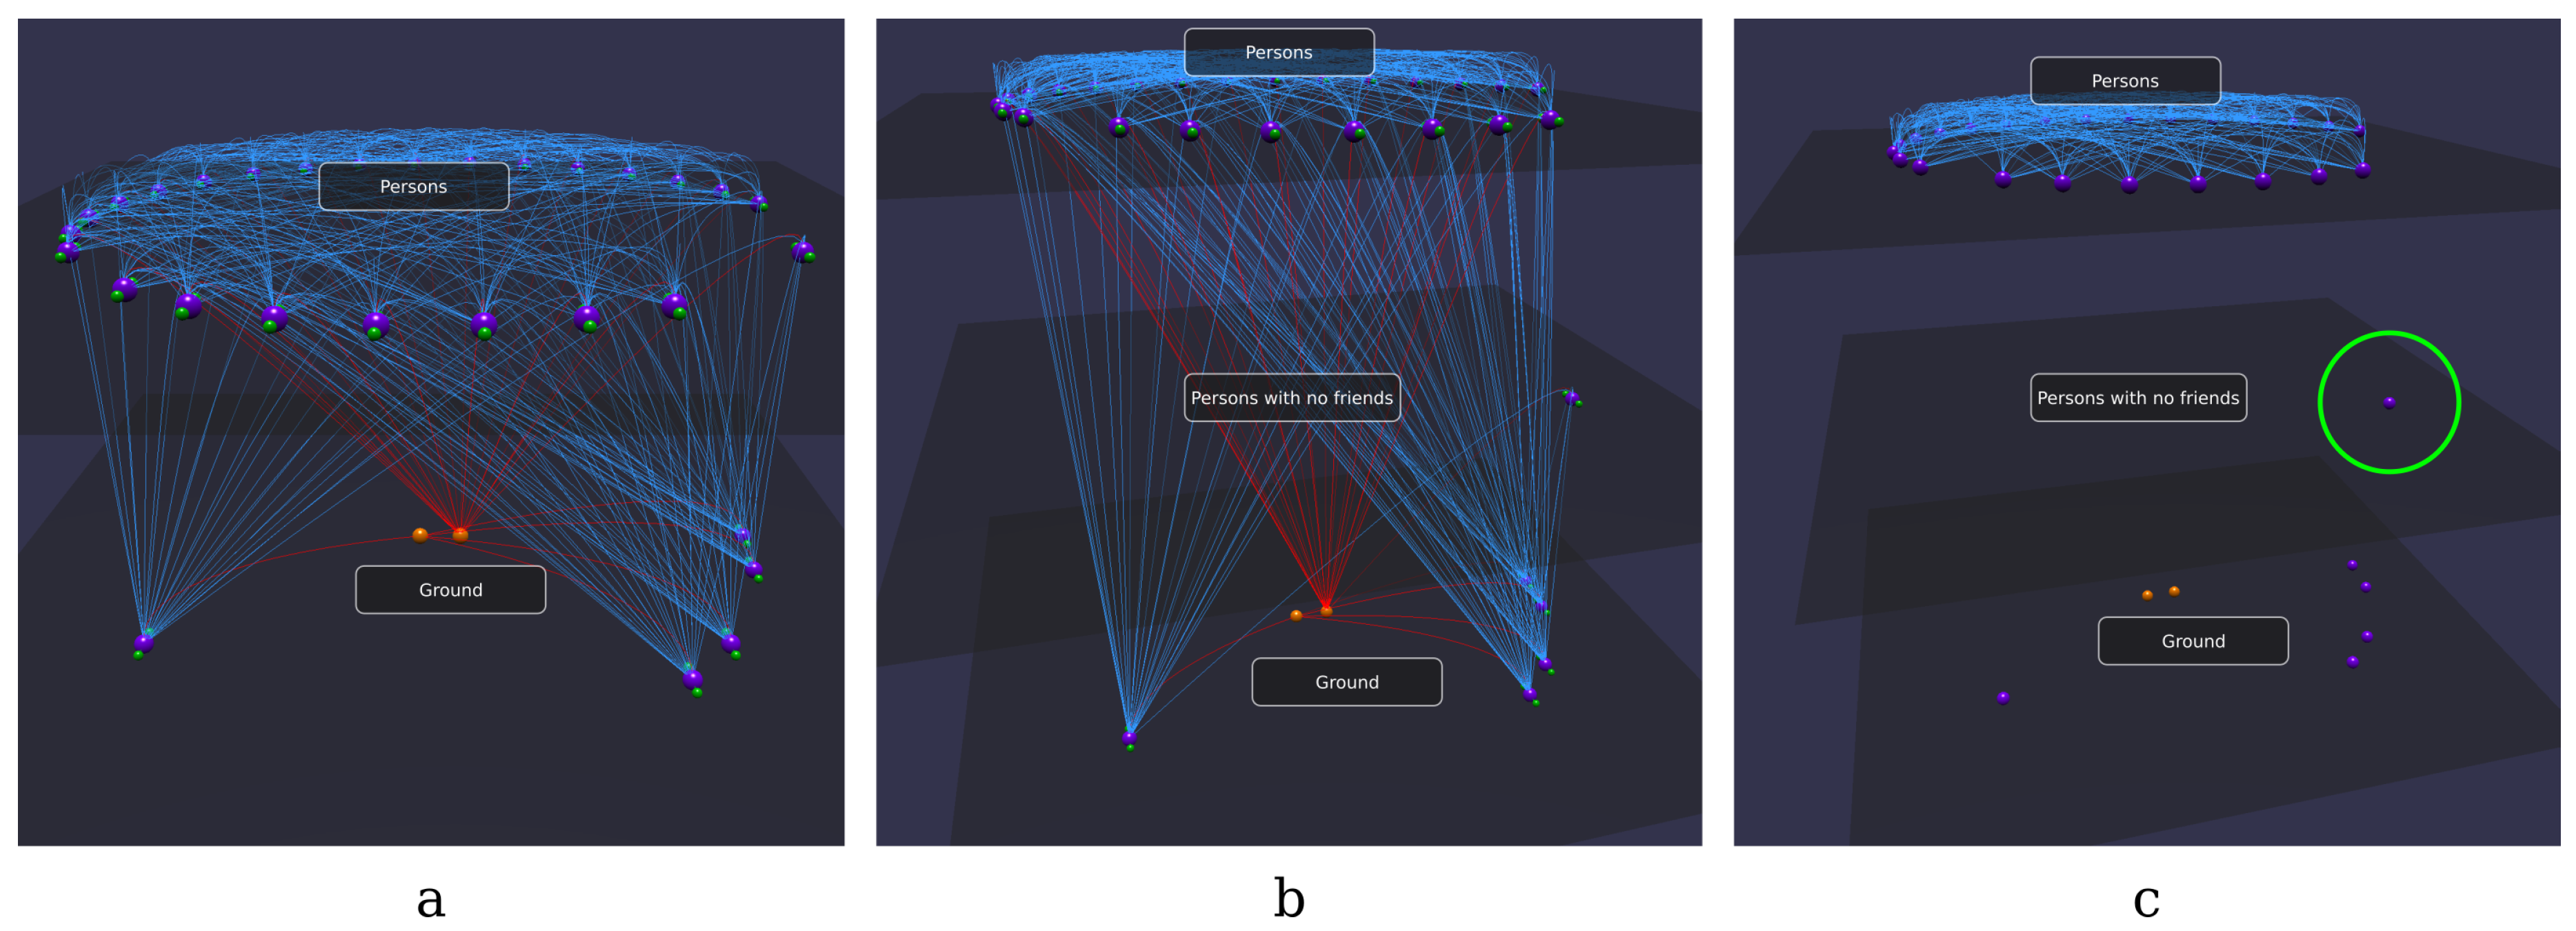
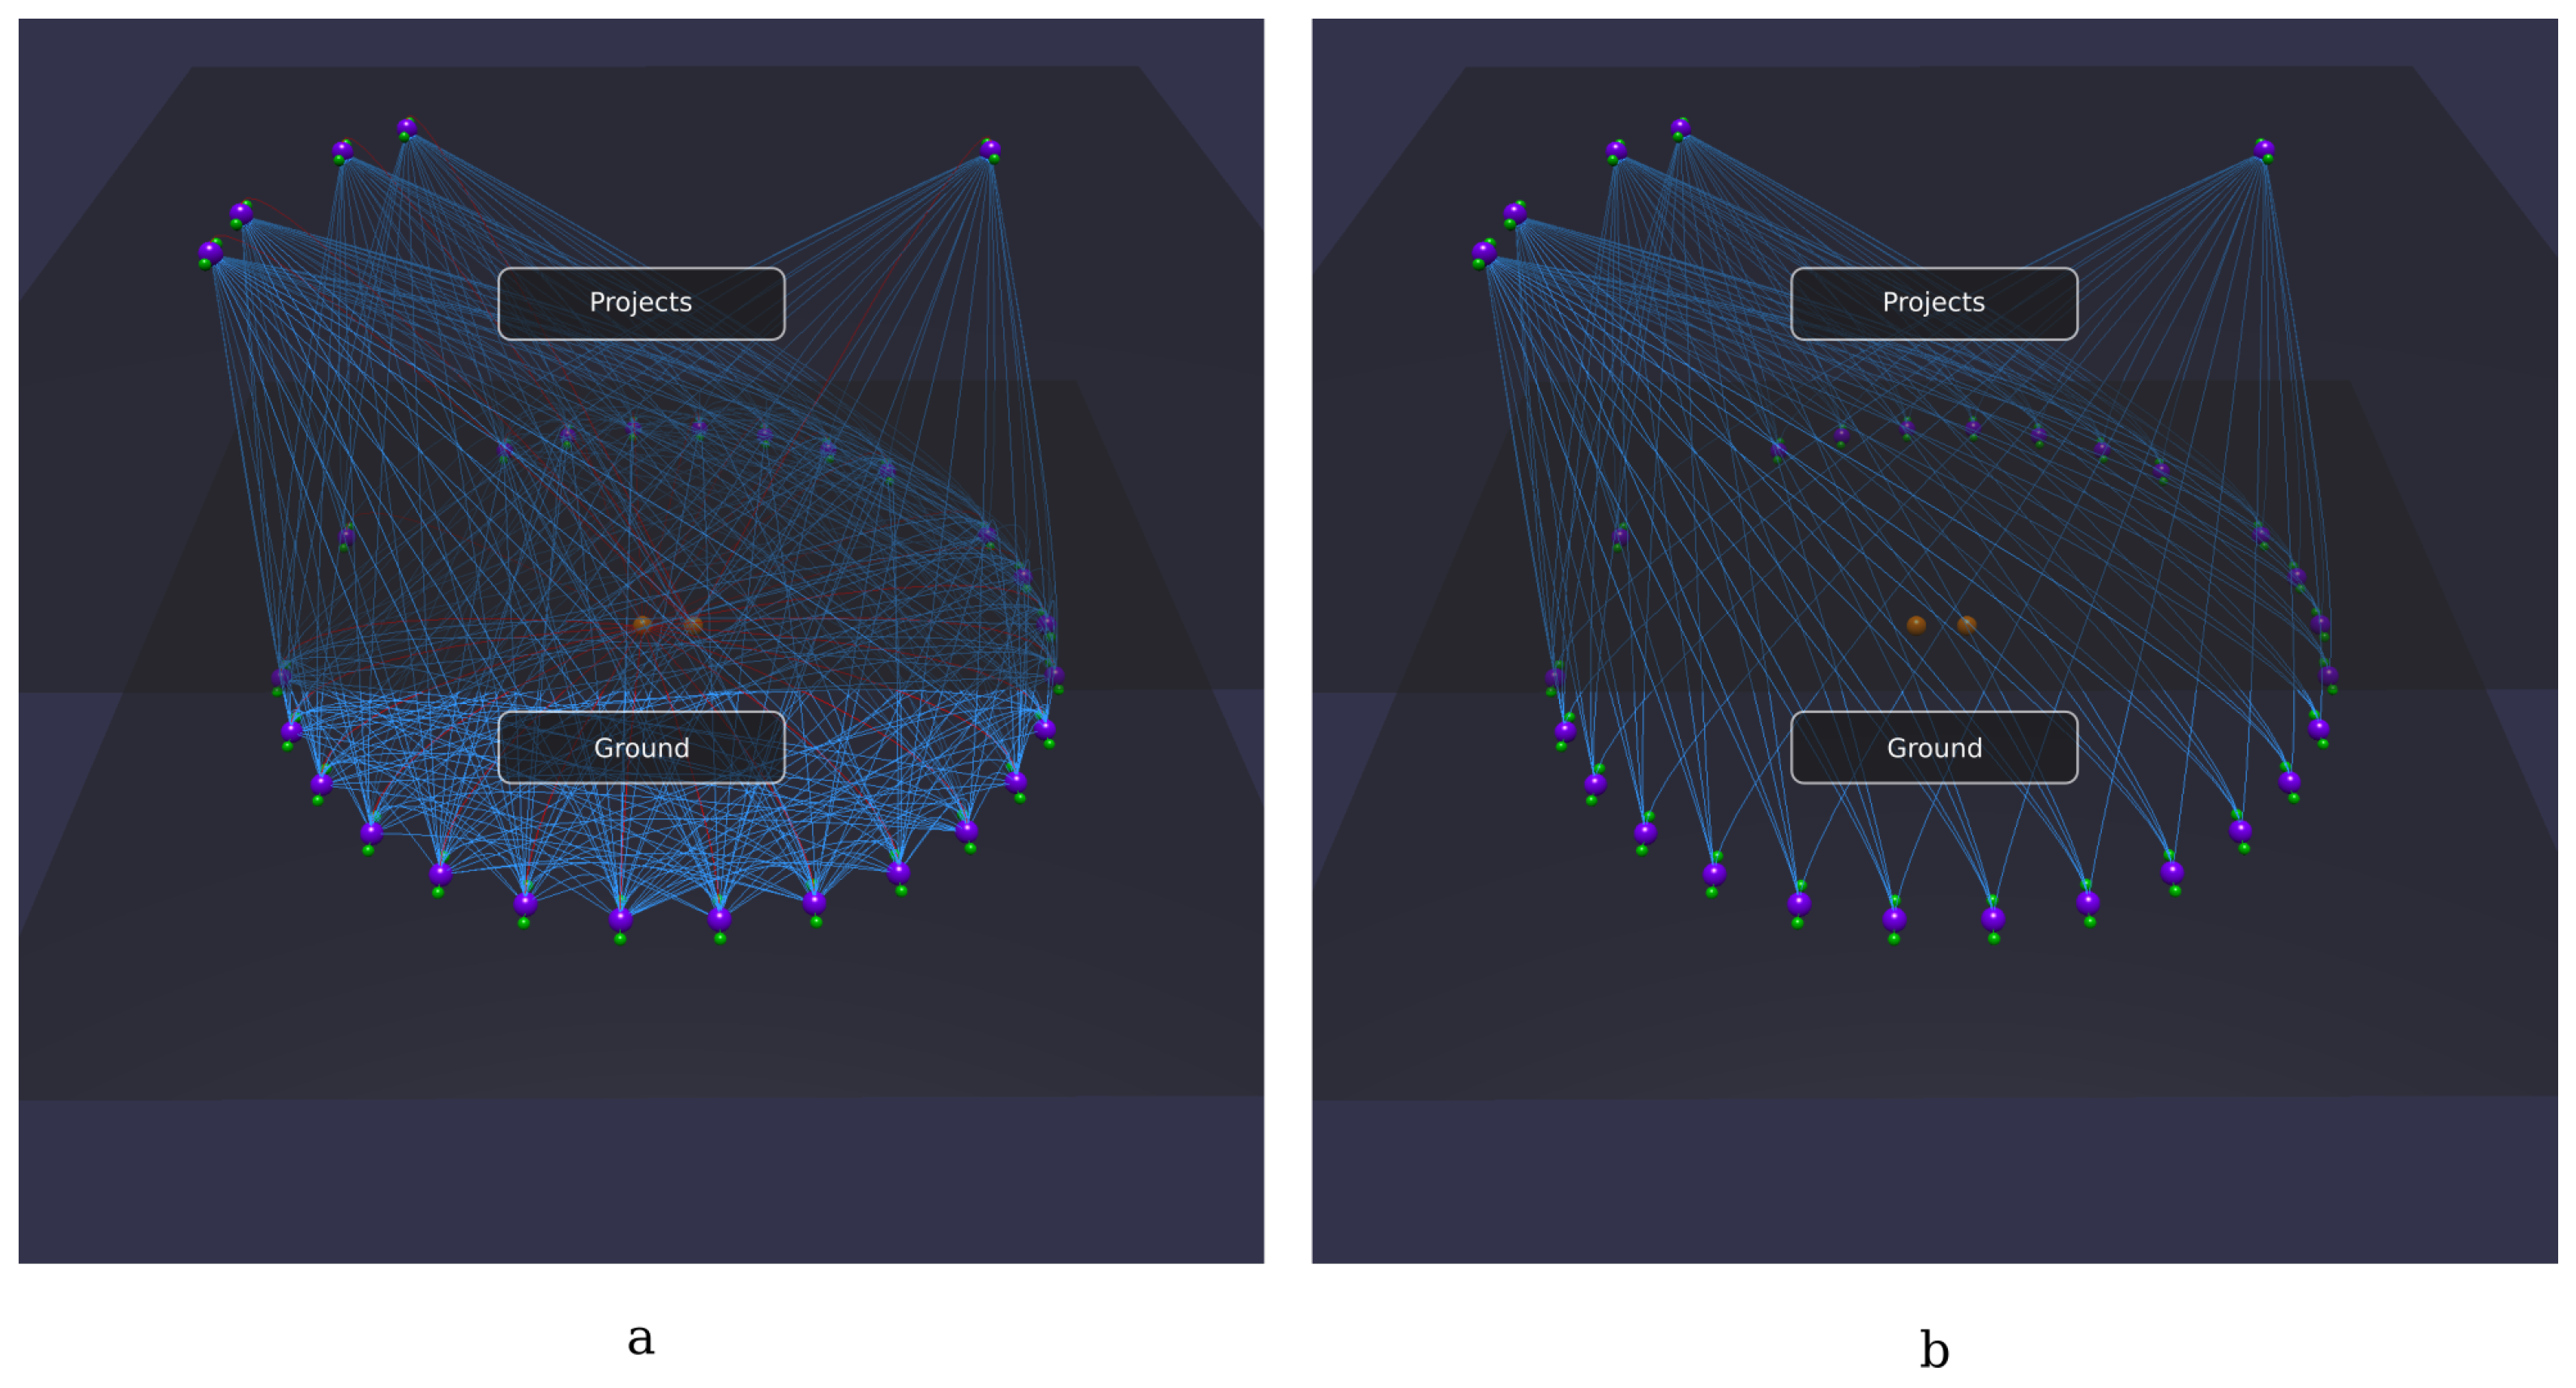
- Is there a person without friends?
- Is there any un-assigned project?
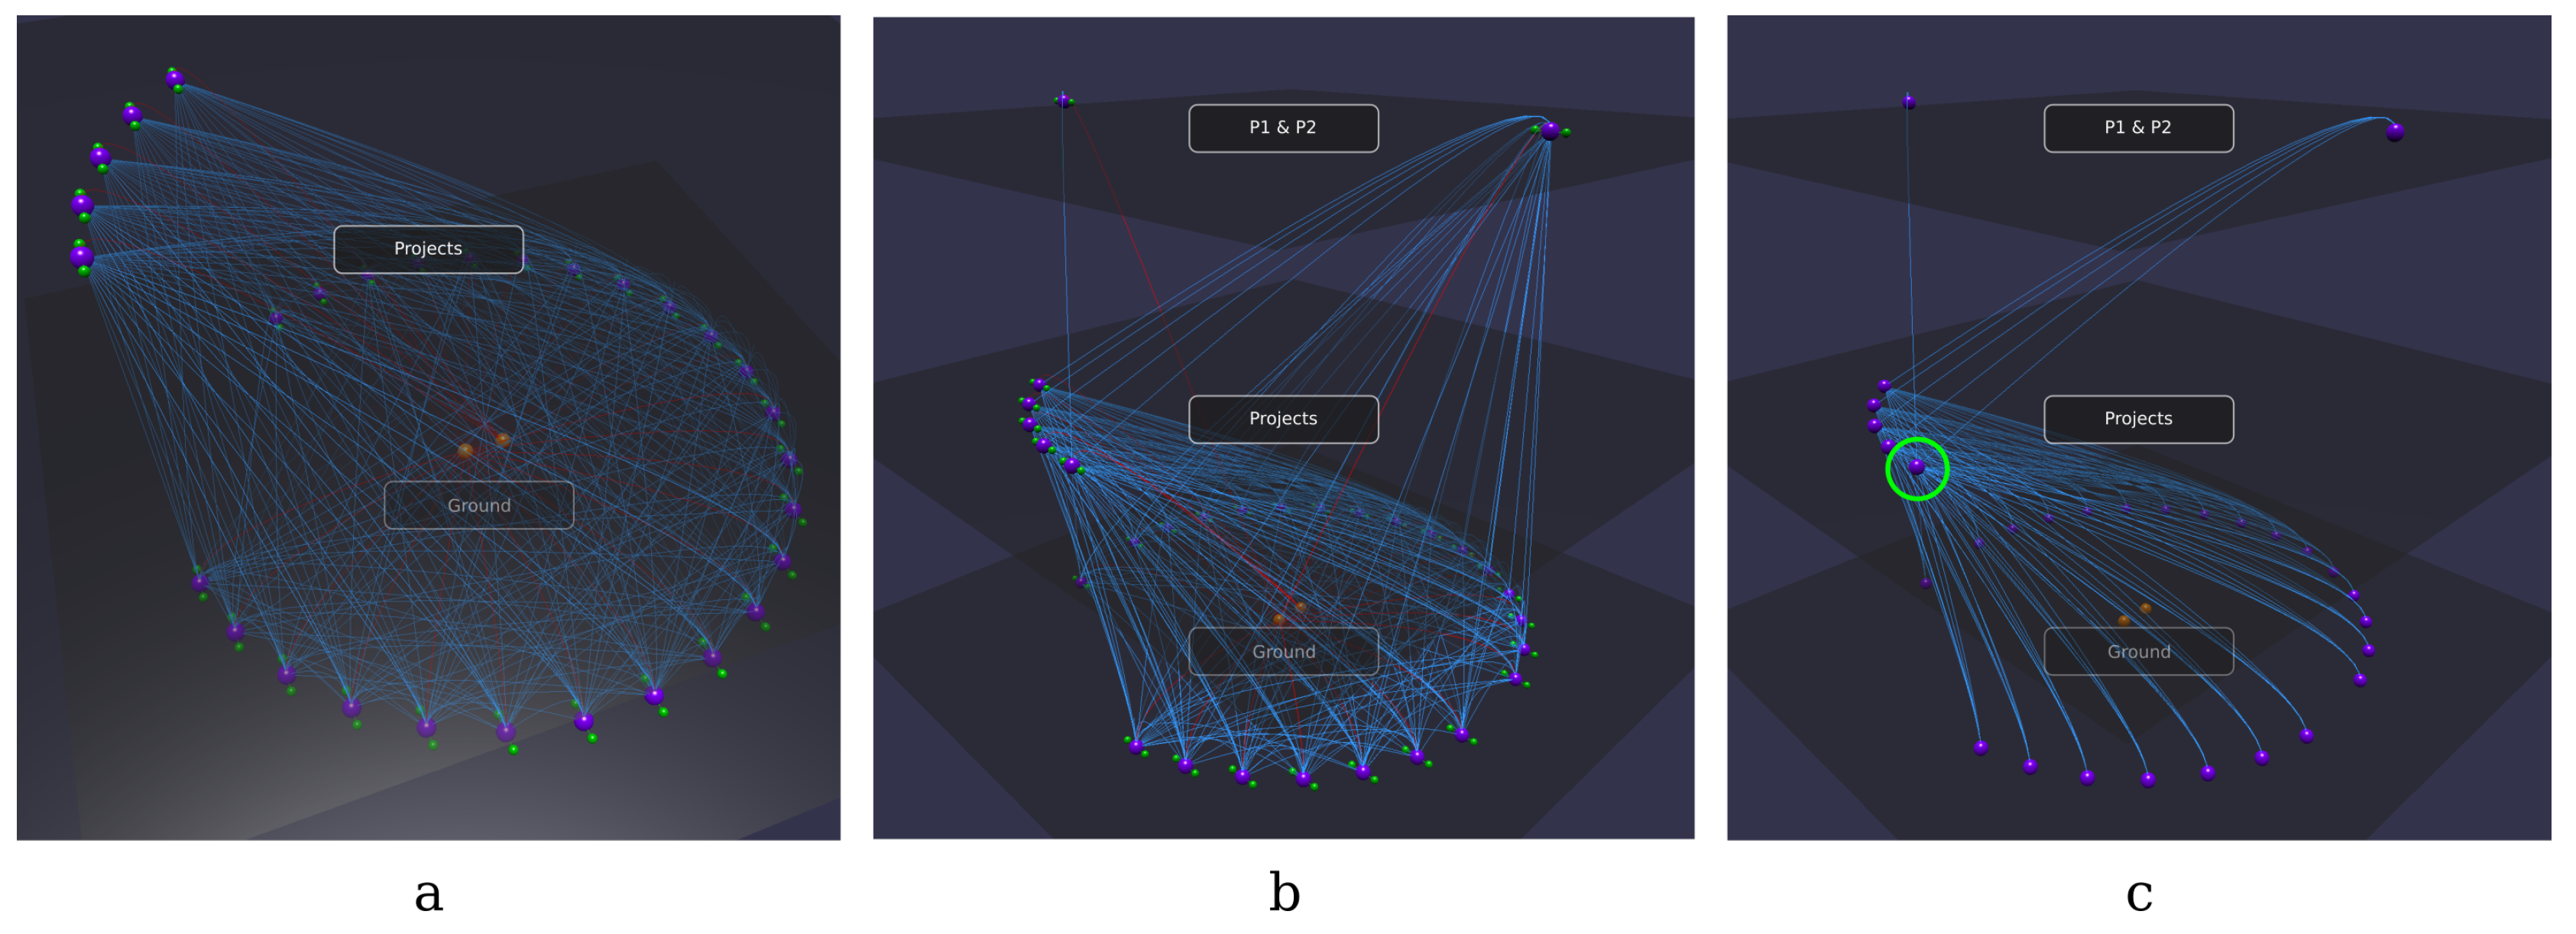
- Do Person1 and Person2 share any projects?
PREFIX rdf: <http://www.w3.org/1999/02/22-rdf-syntax-ns#>
PREFIX foaf: <http://xmlns.com/foaf/0.1/>
SELECT ?p1
WHERE {
?p1 rdf:type foaf:Person .
?p2 rdf:type foaf:Person .
FILTER NOT EXISTS { ?p1 foaf:knows ?p2 } .
FILTER NOT EXISTS { ?p2 foaf:knows ?p1 } .
FILTER(?p1 != ?p2)
}
- (a)
- Create a first semantic plane containing all the instances of the class foaf:Person. This causes the instances and their datatype properties to be moved above the rest of the knowledge base.
- (b)
- Create a second semantic plane containing all the instances of the class foaf:Person that are involved in a friendship relationship (i.e., being either the subject or the object of a foaf:knows triple). In this way, all persons without friends, if any, remain on the previously created plane. This can be done by selecting the object property foaf:knows and clicking on Raise (S and O).
- (c)
- Finally, just to have a better view, it is possible to hide unwanted information (e.g., all the datatype properties and all the object properties except foaf:knows).
PREFIX rdf: <http://www.w3.org/1999/02/22-rdf-syntax-ns#>
PREFIX foaf: <http://xmlns.com/foaf/0.1/>
SELECT ?p
WHERE {
?p rdf:type foaf:Project .
?person rdf:type foaf:Person .
FILTER NOT EXISTS { ?person foaf:currentProject ?p }
}
- (a)
- Creating a semantic plane containing all the projects (i.e., selecting the class foaf:Project and clicking on Raise instances); and
- (b)
- Hiding all the data properties and all the arcs related to foaf:knows and rdf:type.
PREFIX rdf: <http://www.w3.org/1999/02/22-rdf-syntax-ns#>
PREFIX foaf: <http://xmlns.com/foaf/0.1/>
ASK {
foaf:Person1 foaf:currentProject ?p .
foaf:Person2 foaf:currentProject ?p
}
3.2. Use Case #2: Exploring DBpedia
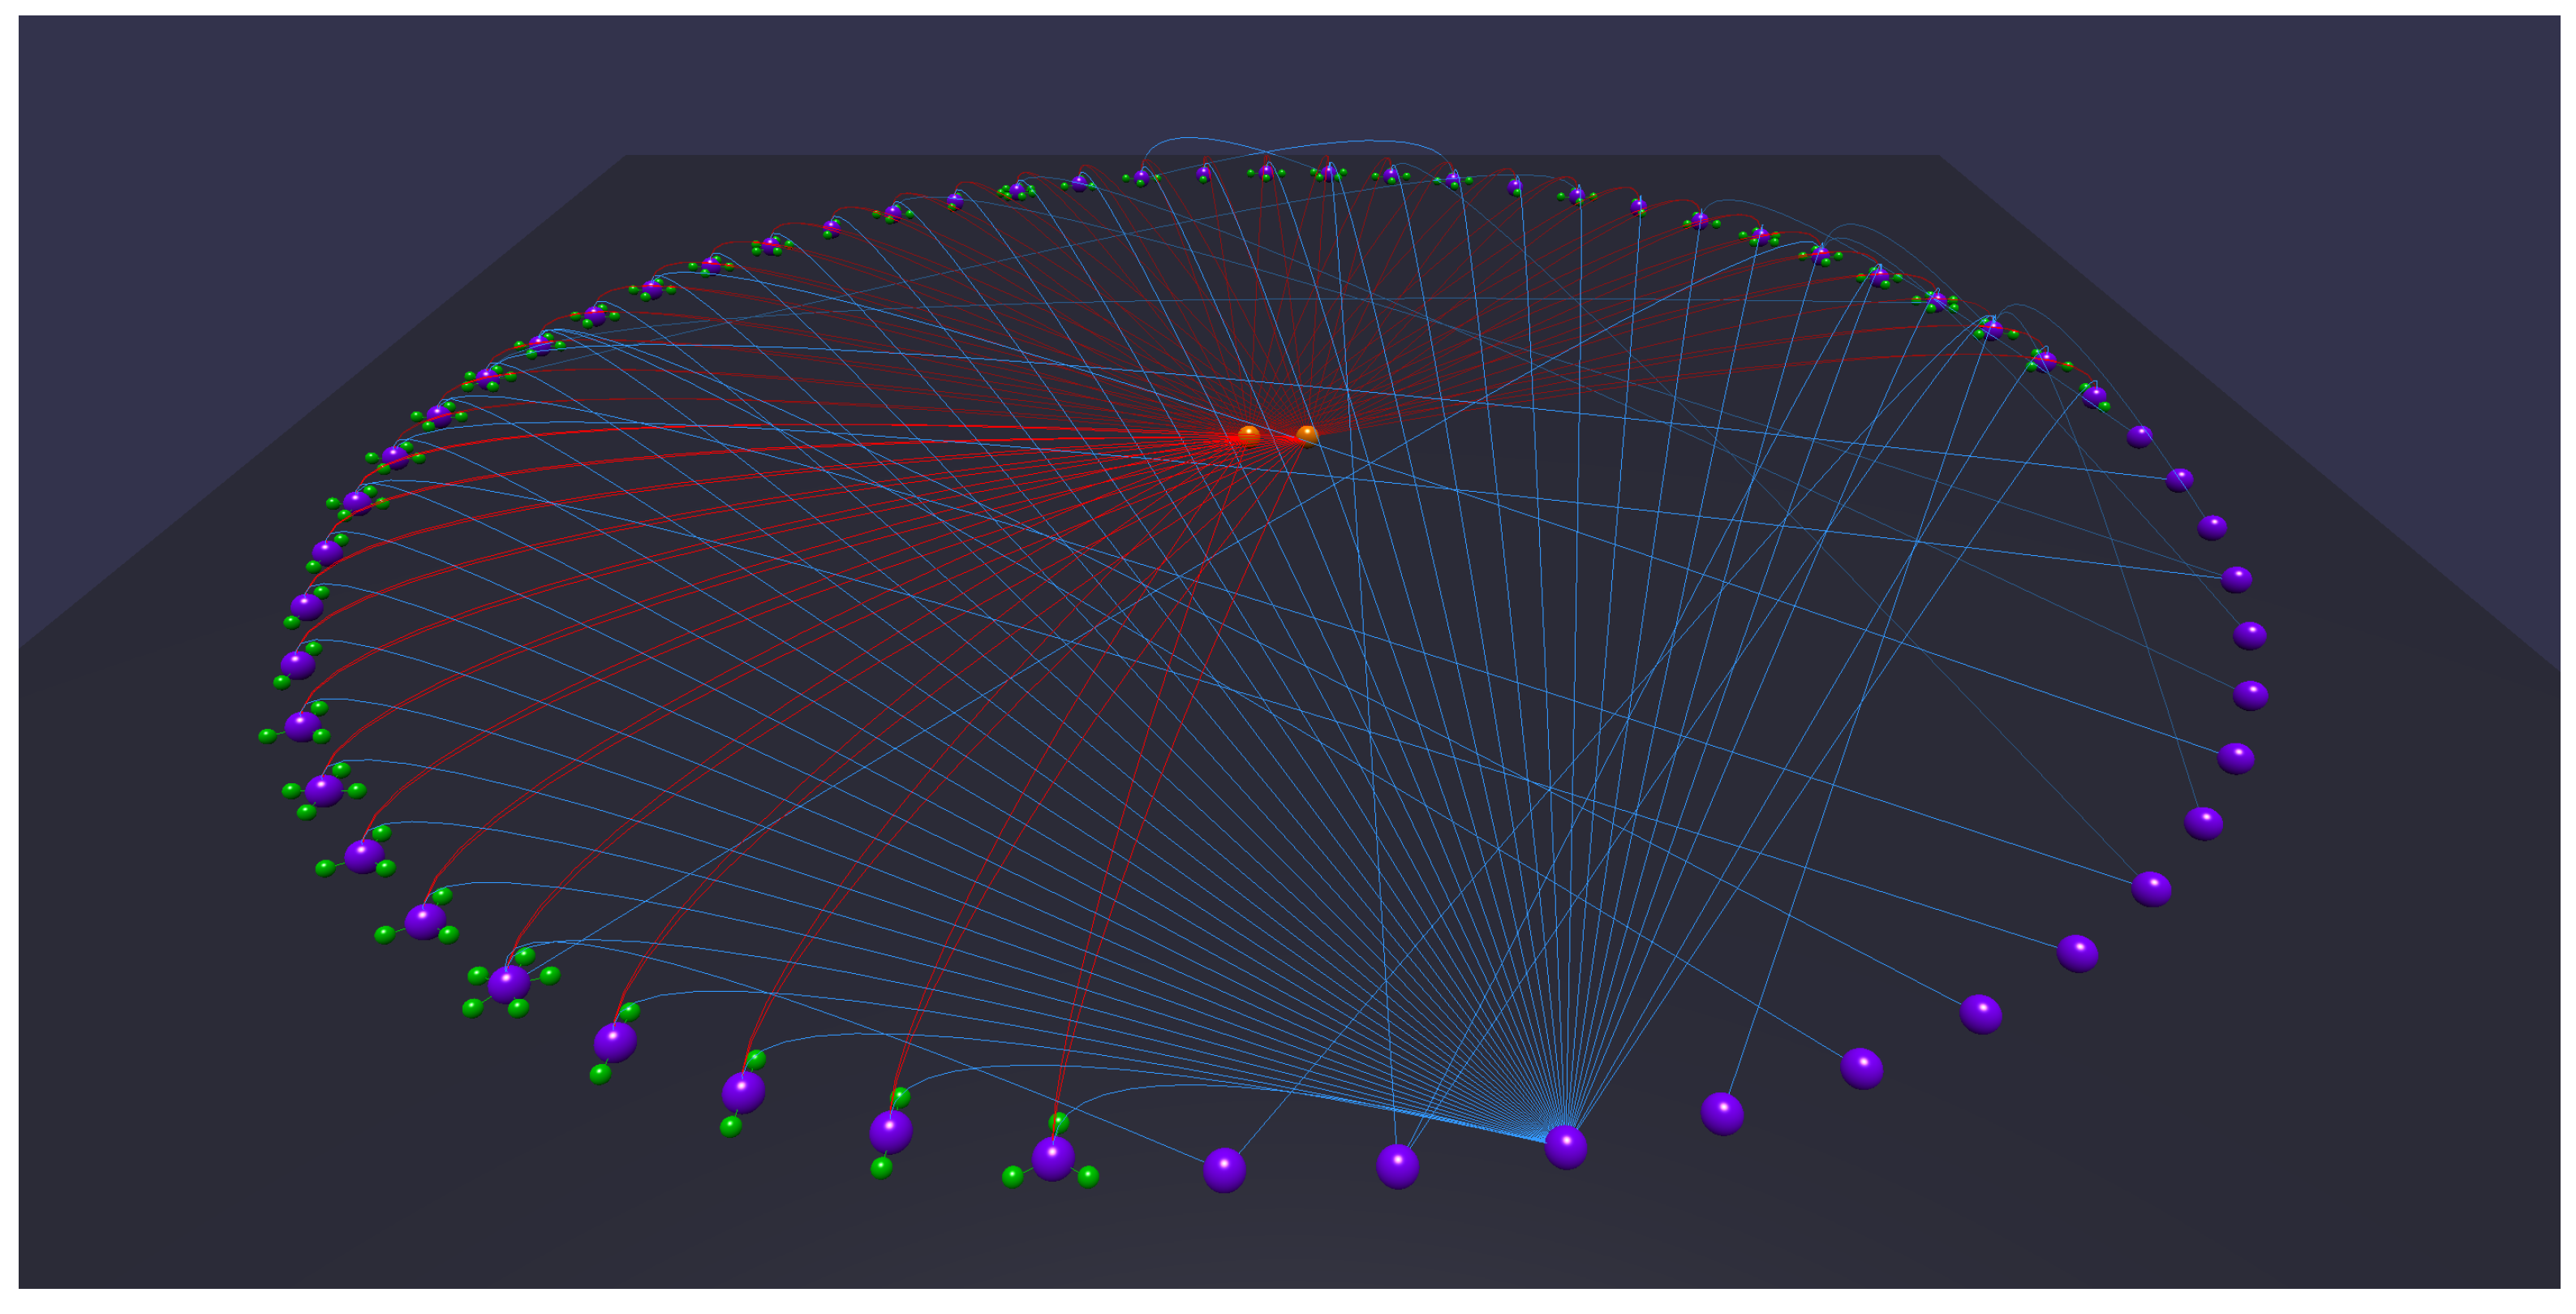
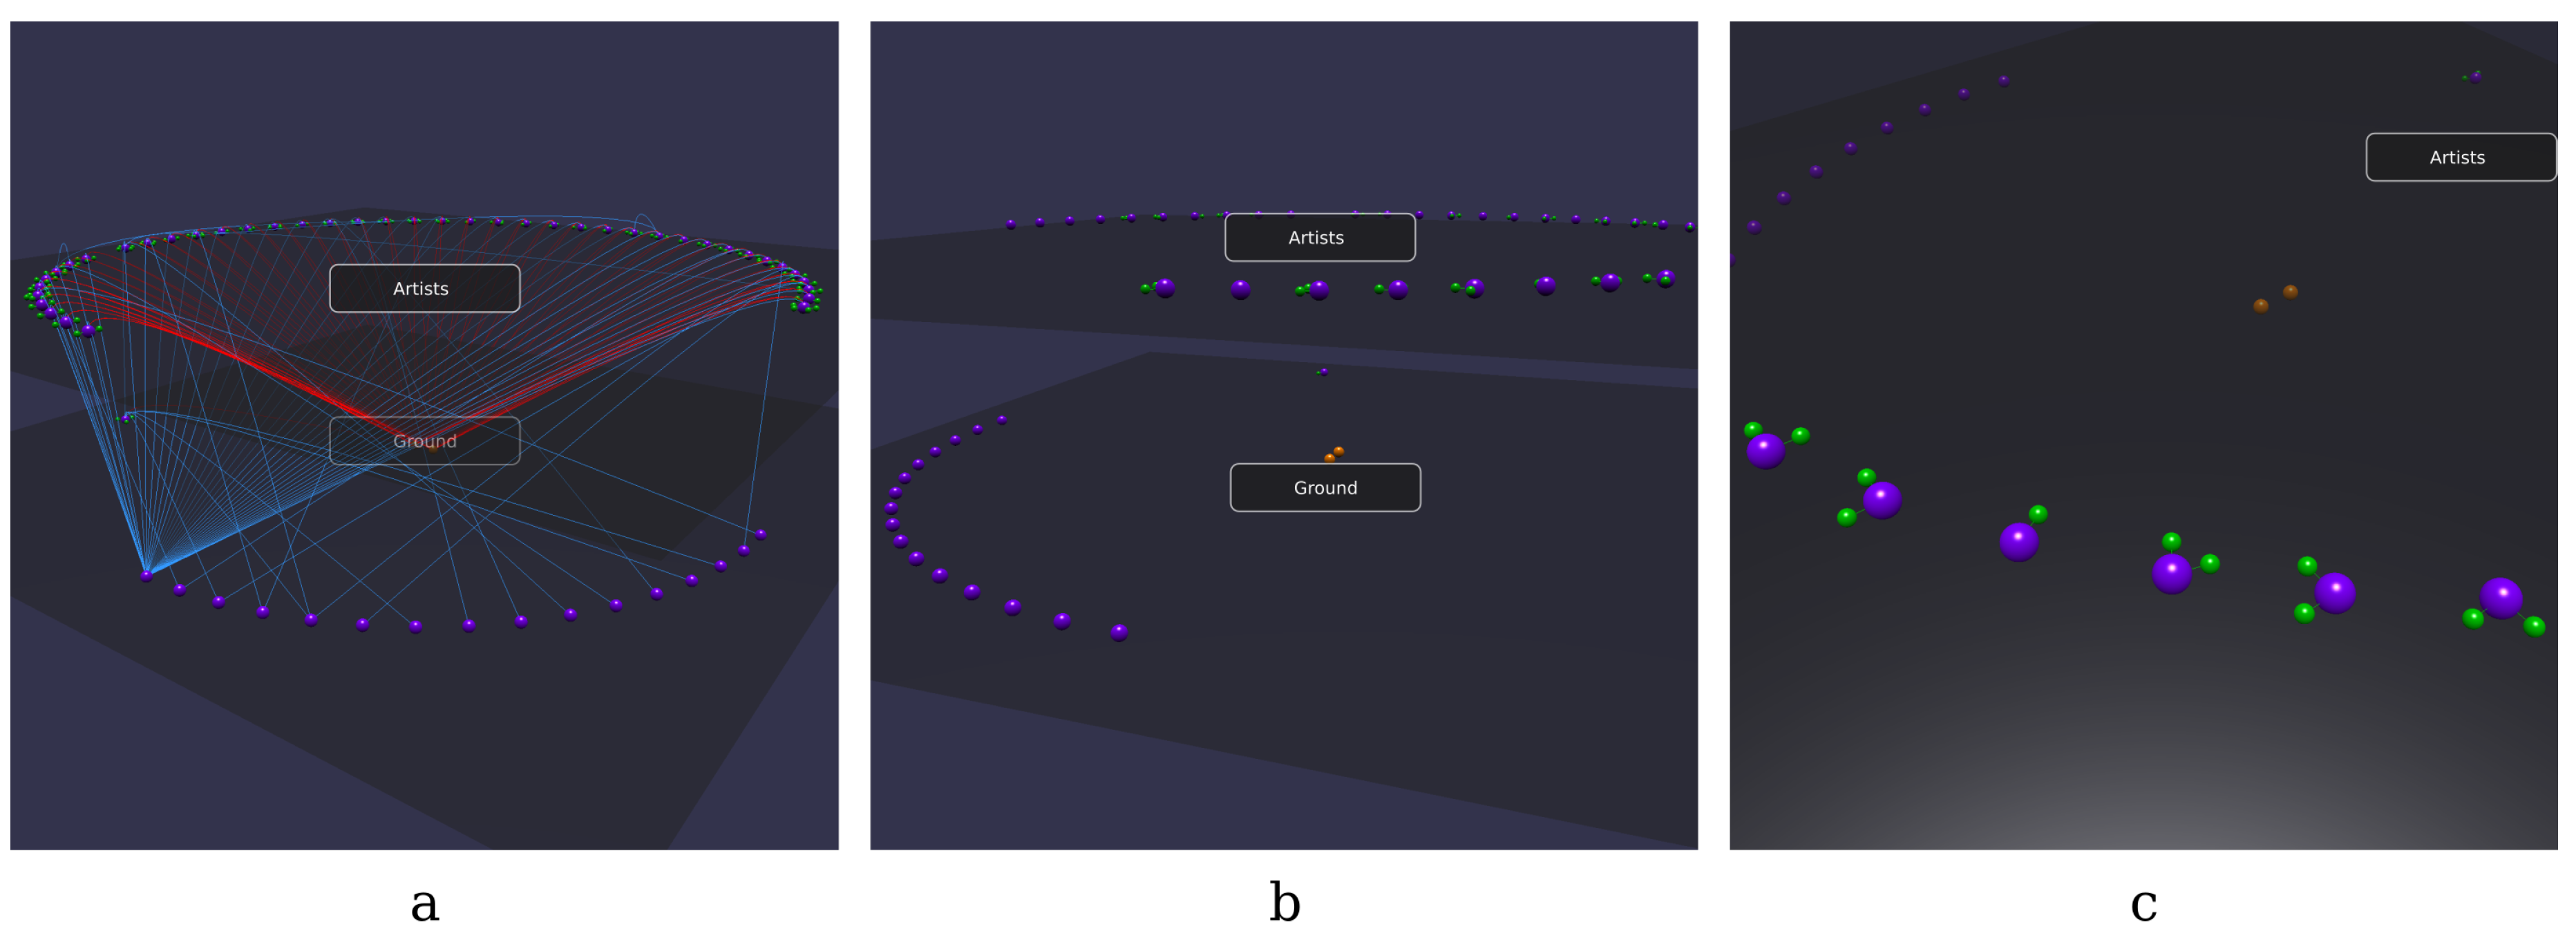
All the artists born in Bologna between 1000 AD and 2000 AD and people who inspired them.
PREFIX : <http://dbpedia.org/resource/>
PREFIX xsd: <http://www.w3.org/2001/XMLSchema#>
PREFIX rdf: <http://www.w3.org/1999/02/22-rdf-syntax-ns#>
PREFIX foaf: <http://xmlns.com/foaf/0.1/>
PREFIX dbo: <http://dbpedia.org/ontology/>
SELECT ?artist ?artBirthD ?artDeathD ?artBirthP ?artName ?ins ?insName ?insBirthD
?insDeathD ?insBirthP ?insDeathP
WHERE {
?artist rdf:type dbo:Artist ;
rdf:type foaf:Person ;
foaf:name ?artName ;
dbo:birthDate ?artBirthD ;
dbo:birthPlace :Bologna .
OPTIONAL {
?artist dbo:deathDate ?artDeathD } .
OPTIONAL {
?artist dbo:deathPlace ?artDeathP } .
OPTIONAL {
?artist dbo:influencedBy ?ins .
?ins rdf:type foaf:Person ;
dbo:birthPlace ?insBirthP ;
dbo:birthDate ?insBirthD .
OPTIONAL {
?ins dbo:deathPlace ?insDeathP ;
dbo:deathDate ?insDeathD }} .
FILTER (?artBirthD > "1000-01-01"^^xsd:date).
FILTER (?artBirthD < "2000-01-01"^^xsd:date)
}
PREFIX : <http://dbpedia.org/resource/>
PREFIX xsd: <http://www.w3.org/2001/XMLSchema#>
PREFIX rdf: <http://www.w3.org/1999/02/22-rdf-syntax-ns#>
PREFIX foaf: <http://xmlns.com/foaf/0.1/>
PREFIX dbo: <http://dbpedia.org/ontology/>
CONSTRUCT {
?artist rdf:type dbo:Artist ;
rdf:type foaf:Person ;
foaf:name ?artName ;
dbo:birthDate ?artBirthD ;
dbo:birthPlace :Bologna ;
dbo:deathDate ?artDeathD ;
dbo:deathPlace ?artDeathP ;
dbo:influencedBy ?ins .
?artDeathP rdf:type dbo:Place .
:Bologna rdf:type dbo:Place .
?ins rdf:type foaf:Person ;
dbo:birthPlace ?insBirthP ;
dbo:birthDate ?insBirthD ;
dbo:deathPlace ?insDeathP ;
dbo:deathDate ?insDeathD .
?insDeathP rdf:type dbo:Place .
?insBirthP rdf:type dbo:Place .
}
WHERE {
?artist rdf:type dbo:Artist ;
rdf:type foaf:Person ;
foaf:name ?artName ;
dbo:birthDate ?artBirthD ;
dbo:birthPlace :Bologna .
OPTIONAL {
?artist dbo:deathDate ?artDeathD } .
OPTIONAL {
?artist dbo:deathPlace ?artDeathP } .
OPTIONAL {
?artist dbo:influencedBy ?ins .
?ins rdf:type foaf:Person ;
dbo:birthPlace ?insBirthP ;
dbo:birthDate ?insBirthD .
OPTIONAL {
?ins dbo:deathPlace ?insDeathP ;
dbo:deathDate ?insDeathD }} .
FILTER (?artBirthD > "1000-01-01"^^xsd:date).
FILTER (?artBirthD < "2000-01-01"^^xsd:date)
}
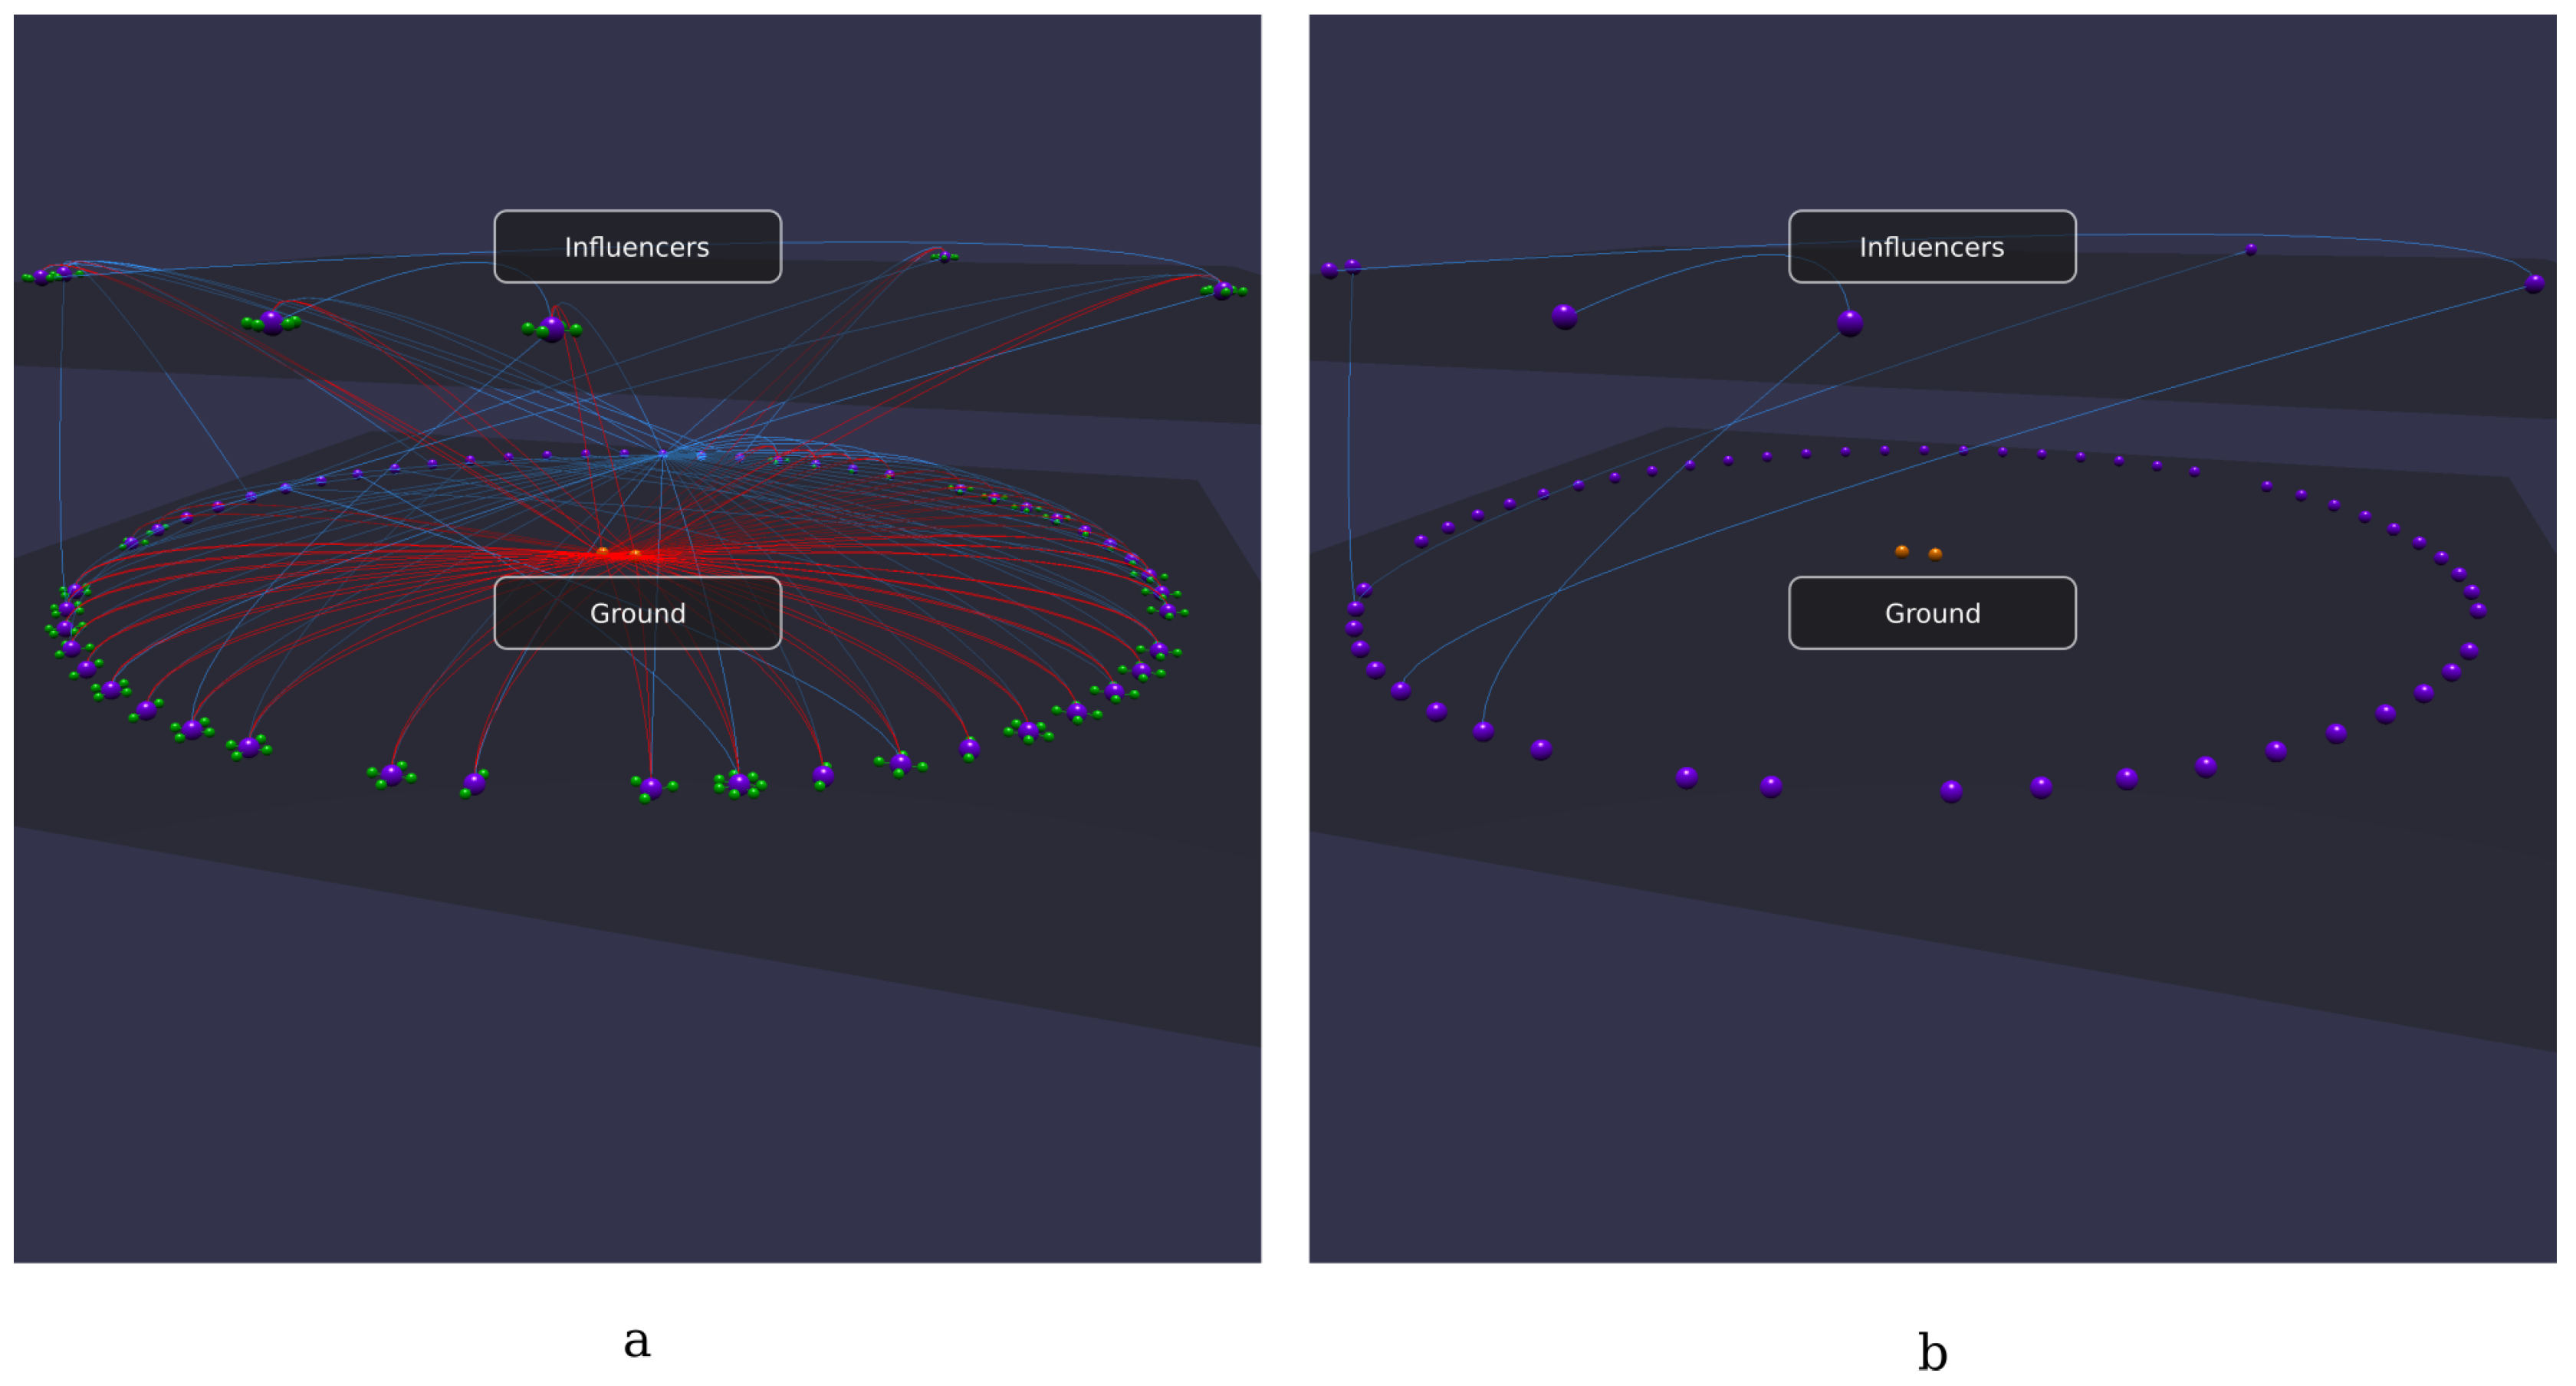
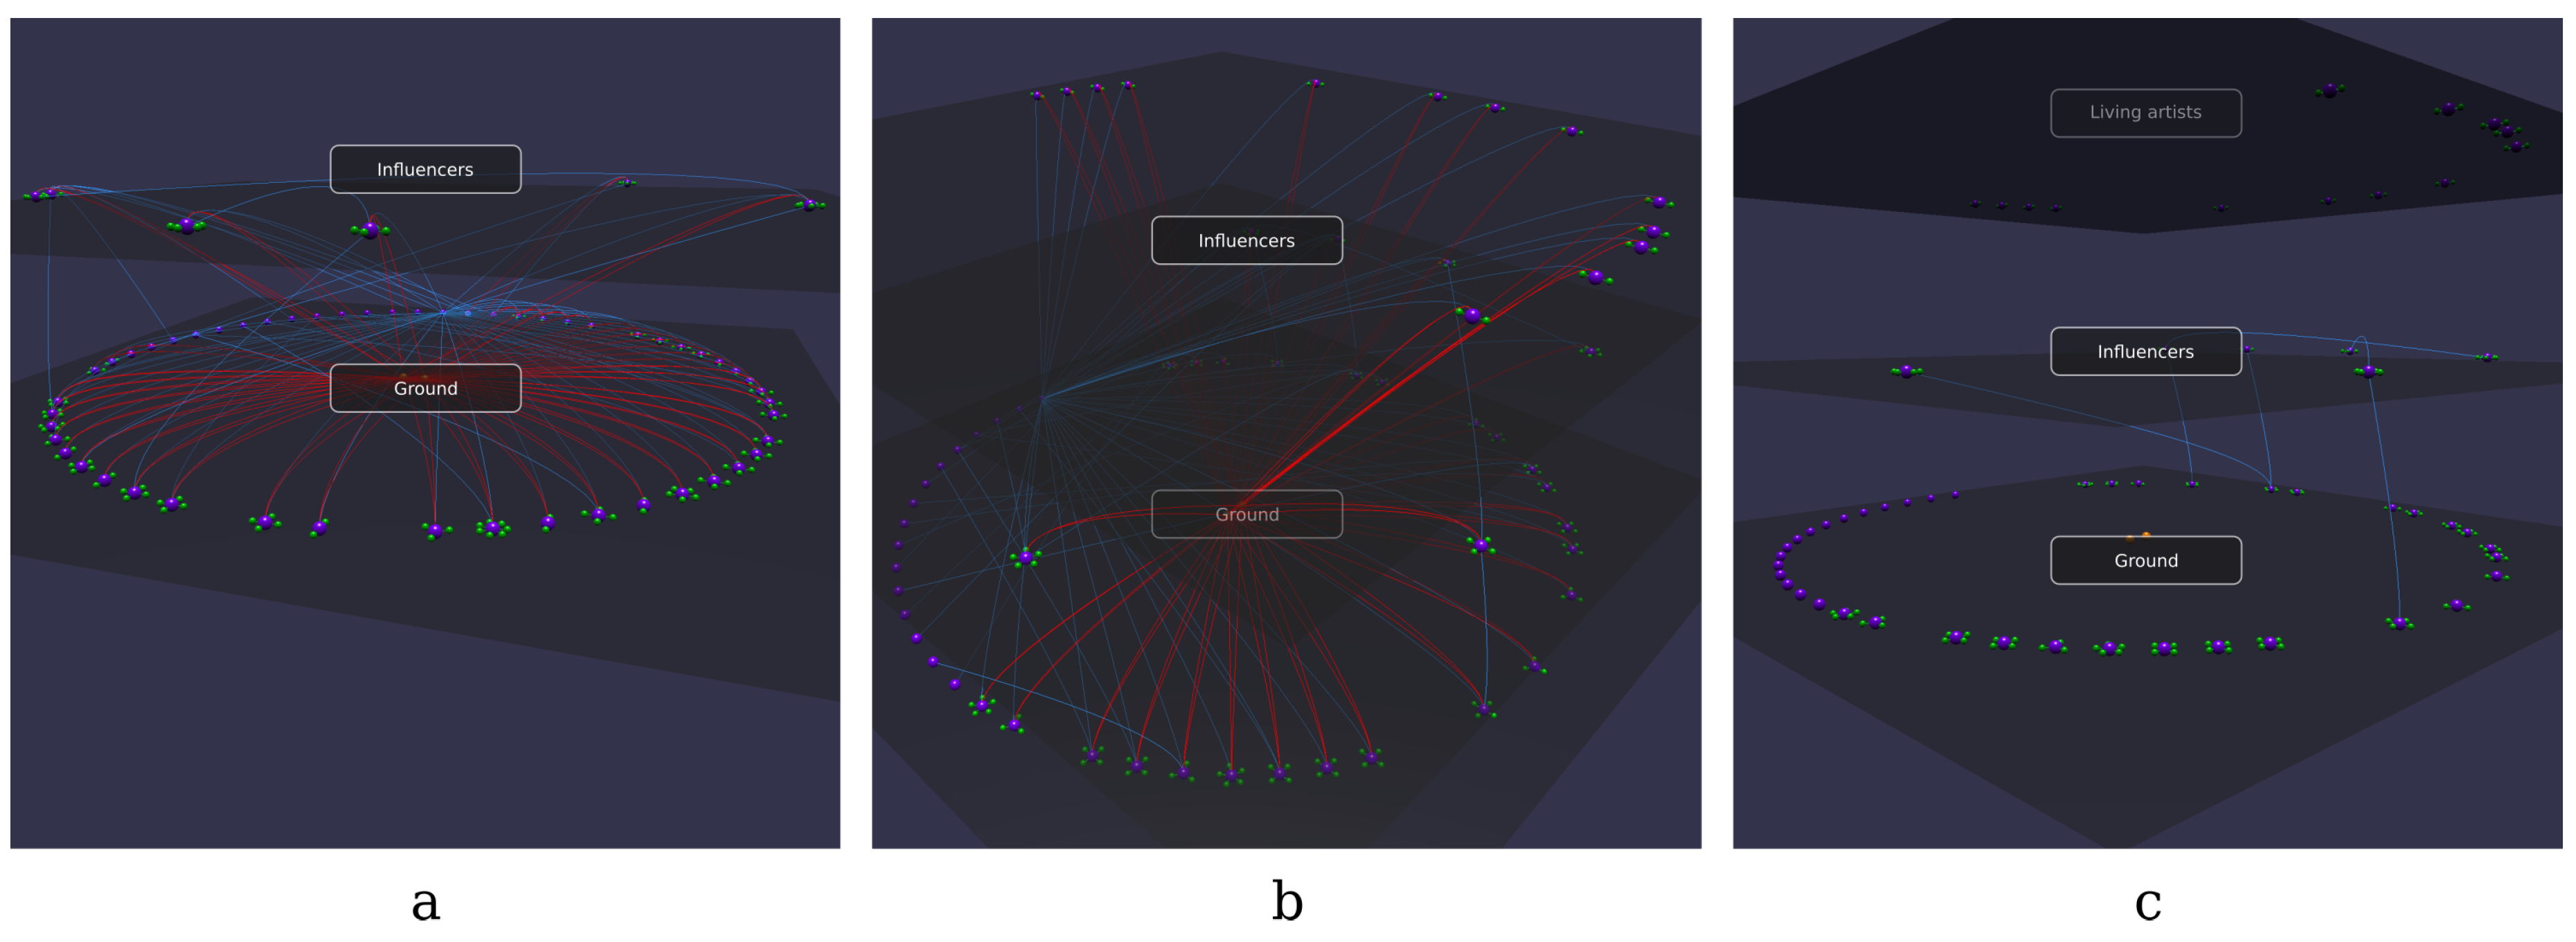
- Are there any relations among influencers?
- Are there any connections between living artists and influencers?
- Are there any living artists?
PREFIX rdf: <http://www.w3.org/1999/02/22-rdf-syntax-ns#>
PREFIX dbo: <http://dbpedia.org/ontology/>
SELECT ?art
WHERE {
?art rdf:type dbo:Artist .
FILTER NOT EXISTS { ?art dbo:deathPlace ?dp }.
FILTER NOT EXISTS { ?art dbo:deathDate ?dd }
}
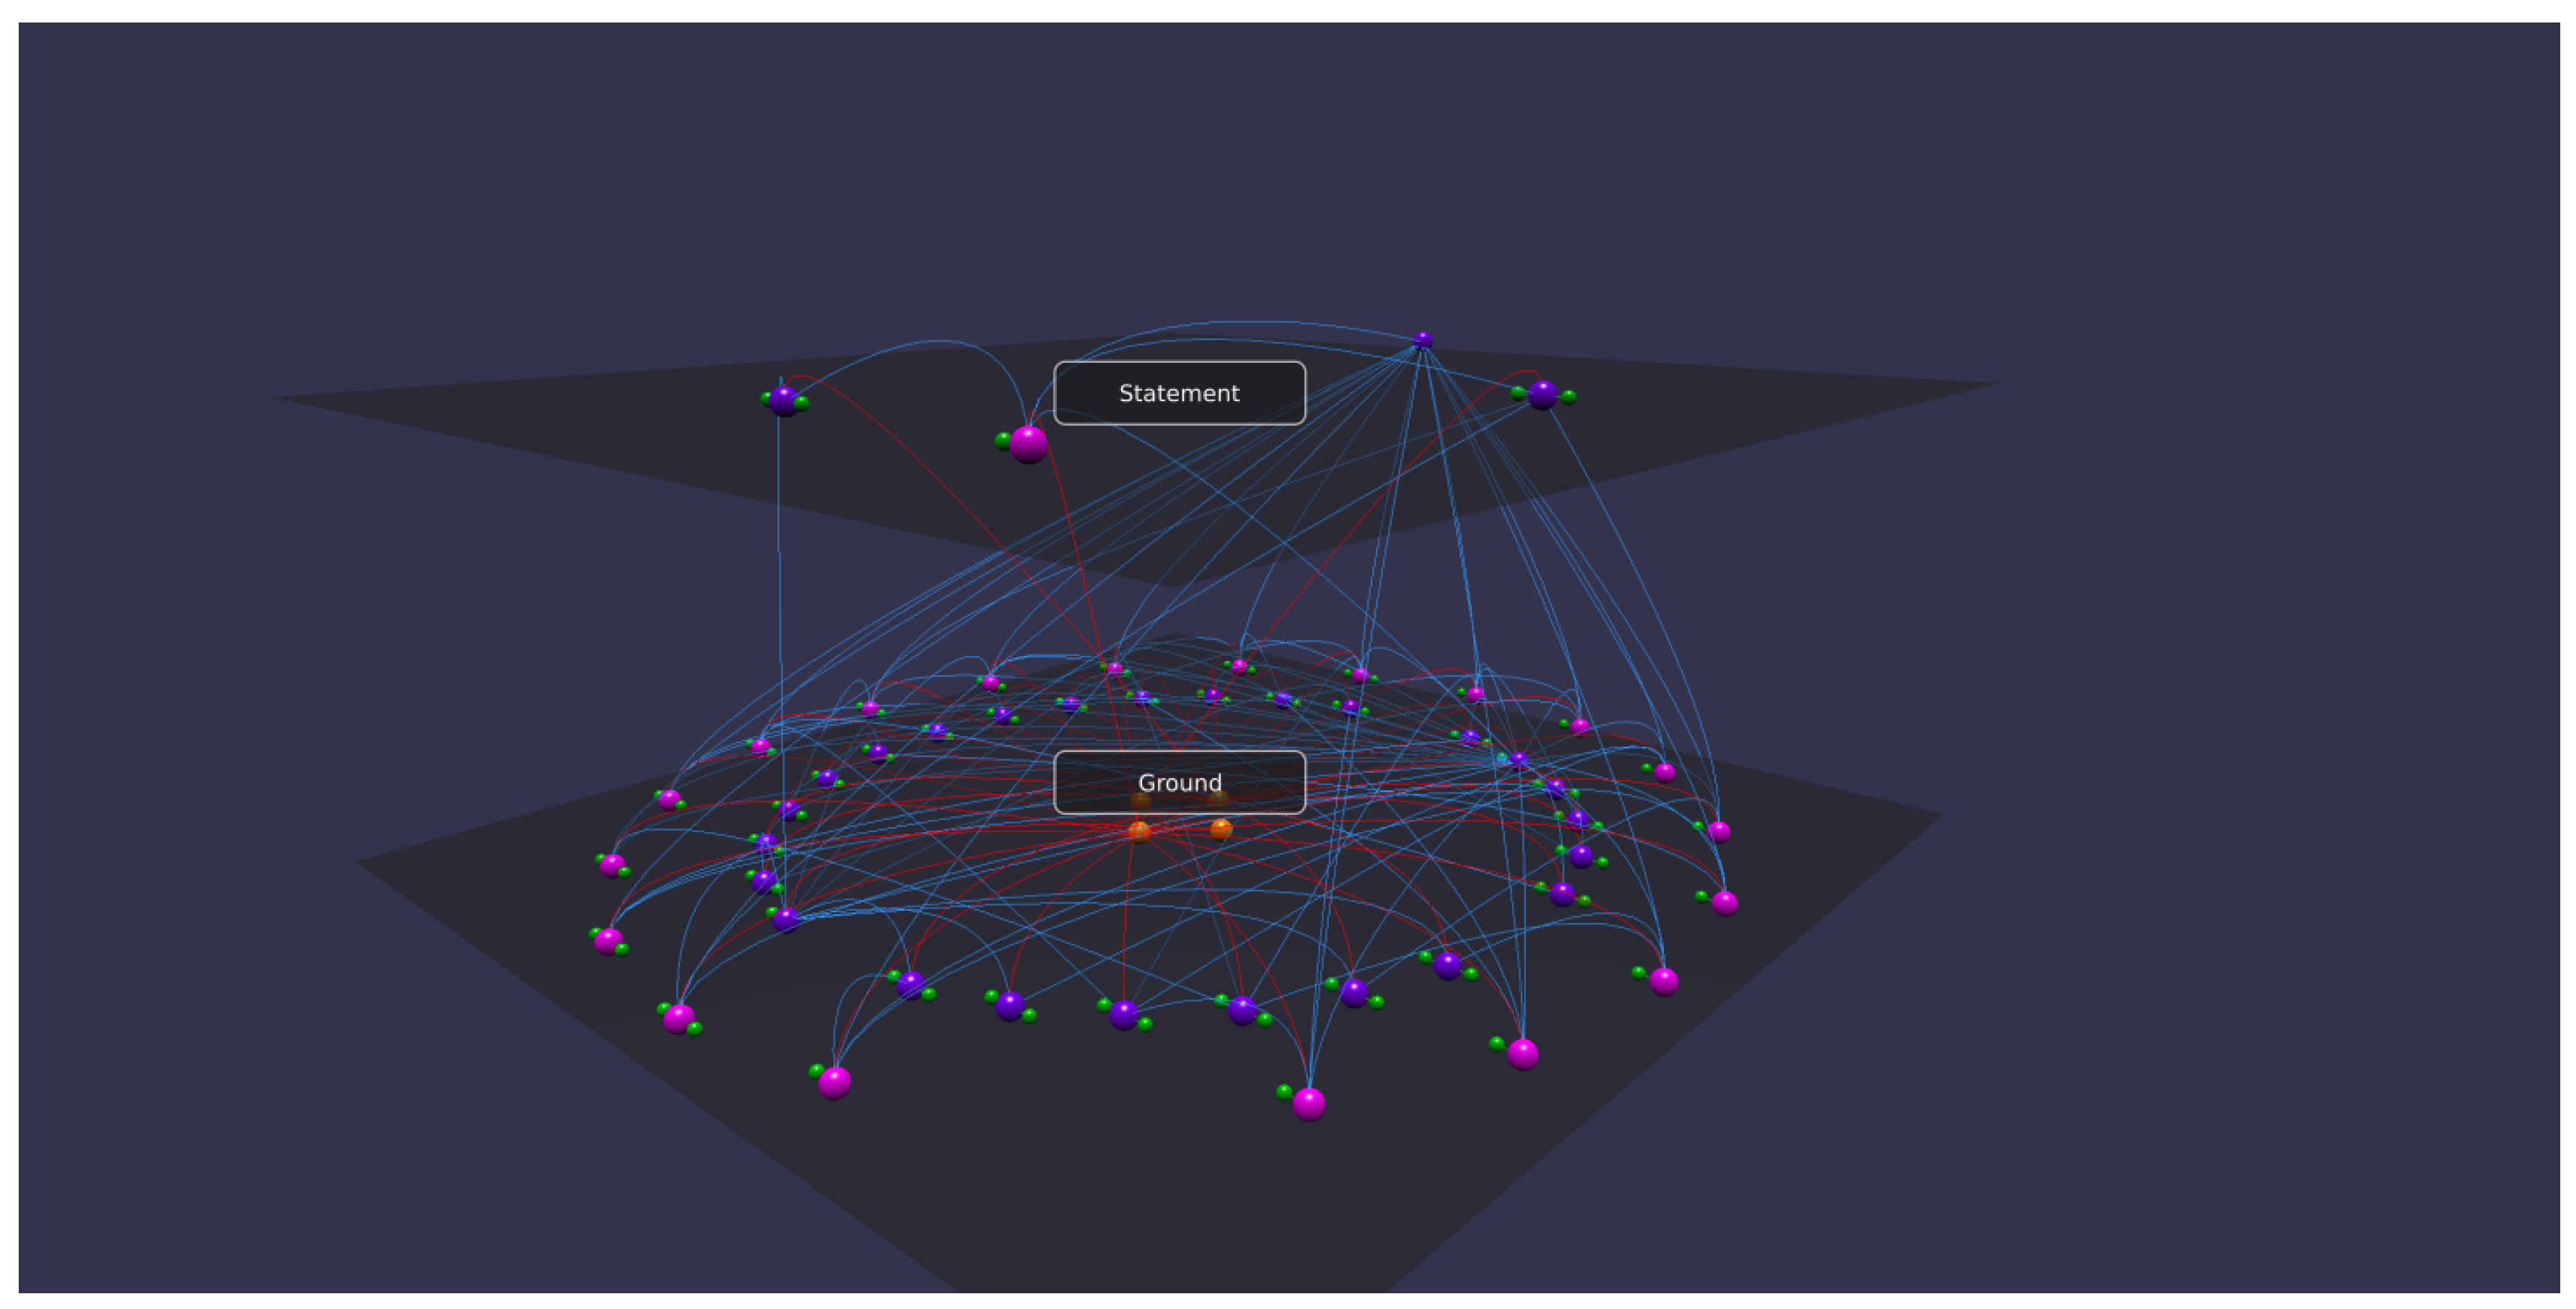
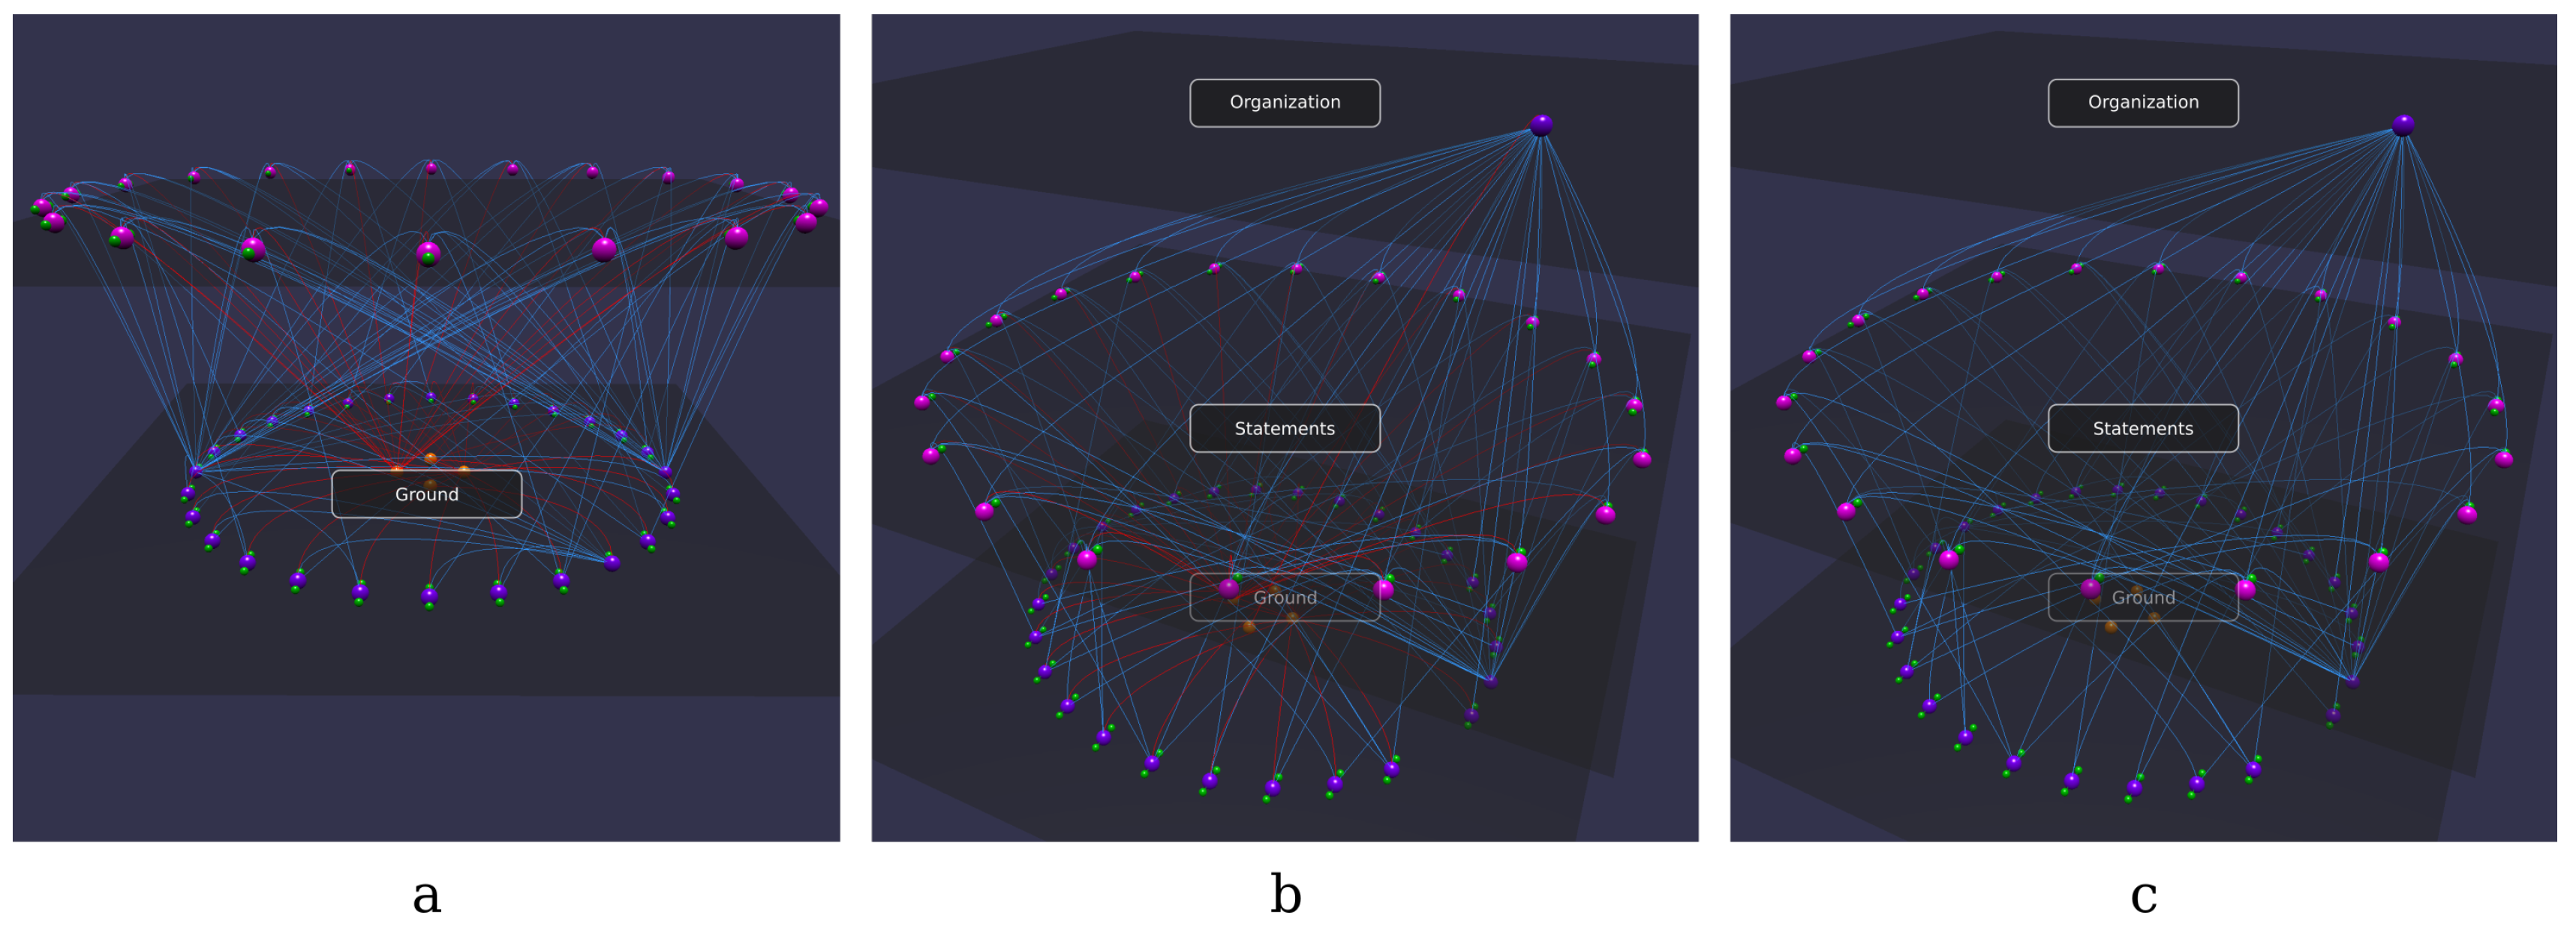
3.3. Reificated KBs
foaf:Person1 foaf:currentProject foaf:ProjA
ns:St1 rdf:type rdf:Statement
ns:St1 rdf:subject foaf:Person1
ns:St1 rdf:predicate foaf:currentProject
ns:St1 rdf:object foaf:ProjA
(where ns is a custom namespace). In this way, information related to the previous triple can be expressed by simply referring to the statement as follows:
ns:St1 ns:ackBy foaf:Organization1
ns:St1 ns:startDate “...”
ns:St1 ns:endDate “...”
4. Evaluation
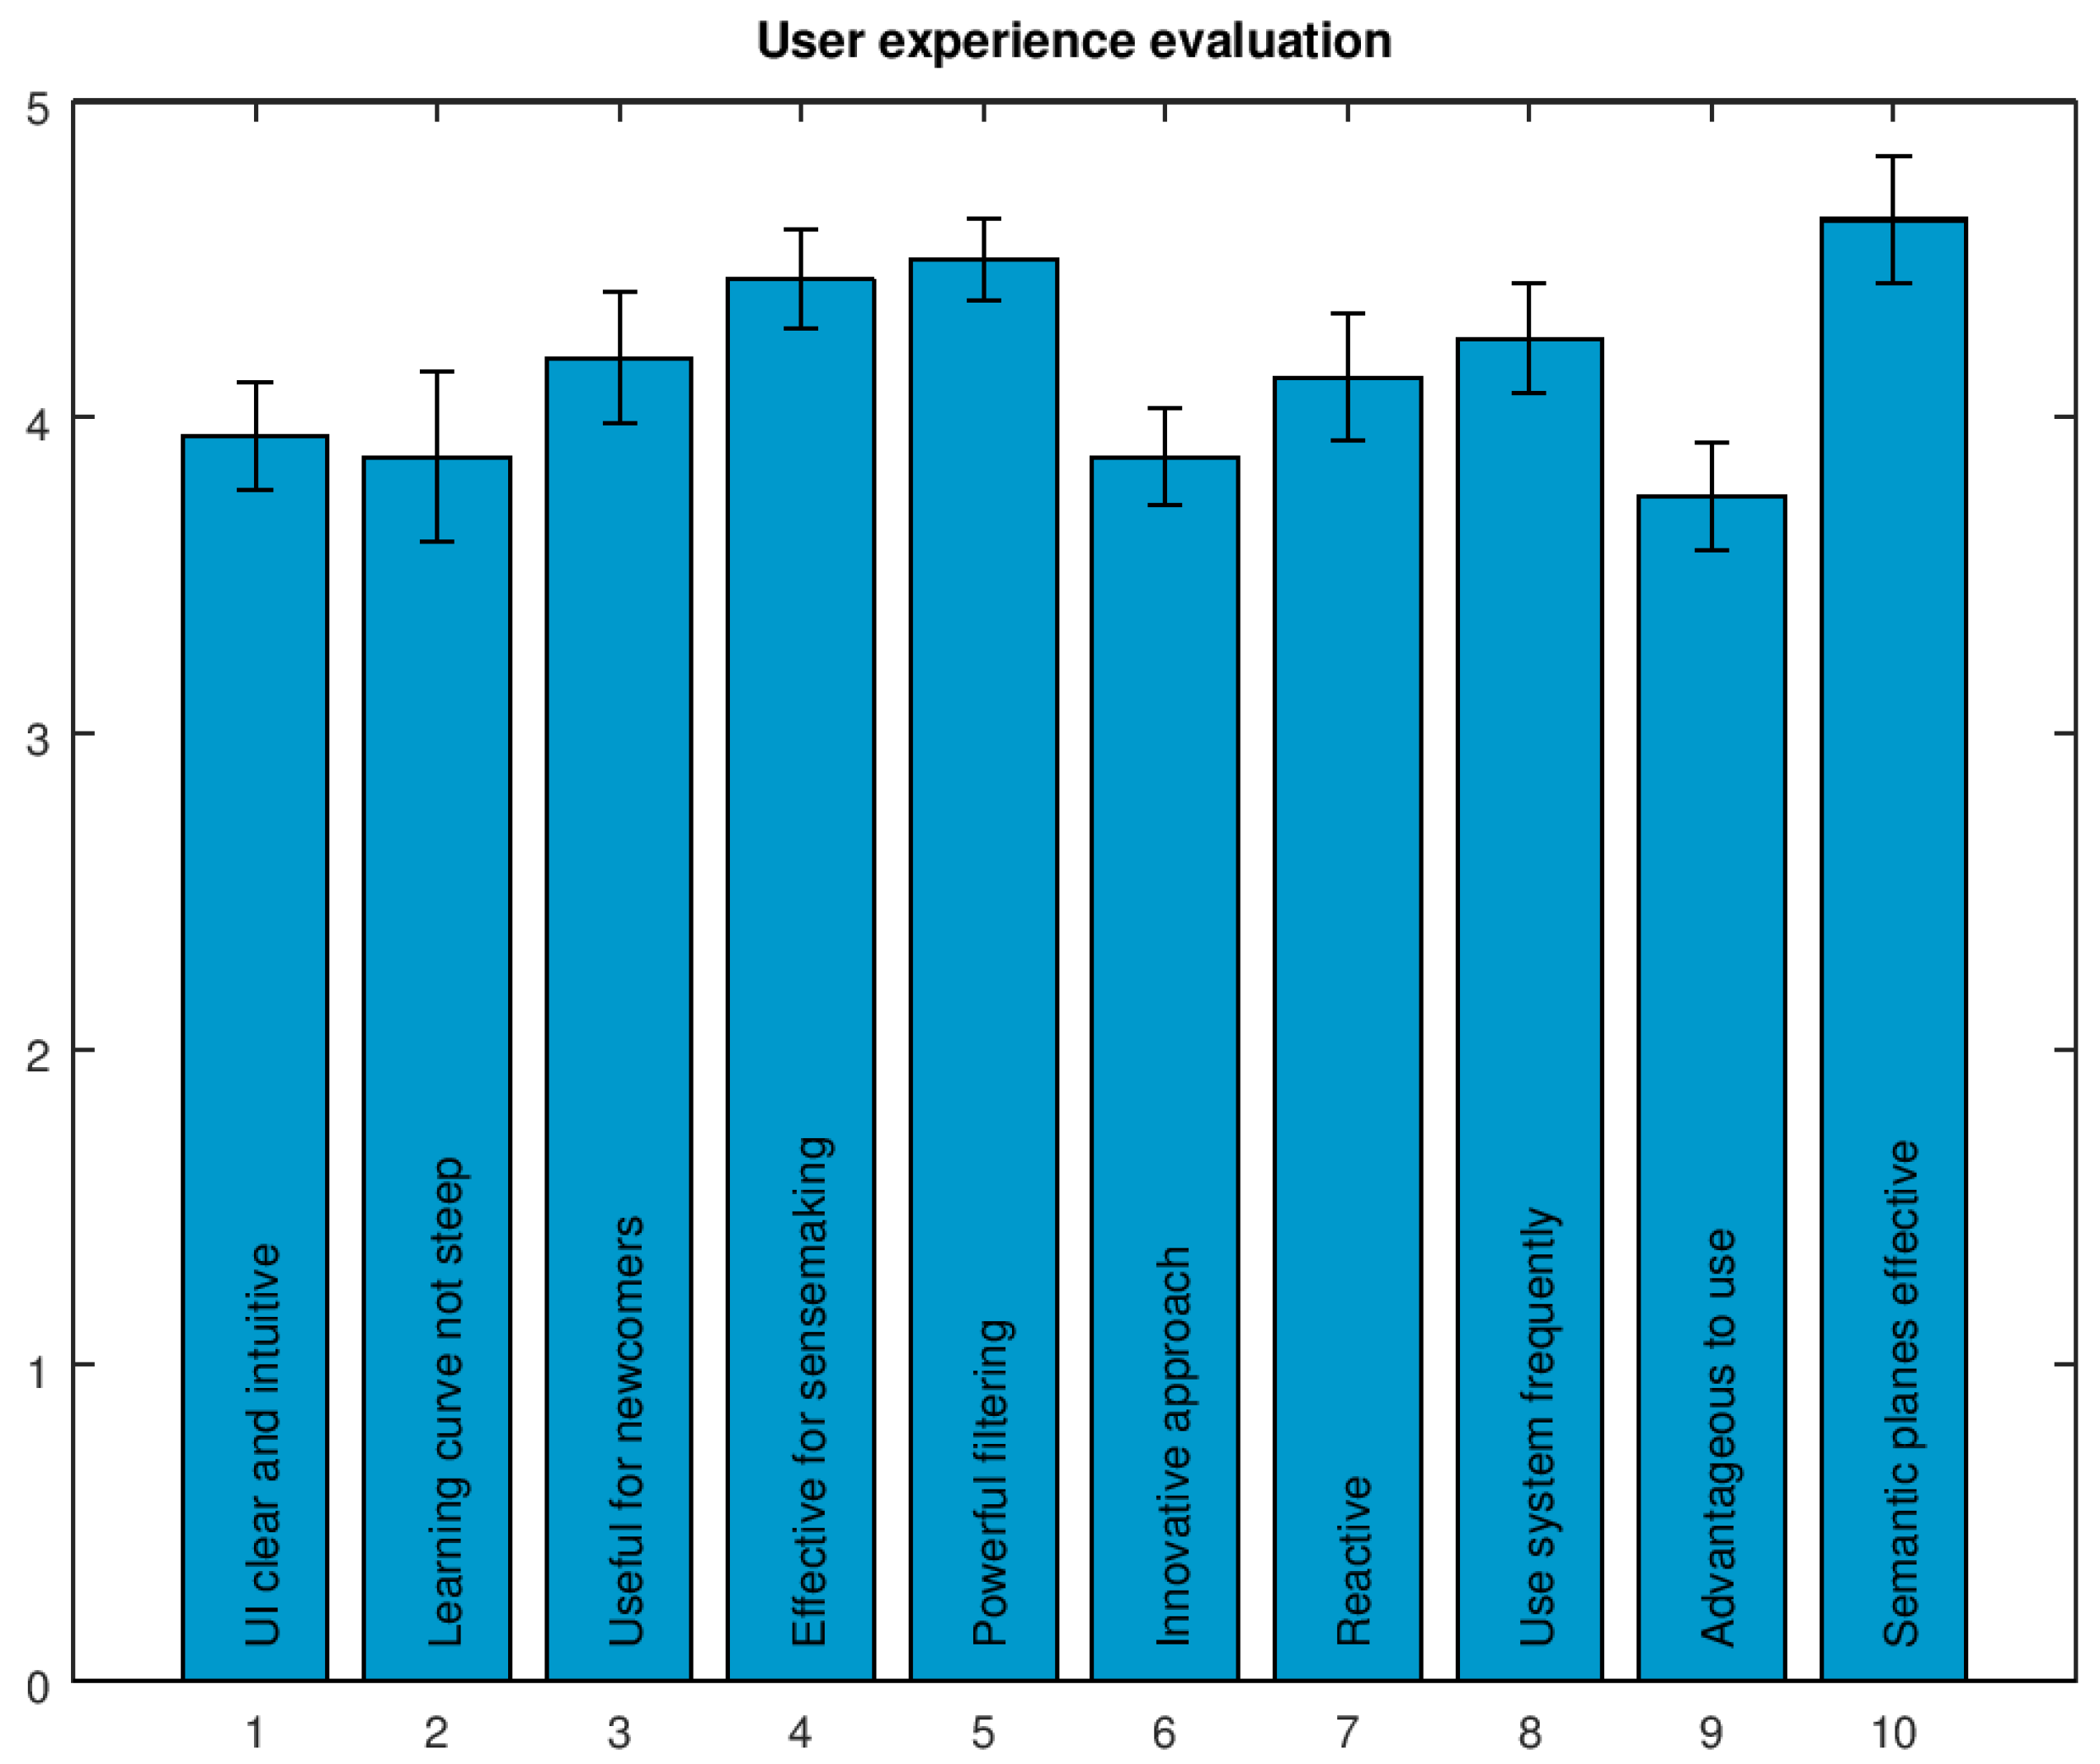
4.1. User Evaluation
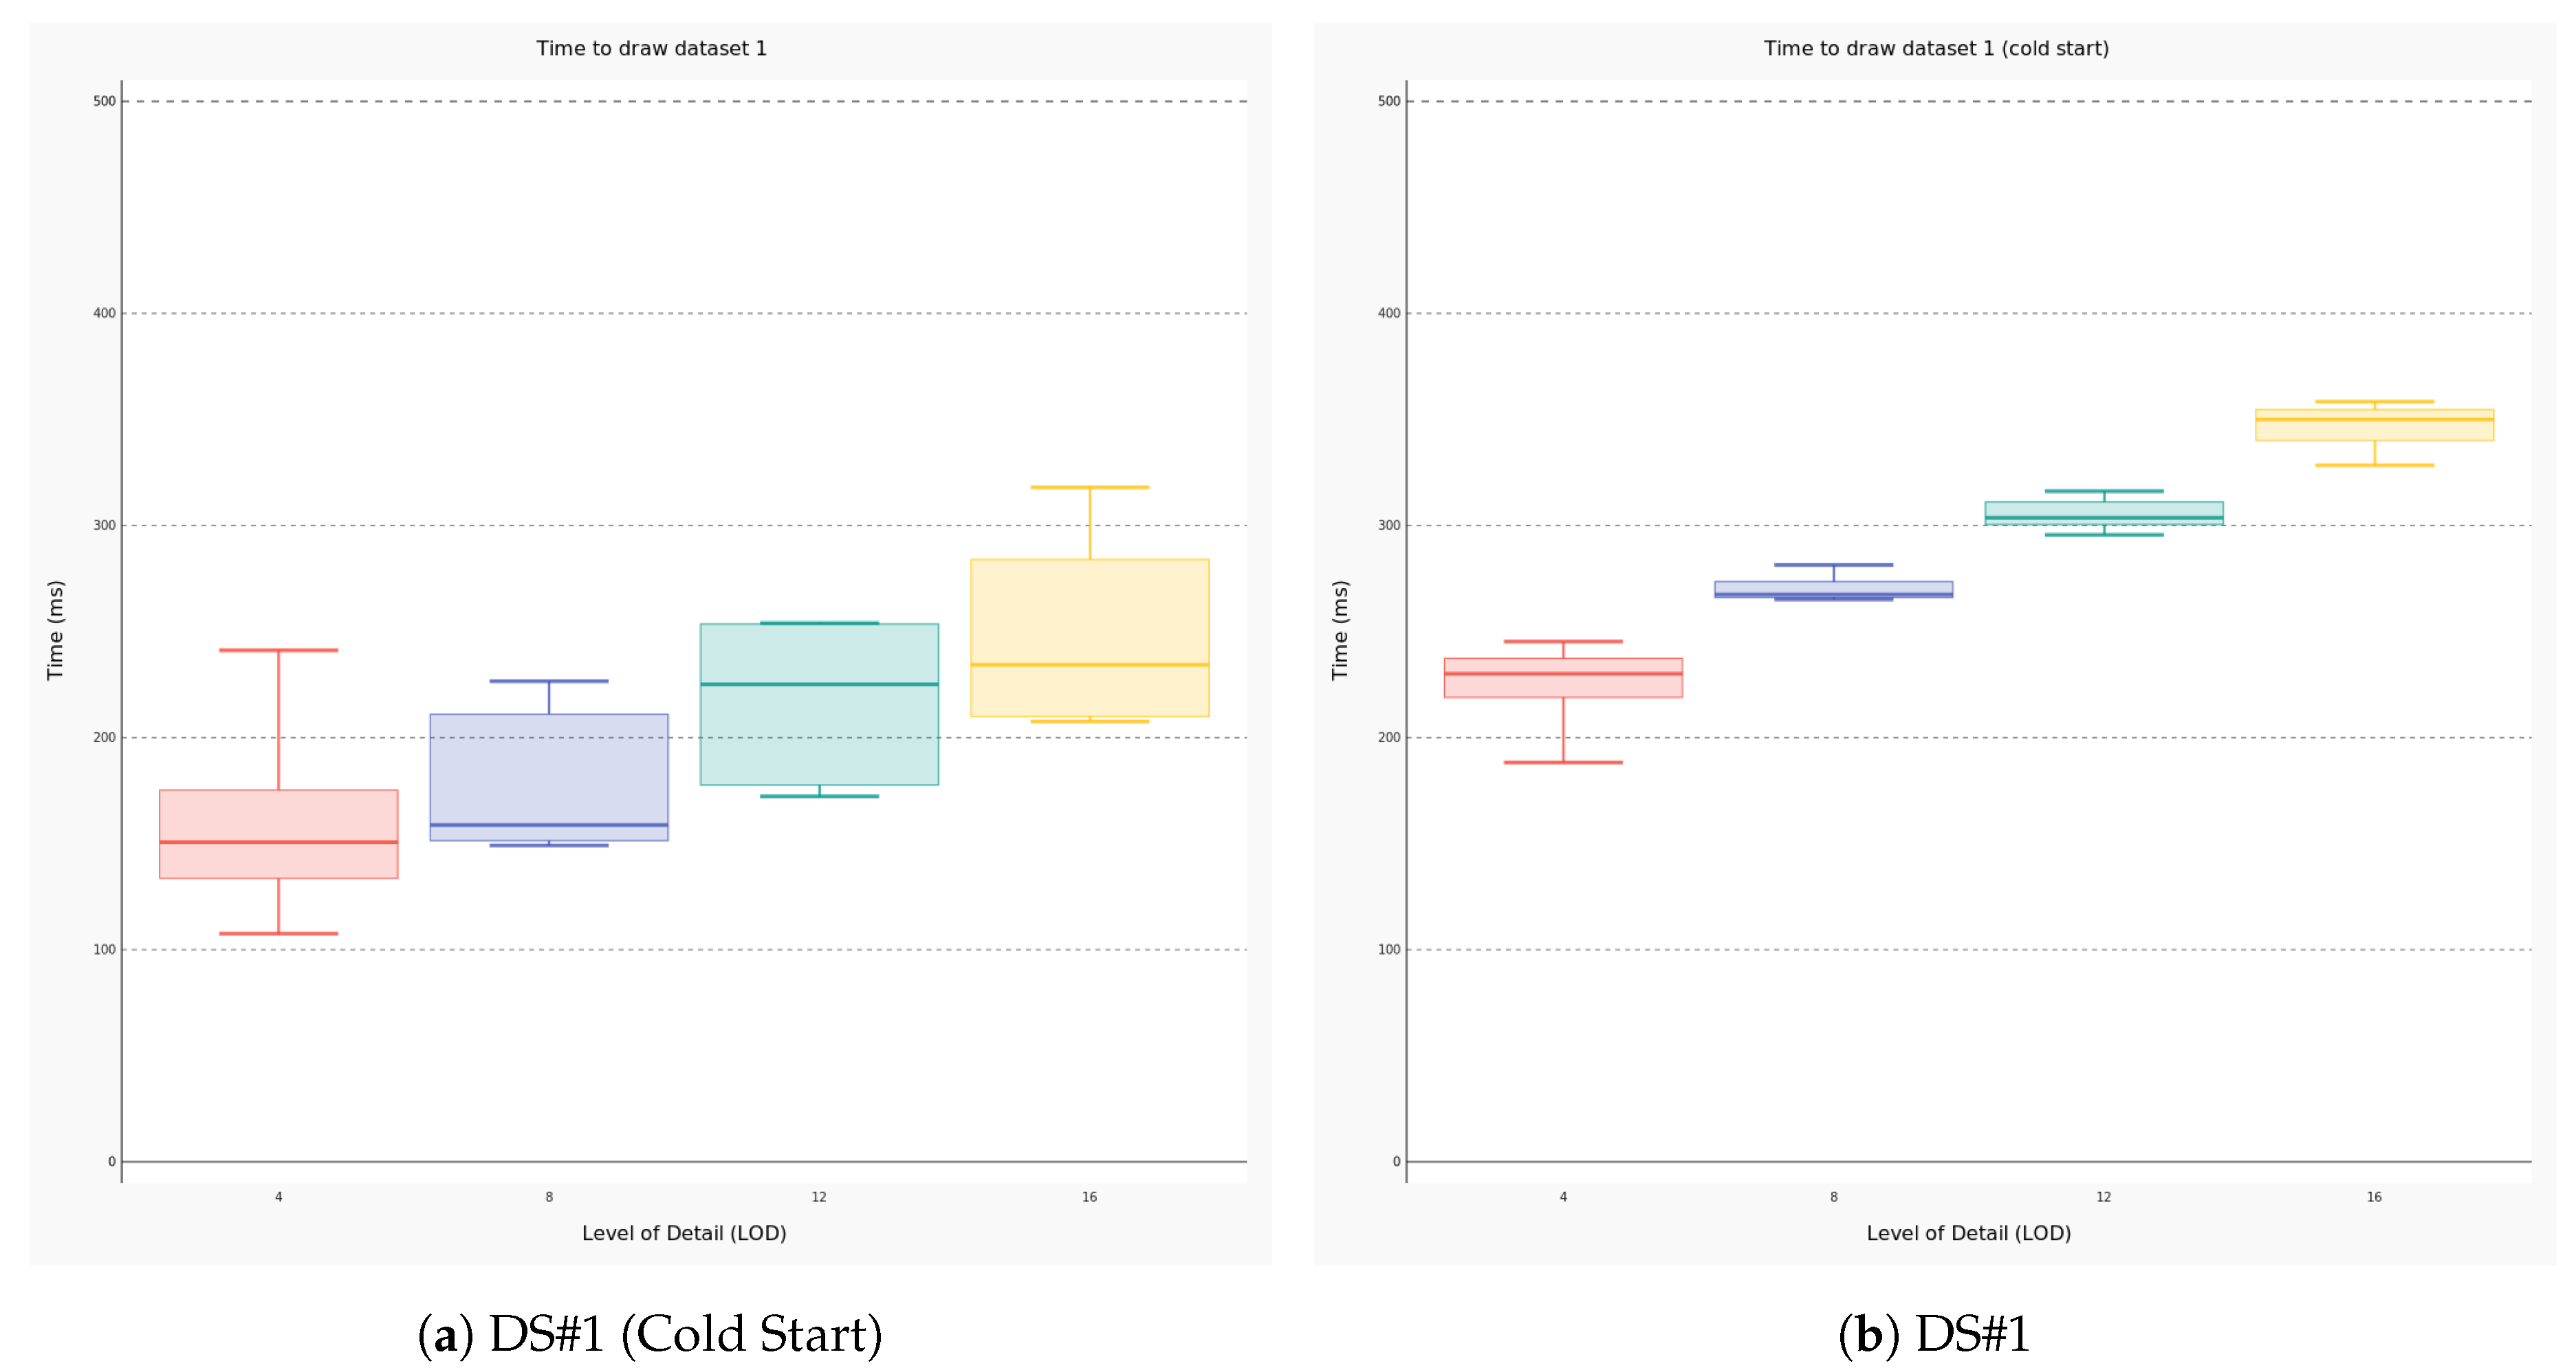
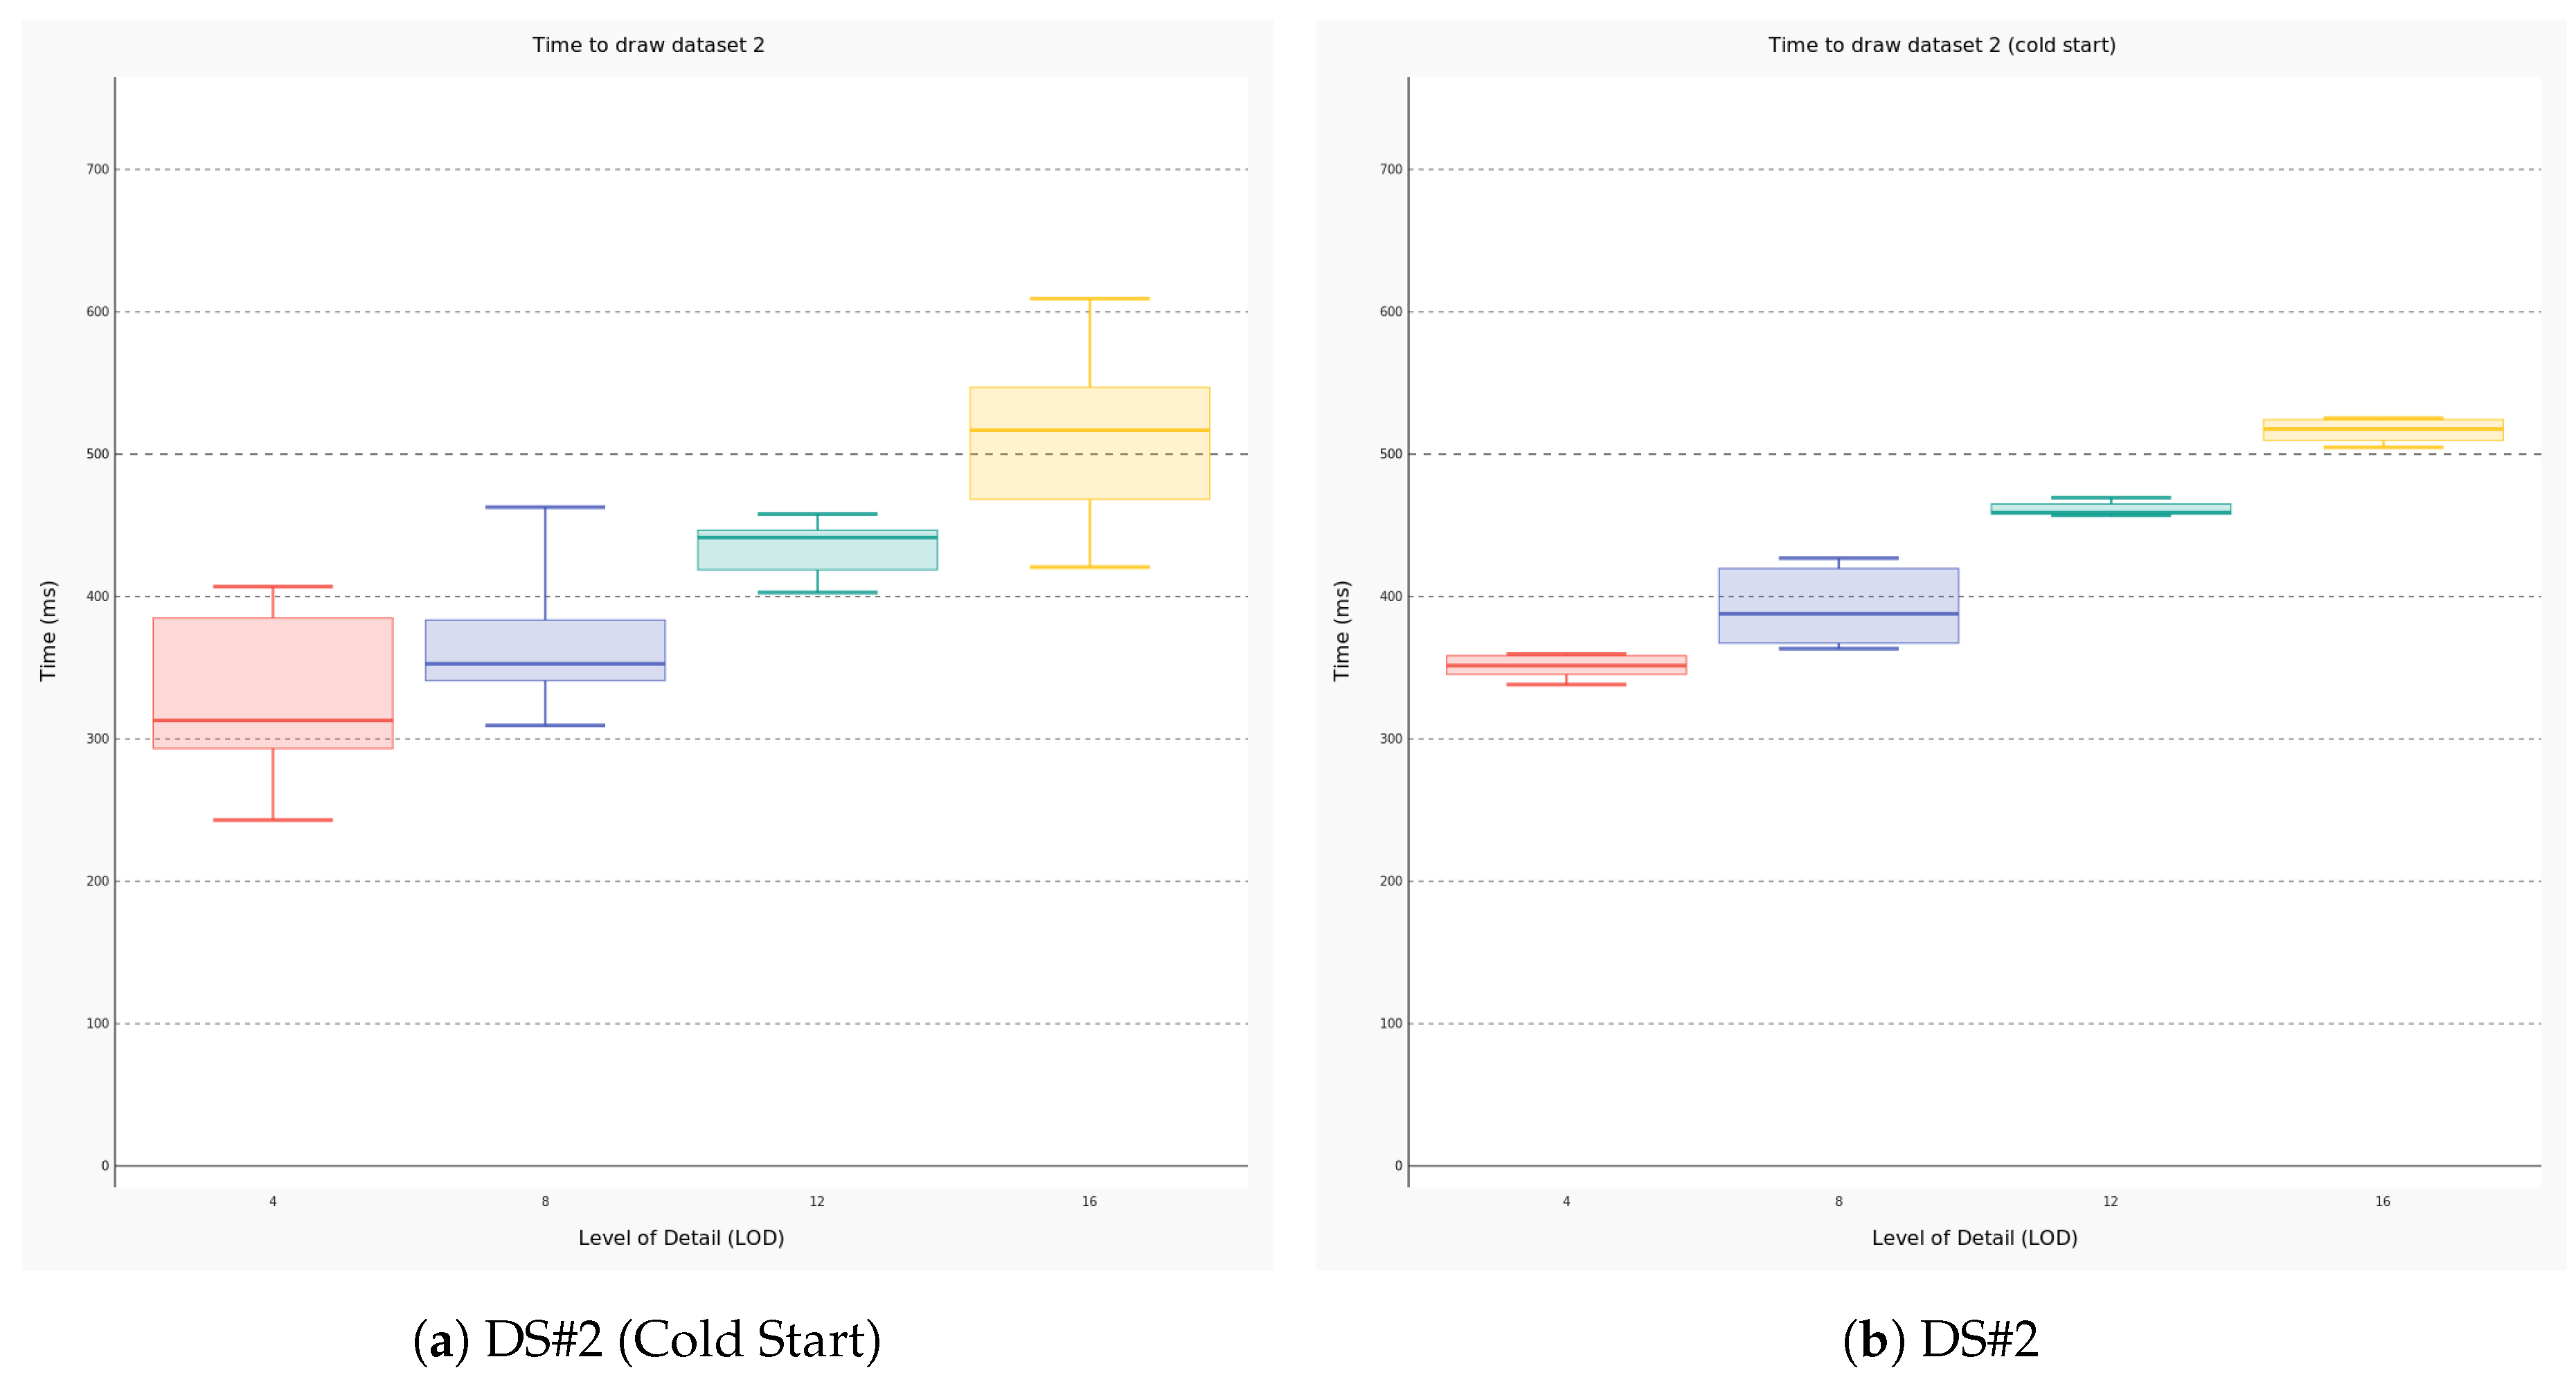
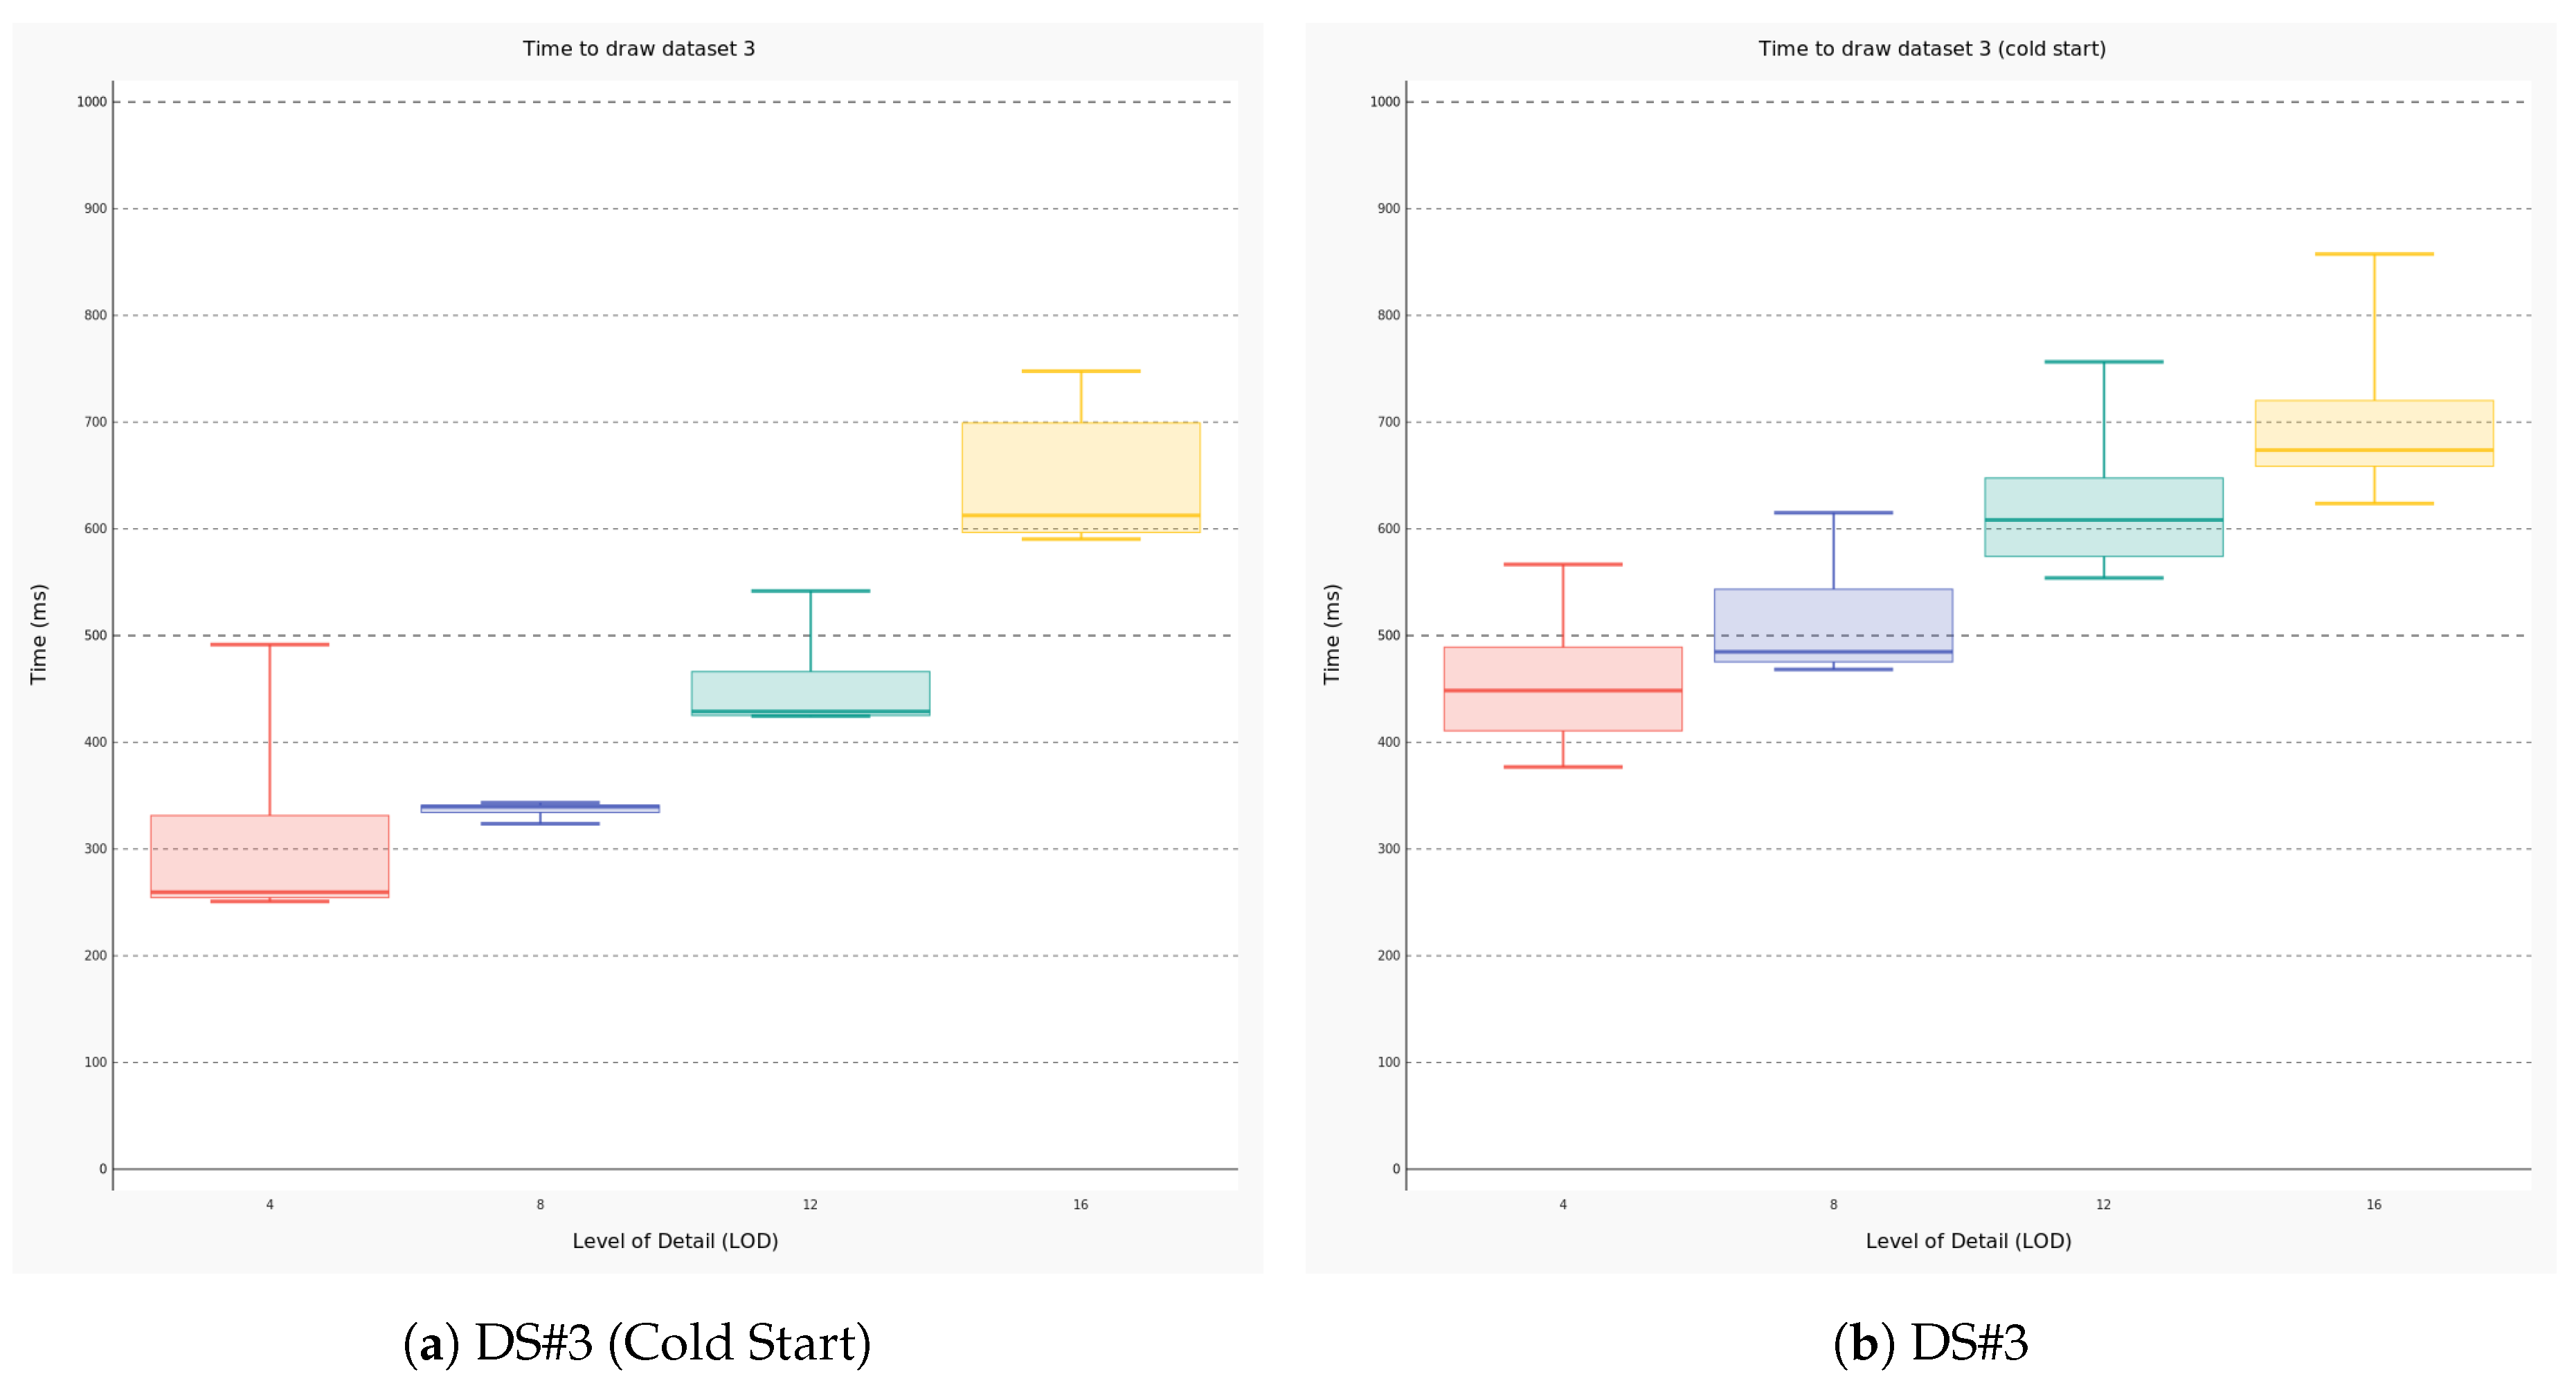
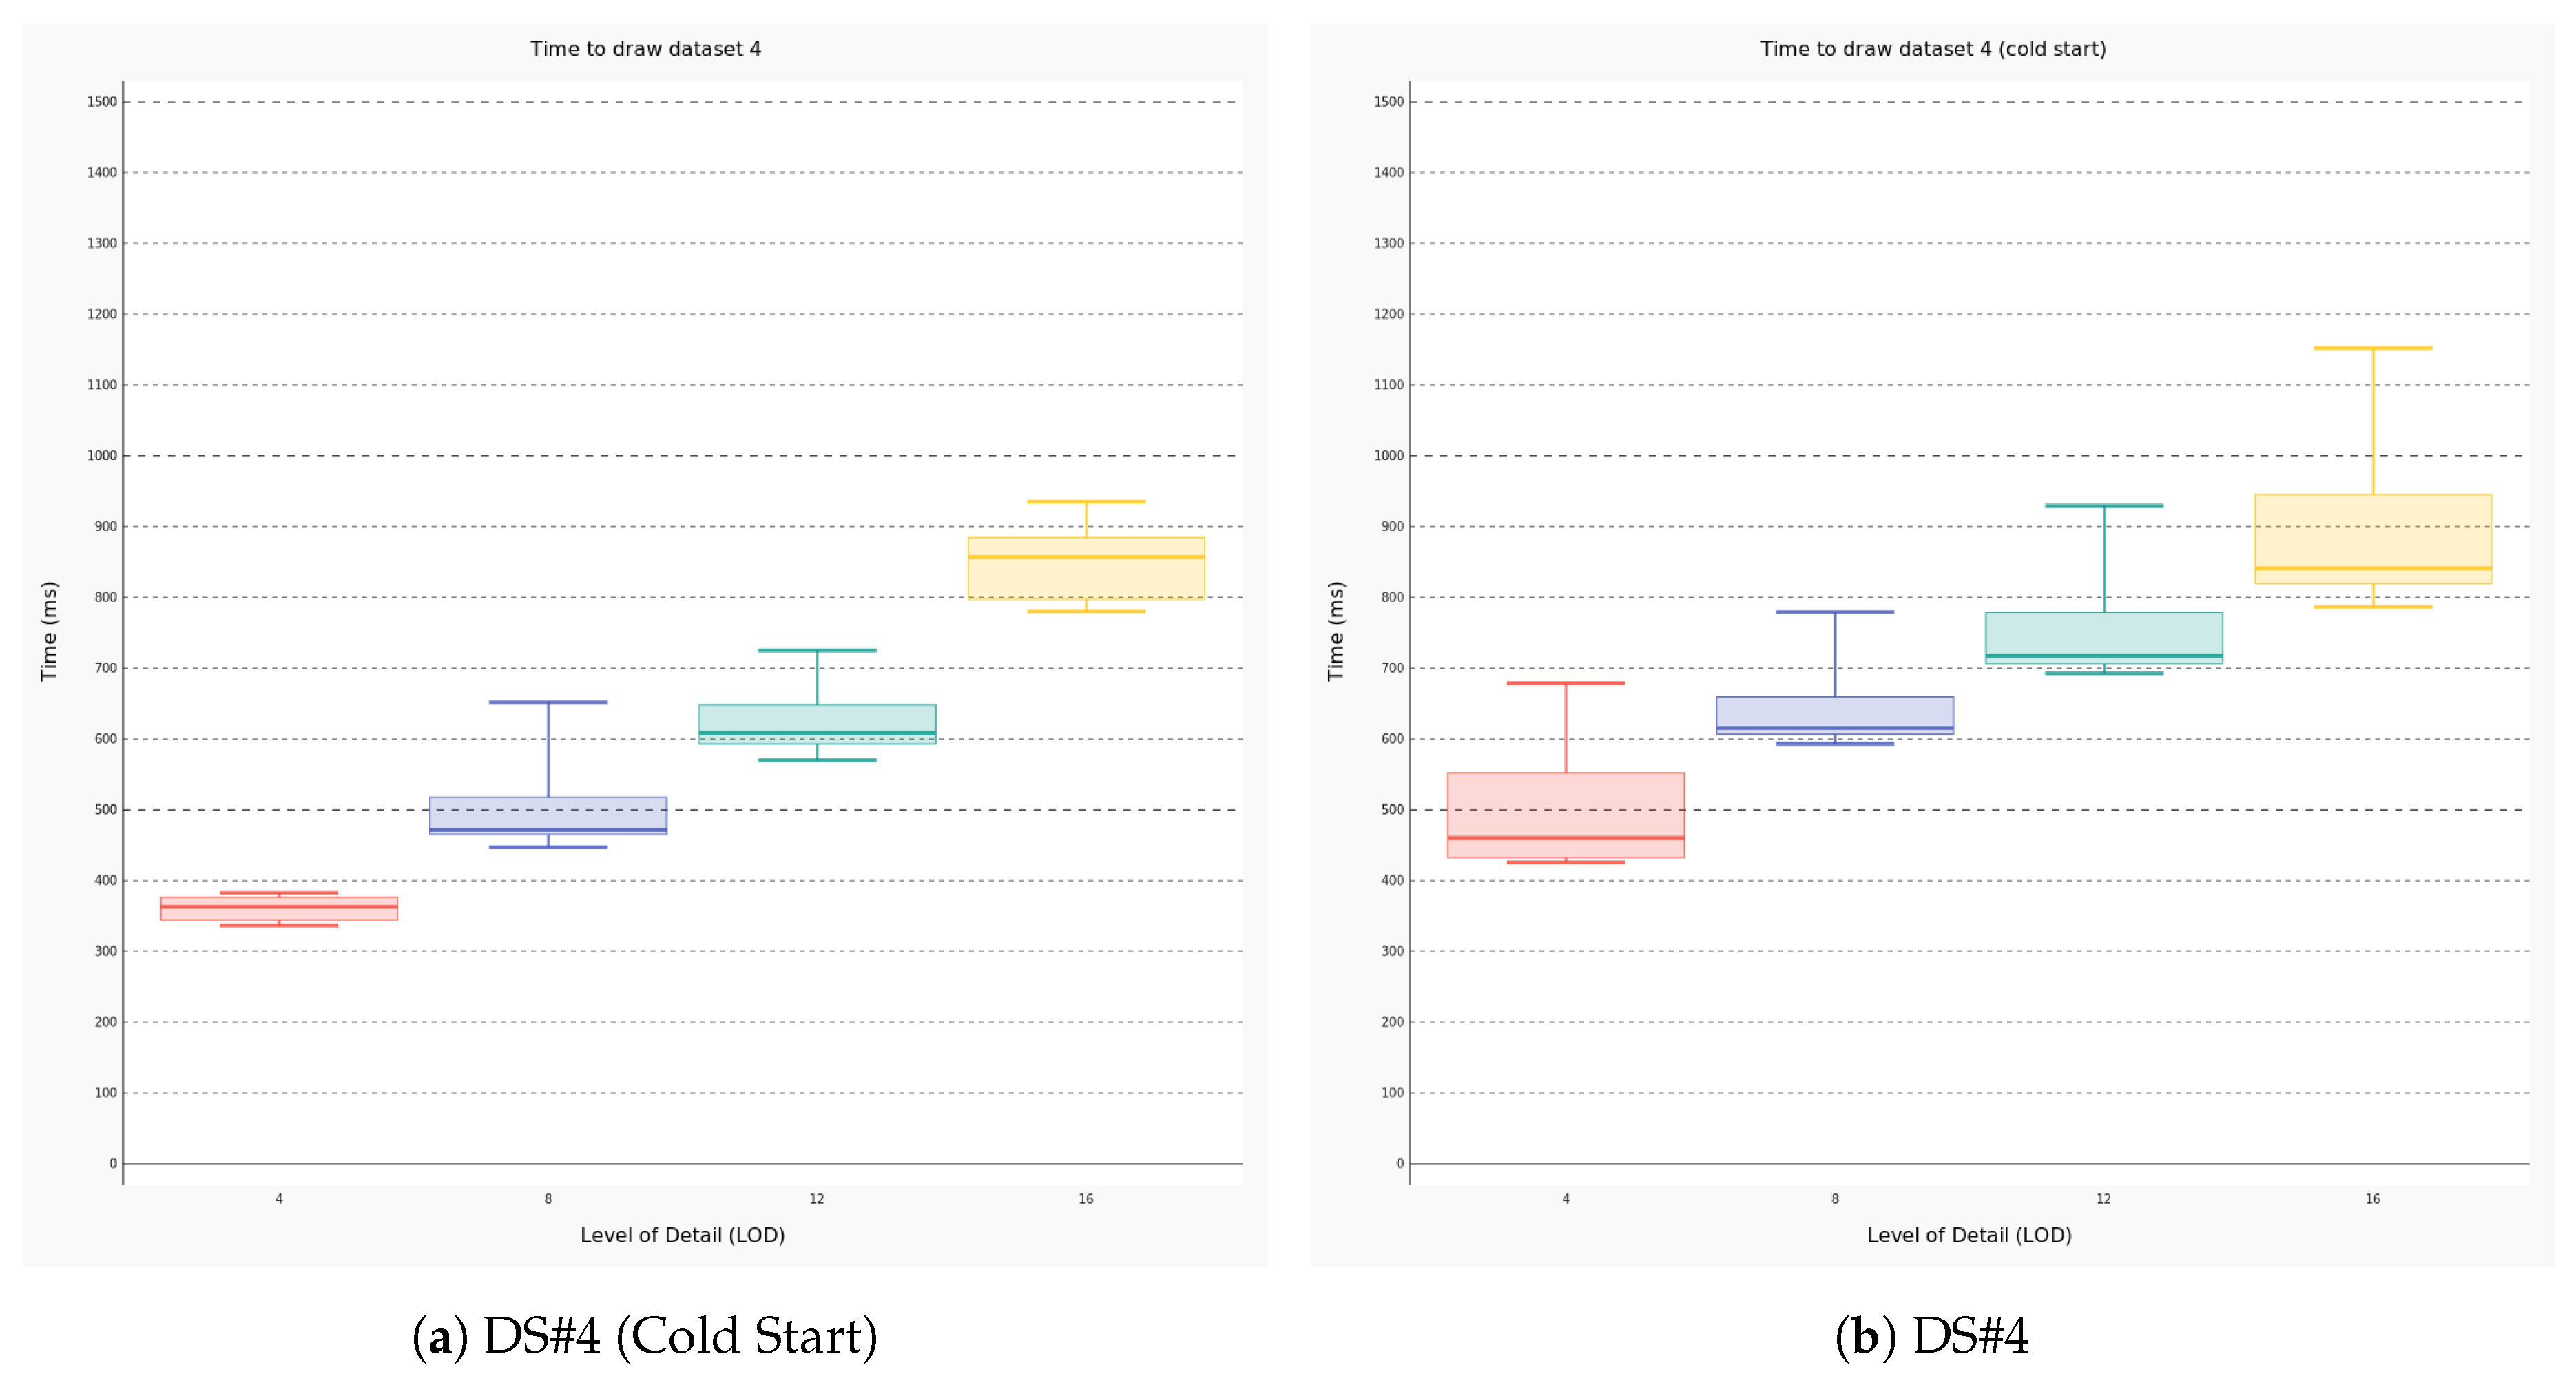
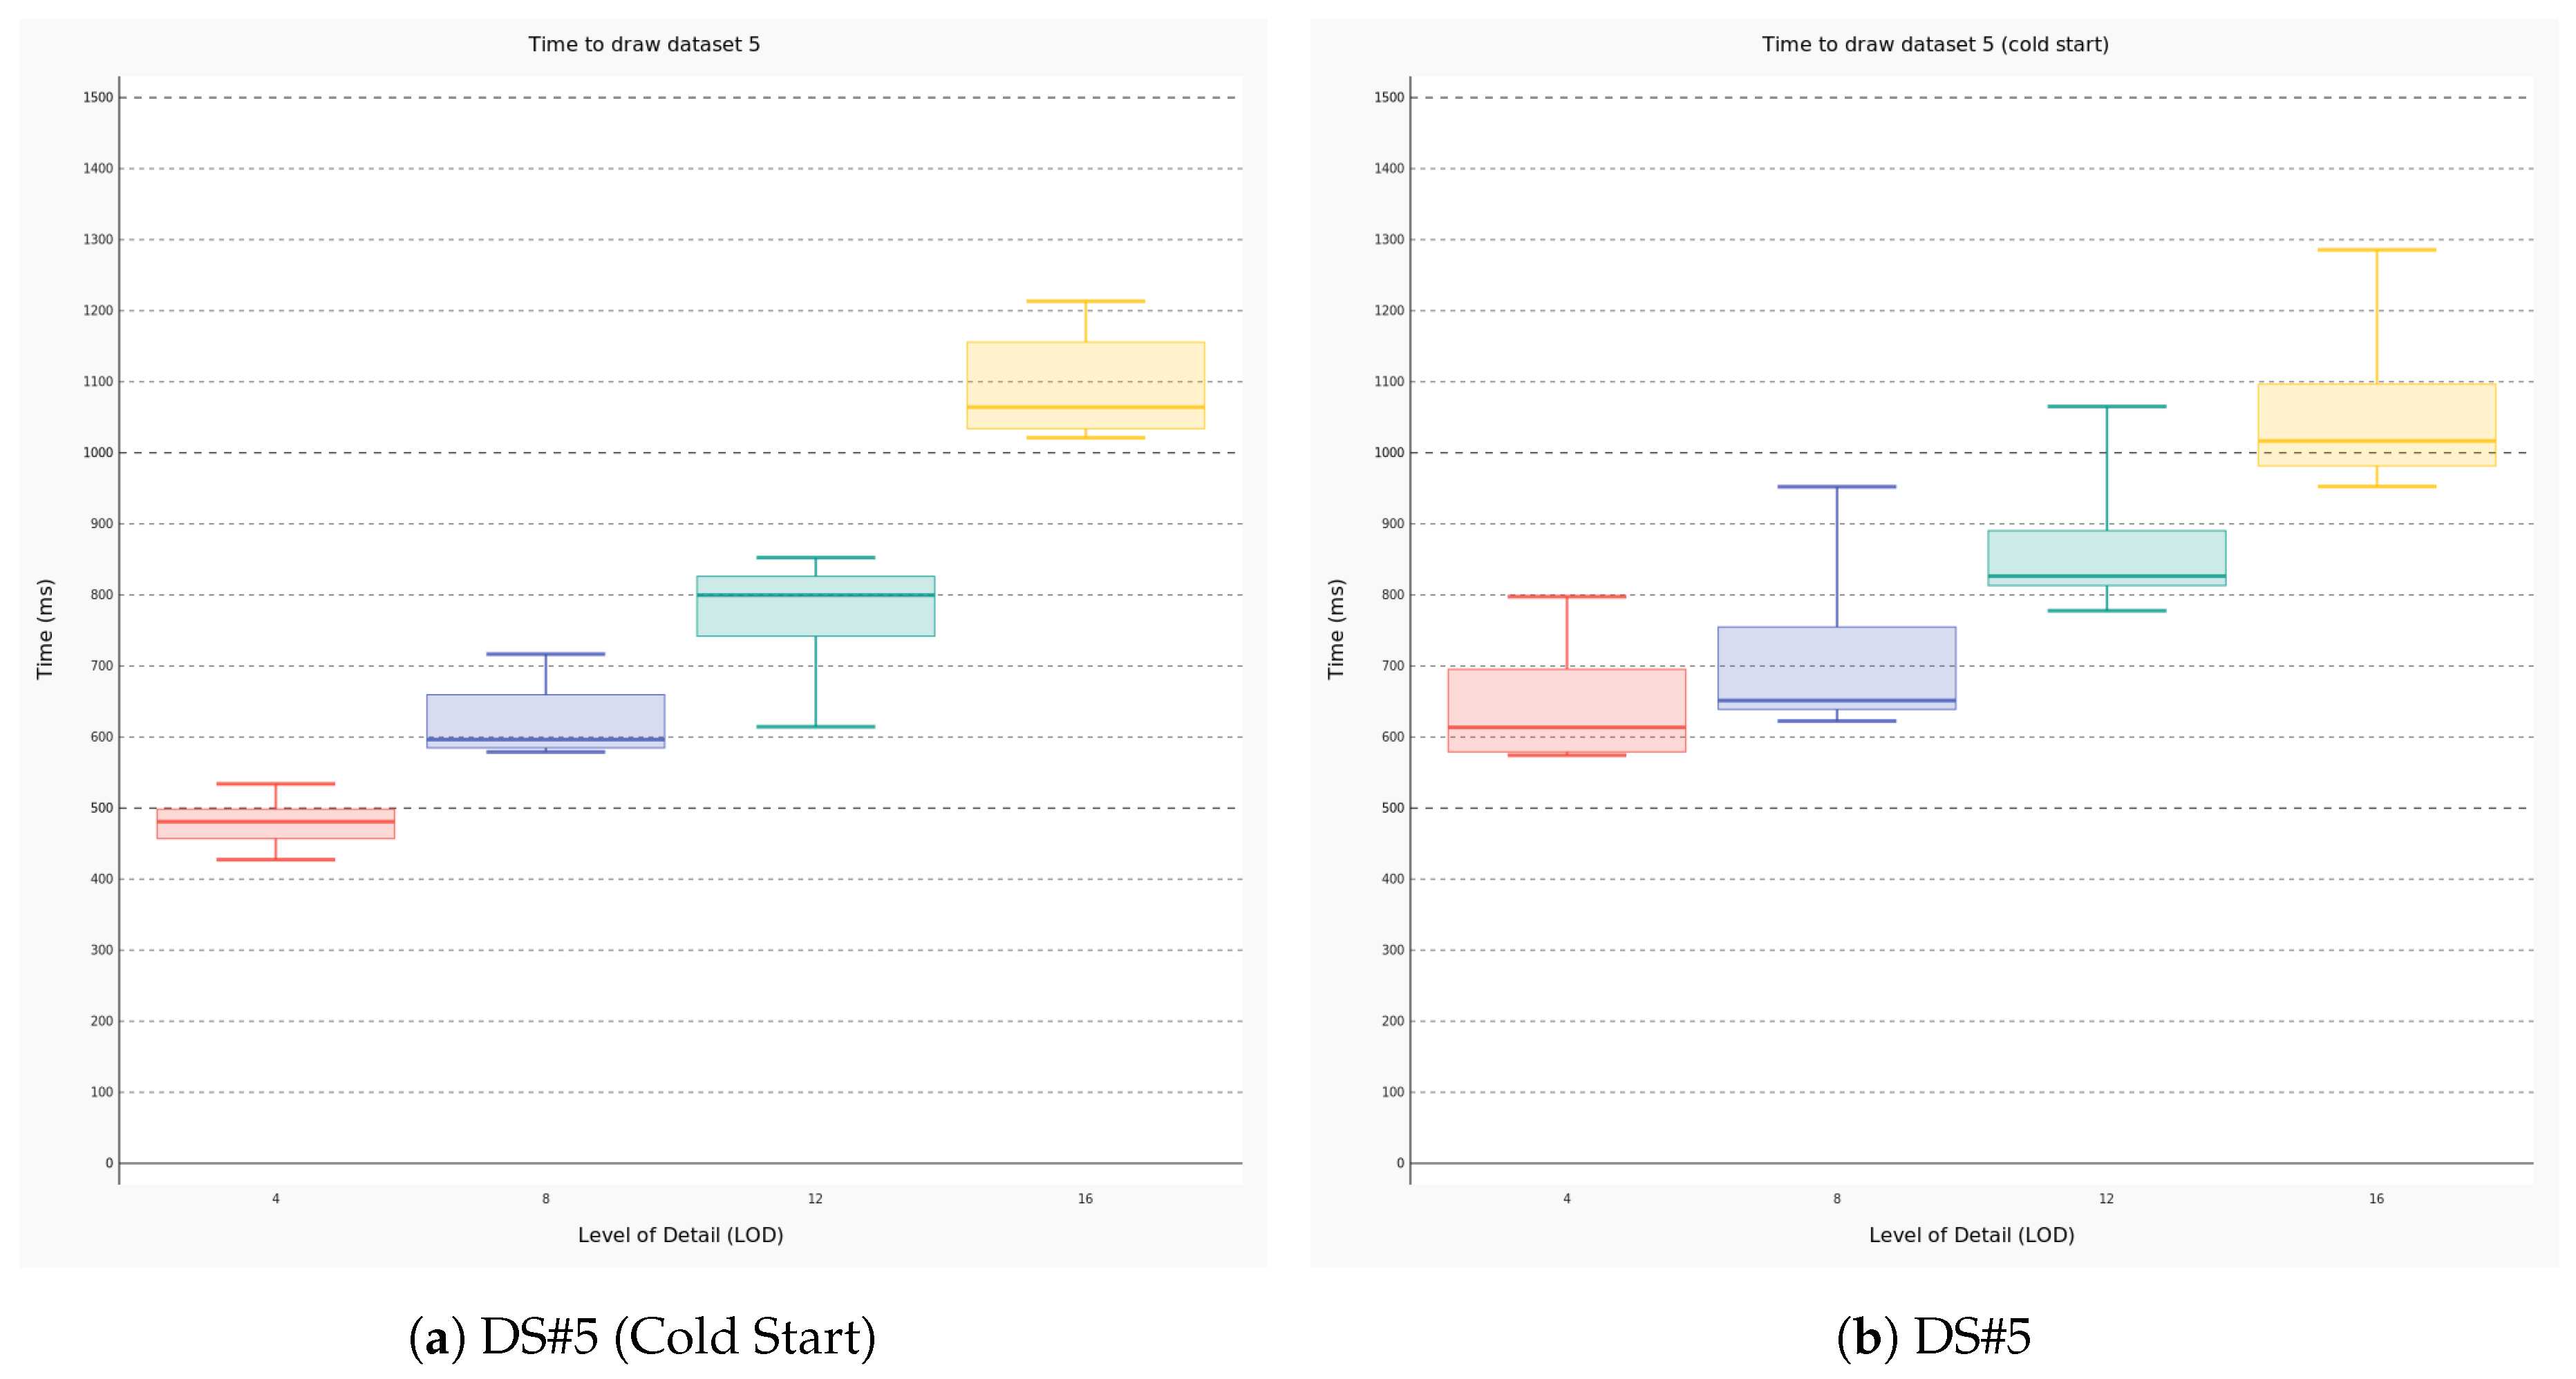
4.2. Performance Evaluation
- the amount of data to be traced (i.e., the number of meshes);
- the requested level of detail that is one of the parameters configurable by the user; and
- wether the 3D scene has been initialized (i.e., the latter condition is defined cold start).
5. Related Work
6. Conclusions
Author Contributions
Funding
Acknowledgments
Conflicts of Interest
References
- Berners-Lee, T.; Hendler, J.; Lassila, O. The semantic web. Sci. Am. 2001, 284, 28–37. [Google Scholar] [CrossRef]
- Gruber, T.R. Ontology. In Encyclopedia of Database Systems; Liu, L., Özsu, M.T., Eds.; Springer: Berlin/Heidelberg, Germany, 2009. [Google Scholar]
- Gyrard, A.; Zimmermann, A.; Sheth, A. Building IoT based applications for Smart Cities: How can ontology catalogs help? IEEE Internet Things J. 2018, 1. [Google Scholar] [CrossRef]
- Vandenbussche, P.Y.; Atemezing, G.A.; Poveda-Villalón, M.; Vatant, B. Linked Open Vocabularies (LOV): A gateway to reusable semantic vocabularies on the Web. Semant. Web 2017, 8, 437–452. [Google Scholar] [CrossRef]
- Chebotko, A.; Lu, S.; Jamil, H.M.; Fotouhi, F. Semantics Preserving SPARQL-to-SQL Query Translation for Optional Graph Patterns; Tech. Rep. TR-DB-052006-CLJF; Wayne State University: Detroit, MI, USA, 2006. [Google Scholar]
- Zhao, L.; Ichise, R. Ontology integration for linked data. J. Data Semant. 2014, 3, 237–254. [Google Scholar] [CrossRef]
- Asin, A.; Gascon, D. 50 sensor applications for a smarter world. In Libelium Comunicaciones Distribuidas; Tech. Rep.: Zaragoza, Spain, 2012. [Google Scholar]
- Nguyen, V.; Bodenreider, O.; Sheth, A. Don’t like RDF reification?: Making statements about statements using singleton property. In Proceedings of the ACM 23rd International Conference on World Wide Web, Seoul, Korea, 7–11 April 2014; pp. 759–770. [Google Scholar]
- D’Elia, A.; Perilli, L.; Viola, F.; Roffia, L.; Antoniazzi, F.; Canegallo, R.; Salmon Cinotti, T. A self-powered WSAN for energy efficient heat distribution. In Proceedings of the 2016 IEEE Sensors Applications Symposium (SAS), Catania, Italy, 20–22 April 2016; pp. 1–6. [Google Scholar]
- D’Elia, A.; Viola, F.; Montori, F.; Felice, M.D.; Bedogni, L.; Bononi, L.; Borghetti, A.; Azzoni, P.; Bellavista, P.; Tarchi, D.; et al. Impact of Interdisciplinary Research on Planning, Running, and Managing Electromobility as a Smart Grid Extension. IEEE Access 2015, 3, 2281–2305. [Google Scholar] [CrossRef] [Green Version]
- Motta, E.; Mulholland, P.; Peroni, S.; d’Aquin, M.; Gomez-Perez, J.M.; Mendez, V.; Zablith, F. A novel approach to visualizing and navigating ontologies. In International Semantic Web Conference; Springer: Berlin/Heidelberg, Germany, 2011; pp. 470–486. [Google Scholar]
- Hernández, D.; Hogan, A.; Krötzsch, M. Reifying RDF: What Works Well with Wikidata? In Proceedings of the 11th International Workshop on Scalable Semantic Web Knowledge Base Systems (SSWS 2015), Bethlehem, PA, USA, 11 October 2015; pp. 32–47. [Google Scholar]
- Roffia, L.; Azzoni, P.; Aguzzi, C.; Viola, F.; Antoniazzi, F.; Salmon Cinotti, T. Dynamic Linked Data: A SPARQL Event Processing Architecture. Future Internet 2018, 10, 36. [Google Scholar] [CrossRef]
- Harary, F. Graph Theory; Addison-Wesley Series in Mathematics; Addison-Wesley Pub. Co.: Boston, MA, USA, 1969. [Google Scholar]
- Gallego, M.A.; Fernández, J.D.; Martínez-prieto, M.A.; Fuente, P.D. RDF Visualization Using a Three-Dimensional Adjacency Matrix. In Proceedings of the 4th International Semantic Search Workshop (SEMSEARCH2011), Hyderabad, India, 29 March 2011. [Google Scholar]
- Gansner, E.R.; Koutsofios, E.; North, S.C.; Vo, K.P.a.V.K.P. A technique for drawing directed graphs∖nA technique for drawing directed graphs. IEEE Trans. Softw. Eng. 1993, 19, 214–230. [Google Scholar] [CrossRef]
- Gansner, E.R.; North, S.C. An open graph visualization system and its applications to software engineering. Softw. Pract. Exp. 2000, 30, 1203–1233. [Google Scholar] [CrossRef]
- Gansner, E.; Koren, Y. Improved circular layouts. In Graph Drawing; Springer: Berlin/Heidelberg, Germany, 2007; pp. 386–398. [Google Scholar]
- Gansner, E.R.; Hu, Y. Efficient, Proximity-Preserving Node Overlap Removal. J. Graph Algorithms Appl. 2010, 14, 53–74. [Google Scholar] [CrossRef]
- Binucci, C.; Chimani, M.; Didimo, W.; Liotta, G.; Montecchiani, F. Placing Arrows in Directed Graph Drawings; Springer: Cham, Switzerland, 2016; pp. 1–19. [Google Scholar]
- Brandenburg, F.J.; Eppstein, D.; Goodrich, M.T.; Kobourov, S.G.; Liotta, G.; Mutzel, P. Selected Open Problems in Graph Drawing. In Graph Drawing; Liotta, G., Ed.; Lecture Notes in Computer Science; Springer: Berlin/Heidelberg, Germany, 2003; Volume 2912, pp. 515–539. [Google Scholar]
- Shneiderman, B.; Aris, A. Network visualization by semantic substrates. IEEE Trans. Vis. Comput. Graph. 2006, 12, 733–740. [Google Scholar] [CrossRef] [PubMed]
- Gansner, E.R.; Koren, Y.; North, S. Graph Drawing by Stress Majorization. In Proceedings of the 12th International Symposium on Graph Drawing (GD 2004), New York, NY, USA, 29 September–2 October 2004; Volume LNCS 3383, pp. 239–250. [Google Scholar]
- Ellson, J.; Gansner, E.R.; Koutsofios, E.; North, S.C.; Woodhull, G. Graphviz and Dynagraph—Static and Dynamic Graph Drawing Tools. In Graph Drawing Software; Springer: Berlin/Heidelberg, Germany, 2004; pp. 127–148. [Google Scholar]
- Gansner, E.R.; Hu, Y.; Kobourov, S.G. GMap: Drawing Graphs as Maps; Springer: Berlin/Heidelberg, Germany, 2009. [Google Scholar]
- Stolper, C.D.; Kahng, M.; Lin, Z.; Foerster, F.; Goel, A.; Stasko, J.; Chau, D.H. GLO-STIX: Graph-Level Operations for Specifying Techniques and Interactive eXploration. IEEE Trans. Vis. Comput. Graph. 2014, 20, 2320–2328. [Google Scholar] [CrossRef] [PubMed]
- Wu, E.; Psallidas, F.; Miao, Z.; Zhang, H.; Rettig, L.; Wu, Y.; Sellam, T. Combining Design and Performance in a Data Visualization Management System. In Proceedings of the 8th Biennial Conference on Innovative Data Systems Research (CIDR ’17), Chaminade, California, 8–11 January 2017. [Google Scholar]
- Bastian, M.; Heymann, S.; Jacomy, M. Gephi: An Open Source Software for Exploring and Manipulating Networks. Third Int. AAAI Conf. Weblogs Soc. Media 2009, 8, 361–362. [Google Scholar]
- Sayers, C. Node-Centric Rdf Graph Visualization; Mobile and Media Systems Laboratory, HP Labs: Palo Alto, CA, USA, 2004. [Google Scholar]
- Dokulil, J.; Katreniakov, J. Visualization of Large Schemaless RDF Data. In Proceedings of the International Conference on Mobile Ubiquitous Computing, Systems, Services and Technologies (UBICOMM’07), Papeete, France, 4–9 November 2007; pp. 243–248. [Google Scholar]
- Deligiannidis, L.; Kochut, K.J.; Sheth, A.P. RDF Data Exploration and Visualization. In Proceedings of the ACM First Workshop on CyberInfrastructure: Information Management in eScience, Lisbon, Portugal, 9 November 2007; pp. 39–46. [Google Scholar] [CrossRef]
- Lohmann, S.; Negru, S.; Haag, F.; Ertl, T. VOWL2: User-Oriented Visualization of Ontologies. In Proceedings of the Knowledge Engineering and Knowledge Management: 19th International Conference, EKAW 2014, Linköping, Sweden, 24–28 November 2014. [Google Scholar]
- Brunk, S.; Heim, P. Tfacet: Hierarchical faceted exploration of semantic data using well-known interaction concepts. CEUR Workshop Proc. 2011, 817, 31–36. [Google Scholar]
- Yee, K.P.; Swearingen, K.; Li, K.; Hearst, M. Faceted metadata for image search and browsing. In Proceedings of the ACM SIGCHI Conference on Human Factors in Computing Systems, Ft. Lauderdale, FL, USA, 5–10 April 2003; pp. 401–408. [Google Scholar]
- Heim, P.; Lohmann, S.; Stegemann, T. Interactive relationship discovery via the semantic web. In Lecture Notes in Computer Science (Including Subseries Lecture Notes in Artificial Intelligence and Lecture Notes in Bioinformatics); Springer: Berlin/Heidelberg, Germany, 2010; Volume 6088 LNCS, pp. 303–317. [Google Scholar]
- Heim, P.; Lohmann, S. Semlens: Visual analysis of semantic data with scatter plots and semantic lenses. In Proceedings of the 7th International Conference on Semantic Systems—I-Semantics ’11, Graz, Austria, 7–9 September 2011; pp. 175–178. [Google Scholar]
- Bier, E.A.; Stone, M.C.; Pier, K.; Buxton, W.; DeRose, T.D. Toolglass and magic lenses: The see-through interface. In Proceedings of the ACM 20th Annual Conference on Computer Graphics and Interactive Techniques, Anaheim, CA, USA, 2–6 August 1993; pp. 73–80. [Google Scholar]
- Heim, P.; Schlegel, T.; Ertl, T. A Model for Human-Computer Interaction in the Semantic Web Categories and Subject Descriptors. In Proceedings of the 7th International Conference on Semantic Systems, Graz, Austria, 7–9 September 2011; pp. 150–158. [Google Scholar]
- Dadzie, A.S.; Pietriga, E. Visualisation of linked data—Reprise. Semant. Web 2017, 8, 1–21. [Google Scholar] [CrossRef]
- Nuzzolese, A.G.; Presutti, V.; Gangemi, A.; Peroni, S.; Ciancarini, P. Aemoo: Linked data exploration based on knowledge patterns. Semant. Web 2017, 8, 87–112. [Google Scholar] [CrossRef]
- Storey, M.A.; Lintern, R.; Ernst, N.; Perrin, D. Visualization and protege. In Proceedings of the 7th International Protégé Conference, Bethesda, Maryland, 6–9 July 2004. [Google Scholar]
- Sivakumar, R.; Arivoli, P. Ontology visualization PROTÉGÉ tools—A review. Int. J. Adv. Inf. Technol. 2011, 1, 1–11. [Google Scholar] [CrossRef]
- Storey, M.; Musen, M.; Silva, J.; Best, C.; Ernst, N.; Fergerson, R.; Noy, N. Jambalaya: Interactive visualization to enhance ontology authoring and knowledge acquisition in Protégé. In Proceedings of the Workshop on Interactive Tools for Knowledge Capture (K-CAP-2001), Victoria, BC, Canada, 20 October 2001; pp. 1–9. [Google Scholar] [CrossRef]
- Lomov, P.; Shishaev, M. Creating Cognitive Frames Based on Ontology Design Patterns for Ontology Visualization. In Knowledge Engineering and the Semantic Web; Klinov, P., Mouromtsev, D., Eds.; Springer International Publishing: Cham, Switzerland, 2014; pp. 90–104. [Google Scholar]
- Roffia, L.; Morandi, F.; Kiljander, J.; D’Elia, A.; Vergari, F.; Viola, F.; Bononi, L.; Salmon Cinotti, T. A semantic publish-subscribe architecture for the Internet of Things. IEEE Internet Things J. 2016, 3, 1274–1296. [Google Scholar] [CrossRef]
- Rinne, M.; Nuutila, E. Constructing Event Processing Systems of Layered and Heterogeneous Events with SPARQL. J. Data Semant. 2017, 6, 57–69. [Google Scholar] [CrossRef]


| OWL Ontology T-Box Content | |
| Classes (Person, Project ∈ foaf) | 2 |
| Object Properties (knows, currentProject ∈ foaf) | 2 |
| Datatype Properties (name, surname, status ∈ foaf) | 2 |
| OWL Ontology A-Box Content | |
| Persons | 25 |
| Projects | 5 |
| Links among persons (i.e., foaf:knows) | 250 |
| Links persons-projects (i.e., foaf:currentProject) | 125 |
| OWL Ontology T-Box Content | |
|---|---|
| Classes (Person, Project, Organization ∈ foaf, Statement ∈ rdf) | 4 |
| Object Properties (currentProject ∈ foaf, ackBy, startDate, endDate ∈ ns, subject, predicate, object ∈ rdf) | 6 |
| Datatype Properties (name, surname, status ∈ foaf, object ∈ rdf) | 5 |
| OWL Ontology A-Box Content | |
| Persons | 20 |
| Projects | 5 |
| Organizations | 2 |
| Links persons-projects (i.e., foaf:currentProject) | 20 |
| Links organizations-persons (i.e., foaf:member) | 20 |
| Acknowledged statements (i.e., ns:ackBy) | 20 |
| Statements time-stamped with ns:startDate | 20 |
| Statements time-stamped with ns:endDate | 10 |
© 2018 by the authors. Licensee MDPI, Basel, Switzerland. This article is an open access article distributed under the terms and conditions of the Creative Commons Attribution (CC BY) license (http://creativecommons.org/licenses/by/4.0/).
Share and Cite
Viola, F.; Roffia, L.; Antoniazzi, F.; D’Elia, A.; Aguzzi, C.; Salmon Cinotti, T. Interactive 3D Exploration of RDF Graphs through Semantic Planes. Future Internet 2018, 10, 81. https://doi.org/10.3390/fi10080081
Viola F, Roffia L, Antoniazzi F, D’Elia A, Aguzzi C, Salmon Cinotti T. Interactive 3D Exploration of RDF Graphs through Semantic Planes. Future Internet. 2018; 10(8):81. https://doi.org/10.3390/fi10080081
Chicago/Turabian StyleViola, Fabio, Luca Roffia, Francesco Antoniazzi, Alfredo D’Elia, Cristiano Aguzzi, and Tullio Salmon Cinotti. 2018. "Interactive 3D Exploration of RDF Graphs through Semantic Planes" Future Internet 10, no. 8: 81. https://doi.org/10.3390/fi10080081