A Crowdsensing Platform for Monitoring of Vehicular Emissions: A Smart City Perspective
by
 , , , and
Marianne Silva
1,* ,
,
Gabriel Signoretti
2 ,
,
Julio Oliveira
1,
Ivanovitch Silva
1,3,* and
and
Daniel G. Costa
4
1
Postgraduate Program in Electrical and Computer Engineering, Federal University of Rio Grande do Norte, Natal 59078-970, Brazil
2
Department of Computer Engineering and Automation, Federal University of Rio Grande do Norte, Natal 59078-970, Brazil
3
Digital Metropolis Institute, Federal University of Rio Grande do Norte, Natal 59078-970, Brazil
4
Department of Technology, State University of Feira de Santana, Feira de Santana 44036-900, Brazil
*
Authors to whom correspondence should be addressed.
Future Internet 2019, 11(1), 13; https://doi.org/10.3390/fi11010013
Submission received: 13 December 2018
/
Revised: 29 December 2018
/
Accepted: 3 January 2019
/
Published: 8 January 2019
(This article belongs to the Special Issue New Perspectives in Intelligent Transportation Systems and Mobile Communications towards a Smart Cities Context)
Abstract
:Historically, cities follow reactive planning models where managers make decisions as problems occur. On the other hand, the exponential growth of Information and Communication Technologies (ICT) has allowed the connection of a diverse array of sensors, devices, systems, and objects. These objects can then generate data that can be transformed into information and used in a more efficient urban planning paradigm, one that allows decisions to be made before the occurrence of problems and emergencies. Therefore, this article aims to propose a platform capable of estimating the amount of carbon dioxide based on sensor readings in vehicles, indirectly contributing to a more proactive city planning based on the monitoring of vehicular pollution. Crowdsensing techniques and an On-Board Diagnostic (OBD-II) reader are used to extract data from vehicles in real time, which are then stored locally on the devices used to perform data collection. With the performed experiments, it was possible to extract information about the operation of the vehicles and their dynamics when moving in a city, providing valuable information that can support auxiliary tools for the management of urban centers.
1. Introduction
Rampant urbanization coupled with rapid population growth have become major challenges for sustainable development in urban centers. Actually, this complex scenario has fostered research and highlighted the theme of the smart city [1,2,3], reinforced by governmental initiatives and the opening of new commercial opportunities. It is therefore necessary to implement intelligent solutions that facilitate planning and decision-making based on strategic information, so as to provide a more effective response to the dynamics of cities [4].
Actually, the concept of the smart city has been evolving as new paradigms are created, and the last few decades have seen a continuous evolution in this sense. While the Internet rapidly became the main player that put computing in its place of relevance for social and economic transformations, fostering the revolutions of mobile and personal computing, the perception of cities and their digital services has also evolved over time, following this development track. The availability of Internet-based services and the spread use of (personal) computing first allowed the construction of digital cities, providing many services from the “digital world” to the cities’ inhabitants and for improved governance of public services [5]. However, with the development of new information and communication technologies and paradigms, this scope evolved into what we call smart cities, which integrate data from the cyber and the physical spaces for deeper transformations in urban areas [6], gaining great attention in the few last years. The proposed platform was developed for this complex and data-rich environment of smart cities.
Generally speaking, smart cities are formed by combining ubiquitous communications, autonomous management systems, wireless sensor networks installed at points of interest, a robust communication infrastructure, and the integration of various services that make up the core of urban centers (energy, transport, health, etc.) [3,7,8,9]. These systems should be responsible for collecting and integrating a massive amount of data, forming the basis of what is known as the Internet of Things [10]. The analysis of this raw data generates information that can be used in the creation of new applications, offering a range of services that benefit society and the sustainable development of urban centers [11,12,13].
As a result, the design of new ideas and the development of applications for smart cities are not restricted to governments. This reality has fostered the creation of a new business model, in which citizens have the freedom to develop and market their solutions [3,13,14,15]. Although the data collected by government agencies are not open to the public, these extractions can be done in a number of other ways, for example through the concept of crowdsensing [16]. In this approach, the sensors are represented by the people themselves, creating a virtual infrastructure parallel to the existing physical infrastructure. Citizens, through their smartphones, watches, cars, and other gadgets, can share information that will power a larger system [17].
In Brazil, for example, the use of the urban environment in order to generate data open to the population is still taking its initial steps [18,19]. On the other hand, in a number of countries, such as the United States of America, large amounts of data on health, education, and transportation are available to people, allowing such data to be used when developing solutions to problems people face daily in cities [20].
Another point that has contributed to the creation of open databases for cities is the popularization of mobile devices. These devices have great potential for urban crowdsensing, since they are equipped with several sensors capable of collecting data such as temperature, speed, geolocation, and noise, among many others [21]. The expectation is that new sensors will be built into mobile devices in the next few years [22]. This range of possibilities allows the population itself to cooperate in the construction of smart cities. In addition to mobile devices, there are other robust systems that are capable of providing relevant data for creating more sustainable urban environments, and one of them is the automobile.
Currently, automobiles have advanced electronic and computer systems interconnected by a complex communication network. These devices offer the most varied information about the vehicle, such as engine temperature and rotation, mass air flow, and speed, among others [23]. Data captured by the mass air flow sensor can be used to measure the pollution emitted by the vehicle [24], for example. It should be noted that the emission of vehicular gases is one of the largest contributors to air pollution in large urban centers, with pollution indices similar to the industry [25].
Vehicle emissions are generated through the chemical reactions that occur inside the combustion chamber of the engines. These compounds are mainly responsible for the degradation of atmospheric air, which results in a loss of quality of life for all city inhabitants; such pollution can cause, for example, respiratory problems and degradation of city structures. These problems occur mainly in large urban centers, where the number of vehicles is high [26]. The polluting gases generated by vehicles are also responsible for problems of greater magnitude related to climate change [27,28].
As an example, the city of Natal, the capital of the state of Rio Grande do Norte in northeast Brazil, has the following situation in relation to the vehicular fleet: it presents one of the largest fleets in the northeast of the country, with the proportion of approximately two vehicles for every five inhabitants in the city. At a national level, it is the 16th capital with the largest fleet [29]. It is estimated that every year, the number of vehicles is increasing by about 5.5%. Currently, the estimated vehicle fleet is approximately 387,400 vehicles, of which 341,751 are considered light vehicles (gasoline-, alcohol-, or Vehicular Natural Gas (VNG)-powered cars), and only 34,801 are heavy vehicles (diesel-powered cars), according to the State Department of Traffic of Rio Grande do Norte [30] and the National Department of Transit [29].
In this sense, as a consequence of the growing number of vehicles in urban centers, there is also the increase of the air pollution caused by them. In order to corroborate this perspective, a study by the Environmental Protection Agency (EPA) of the United States of America has surprisingly concluded that a passenger vehicle using gasoline as fuel generates an average of four tons of carbon dioxide (CO2) per year [31]. This indicates how alarming the issue of urban vehicular pollution is.
Several countries have projects and goals to reduce vehicle emissions. In Brazil, the Program for the Control of Air Pollution by Automotive Vehicles was created by the National Council for the Environment (CONAMA), composed of: PROCONVE (cars, trucks, buses, and road and agricultural machinery) and PROMOT (motorcycles and similar) [32]. These initiatives defined deadlines, emission limits, and technologies for domestic and imported vehicles, which are important references when planning to reduce air pollution in urban areas. As an example for vehicles with a specific mass of up to 1700 kg, the emission limit is 2 g/km of CO. For vehicles with a mass superior to 1700 kg, the limit is 6.2 g/km [32].
In the last few decades, CO2 was pointed out as one of the main gases responsible for the greenhouse effect, which results in the significant elevation of the temperature of our planet. Among the damages caused to the environment are the acidification of rivers and forests, climatic changes, acid rain, and the melting of the polar caps, together with rising sea levels, thus hindering the life of animals and the development of flora [33]. The effects on human health are mainly caused by the particles of this pollutant suspended in the air. The thicker particles are retained in the nose and throat, causing discomfort, irritation in the eyes and nostrils, and facilitating the installation of diseases in the body, ranging from influenza, allergic rhinitis, allergic bronchitis to dust, and asthma. The finer particles cause damage to the inner part of the respiratory tract, such as the pulmonary alveoli, bronchi, trachea, pharynx, and larynx. In more severe cases, it can even trigger lung cancer [34]. In this context, the need to adopt solutions in urban centers that make cities truly “smart”, as well as helping to combat problems caused by air pollution is clear and urgent [3].
Given all the exposed arguments, it is possible to explore solutions that help to solve the expected problems directly or that provide the capacity to obtain information in order to perform analyses and generate new data that can be useful for the development of urban centers. In this sense, this article proposes a platform capable of processing data obtained from vehicles and estimating the amount of carbon dioxide generated during the combustion reaction in the vehicle’s engine. The data retrieving will be done through an on-board diagnostic reader and using crowdsensing techniques. The cities’ inhabitants will provide data collected from their own vehicles, representing a source of raw data for generic applications. In addition, the platform can be an initiative to improve the management of cities, from a reactive to a proactive perspective, through the identification of areas with the highest amount of CO2 emissions by vehicles.
The remainder of this paper is organized as follows: Section 2 details some of the most relevant research works in the literature. Section 3 describes the proposed platform. In Section 5, we detail the evaluation of our approach. The results were obtained in an evaluation performed in Brazil, as well as with different vehicle manufacturers, as described on Section 6. Finally, Section 7 concludes the paper and recommends directions for future studies.
2. Related Works
Generally speaking, the monitoring of urban pollution from emissions of vehicular pollutants is a complex task. It involves challenges such as capturing vehicle emissions, data transmission through the communication infrastructure of the cities, mass data storage, and the generation and visualization of the processed information. This section presents some works that have addressed control and monitoring of vehicular emissions, as well as applications with virtual sensors, since they contributed to the development of this article.
Regarding emissions control, several measures are being considered in the search for solutions that reduce greenhouse gas emissions. In particular, we can highlight the agreement signed by the United Nations (UN) at the Conference of Parties (COP-21), named the Paris Agreement, where the 195 member countries ratified the need to maintain global warming at sustainable indexes for the planet [35,36]. It is noteworthy that, due to the predominance of motor vehicles in the transport sector, in association with the limited use of emission control technologies, automobiles have become one of the major sources of urban pollution and consequently one of the leading contributors to the greenhouse effect [37,38].
Concerns about vehicular pollution are not recent, and they can be tracked back to the mid-1960s in the United States. At that time, the California Air Resources Management Committee (CARB) created legislation to reduce pollution by motor vehicles. The first results were the implantation of the Positive Crankcase Ventilation (PCV) system, which, in addition to avoiding the waste of fuel, reduced the emission of hydrocarbons in the air [39]. In the 1970s and 1980s, there were also significant improvements such as the insertion of electronic control in the injection and ignition systems and the exhaust gas re-circulation system. These solutions significantly reduced the emission of nitrogen oxides (NOs). These gases are harmful to human health, being responsible for problems in the respiratory system.
The advent of automotive electronic systems occurred during the same period in which CARB and EPA issued resolutions to control emissions. These events led to the creation of a system capable of self-diagnosis and alerting the driver to possible defects in electronic components. This system was named On-Board Diagnostic (OBD) and had its first version launched in 1988, when it became mandatory for all new vehicles that would circulate in the state of California from that year forward [40]. Since 1996, all cars manufactured and sold in the United States are required to have the OBD-II system. The European Union adopted a similar measure in 2003, while Brazil, Russia, and China followed this trend in 2010 [41].
Recently, several papers in the literature have explored the potential of the OBD system to extract data from vehicles and generate useful information that can be used to monitor pollution in smart cities. In [42], the authors conducted a study on the influence of distance traveled and average vehicle speed on fuel consumption. From machine learning techniques, it was possible to predict the fuel consumption for certain stretches to be traveled. The same authors broadened the idea, creating the concept of eco-driving [43]. From the prediction of the fuel consumption and consequently the emission of CO2 (estimated from linear approximations of the fuel consumption), routes between two points are drawn, considering, besides the distance, the pollutants emitted by the vehicles. In both solutions, data collected via OBD-II are stored locally in the vehicle through a Secure Digital (SD) card and processed offline by an application.
Self-diagnostic systems were created with the goal of more effective control of toxic gas emissions and for the detection of electrical, chemical, or mechanical problems in vehicles [40]. Over time, the exploitation of these systems has become more accessible to ordinary users. Extensive documentation on manufacturers’ websites and the provision of vehicle manual details were the main causes of their popularization [44]. It is now possible to find a reasonable number of academic papers and commercial solutions that use the OBD-II self-diagnostic system to create services or devices that benefit the driver [45].
Another interesting work was developed by researchers from the Institute of Electronic Technology of South Korea [46], who investigated the estimation of CO2 issued in the environment by vehicles equipped with the OBD-II interface. That project has some characteristics that are similar to the ones discussed herein; however, there are certain disparities. The first difference is related to the fact that the application of [46] does not monitor real-time emission of CO2. In order to estimate it, they need to drive a few kilometers in a car in order to collect some data through the vehicle interface. Using the measured data, such as the information of the distance covered and the amount of fuel consumed, they are able to measure the average CO2 emissions for that route. The second difference is that the application proposed in this article can communicate with distant servers via the internet, sending real-time information on the measurement of the CO2 emissions by the vehicle.
Vehicular emissions were also investigated in [47]. In order to obtain the desired data about pollution, the authors used a sensor coupled to the exhaust of the vehicle, directly sensing the emission of toxic gases. However, although promising, that approach lacks scalability, and it is hard to deploy in a urban context.
Finally, in Table 1, a comparative summary between the works discussed in this section is presented. It is possible to visualize their main similarities and differences. The “work” column refers to the works shown previously, and the second column presents a summary about the characteristics explored by the authors.
Besides these works, two other works can be highlighted in which the authors made use of virtual sensors to obtain information related to vehicles, showing the potential of this type of tool. The first work was developed by a group from the University of West Virginia. The authors developed a neural network capable of estimating how much nitrogen oxide was generated at the moment of combustion from a diesel engine, using information of the fuel pressure as the input to the neural network [48]. In the end, they could see that, in a comparison between a real sensor and the developed virtual sensor, they obtained similar answers.
The second work, performed by a Brazilian group, showed the development of a virtual sensor used for the estimation of the oil temperature of the car engines [49]. For that, the authors obtained a physical model of the engine lubrication system, along with the existing effects of heat exchanges. At the end of the work, it was shown that the obtained model was feasible to for use as an estimator of the temperature of the engine motor oil in operation.
From the above discussion, it is clear that there are gaps to be solved in this area. Within this context, the platform proposed in this paper should be capable of performing the following tasks:
- Monitoring of the amount of carbon dioxide generated in the combustion;
- Integration of data from various sources;
- Enable statistical inference to be performed from collected data;
- Calculating the level of pollution using methods that rely on indirect sensor data (i.e., using sensors that do not directly calculate the emission of CO2).
3. Platform Architecture
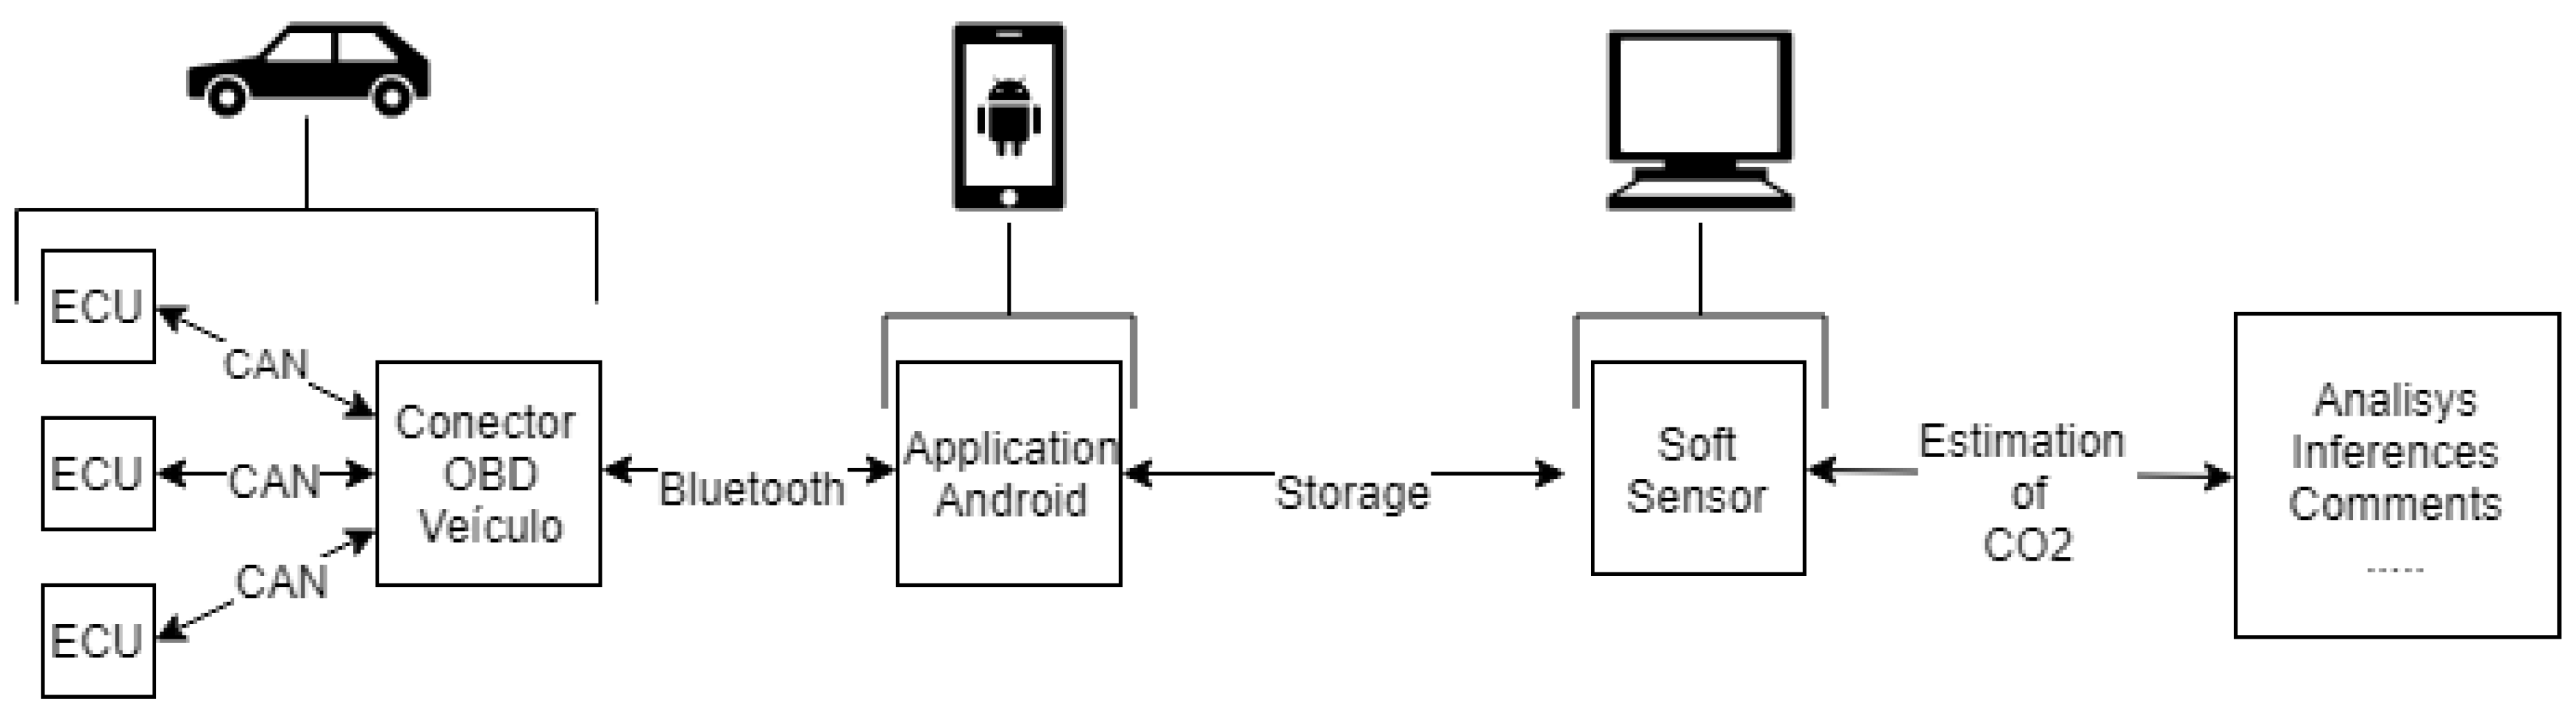
As previously mentioned, cars contribute a large share of air pollution, and this is due to the gases generated from the burning of fossil fuels. In this context, this section presents a novel architecture for monitoring of the amount of CO2 generated by the vehicle’s engines. An overview of the architecture is described in Figure 1.
Through a systemic view, the proposed architecture is divided into three main components: vehicle connection, mobile application, and the soft sensor responsible for the estimation of CO2 emission. With the data collected, it is possible to estimate how much CO2 is being emitted by a vehicle based on the methods that will be presented in Section 4.1. Details about the operation of each of the other components are given in Section 3.1 and Section 3.2.
3.1. Vehicle Connection
In order to enable the collection of the desired data, the monitored vehicle must have an OBD-II communication interface. The mobile application uses this interface to obtain information from the vehicle control units.
There are a number of Bluetooth-, Wi-Fi-, and serial-enabled scanners on the market today, among many others. Considering the cost-benefit ratio, the ELM327 scanner was adopted throughout the development of this project. It has a low cost, implements OBD-II Operating Mode 1, and still features a Bluetooth module, allowing any smartphone application to connect easily to it.
The information needed to calculate vehicle pollution is completely provided by the same Engine Control Unit (ECU). From the information coming from several sensors, we can estimate how much carbon dioxide is generated for a certain amount of fuel that is burned.
3.2. Data Collection
A mobile application installed on a smartphone is used to retrieve the required data. Due to the limitations of the OBD-II scanners, only Versions 2 and 3 of the Bluetooth protocol are supported. For the development of this project, a smartphone with the Android operating system was used. As the communication between the device and the vehicle (ELM327) will be performed via Bluetooth, it is necessary to maintain these elements at a maximum distance between 10 and 15 m in order to avoid any communication failure.
The application for data retrieving was developed with the intention of obtaining as much information as possible from the vehicles, particularly data from the OBD Operation Mode 1. Table 2 presents all operation modes of OBD, as a reference.
An optional implemented feature requires that the smartphone be connected to the Internet so that the data can be sent wirelessly to a remote server, contributing to a database that will store the data collected from each vehicle. For the version considered in this article, the collected data were stored locally on the device, leaving this optional feature for future analyses.
In the diagram shown in Figure 2, the communication processes between the smartphone application and the monitored vehicle are demonstrated.
The general steps of this communication process are defined as follows:
- The application sends a connection request to the ELM327 adapter via Bluetooth. With the communication established, the application can send commands to the OBD-II.
- The application requests some data from the sensors, for example the Mass Air Flow rate (MAF) and Manifold Air Pressure (MAP), to obtain the amount of air entering the engine.
- The application receives the response from the OBD-II, and the platform calculates the CO2 emitted by the vehicle. The details of the methods used for the calculation will be shown in Section 4.1.
In order to obtain the value of CO2 from the methods presented herein, the monitored vehicle must implement the OBD-II commands 0110 (MAF), 010B (MAP), 010F (IAT), and 010C (RPM).
Figure 3 presents a “screenshot” of the operation of the developed application. This application, although still under development, is already at a functional level, and it can show all the readings returned by the OBD-II adapter. In this stage, it can be seen, for example, the fuel type that is being used by the vehicle, as well as its current level, the revolutions per minute, and many other sensor readings. For this article, the relevant values are the Mass Air Flow rate (MAF), Manifold Air Pressure (MAP), and air intake temperature.
It is worth mentioning that some OBD commands, even though being part of the set of standard PIDs, may not be supported by some vehicles. This may be caused by manufacturers using custom codes instead of the default ones.
4. Soft Sensor for Pollution Monitoring
This section describes the soft sensor element of the architecture, detailing the methods used to calculate the CO2 emission estimations, as well as the evaluated sensors.
4.1. CO2 Emission Calculation Methods
In order to achieve better fuel efficiency and to reduce vehicle emissions, the amount of air entering the engine must be calculated correctly. This subsection aims to show some methods that the vehicle’s on-board computers use to determine such an amount of air. This is one of the main procedures used by the urban vehicular pollution monitoring tool developed in this work.
The ECU can control several components that perform the task of defining the amount of air necessary to make the combustion have the highest yield. In addition, the ECU can determine the ideal air temperature and pressure, the current value of the vehicle, and the actual air flow that the engine requires at any given time.
The main methods used to obtain such values are: alpha-N, speed density, and mass air flow, described as follows:
- Alpha-N is a method rarely used today. The Alpha consists of the angle of the throttle position sensor, and N refers to the engine speed in measured Revolutions Per Minute (RPM). The method does not estimate the airflow directly, but instead, it uses a mapping between the Alpha and N to obtain such a value. It can be considered a simple method and was originally developed for engines used in racing [50].
- Speed density: This method performs an estimation of the air mass based on the ideal gas law. To do this, it uses readings of temperature and air pressure sensors in the vehicle, in addition to using the volumetric efficiency of the engine. This method can be used with the MAP sensor, as it measures the absolute pressure.
- Mass air flow: This method directly uses the Mass Air Flow (MAF) sensor present in the vehicles to obtain the reading of air flow. The value obtained is in the unit mass/time.
The methods that were used in this work to obtain the amount of air entering the combustion chamber were the speed density and mass air flow methods. By making a brief comparison between both of them, one can see that the speed density method has a greater mathematical complexity than the mass air flow method. That is because it needs a combination of sensors to calculate the desired estimations indirectly, whereas the mass air flow method directly uses the MAF sensor to do the same. On the other hand, the MAF sensor may not be found in all vehicles.
In order to develop the algorithm needed to calculate the CO2 estimate, the Python programming language was used with the Jupyter Notebook development environment. This tool combines code compilation, Rich Text Format (RTF), mathematical functions, plotting charts, and maps, among other features that facilitate the development of code and data analysis in the same environment.
4.2. Estimation of CO2 Mass Flow
The basic idea behind the method used to obtain the amount of CO2 emitted by the vehicles, which is employed in this work, is the amount of air entering the engine at the moment of combustion. Obtaining this value, we can apply it to the method presented in the next paragraphs.
Initially, we have to understand the concept behind the air-fuel ratio. For a certain amount of fuel, there is an ideal amount of oxygen required for the combustion to be optimal. This factor is called the Air-Fuel Ratio (AFR). For the combustion of gasoline, the proportion considered to be an ideal mix of fuel and oxygen has an AFR of 14.7 to one. That is, it takes 14.7 kg of air for every 1 kg of fuel entering the combustion chamber. In alcohol vehicles, this ratio is nine to one, while in diesel vehicles, it is 14.6 to one.
The AFR can be mathematically described by Equation (1), being only a division between the mass of air and the mass of the fuel in the mix.
We can rewrite Equation (1) as a relation between the air mass flow rate and the fuel mass flow rate, as both values are measured in units of mass over time (g/s). The new formula is shown in Equation (2), where represents the air mass flow rate and represents the fuel mass flow injected in the engine.
The OBD-II standard establishes codes to obtain the mass air flow directly, or, in case the vehicle does not have an MAF sensor, it also gives access to other sensors that can be used to obtain such a value. However, it does not provide a method to directly obtain the amount of fuel injected in the combustion chamber, which would be ideal for this study. Considering that the AFR is a known value and that it is possible to extract the MAF through the OBD-II, the mass of fuel can be found by reordering Equation (2) as presented in Equation (3). As stated earlier, the unit of measure of both air and fuel flow rates is g/s, and the value of AFR is a constant.
The main fuels used in vehicles today are gasoline, diesel, and ethanol. Table 3 shows the amount of carbon dioxide generated by the combustion of one liter of each fuel, the AFR constant for the fuel mix, and the density of the fuel itself, according to [51,52,53].
The term in Equations (2) and (3) represents the fuel mass flow rate, but we need the fuel volume flow rate (represented in units of volume over time) to find the relation between the volume of fuel and the mass of CO2 generated. To get this value, we need to divide the fuel mass flow rate by the respective fuel density (shown in Table 3), as described in Equation (4).
As stated previously, the mass of emitted CO2 is closely linked to the volume of fuel burned. This relationship is expressed in the Equation (5), where the fuel volume flow rate is multiplied by the mass of CO2 generated by the combustion of one liter of fuel (constant shown in Table 3). The result of this equation is the estimate of the CO2 mass flow rate emitted per second.
4.3. Mass Air Flow
In Section 4.2, the method used to estimate the amount of CO2 was described, and it was found that it was necessary to know the amount of air entering the engine at the moment of combustion to perform the desired calculations. One way to find this value is via the MAF sensor.
The MAF sensor is able to convert the amount of air entering the motor to a voltage level. This information is useful for maintaining the stoichiometric relationship between the amount of air and fuel in the mixture. This sensor is normally located directly in the vehicle air intake, and the two main types of MAF sensor currently used are the hot wire and vane.
The hot wire-type sensor is composed of a wire that is heated by an electric circuit. The purpose of this type of sensor is to keep the wire temperature constant. As the air passes through the sensor, the airflow increases and lowers the wire temperature. This effect triggers an increasing of the electric current to reheat the wire, and due to this current variation, the ECU can determine how much air is entering the combustion chamber, adjusting the amount of fuel in the mixture [54].
The vane-type sensor is older than the hot wire, relying on mechanical and electrical parts. This sensor consists of a flap that partially blocks the air intake of the vehicle. The flap is attached to a potentiometer (adjustable resistance) that changes position as the air flows through the intake, varying the resistance, which, in turn, generates a variation of voltage. Similar to the hot wire sensor, the voltage variation is interpreted by the ECU to determine how much air is entering the combustion, thus adjusting the amount of fuel in the mixture [54].
For vehicles that have this sensor, it is possible to obtain the MAF value via OBD-II, and it can be used directly in the estimation methodology presented in Section 4.2, obtaining the mass of CO2 generated during the combustion.
4.4. Speed Density
The second estimation method used in this work can be considered more complex than the previous one. It is performed on the basis of the ideal gas law, also called the ideal gas equation (perfect gas). In this law of physics, we observe a series of relations between the temperature, pressure, and volume of the gas. First enunciated by Emile Clapeyron in 1834, Equation (7) is the mathematical representation of this law.
The terms of Equation (7) are explained as follows:
- P represents the pressure in the combustion chamber and can be obtained by means of the MAP (Manifold Absolute Pressure) sensor in KPa.
- V is the volume of the combustion chambers in the engine cylinders and can be measured in units of volume as Liters (L) or cubic centimeters (cm).
- R is the ideal gas constant. Its value is approximately 8.3145 .
- T is the gas temperature. It can be obtained by the IAT (Intake Absolute Temperature) sensor in K.
- n is the umber of moles in the sample.
The idea behind the speed density method is to find the amount of moles (n) of a given amount of air flowing through the air intake before the combustion. Equation (8) shows how this value can be found rearranging the terms in Equation (7).
Knowing that the n represents the number of mols in the sample, we can find the mass of air (mair) by multiplying it by the molecular weight (molar mass, represented by Mair) of the air, as described in Equation (9).
From Equation (9), one can isolate n and obtain the number of moles as a ratio of the air mass and its molar mass. This value can be substituted in Equation (8) in order to obtain Equation (10).
Finally, the air mass can be obtained by reordering the terms in Equation (10) in the form shown in Equation (11), which will serve as basis for the formula derived later in this subsection to estimate the amount of CO2.
However, Equation (11) is only valid if the engine has a Volumetric Efficiency (VE) of . VE is the ratio between the air-fuel mixture volume that each cylinder admits and the nominal cylinder capacity. For example, in a four-cylinder engine, each cylinder has a nominal volumetric capacity of 500 cm, but due to inlet losses, the cylinder only admits around 400 cm. In that case, the engine has a volumetric efficiency of . The VE can be found using the following relation:
where:
- represents the real volume of intake air supported by the cylinders.
- is the theoretical volume of the engine.
Therefore, we must take into account the volumetric efficiency of the engine together with its volume, so Equation (11) becomes Equation (13).
Thus, using Equation (13) coupled with the engine Revolutions Per Minute (RPM), we can finally obtain the mass of air flowing through the intake at any given time. To accomplish that, one must find out how many RPM the engine is working, a value that can be obtained via OBD-II.
During the vehicle operation, considering a four-stroke engine, there are two steps of air intake, i.e., in a complete cycle, air flows inside the engine twice. With that information, we can calculate the number of times air enters the engine per second by dividing the RPM by . Incorporating this into (13) gives us the mass air flow (), shown by (14).
The value obtained by this equation corresponds to an equivalent to that obtained directly by the MAF sensor in Section 4.3. That being the case, it is possible to replace the equivalent term in Equation (6) to obtain the mass of carbon dioxide emitted by the car at each second.
As stated earlier, the values of temperature, pressure, and RPM are obtained by the sensors via OBD-II; the volume is calculated according to the displacements of the vehicle cylinders; and the EV can be assumed as a constant value, for example, considering that the engine is working at 80% of its efficiency.
5. Evaluation Fundamentals
The main goal of this article is to describe the development of a platform capable of processing data collected from vehicles, exploiting the crowdsensing paradigm and also readings from the OBD-II interface in vehicles. Moreover, the provided data are used to estimate the amount of carbon dioxide generated during the combustion process in the considered vehicles, providing a low-cost and potentially extensive map about the main source of pollution in urban areas.
There are some important remarks and considerations about the evaluation of this platform, which have to be properly stated. This section then describes the evaluation fundamentals of our approach, with the focus on the experiments’ definitions and planning.
5.1. Research Questions
The developed platform and performed evaluation were guided by the answer of two specific research questions, described as follows:
- (a)
- What are the sensors supported by each vehicle? Although there is standardization of the OBD-II interface and related protocols, different vehicles models and brands may implement different sensors. This may be a problem for a generic and flexible platform. Therefore, in the evaluation performed: we wanted to check such expected differences.
- (b)
- What is the amount of CO2 emitted by the vehicles? This is in fact the motivation for this work, since there should be a low-cost and trustworthy way to measure the pollution in urban areas, and cars’ emissions are the main source of pollution in modern cities. The evaluation will also be performed aiming to have information about it.
Answering these questions, some smart-city initiatives may be designed based on the developed platform, in a more confident way. Such initiatives may not only be related to the exhibition of pollution data, but also considering the platform as a provider of input information for any system or tool that exploits such data in different ways (e.g., inferring traffic conditions or planning areas with better air quality to deploy bike tracks).
5.2. Experiments Samples
The evaluation of the platform was performed targeting vehicles manufactured in Brazil since 2010, as it was the year when the implementation of the OBD-II system on vehicles began to be mandatory in the country. This was the only restriction considering the experiment set.
The experiments were performed during a period of time (described in Section 6) and for a group of volunteers. Actually, the age and gender of the volunteers were not a decision parameter, and any driver wishing to participate was assumed as a valid volunteer. All participating drivers were briefly instructed about the project, and all configurations and installations of the OBD-II reader and the developed smartphone app were performed by one of the authors.
The selected sample was based on the convenience and availability of the drivers. Overall, they were distinct vehicles, as described in Table 4 (“flexible” vehicle can be fueled with any mixture of gasoline and alcohol).
5.3. Instrumentation
The instrumentation process was done initially with the configuration of the environment for the experiments and also the planning of the data collection procedure. This was held with the installation of the developed application in the considered smartphones.
The following resource considerations apply:
- (a)
- Connecting the OBD-II: connecting the OBD-II adapter to the vehicle port and, later on, to the smartphone via Bluetooth. The process was described in Section 3.1.
- (b)
- Mobile application tool setting with OBD-II: as is shown in the Figure 2. The application requests the data from the sensors.
- (c)
- Data: The application receives the data from the sensors and calculates the amount of CO2 emitted.
6. Results and Discussions
6.1. What Are the Sensors Supported by Each Vehicle?
The first analysis was to evaluate the practical feasibility regarding the extraction of data from the vehicular sensors. It is known that the OBD-II has access to six groups of variables (control, motor, fuel, pressure, temperature, and others), in order to guarantee the analysis of vehicle components (sensors), but not all vehicles support all sensors. The objective of these tests was then to verify the availability of the MAF and MAP sensors in the sample. Thus, for the vehicles in the defined sample set, the available sensors are shown in Table 5.
In Table 5, it can be observed that most of the considered vehicles had the MAP sensor. On the other hand, for the sample studied, the MAF sensor was in a minority of cars, and none of them had both of the sensors. Some factors that may influence this result is the vehicle manufacturing year or even the optional items that the driver may have opted to include or not in the act of purchasing.
After the verification of the practical feasibility regarding the available sensors in the vehicle sample set, we can start to answer Question 2.
6.2. What Is the Amount of CO2 Emitted by the Vehicles?
For the considered sample set, what is the amount of CO2 emitted by the vehicles? It has been found that it is possible to identify real situations in which several different vehicles travel daily, and each one contributes to a portion of the amount of emitted CO2. The vehicles shown in Table 6 have traveled routes with varying times and distances, emitting almost 5 kg of carbon dioxide in total. It is noted that the Toyota Corolla was responsible for almost half of the total amount of CO2 emitted during the test. This may be indicative of some potential electric or mechanical problem in the vehicle engine or even show that a low-quality fuel was used.
Having obtained the values of the amount of CO2 generated by the engines, it is possible to carry out various analyses and obtain new result, therefore providing information for the generation of new solutions.
Table 7 presents results obtained by the MAF method, for the particular case of the Toyota Etios 2015 using gasoline as fuel. For this test, data collection was performed on three different days, with similar schedules, early in the morning. After this test, the combined emission was greater than half a kilogram of CO2.
By mapping the emissions, we can get a better idea of what happened and open the possibility of new information generating better insights and analysis. In Figure 4, we can see the route traveled by one of the vehicles on a given day (17 May), already presented briefly in Table 7. The colors closest to red represent places with the highest emission rates, while the tones nearest to green are the areas with the lowest amount of emissions. In the map, the blue marker represents the starting point of the route, while the green marker indicates its end. In this scenario, the defined route was in the daily routine of the driver.
Note that the use of Python libraries, for example folium, allowed us to create simple maps to perform a better analysis of the data obtained.
Analyzing Figure 4, we can see that the places with the highest incidence can be identified as intersections and places where the vehicle remained stopped for some time due to traffic lights and slow traffic flow. In stretches where a more fluid flow occurred, as seen near the blue marker, we notice that the amount of CO2 emitted decreased relative to other points on the same path.
We must take into account that the methods presented provide us with estimates of CO2 emission generated by the engine at the time of combustion and that the actual value released to the atmosphere is greater than this estimated value. This happens because, before reaching the external ecosystem, the pollutant gases pass through the catalytic converter that is responsible for treating the gases and transforming them into gases less harmful to our health, and these are released into the environment [55].
Generally, the catalyst converts the highly toxic carbon monoxide into carbon dioxide, which only affects us in a large quantity, resulting in more CO2 emission by the vehicle. Even so, the actual places with the highest incidence of CO2 emitted into the atmosphere will be the locations where the estimate of the levels of CO2 generated by the engine are also higher.
With this in mind, some interesting points can be listed about the results presented in Figure 4, especially in relation to the areas of higher incidence.
- During times of departure, parking, or when stopped at traffic lights, the vehicle had increased emission readings.
- Intermediate locations of the routes due to traffic jams or the presence of heavier traffic had high emissions.
- Moments in which the vehicle had reduced speed to approach crossings and speed bumps also caused the increase of the emission of the gases.
6.3. Threats to Validity
The threats to validity for the present study were:
- Routes, conclusion validity: Only the Toyota Etios has been evaluated in a sequence of days, something that can be accomplished for the other vehicles.
- Appropriate instrumentation, internal validity: Vehicles were evaluated with different fuels, since it was not intended to make a comparison between them.
- Representative population, external validity: The variety of vehicles composing the sample was significant for the research purposes; however, there are vehicle models that have not been evaluated.
7. Conclusions and Future Works
Pollution of the atmosphere is a problem both for the environment and for the health of living things. In view of this, it can be considered that the monitoring and efficient management of polluted areas in an urban environment are eminent requirements for the development of so-called smart cities, where vehicles represent one of the main polluting sources.
The present work had the objective to present methods to estimate the quantity of carbon dioxide emitted by vehicles, referring to the value generated during the moment of combustion in the vehicle’s engine. From these values, we could present analyses and estimates that are beneficial when planing and managing modern cities.
The use of the two defined methods, namely “mass air flow” and “speed density”, allows access to a larger number of vehicles to perform data collection, since it is common for vehicles to have only one of these two sensors. With the values of the quantities of CO2, we can obtain new results, such as the ones shown in Figure 4, which represent the emission mapping generated during a vehicle route. It shows that it is actually possible to explore the data collected from vehicles to aid in the creation of new solutions and tools. Such items can facilitate the sustainable development of urban centers and thus improve the quality of life for all.
The results also showed that the developed solution can also be useful for traffic control systems in cities, since areas with a higher concentration of pollution usually comprise crossings, traffic lights, and congested regions (at specific times). In fact, regions with higher pollution rates may also indicate a higher concentration of cars or even that cars are moving slower (and potentially polluting more). Although crowdsensing for traffic monitoring is not a novelty and popular application tools such as Google Maps and Waze already perform such a service, they do not provide pollution information, and also, their data are not public and auditable. Then, the developed platform could also be used as a bases for an integrated and more comprehensive solution for traffic control and management, when additional information is also monitored from the vehicles.
Another potential use of the platform is related to the maintenance of vehicles. The amount of CO2 emitted is directly linked to the combustion efficiency of the engine, i.e., if a vehicle releases very high amounts, it may be an indication that the vehicle has an electrical or mechanical problem, or even be indicative of the quality of the fuel used. It is also important to realize that some difficulties were encountered during the development of the platform, such as the ones met during the evaluation period of the application. Since it is not a controlled environment (as in a simulator), the connection is prone to errors that must be treated. This problem was solved by carrying out a pilot study with two cars, mitigating the errors. Another highlight is in relation to the number of vehicles evaluated, in addition to a single route analyzed.
Finally, a number of proposals for future works can be envisioned. Initially, as mentioned before, the use of the platform as a supportive tool for other smart-city applications can be considered as a worthy research and development line. Moreover, the study and development of a strategy for calculating fuel content in flex-fuel vehicles are also expected with the aim of making emission calculations more precise, in the case of vehicles using combined fuels. Finally, the verification of the operation of the tool with other classes and models of cars should also be performed.
Author Contributions
Authors contributed equally to the development of this work, in different perspectives. All authors participated in the performed reviews of the literature, providing feedback for the brainstorm phases. The development of the modules was mostly conducted by M.S., G.S. and J.O.; I.S. and D.G.C. managed the discussions, the project development and the manuscript writing. The original manuscript was written by M.S., I.S. and D.G.C. All authors contributed to the revisions of the article.
Funding
This study was financed in part by the Coordenação de Aperfeiçoamento de Pessoal de Nível Superior-Brasil (CAPES)-Finance Code 001, from the Federal University of Rio Grande do Norte (UFRN), through the Instituto Metrópole Digital (IMD), and from the Graduate Program in Electrical and Computer Engineering (PPgEEC).
Conflicts of Interest
The authors declare no conflict of interest.
Abbreviations
The following abbreviations are used in this manuscript:
| AFR | Air-Fuel Ratio |
| CAN | Controller Area Network |
| CARB | California Air Resources Management Committee |
| ECU | Engine Control Unit |
| EPA | Environmental Protection Agency |
| ICT | Information and Communication Technologies |
| MAF | Mass Air Flow Rate |
| MAP | Manifold Air Pressure |
| OBD-II | On-Board Diagnostics |
| PCV | Positive Crankcase Ventilation |
| RPM | Revolutions Per Minute |
| RTF | Rich Text Format |
| SD | Secure Digital |
| UN | United Nations |
| VNG | Vehicular Natural Gas |
| VE | Volumetric Efficiency |
References
- Zanella, A.; Bui, N.; Castellani, A.; Vangelista, L.; Zorzi, M. Internet of Things for smart cities. IEEE Internet Things J. 2014, 1, 22–32. [Google Scholar] [CrossRef]
- Costa, D.G.; Collotta, M.; Pau, G.; Duran-Faundez, C. A Fuzzy-Based Approach for Sensing, Coding and Transmission Configuration of Visual Sensors in smart city Applications. Sensors 2017, 17, 93. [Google Scholar] [CrossRef] [PubMed]
- Komninos, N.; Kakderi, C.; Panori, A.; Tsarchopoulos, P. smart city Planning from an Evolutionary Perspective. J. Urban Technol. 2018. [Google Scholar] [CrossRef]
- Bonino, D.; Alizo, M.T.D.; Alapetite, A.; Gilbert, T.; Axling, M.; Udsen, H.; Soto, J.A.C.; Spirito, M. ALMANAC: Internet of Things for smart cities. In Proceedings of the 2015 3rd International Conference on Future Internet of Things and Cloud, Rome, Italy, 24–26 August 2015; pp. 309–316. [Google Scholar]
- Ergazakis, E.; Ergazakis, K.; Askounis, D.; Charalabidis, Y. Digital Cities: Towards an integrated decision support methodology. Telemat. Inf. 2011, 28, 148–162. [Google Scholar] [CrossRef]
- Ishida, T. Digital City, smart city and Beyond. In Proceedings of the 26th International Conference on World Wide Web Companion, Perth, Australia, 3–7 April 2017; pp. 1151–1152. [Google Scholar]
- Soheily-Khah, S.; Douzal-Chouakria, A.; Gaussier, E. Generalized k-means-based clustering for temporal data under weighted and kernel time warp. Pattern Recognit. Lett. 2016, 75, 63–69. [Google Scholar] [CrossRef]
- Costa, D.G.; Duran-Faundez, C.; Andrade, D.C.; Rocha-Junior, J.B.; Just Peixoto, J.P. TwitterSensing: An Event-Based Approach for Wireless Sensor Networks Optimization Exploiting Social Media in smart city Applications. Sensors 2018, 18, 1080. [Google Scholar] [CrossRef]
- Peixoto, J.; Costa, D.G. Wireless visual sensor networks for smart city applications: A relevance-based approach for multiple sinks mobility. Future Gener. Comput. Syst. 2017, 76, 51–62. [Google Scholar] [CrossRef]
- Al-Fuqaha, A.; Guizani, M.; Mohammadi, M.; Aledhari, M.; Ayyash, M. Internet of Things: A Survey on Enabling Technologies, Protocols, and Applications. IEEE Commun. Surv. Tutor. 2015, 17, 2347–2376. [Google Scholar] [CrossRef]
- Stankovic, J.A. Research Directions for the Internet of Things. IEEE Internet Things J. 2014, 1, 3–9. [Google Scholar] [CrossRef]
- Monzon, A. smart cities concept and challenges: Bases for the assessment of smart city projects. In Proceedings of the 2015 International Conference on smart cities and Green ICT Systems (SMARTGREENS), Lisbon, Portugal, 20–22 May 2015; pp. 1–11. [Google Scholar]
- Schaffers, H.; Komninos, N.; Pallot, M.; Trousse, B.; Nilsson, M.; Oliveira, A. smart cities and the Future Internet: Towards Cooperation Frameworks for Open Innovation. In Proceedings of the Future Internet Assembly (FIA 2011), Budapest, Hungary, 17–19 May 2011. [Google Scholar]
- Ojo, A.K.; Curry, E.; Zeleti, F.A. A Tale of Open Data Innovations in Five smart cities. In Proceedings of the 48th Hawaii International Conference on System Sciences (HICSS 2015), Kauai, HI, USA, 5–8 January 2015; pp. 2326–2335. [Google Scholar]
- Costa, D.G.; Duran-Faundez, C. Open-Source Electronics Platforms as Enabling Technologies for Smart Cities: Recent Developments and Perspectives. Electronics 2018, 7, 404. [Google Scholar] [CrossRef]
- Bellavista, P.; Cardone, G.; Corradi, A.; Foschini, L.; Ianniello, R. Crowdsensing in smart cities: Technical Challenges, Open Issues, and Emerging Solution Guidelines. IGI Glob. 2015. [Google Scholar] [CrossRef]
- Newman, R.; Chang, V.; Walters, R.J.; Wills, G.B. Web 2.0 The past and the future. Int. J. Inf. Manag. 2016, 36, 591–598. [Google Scholar] [CrossRef]
- Breitman, K.; Salas, P.; Casanova, M.A.; Saraiva, D.; Gama, V.; Viterbo, J.; Magalhaes, R.P.; Franzosi, E.; Chaves, M. Open Government Data in Brazil. IEEE Intell. Syst. 2012, 27, 45–49. [Google Scholar] [CrossRef]
- Dos Santos Brito, K.; da Silva Costa, M.A.; Garcia, V.C.; de Lemos Meira, S.R. Is Brazilian Open Government Data Actually Open Data?: An Analysis of the Current Scenario. Int. J. E-Plan. Res. 2015, 4, 57–73. [Google Scholar]
- Ota, M.; Vo, H.; Silva, C.; Freire, J. A scalable approach for data-driven taxi ride-sharing simulation. In Proceedings of the 2015 IEEE International Conference on Big Data (Big Data), Santa Clara, CA, USA, 29 Octorber–1 November 2015; pp. 888–897. [Google Scholar]
- Wac, K.; Cummings, M.; Dey, J. E2eUberIM: End-to-end service management framework for anything-as-a-service. IEEE Commun. Mag. 2016, 54, 54–60. [Google Scholar] [CrossRef]
- Zhang, B.; Ren, K.; Xing, G.; Fu, X.; Wang, C. SBVLC: Secure Barcode-Based Visible Light Communication for Smartphones. IEEE Trans. Mob. Comput. 2016, 15, 432–446. [Google Scholar] [CrossRef]
- Silva, M.; Vieira, E.; Signoretti, G.; Silva, I.; Silva, D.; Ferrari, P. A Customer Feedback Platform for Vehicle Manufacturing Compliant with Industry 4.0 Vision. Sensors 2018, 18, 3298. [Google Scholar] [CrossRef] [PubMed]
- Bonola, M.; Bracciale, L.; Loreti, P.; Amici, R.; Rabuffi, A.; Bianchi, G. Opportunistic communication in smart city: Experimental insight with small-scale taxi fleets as data carriers. Ad Hoc Netw. 2016, 43, 43–55. [Google Scholar] [CrossRef]
- Brienza, S.; Galli, A.; Anastasi, G.; Bruschi, P. A Low-Cost Sensing System for Cooperative Air Quality Monitoring in Urban Areas. Sensors 2015, 15, 12242. [Google Scholar] [CrossRef] [PubMed]
- De Vasconcellos, E. Transporte Urbano nos Países em Desenvolvimento: Reflexões e Propostas; Annablume: São Paulo, Brazil, 2000. [Google Scholar]
- Gurjar, B.; Jain, A.; Sharma, A.; Agarwal, A.; Gupta, P.; Nagpure, A.; Lelieveld, J. Human health risks in megacities due to air pollution. Atmos. Environ. 2010, 44, 4606–4613. [Google Scholar] [CrossRef]
- Caserini, S.; Pastorello, C.; Gaifami, P.; Ntziachristos, L. Impact of the dropping activity with vehicle age on air pollutant emissions. Atmos. Pollut. Res. 2013, 4, 282–289. [Google Scholar] [CrossRef] [Green Version]
- DENATRAN. Available online: http://www.denatran.gov.br/index.php/estatistica/610-frota-2017 (accessed on 1 June 2017).
- DETRAN. Available online: http://www2.detran.rn.gov.br/externo/est_Tipo.asp (accessed on 1 June 2017).
- EPA. Average Annual Emissions and Fuel Consumption for Gasoline-Fueled Passenger Cars and Light Trucks; Office of Transportation and Air Quality: Ann Arbor, MI, USA, 2008; pp. 2–5.
- IBAMA–Veículos Automotores. Available online: http://www.ibama.gov.br/emissoes/veiculos-automotores?view=default (accessed on 20 May 2017).
- Mábia, M.M.D.S.; Lays, X.D.S.; Milleny, A.S.; Thainá, G.D.; Ana, C.A.D.O. Efeitos do Dióxido de Carbono na Saúde e no Meio Ambiente. Available online: http://www.faculdadealfredonasser.edu.br/files/Pesquisar5/21-11-2016-21.34.56.pdf (accessed on 19 November 2018).
- Rice, S.A.; Associates, I. Human Health Risk Assessment of CO2: Survivors of Acute High-Level Exposure and Populations Sensitive to Prolonges Low-Level Exposure. In Proceedings of the 3rd Annual Conference on Carbon and Sequestration, Alexandria, VA, USA, 3–6 May 2004. [Google Scholar]
- Maroto-Valer, M.M. COP-21 and CCS: A tale of two cities. Greenh. Gases Sci. Technol. 2016, 6, 161–162. [Google Scholar] [CrossRef]
- Morgan, J. Paris COP 21: Power that Speaks the Truth? Globalizations 2016, 13, 943–951. [Google Scholar] [CrossRef]
- Han, K.; Liu, H.; Gayah, V.V.; Friesz, T.L.; Yao, T. A robust optimization approach for dynamic traffic signal control with emission considerations. Transp. Res. Part C Emerg. Technol. 2015, 70, 3–26. [Google Scholar] [CrossRef]
- Wu, X.; Wu, Y.; Zhang, S.; Liu, H.; Fu, L.; Hao, J. Assessment of vehicle emission programs in China during 1998–2013: Achievement, challenges and implications. Environ. Pollut. 2016, 214, 556–567. [Google Scholar] [CrossRef] [PubMed]
- Faiz, A.; Weaver, C.S.; Walsh, M.P. Air pollution from motor vehicles: Standards and technologies for controlling emissions. World Bank 1996. [Google Scholar] [CrossRef]
- Hernandez-Alcantara, D.; Tudon-Martinez, J.C.; Amesquita, L.; Vivas-Lopez, C.A.; Morales-Menendez, R. Modeling, diagnosis and estimation of actuator faults in vehicle suspensions. Control Eng. Pract. 2016, 49, 173–186. [Google Scholar] [CrossRef]
- Ferris, D.H. Global OBD Legislation Update (Worldwide Requirements). Available online: http://www.sae.org/events/training/symposia/obd/presentations/2009/d1daveferris.pdf (accessed on 8 April 2017).
- Zeng, W.; Miwa, T.; Moriwaka, T. Exploring Trip Fuel Consumption by Machine Learning from GPS and CAN Bus Data. J. East. Asia Soc. Transp. Stud. 2015, 11, 906–921. [Google Scholar]
- Zeng, W.; Miwa, T.; Morikawa, T. Prediction of vehicle CO2 emission and its application to eco-routing navigation. Transp. Res. Part C Emerg. Technol. 2016, 68, 194–214. [Google Scholar] [CrossRef]
- AbuAli, N. Advanced vehicular sensing of road artifacts and driver behavior. In Proceedings of the 2015 IEEE Symposium on Computers and Communication (ISCC), Larnaca, Cyprus, 6–9 July 2015; pp. 45–49. [Google Scholar]
- Taha, A.E.M.; Nasser, N. Utilizing CAN-Bus and smartphones to enforce safe and responsible driving. In Proceedings of the 22015 IEEE Symposium on Computers and Communication (ISCC), Larnaca, Cyprus, 6–9 July 2015; pp. 111–115. [Google Scholar]
- Jung, K.K.; Choi, W.S. Estimation of Vehicle’s CO2 Emission using OBD-II Interface. J. Korea Soc. Comput. Inf. 2011, 16, 167–174. [Google Scholar] [CrossRef]
- Manzoli, A. Analise das Emissoes Veiculares em Trajetos Urbanos Curtos com Localização por gps. Ph.D. Thesis, Universidade de São Paulo, São Paulo, Brazil, 2009. [Google Scholar]
- Traver, M.L.; Atkinson, C.M. A Neural Network-Based Virtual NOX Sensor for Diesel Engines; West Virginia University: Morgantown, WV, USA, 2000. [Google Scholar]
- Guilherme, R.T.G. Sensor Virtual Para Estimação de Temperatura do Óleo em Motores de Combustão Interna de Automóveis. Master’s Thesis, Universidade de São Paulo, São Paulo, Brazil, 2016. [Google Scholar]
- Stroes, G. Alpha-N Explanation. Available online: http://www.bayareamotorsport.com/alphan.html (accessed on 15 March 2017).
- Hill, N.; Walker, H.; Choudrie, S.; James, K. Guidelines to Defra/DECC’s GHG Conversion Factors for Company Reporting: Methodology Paper for Emission Factors; Department for Environment, Food and Rural Affairs (Defra): London, UK, 2012.
- IEEP. Subsidy Level Indicators for the Case Studies. Available online: http://ec.europa.eu/environment/enveco/taxation/pdf/Annex%205%20-%20Calculations%20from%20the%20case%20studies.pdf (accessed on 19 November 2018).
- InnovateMotors. Digital Air/Fuel Ratio (Lambda) Meter. Available online: https://www.innovatemotorsports.com/support/manual/LM1_Manual.pdf (accessed on 19 November 2018).
- Bell, A. Four-Stroke Performance Tuning, 2nd ed.; Haynes Publishing: Sparkford, UK, 1998. [Google Scholar]
- McCartney, K.S. Catalytic Converter Theory, Operation and Testing. Available online: http://www.bearriverconverters.com/data/CatOpp.pdf (accessed on 11 October 2017).
Figure 1.
Architecture overview.

Figure 2.
System communication flow.

Figure 3.
Example of the developed application presenting some retrieved information.

Figure 4.
Toyota Etios route pollutant emission heat map.


Table 1.
Summary of related works.
| Work | OBD-II |
| 1. [42] | Not used, readings were performed directly from CAN instead |
| 2. [43] | It was used to perform the vehicle sensor readings |
| 3. [46] | It was used to perform the vehicle sensor readings |
| 4. [47] | Not used. Instead, they used a sensor coupled to the exhaust |
| Work | Real Time |
| 1. [42] | Does not work in real time. The authors performed the estimation after a collection period |
| 2. [43] | Does not work in real time, and the data were processed offline |
| 3. [46] | Works in real time. The CO2 amount was estimated as the data were collected |
| 4. [47] | Does not work in real time, and the data were processed offline |
| Work | Data Storage |
| 1. [42] | Data stored on a local server |
| 2. [43] | Data collected on an SD card and stored on a local server |
| 3. [46] | Stored directly on a computer that was inside the vehicle and connected to the output of the OBD-II adapter |
| 4. [47] | Stored directly on a computer that was inside the vehicle and connected to the sensor output |
| Work | Observed Sensors |
| 1. [42] | Fuel level and RPM |
| 2. [43] | Fuel level, MAF, speed, acceleration, and throttle position |
| 3. [46] | MAF |
| 4. [47] | Gas analyzer |
Table 2.
Operation modes supported by OBD-II.
| Mode | Description |
|---|---|
| 01 | Return the real-time ECU data. |
| 02 | Request the ECU data corresponding to the last failure. |
| 03 | Display the error codes stored in the vehicle. |
| 04 | Clear the stored error codes. |
| 05 | Return the test results of O2 sensors present on the vehicle. |
| 06 | Return the test results related to non-continuous monitoring. |
| 07 | Return test results related to continuous monitoring. |
| 08 | Require the control of the on-board systems. |
| 09 | Get vehicle information. |
| 10 | Displays the error codes with permanent status. |
Table 3.
Fuel conversion factors.
| Fuel | CO2 Per Liter | AFR | Density () |
|---|---|---|---|
| Gasoline | 2310 g/L | 14.7:1 | 737 g/L |
| Diesel | 2660 g/L | 14.6:1 | 850 g/L |
| Ethanol | 1510 g/L | 9.0:1 | 789 g/L |
Table 4.
Selected sample.
| Model | Year | Motor | Transmission | Fuel |
|---|---|---|---|---|
| Volkswagen Voyage | 2013 | 1.6 | Manual | flexible |
| Ford Ecosport | 2011 | 1.6 | Manual | flexible |
| Fiat Palio | 2012 | 1.0 | Manual | flexible |
| Peugeot 208 Allure | 2016 | 1.6 | Automatic | flexible |
| Honda Fit | 2005 | 1.4 | Manual | flexible |
| Toyota Etios | 2016 | 1.5 | Automatic | flexible |
| Toyota Corolla | 2010 | 1.8 | Automatic | flexible |
| Nissan Versa | 2016 | 1.6 | Manual | flexible |
Table 5.
Vehicle sensors.
| Model | Fuel | Sensor |
|---|---|---|
| Volkswagen Voyage | Gasoline | MAP |
| Ford Ecosport | Gasoline | MAP |
| Fiat Pálio | Alcohol | MAP |
| Peugeot 208 Alure | Alcohol | MAP |
| Honda Fit | Gasoline | MAP |
| Toyota Etios | Gasoline | MAF |
| Toyota Corolla | Gasoline | MAF |
| Nissan Versa | Gasoline | MAF |
Table 6.
Summary of data collected from all considered vehicles.
| Model | Sensor | Samples | CO2 |
|---|---|---|---|
| Volkswagen Voyage | MAP | 93 | 122.87 g |
| Ford Ecosport | MAP | 137 | 197.33 g |
| Fiat Palio | MAP | 379 | 483.37 g |
| Peugeot 208 Allure | MAP | 179 | 283.71 g |
| Honda Fit | MAP | 617 | 521.83 g |
| Toyota Etios | MAF | 303 | 325.05 g |
| Toyota Corolla | MAF | 691 | 2185.45 g |
| Nissan Versa | MAF | 169 | 269.80 g |
| Total | 2777 | 4874.75 g |
Table 7.
Summary of data collected from a Toyota Etios 2015.
| Timetable | Duration | Samples | CO2 |
|---|---|---|---|
| 17 May | 19 min | 294 | 251.37 g |
| 19 May | 19 min | 288 | 245.68 g |
| 23 May | 18 min | 271 | 236.28 g |
| Total | 56 min | 853 | 733.33 g |
© 2019 by the authors. Licensee MDPI, Basel, Switzerland. This article is an open access article distributed under the terms and conditions of the Creative Commons Attribution (CC BY) license (http://creativecommons.org/licenses/by/4.0/).
Share and Cite
MDPI and ACS Style
Silva, M.; Signoretti, G.; Oliveira, J.; Silva, I.; Costa, D.G. A Crowdsensing Platform for Monitoring of Vehicular Emissions: A Smart City Perspective. Future Internet 2019, 11, 13. https://doi.org/10.3390/fi11010013
AMA Style
Silva M, Signoretti G, Oliveira J, Silva I, Costa DG. A Crowdsensing Platform for Monitoring of Vehicular Emissions: A Smart City Perspective. Future Internet. 2019; 11(1):13. https://doi.org/10.3390/fi11010013
Chicago/Turabian StyleSilva, Marianne, Gabriel Signoretti, Julio Oliveira, Ivanovitch Silva, and Daniel G. Costa. 2019. "A Crowdsensing Platform for Monitoring of Vehicular Emissions: A Smart City Perspective" Future Internet 11, no. 1: 13. https://doi.org/10.3390/fi11010013
Note that from the first issue of 2016, this journal uses article numbers instead of page numbers. See further details here.