Predicting Activities of Daily Living with Spatio-Temporal Information


1
Faculty of Computing and Informatics, Multimedia University, Persiaran Multimedia, Cyberjaya 63100, Selangor, Malaysia
2
School of Fundamental Sciences, Massey University, Palmerston North 4442, New Zealand
*
Author to whom correspondence should be addressed.
Future Internet 2020, 12(12), 214; https://doi.org/10.3390/fi12120214
Submission received: 30 October 2020
/
Revised: 26 November 2020
/
Accepted: 26 November 2020
/
Published: 27 November 2020
(This article belongs to the Special Issue Data Science and Knowledge Discovery)
Abstract
:The smart home has begun playing an important role in supporting independent living by monitoring the activities of daily living, typically for the elderly who live alone. Activity recognition in smart homes has been studied by many researchers with much effort spent on modeling user activities to predict behaviors. Most people, when performing their daily activities, interact with multiple objects both in space and through time. The interactions between user and objects in the home can provide rich contextual information in interpreting human activity. This paper shows the importance of spatial and temporal information for reasoning in smart homes and demonstrates how such information is represented for activity recognition. Evaluation was conducted on three publicly available smart-home datasets. Our method achieved an average recognition accuracy of more than 81% when predicting user activities given the spatial and temporal information.
1. Introduction
Almost every country in the world is experiencing a growing and aging population. The smart home is considered a viable solution to address living problems, typically the elderly or those with diminished cognitive capabilities. An important part of the functioning of smart homes is to monitor user daily activities and detect any alarming situations (e.g., skipping meals several days in a row). Sensors attached to objects of daily use (e.g., fridge, light, etc.) are often deployed in the smart home to collect information about user daily activities. These sensors are activated when the user performs their activities (e.g., opening the fridge, turning on the light, etc.). The recognition system uses the sensory outputs from the home to learn about user activity patterns and predict the next probable event.
The majority of the probabilistic graphical models such as the hidden Markov model and its variants, and deep learning methods for activity recognition, can predict where the user will go next or what activity is the user doing given the sequence of sensor readings [1,2,3,4,5]. However, for a smart home to react intelligently and support its users, the recognition system should not only recognize their activities but also have the ability to reason, e.g., at what time and in which room did a particular event occur.
Knowing the contexts of the user such as when and where a particular event occurred are important for detecting any unusual or abnormal events and issue warnings to caregivers or family members. For example, the recognition system learns that the user always goes to bed at 10 p.m. If something is happening after 10 p.m. then it is more likely that the user is sleeping. If the user were in the kitchen doing laundry at 1 a.m., this would be something that the recognition system will recognize as unusual. Both space and time play an important role in activity recognition, and to represent and fuse all this information in the smart home poses a challenge.
An individual’s pattern of daily activities is likely the same everyday. For example, a morning routine could consist of making the bed, grooming, making coffee and having breakfast. It turns out that compression can be used to identify repeated ‘patterns’ that represent user activities. To illustrate how compression can be used in this study, we first describe the form in which we expect the data to appear. When the user performs an activity in the smart home, each user-interaction event contains information about (1) the time when the activity is performed, (2) the location of where the activity is performed and (3) the sensor that is being activated. Each user-interaction event is annotated (usually by the user themselves) with an activity name and a label stating the starts and ends of an activity. Table 1 shows an example of activity events in a smart home.
Since each activity event consists of information about time and location, this information can be incorporated when compressing the data stream. This paper extends the prediction by partial matching (PPM), an adaptive statistical data compression technique, to include spatial and temporal information. Our aim in this paper is to improve the activity recognition process by incorporating spatial and temporal context information, as illustrated in Figure 1. In particular, this paper aims to answer questions such as ‘where will the user most likely be at a given time’ or ‘given that the user is in a particular location at a given time, what activity is the user most likely doing’. Evaluation was performed on three publicly available smart-home datasets.
This paper is structured as follows: Section 2 provides reviews of related work. Section 3 contains description of our approach. Section 4 details the datasets and evaluation method used in this study. Section 5 describes the experiments and Section 6 contains the experimental results and discussion. Section 7 concludes our findings.
2. Related Work
The work of Das, Cook and Bhattacharya [6] is among the earlier work that used compression for activity recognition. They partitioned the home into different zones, where each zone is represented by a symbol. A dictionary of user movements is trained using the LZ78 compression algorithm. They then applied prediction by partial matching (PPM) to predict user next location based on the phrases in the dictionary. Gopalratnam and Cook [7] proposed a sequential prediction algorithm called Active LeZi, to predict the user’s next action based on an observed sequence of user–home interactions. Similar to the approach taken in [6], they built a representation of user–home interactions with LZ78 and used PPM to calculate the probability of the next most probable action.
In the work of Alam, Reaz and Ali [8], they introduced an adaptive sequence prediction algorithm that generates a finite-order Markov model and makes predictions based on PPM. To better capture the boundary between two opposite events, they applied an episode evaluation criteria that makes use of sensor ON and OFF states to indicate the start and end of an episode. An enhancement to this work is seen in [9] where they used a prefix tree-based data model to learn and predict user actions.
A variation to the work described above is the work of Chua, Marsland and Guesgen [10]. They used compression as an unsupervised learning method to identify activities in an unlabeled sensor stream. The sensor stream is represented as a sequence of characters. The Lempel–Ziv–Welch dictionary-based compression algorithm and edit distance are used to identify repeated sequences from sensor readings that represent user activities.
Most of these studies attempt to infer user activities from a sequence of sensor readings to either predict the user’s next location or action. Our work differs from these studies as the spatio-temporal information and user activities are represented in tuples. The PPM model is built on these tuples and the trained model is used to make prediction.
There are works that used PPM to predict user locations using GPS trajectories. In the work of Neto, Baptista and Campelo [11], they combined Markov model and PPM for predicting route and destination. PPM is used to learn about the road segments traversed by the user, while Markov model is used to model the transitions between locations. When predicting user route and destination, Markov model first predicts the next user location based on current location, and the routes and destination are retrieved from PPM. Burbey and Martin [12] extends the PPM algorithm to include temporal and location information to predict user next location based on movement traces obtained from wireless access points. Our work is closely related to the work proposed in [12]. The main difference lies in the way the PPM is trained. Our approach trained the PPM based on user-interaction events rather than on the entire sequence of movement traces.
Another variation to the methods pointed out above is to use frequent pattern mining. Liu et al. [13] mined frequent temporal patterns from a sequence of user actions. The mined patterns are used to characterize activities. Nazerfard [14] combined association rule mining and expectation-maximization clustering to discover temporal features and relations of activities from sensor-based data. However, these methods do not use any spatial information to infer user activities. In the work of Liu et al. [15], they attempt to extract spatial and temporal features from sensor data. They first applied k-means to cluster the temporal features and then used spatial features, which include a set of sensors and their frequency, to build a prediction model in each temporal cluster. Such methods, however, require the temporal features obtained from sensor readings to be clustered first before any classification can be performed.
3. Our Proposed Method
This section describes the statistical-based text compression approach based on prediction by partial matching, and our approach in predicting user activities based on spatio-temporal information.
3.1. Prediction by Partial Matching (PPM)
The main idea of PPM is to use the last few characters to predict the next character in the input sequence [16]. PPM builds several finite-context models of order k adaptively, where k is the number of preceding characters used.
Table 2 illustrates the operation of PPM after input string ‘sensorsensor’ has been processed. All the previously seen contexts in each model ( and ) are shown with their respective predictions, frequency counts c and the probabilities p. The lowest-level model is , which predicts all characters equally, where A refers to the set of distinct characters used. PPM records the frequency counts of each character seen for each context in the model, which is used to calculate the prediction probabilities.
By default, the model with the largest k is used when the PPM is queried, which in this example . When string ‘rs’ is seen, the likely next character is e, with a probability of 0.5. If a novel character is observed in this context, then an escape (‘esp’) event is activated, signifies a switch to a lower order model. This process is repeated until it reaches a model where the context is matched or the lowest model () is reached. Suppose that o followed the string ‘rs’, which is not predicted from the model in the context . An escape event occurs and model of context s is used, i.e., through the prediction .
3.2. Description of Our Approach
Since our interest is to predict activities based on time and location, the sensor information, i.e., sensors that are being activated (column 3 in Table 1), are not considered. Each user-interaction event is therefore represented by a triplet in ASCII character, where X is the time, Y is the location and Z is the activity performed.
Referring to the example of input string ‘sensorsensor’, PPM builds the context models based on the number of preceding characters used. Assume that , , and …, we want the highest context model () to predict user activity (n in ) based on time and location (s and e in ). To do this, PPM is trained on each rather than on the entire sequence of input string. With this, the model will have two predictions: (1) and (2) .
One of the issues with temporal resolution is that the scale on which it is measured can in fact change the analysis. If a representation would to train on data where the user was in the bathroom showering at 9.15 a.m. and then head to the kitchen to make coffee at 9.50 a.m., the training data for these two events would be:
(9.15 a.m., bathroom, showering), (9.50 a.m., kitchen, making coffee), ⋯
If the test data indicated that the user was showering in the bathroom at 9.05 a.m., the model would not be able to make a prediction of the user location at 9.05 a.m. since the model does not have any information of the user showering in the bathroom precisely at 9.05 a.m. In view of this, the time is processed as 30 min intervals, i.e., mapping each ASCII character for each time interval of 30 min. When the PPM model is queried for a prediction of where the user is likely to be at 9.05 a.m., which falls within ‘9 a.m.–9.29 a.m.’ interval, it can predict that the user is in the bathroom. Figure 2 shows the representation of Table 1 in ASCII characters and processed based on 30 min time intervals.
4. Description of the Data and Evaluation Method
This study was run on three publicly available smart-home datasets:
- MIT PlaceLab Dataset [17] This dataset contains 16 days of user activities with 1805 user-interaction instances. The activities are grooming/dressing, doing/putting away laundry, toileting/showering, cleaning, preparing meal/beverages and washing/putting away dishes. These activities are performed in 4 different locations of the home i.e., kitchen, bathroom, bedroom and office/study.
- van Kasteren Dataset [18] This dataset contains 24 days of user activities with 1318 user-interaction instances. The activities are toileting/showering, going to bed, preparing meal/beverages and leaving house. These activities are performed in 4 different locations of the home i.e., living room, bedroom, bathroom and kitchen.
- Aruba Dataset [19] For this dataset, the November 2010 data is used, which contains 27 days of user activities with 3569 user-interaction instances. The activities are meal preparation, eating, working, sleeping, washing dishes and bed to toilet. These activities are performed in 7 different locations of the home i.e., kitchen, dining, living room, bedroom-1, bedroom-2, bathroom and office.
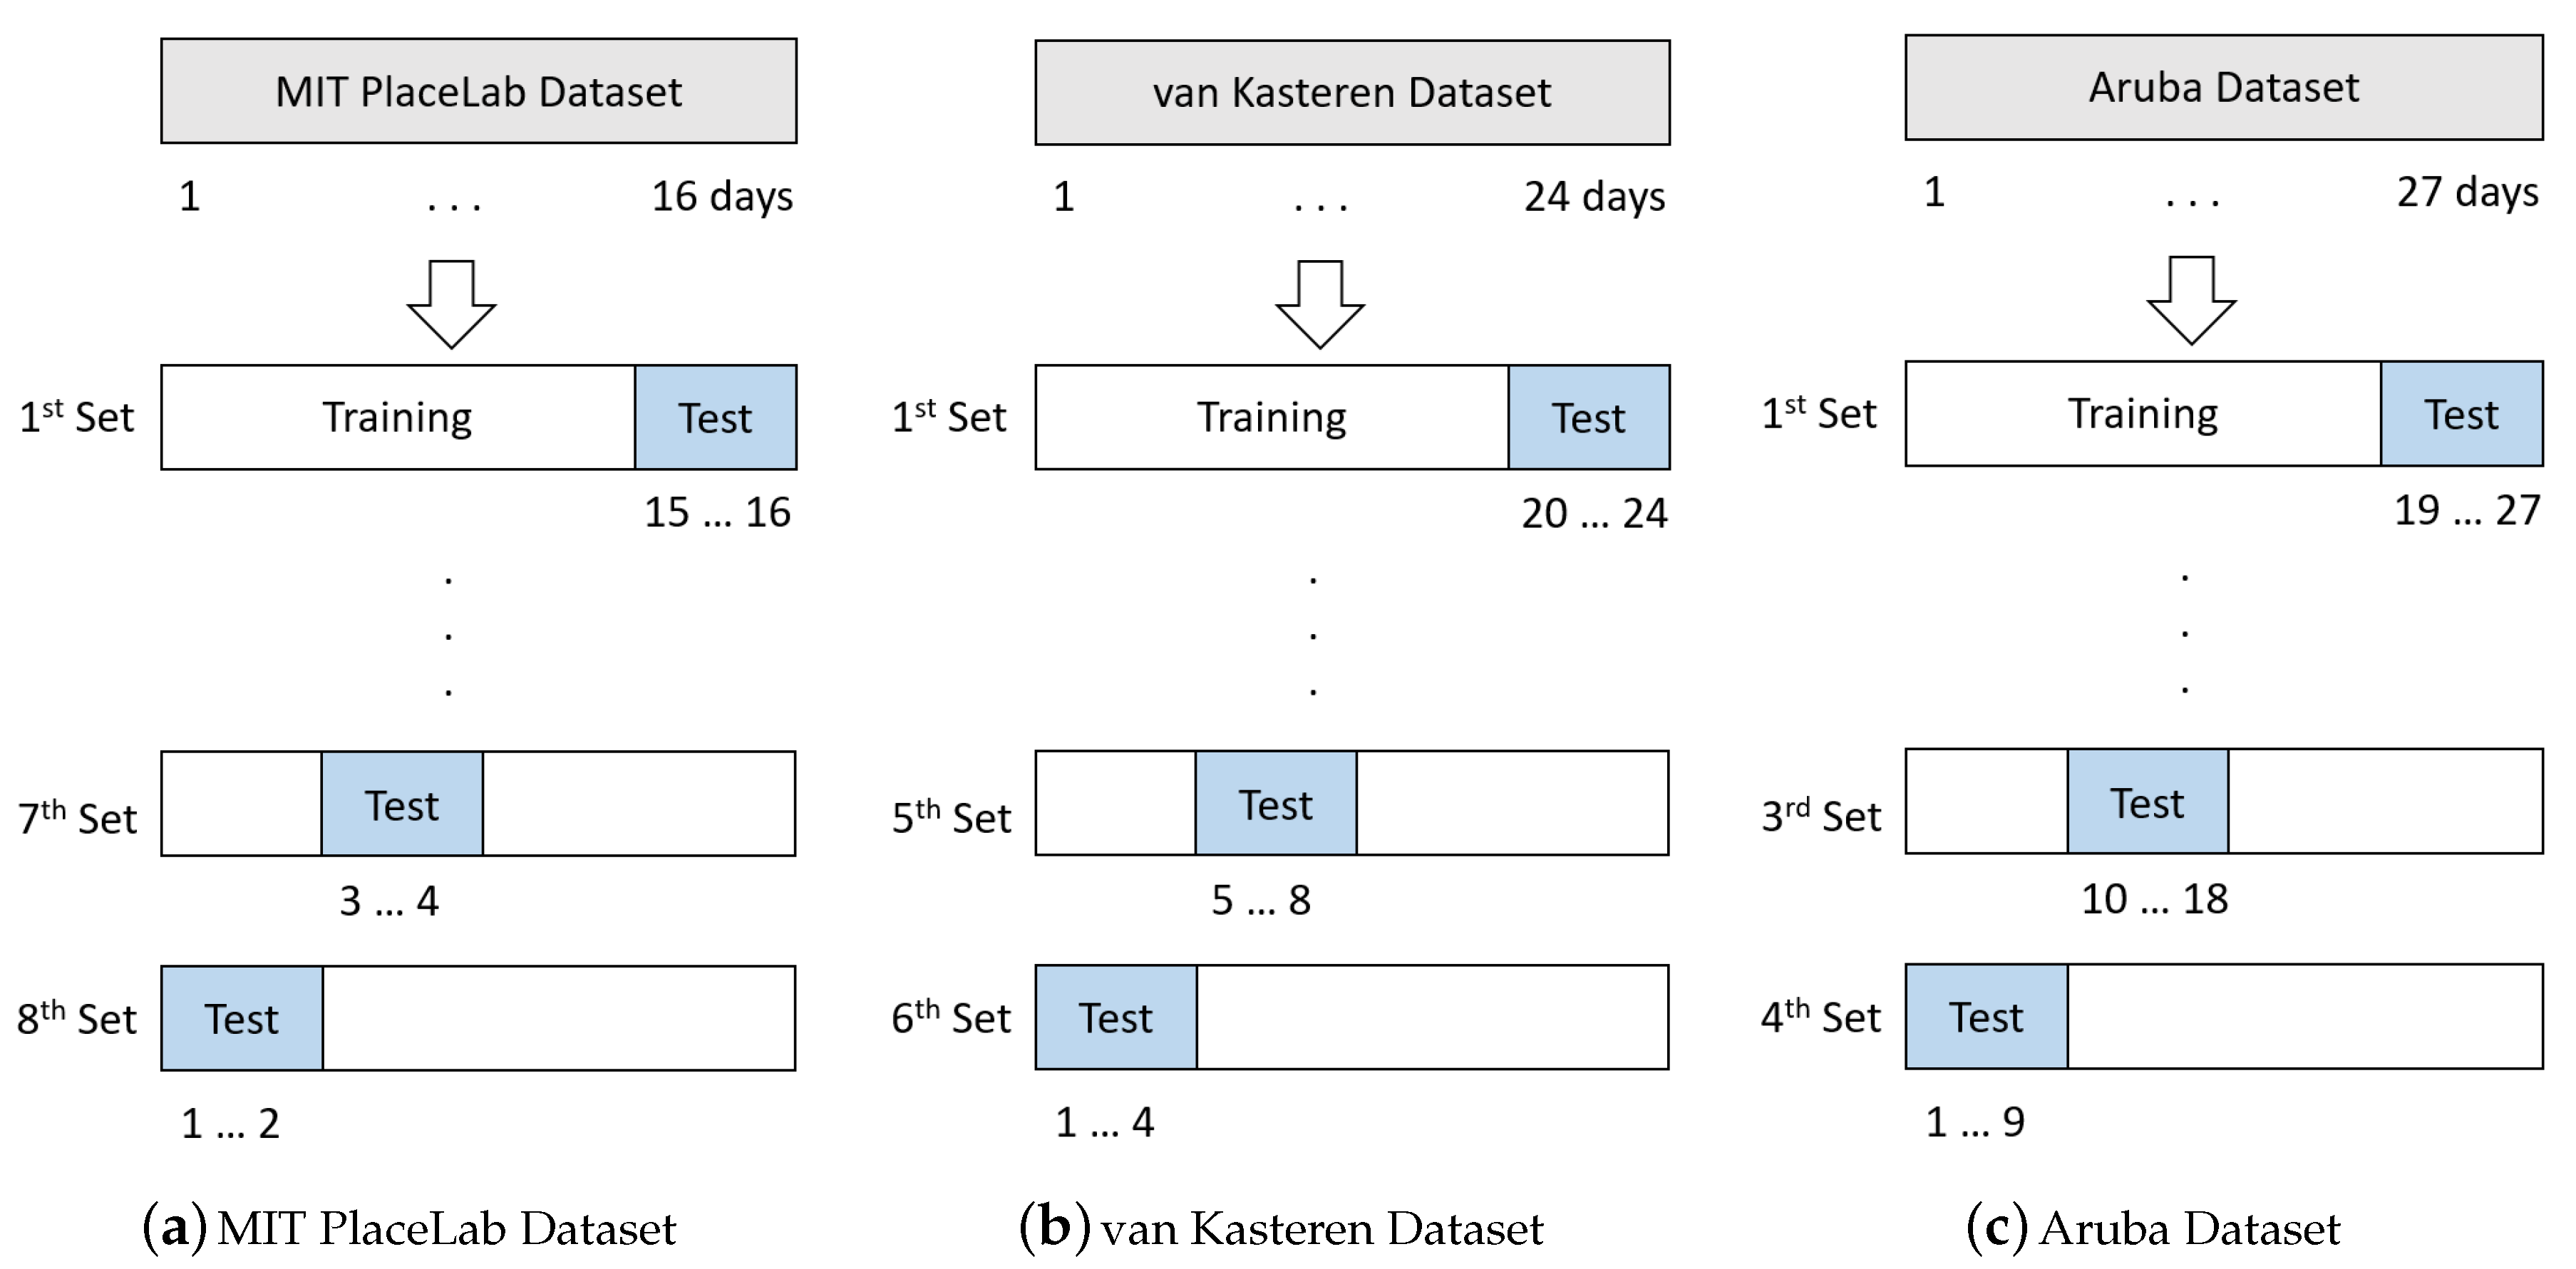
In all the datasets, the users annotated the activities themselves meaning that there were ground-truth annotations. It was observed that some activities were not repeated daily such as ‘doing/putting away laundry’, ‘washing dishes’ and ‘cleaning’ on MIT PlaceLab dataset. Since it is important that these activities are seen in the test set, leave-two-days-out cross-validation method is used, i.e., training on 14 days data and testing on the remaining 2 days. As for van Kasteren dataset, since there is a small number of activity examples per activity, leave-four-days-out cross-validation method is used, i.e., training on 20 days data and testing on the remaining 4 days. Since the activities in Aruba dataset are repeated frequently, leave-nine-days-out cross-validation method is used, i.e., training on 18 days data and testing on the remaining 9 days. Figure 3 shows the cross-validation method applied in this study.
5. Experiments
To evaluate the effectiveness of our approach, four experiments were conducted. The first experiment used model for prediction, while the second experiment used model. The third experiment evaluated the amount of training data needed to train the PPM model. For each evaluation, a new PPM model is created on each training set. During testing, context information such as user location and time will be fed to the PPM for prediction. The fourth experiment evaluated the computational performance.
5.1. Experiment 1: Prediction Based on First-Order Model
In this experiment, the first-order model (i.e., ) is used for prediction. Two types of predictions were evaluated. The first predicts the location of the user given the time of the day (), while the second predicts user activity given the location of the user (). For example, if the test data consists of the string ‘sen’, using the first-order model, it will first given ‘s’ and see if it predicts ‘e’ and then given the context ‘e’ and see if it predicts ‘n’.
5.2. Experiment 2: Prediction Based on Second-Order Model
This experiment aims to predict user activity based on time and location (). Using the example of the string ‘sen’ (discussed in Section 5.1), the PPM model would be given the string ‘se’ and see if it predicts ‘n’. In this experiment, the second-order model will be used for prediction.
5.3. Experiment 3: Training Size
To ensure that the PPM model acquires a good representation of user activity, it is important that each event is seen several times in the training set. The aim of this experiment is to determine the amount of training data required to train the PPM. Different splits of the data were evaluated. Table 3 shows the number of days used for training and testing. These data were cross-validated.
Both experiments 1 and 2 were repeated in this experiment on different training-test splits. Three types of predictions were analyzed. First is to predict user location based on time of the day (), while the second predicts user activity based on location (). The third predicts user activity based on time and location, i.e., .
5.4. Experiment 4: Computational Performance
The aim of this experiment is to evaluate the computational performance of our method in terms of training time and prediction time. The training time is computed based on the time it requires to build the PPM, while the prediction time is computed based on the time it takes to predict from the trained PPM. The performance is evaluated on a desktop computer with an Intel(R) Core(TM) CPU i7-7700K @ 4.2 GHz and 64 GB memory.
6. Results and Discussion
The first experiment was conducted using the first-order model for prediction. The main purpose is to test the model’s ability in predicting user location given the time of the day () and predicting user activity given the location of the user (). The recognition accuracy is calculated based on the number of times the model correctly makes the prediction.
Table 4 shows the recognition results for () prediction. Our method achieved an average recognition of 95.40% on MIT PlaceLab dataset, 90.41% on van Kasteren dataset and 84.04% on Aruba dataset when predicting user location based on time. Referring to Table 4, a low recognition accuracy of 71.94% was observed in the 2nd set of the van Kasteren dataset. In this test set, the user came home early around 1 pm, which was the only time and day that this was observed in the entire dataset. The PPM model is not able to make prediction since this event was not learned during training. Although the Aruba dataset has the lowest average recognition performance, only 18 days out of 27 days data were used for training, which is the lowest training:testing ratio as compared to the other two smart-home datasets.
Table 5 shows the recognition results in predicting user activity given location. A high average recognition accuracy was observed when predicting user activity based on location across all the datasets (i.e., 99.77% on MIT PlaceLab, 99.86% on van Kasteren and 98.89% on Aruba). This was expected since there are certain locations in the home where an activity usually takes place. For example, showering usually occurs in the bathroom, while cooking usually occurs in the kitchen. The results from this experiment showed that location provides important context for inferring user activity. The results from experiment 1 showed that our approach is effective in predicting () and () with more than 84% average recognition performance for () and more than 98% average recognition performance for ().
The second experiment tests the model’s ability to predict user activity given the time and location (). This experiment used the second-order model for prediction. The results are shown in Table 6. An average accuracy of 81.74% is achieved on MIT PlaceLab dataset, 88.14% on van Kasteren dataset and 81.05% on Aruba dataset. A lower recognition accuracy was observed in this experiment compared to the first experiment. This was due to variations in the activities performed on different time of the day. Although the accuracy was lower compared to the first experiment, our method still able to achieve an average recognition of more than 81% on all the three datasets. The 1st test set of MIT PlaceLab dataset has a low recognition accuracy of 63%. This was due to the variations in the way that the user performed his activity in this test set. For example, the second-order model learned that the user will be in the kitchen between 9.30 a.m. and 10 a.m. to ‘prepare meal’. In this particular test set, the user was ‘doing laundry’.
The third experiment was conducted to determine the amount of training data required to train the PPM. Various training-test splits were examined. The results presented in Figure 4 showed that the size of training data does have an impact on recognition performance. Such results are expected since compression is more effective when patterns are repeated frequently. When trained on 4 days, an average accuracy of 77.48% is achieved on MIT PlaceLab, 52.50% on van Kasteren dataset and 60.49% on Aruba dataset for prediction. A lower accuracy was observed in van Kasteren dataset. This was due to variations in the time when the user performed the activities. Such variations were not repeated frequent enough for PPM to learn the representations. For prediction, an average accuracy of 52.85% is achieved on MIT PlaceLab, 51.17% on van Kasteren dataset and 57.15% on Aruba dataset. However, for both and predictions, the average accuracy increases when trained with more training data, as shown in the first and third grouped bar chart in Figure 4. For prediction, our method achieved a high recognition accuracy across the three datasets. A consistent performance of more than 91% average recognition accuracy was observed across the different training-tests splits. The results showed that the size of training data does not have much impact on prediction. The high recognition performance achieved in this experiment (and also in the first experiment) showed that knowing which room that the user is in provides a better inference of what activity the user might be involved in.
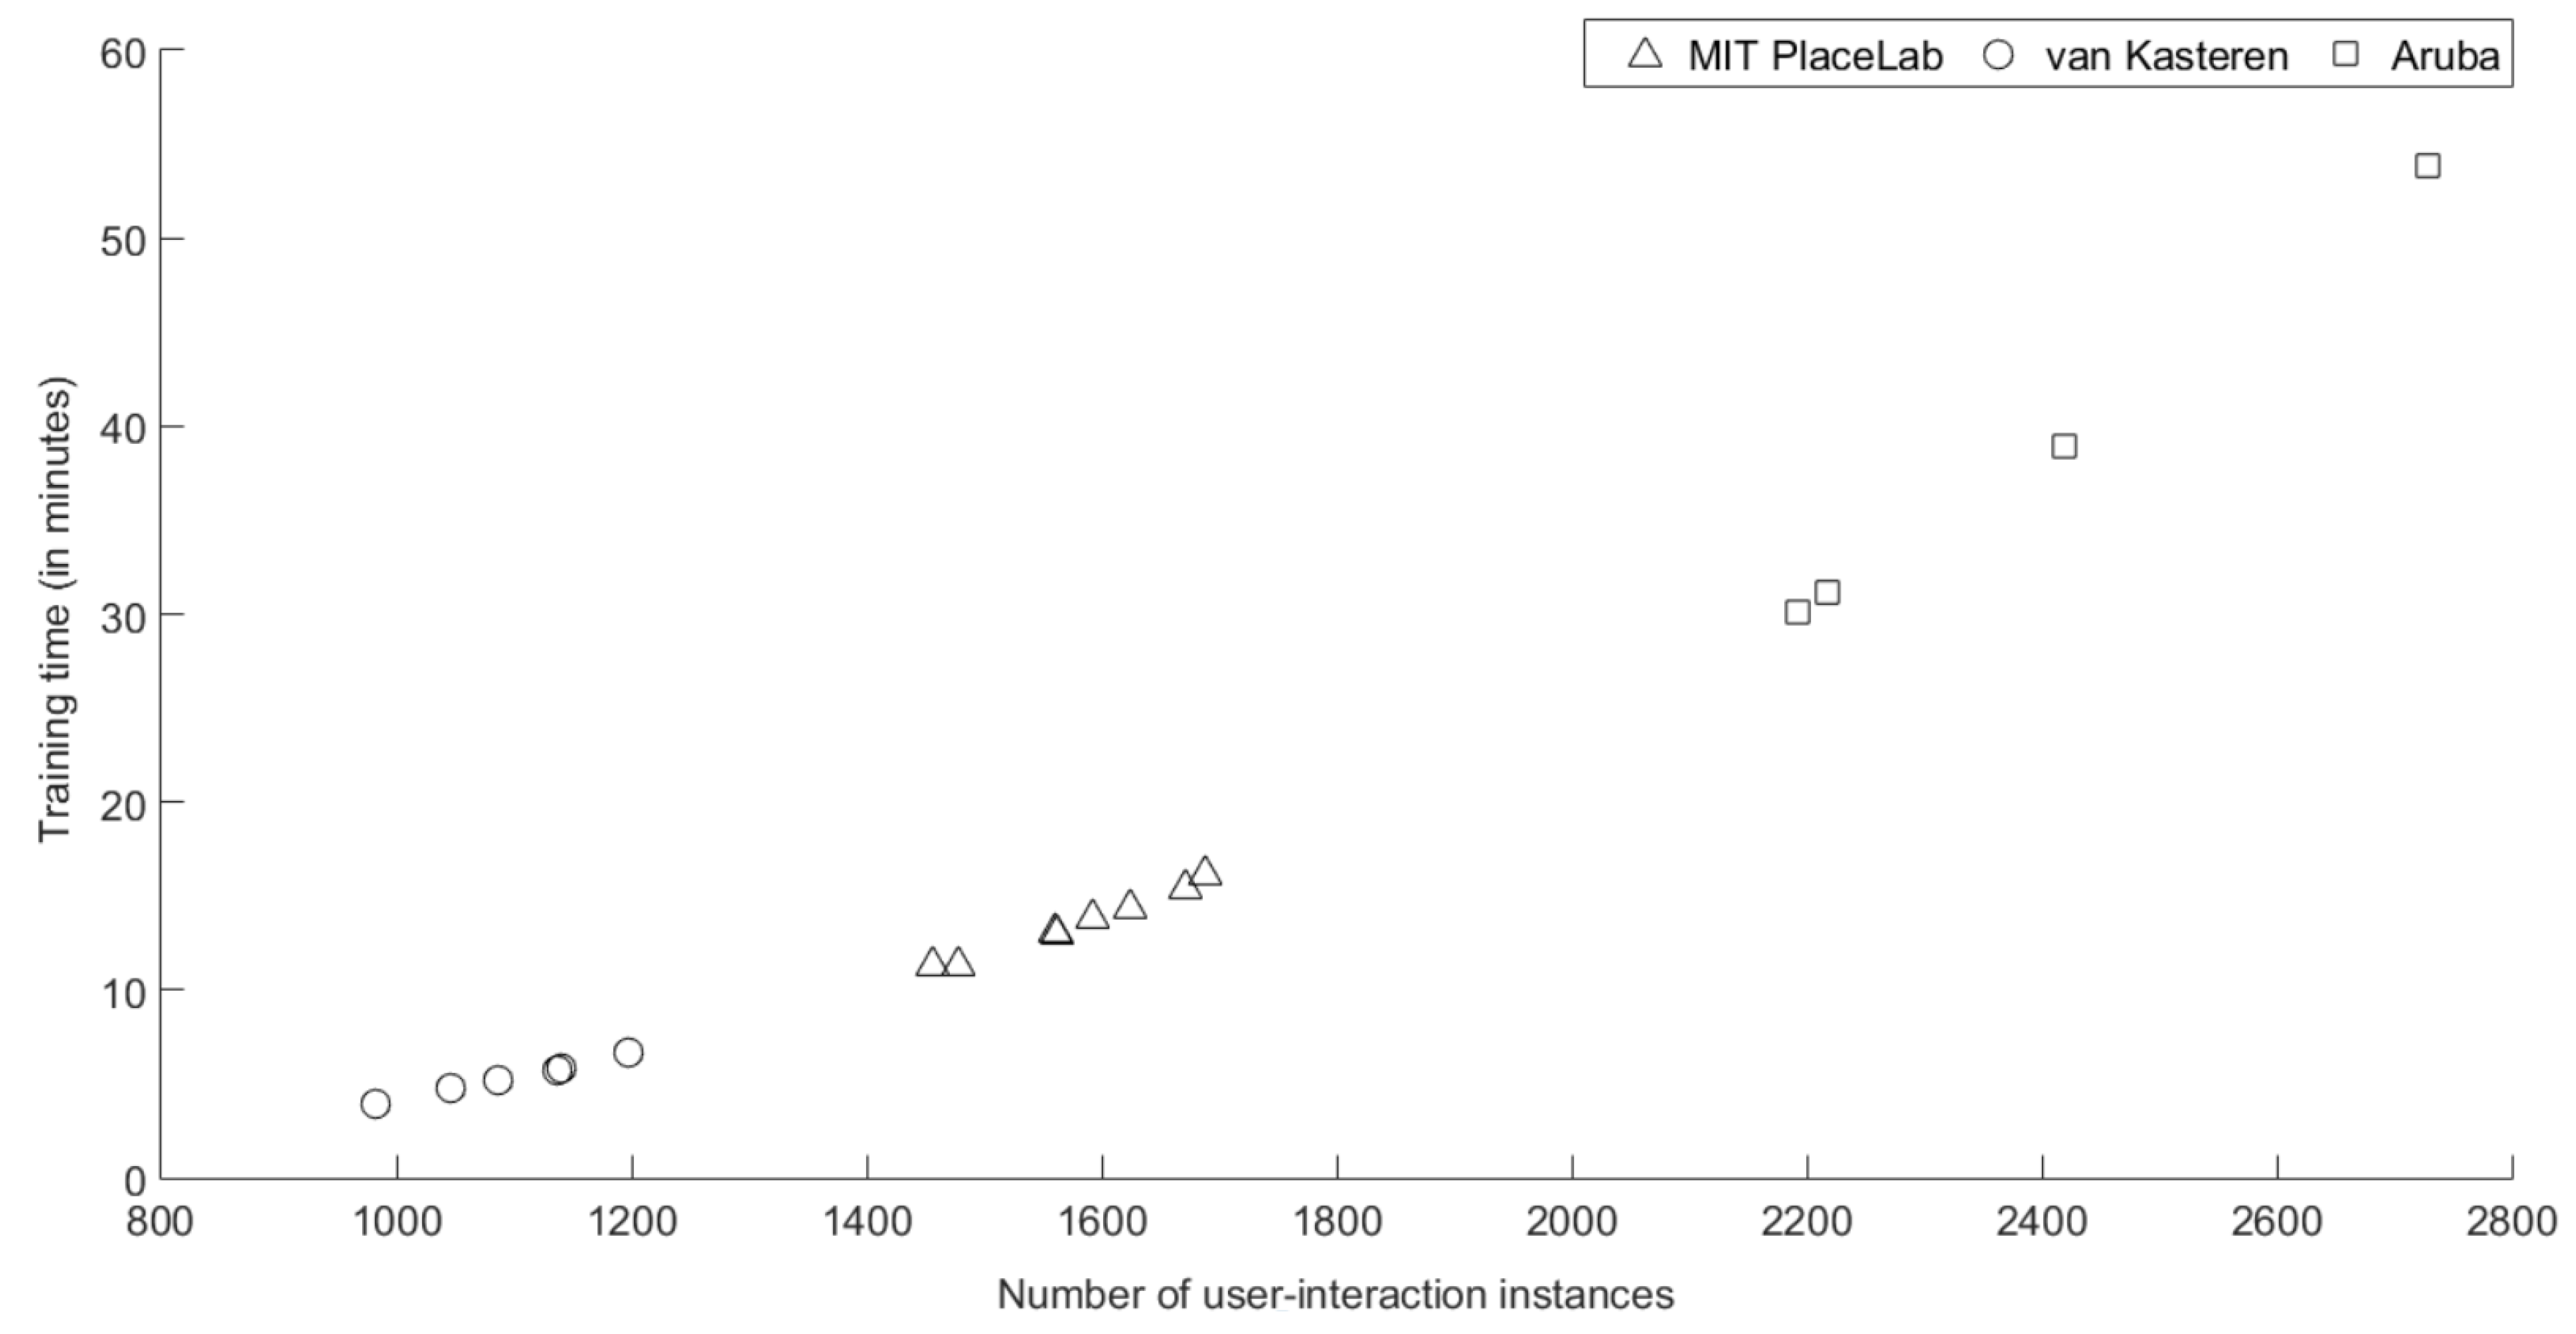
The fourth experiment evaluates the time it takes to train the PPM model and the time to predict from the trained PPM. Table 7 shows the computational performance in terms of (a) training time (in minutes) and (b) prediction time (in seconds). The value in parentheses shows the number of user-interaction instances in each respective training/test set. The training time across the number of instances presented in Figure 5 clearly show that the training time grows approximately linearly with the number of instances. As for the prediction time, it takes 0.1216 s to predict 1377 instances on the second test set of Aruba dataset (see Table 7b), which has the highest number of instances among all the test sets. The prediction time reduces when test on a smaller number of instances.
In this study, the temporal information is processed based on a 30 min interval. This time interval is a preliminary choice to validate our approach. However, a more adequate interval could be determined by preprocessing the data and finding the most suitable interval for each activity. Methods that could potentially be applied include rough and fuzzy sets [20].
7. Conclusions
This paper shows the importance of spatial and temporal information in interpreting human activity and how such information can be represented for activity recognition. The prediction by partial matching method is extended to capture spatio-temporal information by exploiting the repetitions from activity events. Evaluation was performed on three publicly available smart-home datasets. Our method can achieve an average accuracy of more than 84% for prediction. For prediction, our method achieved more than 98% average accuracy across all the three datasets. Although the has a lower recognition performance, our method can achieve an average accuracy of more than 81%. The results showed that the size of training data has an impact on the recognition performance for and predictions. Compression tends to be more effective when trained with more data and the training time grows approximately linearly with the number of instances. The results from the experiments showed that location provides useful context information for inferring user activity. As future work, the plan is to extend our approach for abnormality detection. The learned PPM can be used to identify inputs that do not fit into the contexts.
Author Contributions
Conceptualization, S.-L.C. and H.W.G.; Data curation, S.-L.C. and L.K.F.; Formal analysis, S.-L.C. and L.K.F.; Methodology, S.-L.C. and L.K.F.; Writing—original draft, S.-L.C. and L.K.F.; Writing—review and editing, L.K.F., H.W.G. and S.-L.C. All authors have read and agreed to the published version of the manuscript.
Funding
This research received no external funding.
Conflicts of Interest
The authors declare no conflict of interest.
References
- Du, Y.; Lim, Y.; Tan, Y. A novel human activity recognition and prediction in smart home based on interaction. Sensors 2019, 19, 4474. [Google Scholar] [CrossRef] [PubMed] [Green Version]
- Lu, L.; Cai, Q.-L.; Zhan, Y.-J. Activity recognition in smart homes. Multimed Tools Appl. 2017, 76, 24203–24220. [Google Scholar] [CrossRef]
- Chua, S.-L.; Marsland, S.; Guesgen, H. A supervised learning approach for behaviour recognition in smart homes. J. Ambient Intell. Smart. Environ. 2016, 8, 259–271. [Google Scholar] [CrossRef]
- Gochoo, M.; Tan, T.-H.; Liu, S.-H.; Jean, F.-R.; Alnajjar, F.S.; Huang, S.-C. Unobtrusive activity recognition of elderly people living alone using anonymous binary sensors and DCNN. IEEE J. Biomed. Health Inform. 2019, 23, 693–702. [Google Scholar] [CrossRef]
- Singh, D.; Merdivan, E.; Hanke, S.; Kropf, J.; Geist, M.; Holzinger, A. Convolutional and Recurrent Neural Networks for Activity Recognition in Smart Environment. In Towards Integrative Machine Learning and Knowledge Extraction; Holzinger, A., Goebel, R., Ferri, M., Palade, V., Eds.; Springer: Cham, Switzerland, 2017; pp. 194–205. [Google Scholar]
- Das, S.K.; Cook, D.J.; Bhattacharya, A. The role of prediction algorithms in the MavHome smart home architecture. IEEE Wirel. Commun. 2002, 9, 77–84. [Google Scholar] [CrossRef] [Green Version]
- Gopalratnam, K.; Cook, D.J. Online sequential prediction via incremental parsing: The active LeZi algorithm. IEEE Intell. Syst. 2007, 22, 52–58. [Google Scholar] [CrossRef]
- Alam, M.R.; Reaz, M.B.I.; Ali, M.A.M. SPEED: An inhabitant activity prediction algorithm for smart homes. IEEE Trans. Syst. Man. Cybern. A Syst. Hum. 2012, 42, 985–990. [Google Scholar] [CrossRef]
- Farayez, A.; Reaz, M.B.I.; Arsad, N. SPADE: Activity prediction in smart homes using prefix tree based context generation. IEEE Access 2019, 7, 5492–5501. [Google Scholar] [CrossRef]
- Chua, S.-L.; Marsland, S.; Guesgen, H. Unsupervised learning of human behaviours. In Proceedings of the Twenty-Fifth AAAI Conference on Artificial Intelligence, San Francisco, CA, USA, 7–11 August 2011; pp. 319–324. [Google Scholar]
- Neto, F.D.N.; Baptista, C.S.; Campelo, C.E.C. Combining Markov model and prediction by partial matching compression technique for route and destination prediction. Knowl. Based Syst. 2018, 154, 81–92. [Google Scholar] [CrossRef]
- Burbey, I.; Martin, T.L. Predicting Future Locations Using Prediction-by-Partial-Match. Available online: https://dl.acm.org/doi/abs/10.1145/1410012.1410014 (accessed on 21 July 2020).
- Liu, Y.; Nie, L.; Liu, L.; Rosenblum, D.S. From action to activity: Sensor-based activity recognition. Neurocomputing 2016, 181, 108–115. [Google Scholar] [CrossRef]
- Nazerfard, E. Temporal Features and Relations Discovery of Activities from Sensor Data. Available online: https://link.springer.com/article/10.1007/s12652-018-0855-7 (accessed on 12 November 2020).
- Liu, Y.; Ouyang, D.; Liu, Y.; Chen, R. A novel approach based on time cluster for activity recognition of daily living in smart homes. Symmetry 2017, 9, 212. [Google Scholar] [CrossRef]
- Cleary, J.G.; Teahan, W.J.; Witten, I.H. Unbounded length contexts for PPM. In Proceedings of the DCC’95 Data Compression Conference, Snowbird, UT, USA, 28–30 March 1995; pp. 52–61. [Google Scholar]
- Tapia, E.M.; Intille, S.S.; Larson, K. Activity recognition in the home using simple and ubiquitous sensors. In Proceedings of the 2nd International Conference on Pervasive, Vienna, Austria, 21–23 April 2004; pp. 158–175. [Google Scholar]
- van Kasteren, T.; Noulas, A.; Englebienne, G.; Kröse, B. Accurate activity recognition in a home setting. In Proceedings of the 10th International Conference on Ubiquitous Computing, Seoul, Korea, 21–24 September 2008; pp. 1–9. [Google Scholar]
- Cook, D.J. Learning setting-generalized activity models for smart spaces. IEEE Intell. Syst. 2012, 27, 32–38. [Google Scholar] [CrossRef] [PubMed] [Green Version]
- Guesgen, H.W. Using rough sets to improve activity recognition based on sensor data. Sensors 2020, 20, 1779. [Google Scholar] [CrossRef] [PubMed] [Green Version]
Figure 1.
Spatio-temporal reasoning in smart homes: (Bottom) User in a smart home performs their daily activities. (Middle) Sensor readings are mapped to user activities. (Top) Using location and time information for reasoning.
Figure 1.
Spatio-temporal reasoning in smart homes: (Bottom) User in a smart home performs their daily activities. (Middle) Sensor readings are mapped to user activities. (Top) Using location and time information for reasoning.

Figure 2.
Representation of Table 1 in ASCII characters and processed based on 30 min time intervals.
Figure 2.
Representation of Table 1 in ASCII characters and processed based on 30 min time intervals.

Figure 3.
Evaluation method: (a) Leave-two-days-out cross-validation, (b) Leave-four-days-out cross-validation and (c) Leave-nine-days-out cross-validation.
Figure 3.
Evaluation method: (a) Leave-two-days-out cross-validation, (b) Leave-four-days-out cross-validation and (c) Leave-nine-days-out cross-validation.

Figure 4.
Recognition performance on different training-test splits.

Figure 5.
Training time (in minutes) across the number of user-interaction instances on three datasets (MIT PlaceLab, van Kasteren and Aruba).
Figure 5.
Training time (in minutes) across the number of user-interaction instances on three datasets (MIT PlaceLab, van Kasteren and Aruba).


Table 1.
An example of user-interaction events in a smart home.
| Time | Location | Sensor ID | Activity | |
|---|---|---|---|---|
| 8.02 a.m. | bathroom | S22 | toileting | start |
| 8.06 a.m. | bathroom | S3 | toileting | end |
| 8.31 a.m. | kitchen | S18 | making coffee | start |
| 8.33 a.m. | kitchen | S7 | making coffee | |
| 8.38 a.m. | kitchen | S5 | making coffee | end |
| 9.05 a.m. | bathroom | S22 | toileting | start |
| 9.17 a.m. | bathroom | S3 | toileting | end |
Table 2.
PPM model after processing input string ‘sensorsensor’.
| Order | Order | Order | Order | ||||||||||||||
|---|---|---|---|---|---|---|---|---|---|---|---|---|---|---|---|---|---|
| Predictions | c | p | Predictions | c | p | Predictions | c | p | Predictions | c | p | ||||||
| en | → | s | 2 | e | → | n | 2 | → | e | 2 | → | A | 1 | ||||
| → | esp | 1 | → | esp | 1 | → | n | 2 | |||||||||
| → | o | 2 | |||||||||||||||
| ns | → | o | 2 | n | → | s | 2 | → | r | 2 | |||||||
| → | esp | 1 | → | esp | 1 | → | s | 4 | |||||||||
| → | esp | 5 | |||||||||||||||
| or | → | s | 1 | o | → | r | 2 | ||||||||||
| → | esp | 1 | → | esp | 1 | ||||||||||||
| rs | → | e | 1 | r | → | s | 1 | ||||||||||
| → | esp | 1 | → | esp | 1 | ||||||||||||
| se | → | n | 2 | s | → | e | 2 | ||||||||||
| → | esp | 1 | → | o | 2 | ||||||||||||
| → | esp | 2 | |||||||||||||||
| so | → | r | 2 | ||||||||||||||
| → | esp | 1 | |||||||||||||||
Table 3.
Different training splits on (a) MIT PlaceLab, (b) van Kasteren and (c) Aruba datasets.
| Number of Days | ||
|---|---|---|
| Split | Training Set | Test Set |
| (a) MIT PlaceLab Dataset | ||
| 1 | 12 days | 4 days |
| 2 | 8 days | 8 days |
| 3 | 4 days | 12 days |
| (b) van Kasteren Dataset | ||
| 1 | 16 days | 8 days |
| 2 | 12 days | 12 days |
| 3 | 8 days | 16 days |
| 4 | 4 days | 20 days |
| (c) Aruba Dataset | ||
| 1 | 16 days | 11 days |
| 2 | 12 days | 15 days |
| 3 | 8 days | 19 days |
| 4 | 4 days | 23 days |
Table 4.
Recognition performance in predicting user location based on time for each test set.
| Test Sets | Recognition Accuracy (%) | ||
|---|---|---|---|
| MIT PlaceLab Dataset | van Kasteren Dataset | Aruba Dataset | |
| 1st Set | 88.07 | 92.82 | 96.79 |
| 2nd Set | 92.78 | 71.94 | 75.24 |
| 3rd Set | 97.18 | 98.32 | 79.94 |
| 4th Set | 94.63 | 92.67 | 84.17 |
| 5th Set | 96.31 | 96.69 | – |
| 6th Set | 100 | 90.03 | – |
| 7th Set | 98 | – | – |
| 8th Set | 96.24 | – | – |
| Average | 95.40 | 90.41 | 84.04 |
Table 5.
Recognition performance in predicting user activity based on location for each test set.
| Test Sets | Recognition Accuracy (%) | ||
|---|---|---|---|
| MIT PlaceLab Dataset | van Kasteren Dataset | Aruba Dataset | |
| 1st Set | 99.39 | 100 | 100 |
| 2nd Set | 100 | 100 | 95.57 |
| 3rd Set | 100 | 100 | 100 |
| 4th Set | 99.17 | 100 | 100 |
| 5th Set | 99.59 | 99.17 | – |
| 6th Set | 100 | 100 | – |
| 7th Set | 100 | – | – |
| 8th Set | 100 | – | – |
| Average | 99.77 | 99.86 | 98.89 |
Table 6.
Recognition performance in predicting activity based on time and location on each test set.
Table 6.
Recognition performance in predicting activity based on time and location on each test set.
| Test Sets | Recognition Accuracy (%) | ||
|---|---|---|---|
| MIT PlaceLab Dataset | van Kasteren Dataset | Aruba Dataset | |
| 1st Set | 63 | 91.16 | 96.20 |
| 2nd Set | 82.22 | 68.96 | 72.62 |
| 3rd Set | 91.55 | 97.19 | 76.17 |
| 4th Set | 79.75 | 89.66 | 79.22 |
| 5th Set | 81.56 | 92.56 | – |
| 6th Set | 94.02 | 89.30 | – |
| 7th Set | 81.38 | – | – |
| 8th Set | 80.45 | – | – |
| Average | 81.74 | 88.14 | 81.05 |
Table 7.
Computational time: (a) Training time (in minutes) and (b) Prediction time (in seconds). The value in parentheses represents the number of user-interaction instances in each respective training/test set.
Table 7.
Computational time: (a) Training time (in minutes) and (b) Prediction time (in seconds). The value in parentheses represents the number of user-interaction instances in each respective training/test set.
| (a) Training Time (In Minutes) | |||
|---|---|---|---|
| Training Sets | MIT PlaceLab Dataset | van Kasteren Dataset | Aruba Dataset |
| 1st Set | 11.34 (1478) | 5.68 (1137) | 53.88 (2728) |
| 2nd Set | 14.38 (1625) | 3.90 (983) | 30.14 (2192) |
| 3rd Set | 13.77 (1592) | 5.84 (1140) | 31.17 (2218) |
| 4th Set | 12.95 (1563) | 5.21 (1086) | 38.95 (2419) |
| 5th Set | 13.05 (1561) | 6.63 (1197) | – |
| 6th Set | 16.08 (1688) | 4.80 (1047) | – |
| 7th Set | 11.31 (1456) | – | – |
| 8th Set | 15.36 (1672) | – | – |
| Average | 13.53 (1579) | 5.34 (1098) | 38.54 (2389) |
| (b) Prediction Time (In Seconds) | |||
| Test Sets | MIT PlaceLab Dataset | van Kasteren Dataset | Aruba Dataset |
| 1st Set | 0.0275 (327) | 0.0146 (181) | 0.0674 (841) |
| 2nd Set | 0.0154 (180) | 0.0248 (335) | 0.1216 (1377) |
| 3rd Set | 0.0172 (213) | 0.0152 (178) | 0.1191 (1351) |
| 4th Set | 0.0234 (242) | 0.0197 (232) | 0.0842 (1150) |
| 5th Set | 0.0212 (244) | 0.0098 (121) | – |
| 6th Set | 0.0080 (117) | 0.0216 (271) | – |
| 7th Set | 0.0406 (349) | – | – |
| 8th Set | 0.0100 (133) | – | – |
| Average | 0.0204 (226) | 0.0176 (220) | 0.0981 (1180) |
Publisher’s Note: MDPI stays neutral with regard to jurisdictional claims in published maps and institutional affiliations. |
© 2020 by the authors. Licensee MDPI, Basel, Switzerland. This article is an open access article distributed under the terms and conditions of the Creative Commons Attribution (CC BY) license (http://creativecommons.org/licenses/by/4.0/).
Share and Cite
MDPI and ACS Style
Chua, S.-L.; Foo, L.K.; Guesgen, H.W. Predicting Activities of Daily Living with Spatio-Temporal Information. Future Internet 2020, 12, 214. https://doi.org/10.3390/fi12120214
AMA Style
Chua S-L, Foo LK, Guesgen HW. Predicting Activities of Daily Living with Spatio-Temporal Information. Future Internet. 2020; 12(12):214. https://doi.org/10.3390/fi12120214
Chicago/Turabian StyleChua, Sook-Ling, Lee Kien Foo, and Hans W. Guesgen. 2020. "Predicting Activities of Daily Living with Spatio-Temporal Information" Future Internet 12, no. 12: 214. https://doi.org/10.3390/fi12120214
Note that from the first issue of 2016, this journal uses article numbers instead of page numbers. See further details here.