
Pervasive Intelligent Models to Predict the Outcome of COVID-19 Patients


1
Algoritmi Research Centre, University of Minho, 4800-058 Guimarães, Portugal
2
IOTECH—Innovation on Technology, 4785-588 Trofa, Portugal
*
Author to whom correspondence should be addressed.
Future Internet 2021, 13(4), 102; https://doi.org/10.3390/fi13040102
Submission received: 5 March 2021
/
Revised: 17 April 2021
/
Accepted: 17 April 2021
/
Published: 20 April 2021
(This article belongs to the Special Issue Data Science and Knowledge Discovery)
Abstract
:Nowadays, there is an increasing need to understand the behavior of COVID-19. After the Directorate-General of Health of Portugal made available the infected patient’s data, it became possible to analyze it and gather some conclusions, obtaining a better understanding of the matter. In this context, the project developed—ioCOVID19—Intelligent Decision Support Platform aims to identify patterns and develop intelligent models to predict and support clinical decisions. This article explores which typologies are associated with different outcomes to help clinicians fight the virus with a decision support system. So, to achieve this purpose, classification algorithms were used, and one target was studied—Patients outcome, that is, to predict if the patient will die or recover. Regarding the obtained results, the model that stood out is composed of scenario s4 (composed of all comorbidities, symptoms, and age), the decision tree algorithm, and the oversampling sampling method. The obtained results by the studied metrics were (in order of importance): Sensitivity of 95.20%, Accuracy of 90.67%, and Specificity of 86.08%. The models were deployed as a service, and they are part of a clinical decision support system that is available for authorized users anywhere and anytime.
1. Introduction
Every day, the world population is faced with an increasing number of severe acute respiratory syndrome coronavirus 2 (SARS-CoV-2) cases. Portugal is one of the European Countries where Coronavirus has a significant impact, and the number of cases and deaths is increasing every day. As a way to provide some inputs to the decision process, a research project was released: ioCOVID19 aims to develop an intelligent decision support platform that allows the prediction of the evolution of the disease in a specific patient to support clinicians in the fight against Coronavirus disease 2019 (COVID-19).
Since the provided data only refers to the Portuguese population, it was attempted to seek information regarding the most likely outcome of a specific patient based on his characteristics—such as the comorbidities he presents, symptoms, age, and gender. This article was developed as an integral part of a research project. It is a continuation of the work already demonstrated in the article “The clinical reality of COVID19 in Portugal—A clustering analysis” [1]. It intends to expose the obtained results concerning the analysis of the data carried out to the moment of writing the document. Therefore, the development of this phase of the project went through the following steps: Data preparation, since there was a need to replicate some of the data under study; Modeling, where the classification process was carried out and Evaluation of the results obtained in the last moment. The study aims to help health professionals in the moment of crucial decision-making. Previous records of infected patients by COVID-19 were used to predict their outcome. Thus, based on the classification processes, it is attainable to indicate whether the patient will need to be hospitalized or need specific medical support. It is also possible to understand the patient’s outcome, that is, to predict whether the patient will recover or die. The data found in this article goes back to February of 2021 regarding newly infected patients.
The article presents the following structure to expose all the results, techniques, and conclusions in the most organized and detailed way: first, to situate the reader in the theme and problem addressed, a short introduction to the subject is presented. The article’s main themes are then detailed in the Background section, where it is described what type of data mining technique is used in the study. It is then portrayed in more detail which materials and methods were used in the project’s development, such as which data was used and which methodologies were adopted. Regarding the Case Study point, the Cross-industry Standard process for data mining (CRISP-DM) and Design Science Research (DSR) methodologies are exposed in more detail, always establishing a connection with the project to understand the development achieved in each phase. In the section referring to the Results and Discussion, all relevant results and information obtained during the classification are exposed, discussed, and evaluated in detail.
2. Background
This section presents the article’s relevant topics, showing Portugal’s current situation and mentioning related works.
2.1. COVID-19
COVID-19 is the World Health Organization (WHO) official name for the disease caused by the new coronavirus SARS-COV-2 (Severe acute respiratory syndrome coronavirus 2), which can cause severe respiratory infections such as Pneumonia. This virus was first identified in humans in the Chinese city of Wuhan, Hubei province, at the end of 2019. The main symptoms associated with the COVID-19 infection are fever (body temperature above 38 degrees Celsius), cough, and difficulty breathing, such as shortness of breath. Some fewer common symptoms associated with the disease are sore throat, runny nose, headaches, muscle aches, and tiredness. In more extreme cases, it can also result in severe Pneumonia with acute respiratory failure, kidney and other organs failure, and, eventually, death. The contagion period is currently considered 14 days; however, transmission by asymptomatic people is still under investigation [2].
2.2. Portuguese Reality of COVID-19
When writing this article (6 April 2020), the scenario in which Portugal found itself concerning cases of COVID-19 was 824,368 infected and 16,887 deaths. This information was provided by the Directorate-General of Health of Portugal (DGS) [3].
To understand the pandemic’s effect in Portugal, it is essential to know its mortality rate concerning the deadliest diseases. According to the available records for the year 2019, the relative circulatory system’s diseases represent 29.90% of deaths in the country, being the leading cause of death. This is followed by malignant tumors, representing 25.50% of deaths and respiratory system diseases with 10.90% [4]. Therefore, through comparison, it is possible to understand the Coronavirus’s impact—however, considering that the virus is a recent phenomenon, the used data may not provide a correct representation of its actual effects. So, taking this into account, in March 2021, the mortality rate in Portugal stands at 2.0%. [5].
2.3. Project ioCOVID-19
This article is linked to the project developed—ioCOVID19—Intelligent Decision Support Platform NORTE-01-02B7-FEDER-048344. The article represents the second phase of the developed project. It aims to create an essential platform for clinicians to combat COVID-19. Its primary goals are to analyze the available data referring to those infected by Coronavirus in Portugal and predict the evolution of a given patient’s disease from a set of predictive models. Using open data accessible online and made available by the SNS (Portuguese National Health Service) and DGS, it is possible to categorize patients and assess the impact that each variable has on the disease’s course and predict the kind of patient discharge. A Web/Mobile platform—ioCOVID19—was also developed, aiming to allow physicians and/or nurses to access a set of essential data for decision-making. The models here depicted are part of the inference engine of the application conceived.
2.4. Data Mining
For the depicted project, Data Mining (DM) techniques were applied, in order to extract only valuable and relevant information from the data. The main objective is to find non-evident relationships and patterns between data or, in other words, it is the process of discovering knowledge from the data [6,7]. To this end, the used techniques allowed the identification of different categories, patterns detection, and the forecast of different scenarios—in this case, the outcome of the disease on a given patient. Nevertheless, the methodologies used to achieve the proposed objective were Classification Analysis and Neural Networks.
To assess and compare the models obtained, confusion matrix and Receiver Operating Characteristic (ROC) curve were considered [8].
2.5. Classification
Classification is a supervised machine learning technique used in DM. Briefly, the classification algorithms learn from the data input provided and then use the knowledge obtained to classify new observations [7]. From the available classification algorithms, only five were considered for this project (a brief explanation of the algorithms is presented in Section 4 of this paper): Logistic Regression, Naive Bayes Classifier, Decision Tree, and Deep Learning. For this project, a classifier was used to predict the categorical labels. From this method, it was possible to understand, for example, the outcome (dead or recovered) of a given patient taking into account their characteristics. To assess and compare the models obtained, a set of metrics were used: Confusion Matrix and Receiver Operating Characteristic (ROC) curve (more specifically, the measures calculated were Accuracy, Sensitivity, and Specificity) [8].
The Confusion Matrix presented in Table 1 is used to measure the performance of a classification algorithm in terms of True Positive (the classifier predicts positive and it is correct); True Negative (the classifier predicts negative, and it is correct); False Positive (the classifier predicts positive, and it is incorrect), and False Negative (the classifier predicts negative, and it is incorrect) [9].
The metric Accuracy exposes how often the classifier was correct. Sensitivity represents the positive data correctly predicted the total number of positive samples. Specificity represents the ratio of samples correctly classified as negative to the total number of negative samples [10]. The metrics mentioned are calculated as follows [10]:
2.6. Similar Works
Due to the impact of COVID-19 on today’s society, an extensive set of studies was carried out. However, since the data under analysis exclusively refers to Portugal, no works using data mining referring to the Portuguese situation in the face of the pandemic were found. Therefore, after conducting research and analyzing the obtained results, it was possible to realize that no study was being carried out along the lines of the project exposed in this article. Nonetheless, a set of works was carried out in the area in question using data from Portuguese institutions, which allows assessing this project’s feasibility. Regarding the studies carried out at national level in this area of support systems in the medical sector, the following examples will be considered:
- An intelligent decision support system is applied to Intensive Care Unit (ICU) based on several models, such as patient’s vital signs, critical events, medical scores in ICU, and the data mining models. The main goal of this project concerns de hourly forecast of organ failures and the result [11];
- The application of domain knowledge in order to improve an intelligent decision support system related to the study of bacteriological ingestions. The goal is to make the decision-making process more efficient about which antibiotic is the most appropriate for a given situation, based on specialists’ knowledge in the field [12].
However, for projects related to COVID-19, the majority of studies are carried out outside Portugal. As an example, two studies in this field are as follows:
- The prediction of early mortality risk based on patients infected with covid-19—For this purpose, several machine learning models were used, which revealed factors such as age, c-reactive protein sensitivity, lymphocyte count, and D-dimer influence the result of the infected patient [13];
- Understanding the role of preconditions associated with COVID-19—The main objective is to identify which characteristics are associated with the patient’s death. As of July 2020, the main conclusion was that this outcome (death by COVID-19) is associated with male individuals and over the age of 60 years [14].
From these examples, it is possible to observe that there are studies on the implementation of decision support tools in the medical context being developed but also studies regarding the coronavirus and its evolution. However, there are no studies combining both themes.
3. Materials & Methods
The Directorate-General provided the portrayed data for Portuguese Health, and it refers to patients infected with COVID-19. It was collected by medical professionals between 2 March 2020 and 28 February 2021.
3.1. Design Science Research
Since this is a research project and, to understand if it is possible to characterize the clinical typology of patients infected with Coronavirus (as well as the outcome of the disease), two methodologies were followed: Design Science Research (DSR) as a research methodology, and Cross-Industry Standard Process for Data Mining (CRISP-DM). DSR consists of 6 phases: 1. Identifying the problem and motivation; 2. Defining objectives of the solution; 3. Design and development; 4. Demonstration; 5. Evaluation; 6. Communication. These phases provide guidelines for evaluation and interaction in research projects. To put DSR in action, it is necessary to use a practical methodology to help drive the project, so, Cross-Industry Standard Process for Data Mining was chosen [15].
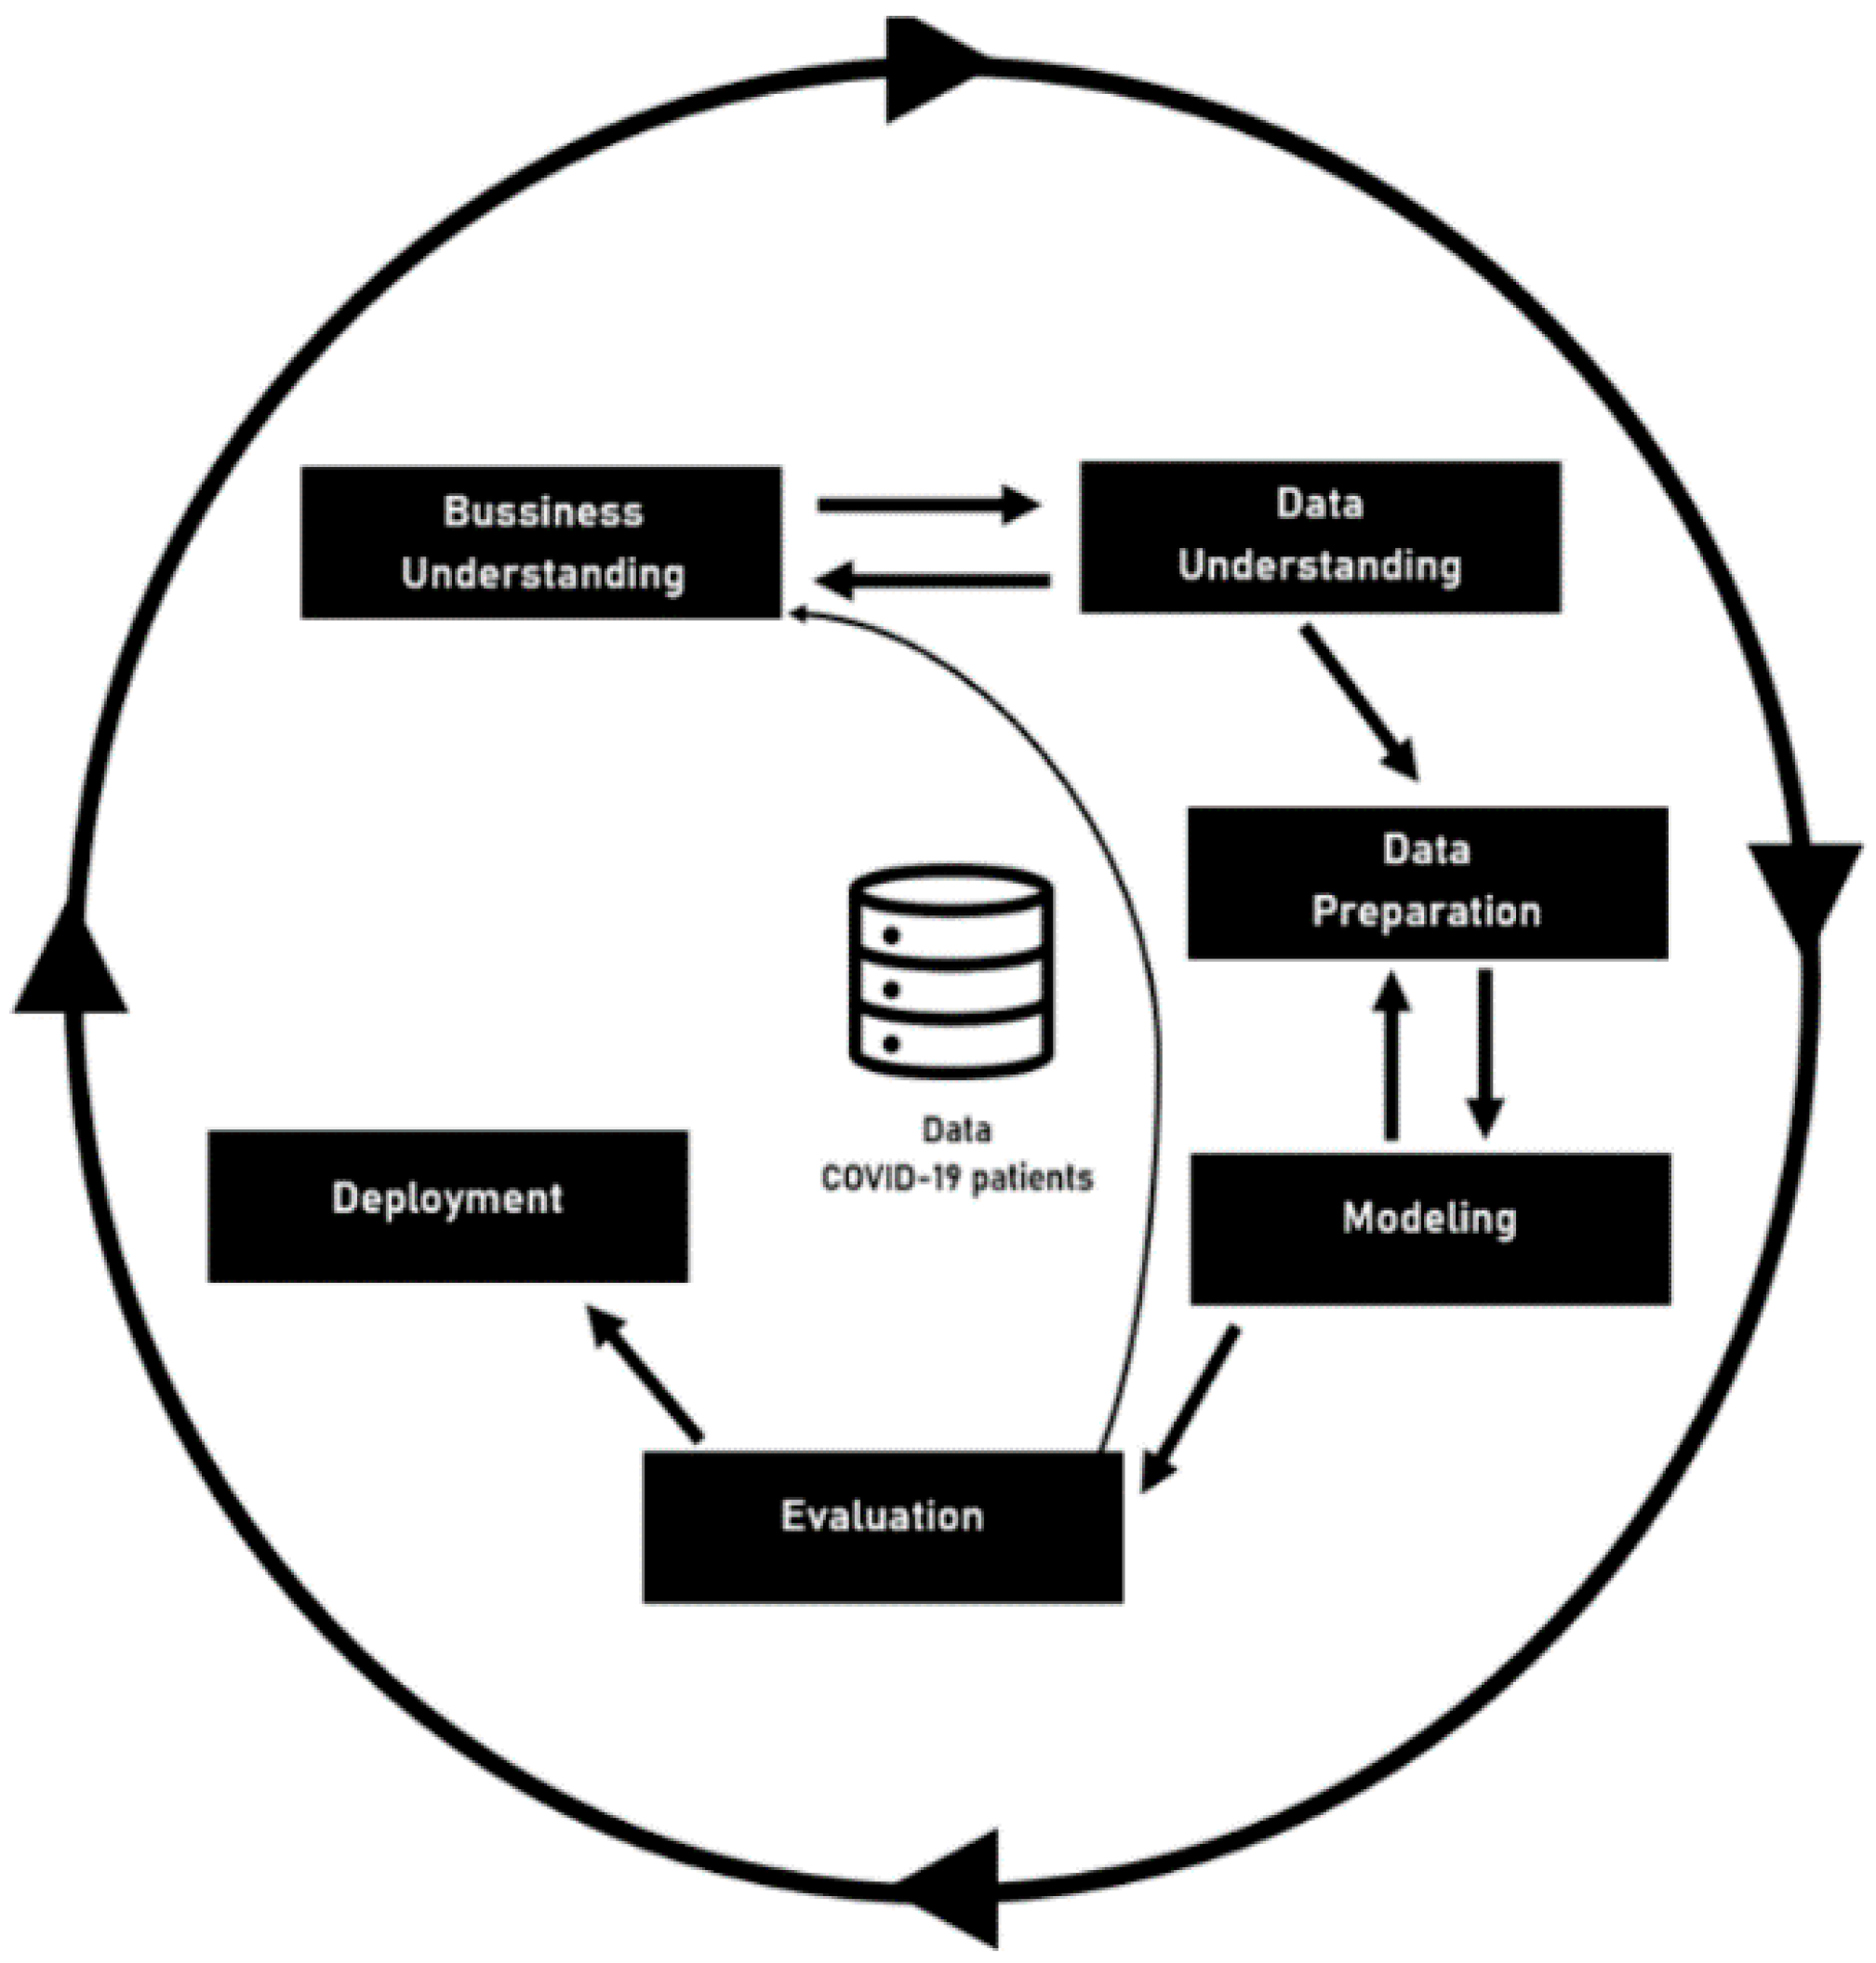
3.2. Cross-Industry Standard Process for Data Mining (CRISP-DM)
CRISP-DM was the second methodology used, and it is focused on the development of predictive models. The CRISP-DM method provides a global perspective on the life cycle of a data mining project. This cycle, shown in Figure 1—Project Workflow—is divided into six sequential phases. There are dependencies between them; however, it does not have a rigid structure. The current CRISP-DM model stages for data mining projects are Business Understanding, Data Understanding, Data Preparation, Modelling, Evaluation, and Deployment. The information depicted in this document was achieved after completing the fifth phase—Evaluation [16].
To drive this project, it is essential to assure a relation between the research methodology and practical method.
3.3. DSR and CRISP-DM
Since both methodologies are used concurrently, it is possible to point out the relationships between the phases of CRISP-DM and DSR (Design Science Research). The CRISP-DM method comprises the following activities: Business Understanding, Data Understanding, Data Preparation, Modeling, Evaluation, and Deployment [15].
This article portrays the phases of both CRISP-DM and DSR. For example, phases 1 and 2 of the DSR are directly linked to the first activity of CRISP-DM, as it is possible to check in the table. The remaining relationships are also shown in Table 2 [15].
In other words, in the first phase of the project, there was a necessity to identify the business objective to understand the motivation for the project’s emergence. Then, regarding the provided data, the goal was to understand its use and, from there, to define the objectives of the solution to be developed. In a third phase, data is prepared to facilitate its use in future steps. Afterward, the modeling process begins, which in the current project involves the data mining classification technique. This phase is linked to the previous two. From this point, there may be a need to make changes to obtain the best results. Then, in the Evaluation phase, the results obtained previously were analyzed to understand their usefulness and viability. And finally, after completing the previous stages, it is necessary to apply the obtained resources to make them useful in the environment in which they are required.
3.4. Tools
Python programming language was used for the preparation of the data and consequent analysis of it. Moreover, to be able to apply this same language to the project in question, a set of libraries were used to enable the preparation, analysis, and consequent prediction of the data:
- Panda’s library allows the use of the DataFrame object to provide storage and manipulation of the data organized by columns [17];
- Scikit-learn (sklearn) is a machine learning software that provides various algorithms such as classification, regression, and clustering [18];
- TensorFlow is a library used for solving problems with Machine Learning and Deep learning [19].
3.5. Classification Algorithms
A set of classification algorithms was used to achieve this project’s aim, namely Logistic Regression, Naive Bayes, Decision Trees, and Deep Learning.
3.5.1. Logistic Regression
Logistic regression is a supervised classification algorithm modeling the data using the sigmoid function. This algorithm is used to predict the probability of a categorical dependent variable [20]. Both the set of resources (input) and the destination variable (output) can only assume discrete values when involved in classification problems. This algorithm builds a model to predict the probability that a given entry belongs to the category numbered as 1. In other words, this model predicts the Probability of P(Y = 1). Therefore, when using the algorithm Logistic Regression, it is necessary to take into account the following assumptions [20]:
- The dependent variable has to be binary;
- Factor 1 of the variable should represent the desired outcome;
- Only the relevant variables should be included in the classification process;
- The independent variables should be independent of each other;
- It requires large sample sizes.
For this model, no hyperparameter was modified to control the learning process; all parameters had their default value.
3.5.2. Naïve Bayes
The Naive Bayes algorithm is a simple probability classifier. Bayesian algorithms predict the class depending on the probability of belonging to that class [21]. It calculates a set of probabilities from the frequency count and the combinations of values in a given data set. This algorithm is based on Bayes’ theorem, assuming that all variables are independent. Bayes’ theorem follows the following formula [22]:
From this theorem, it is possible to find the probability of event A to happen (what is intended to be predicted—the outcome), given that a particular event B occurred (the comorbidities, symptoms, age, and gender of a given patient). However, this lack of independence is not valid in real contexts because it disregards the correlation between the variables. Hence it is characterized by “Naive” [23].
For this model, no hyperparameter was modified to control the control de learning process; all parameters had their default value.
3.5.3. Decision Trees
Decision Tree is one of the most important and well-known classification algorithms. This algorithm is a nonparametric supervised learning method. The goal is to create a model capable of predicting the value of a target variable by learning simple decision rules inferred from the given data [24]—in other words, it works as a set of “yes” or “no” questions based on specific characteristics to reach the target variable. The base components are nodes and branches, and the next most important steps are splitting, stopping, and pruning, so it is possible to create a decision tree [25].
For this model, one hyperparameter setting was modified, as shown in Table 3, yet the remaining parameters kept their default value. The parameter max_depth assumes the value of 20, which establishes the tree’s maximum depth to control the size of the generated tree. This value was achieved after implementing the GridSearchCV library, which allows identifying the best values to be applied in the parameters [26,27].
3.5.4. Deep Learning
Deep Learning (DL) is Machine Learning based on algorithms inspired by the human brain structure and function denominated artificial neural networks (ANNs) [28], also known as feedforward neural networks. With the constant increase of data and processing power, the need to apply both concepts arose. DL consists of a technique associated with neural networks that enable computers to learn through experience from a hierarchy of concepts. This hierarchy allows the computer to learn complex concepts by building them out of simpler ones. Therefore, since the computer can learn from its own experience, there is no longer a need for Human intervention [29]. This method achieves excellent power and flexibility by learning to represent information as a nested hierarchy of concepts. An ANN is composed of 3 components: Input Layer, Hidden Layers, and Output Layers [30]. There are several neurons for input values and others for output values; however, many neurons are interconnected in the hidden layer. So, formally neurons define Deep Learning.
For this model, the changes made to the hyperparameter were the following, as depicted in Table 4:
The remaining parameters kept their default value.
4. Case Study
The case description goes through the methodology presented in the CRISP-DM section, as possible to understand in the following points. As previously mentioned, the used data is inserted in the time interval between March 2nd of 2020 and February 28th of 2021. The provided data has 805 141 records, with each record referring to a patient. To provide a better understanding of the used data, attached to the article is a document denominated “COVID-19 Data Analysis”, where it is possible to find relevant general information.
4.1. Business Understanding
The first phase—Business Understanding—focuses on understanding the project’s objectives and requirements from a business perspective. It is then possible to design a preliminary data mining project that can achieve the outlined goals. In the project in question, this phase consisted of realizing what type of data would be provided and its use in a data mining project. Therefore, the project intends to develop a platform for clinicians to combat COVID-19, with the primary objective of predicting the evolution of a specific patient’s disease—evaluating the impact that each variable has on the disease and predicting the type of discharge. In the study, the particular aspect addressed is trying to predict the outcome or the need for further medical support for clinical patients in Portugal.
4.2. Data Understanding
Data Understanding starts after the initial collection of data to be worked. At this stage, data analysis is carried out to search for possible quality problems and, consequently, obtain a better understanding of them. Due to this type of study, it is also easier to understand if there is any subset that can be obtained considering the available information, thus enriching the subject under investigation. So, it was at this stage that a meticulous analysis of the data at hand was carried out.
The data provided has 805,141 records, collected between the 2nd of March and the 28th of February. Since the patient’s age is an important variable in the classification process, all records with no associated age were ignored. Therefore, the number of associated records changed to 739,297 (representing 91.8% of the initial data). Subsequently, a table was created to expose all the relevant information in order to obtain a better perception of the data. However, since that table has large dimensions, it is attached to the article. The table is denominated “COVID-19 Data Analysis”.
For the reader to obtain a global perception of the data, Figure 2—Records General Information presents some relevant information to retain. According to the presented figure, it is possible to perceive the gap between records of recovered and infected patients, a crucial detail that can influence the result in the modeling phase; for example, the number of dead patients only represents 1.98% of the cases. The percentage of patients who present comorbidities prior to infection caused by the SARS-CoV-2 virus can also be understood.
The comorbidities noted by health professionals are the following: Diabetes, Asthma, Neoplasm, Chronic Lung Disease, Chronic Kidney Disease, Chronic Neurological and Neuromuscular Disease, Chronic Hematological Diseases, Chronic Neurological Deficiency, Liver Pathology, HIV or other Immunodeficiencies, Acute Renal Failure, Cardiac Insufficiency, and Consumption Coagulopathy. The comorbidities distributions are shown in Figure 3—Comorbidities Distribution and how it is possible to perceive the comorbidities with the largest number of associated records are: Diabetes, Asthma and Neoplasia.
For a better comprehension of the dataset, an analysis of the data is provided in the supplement material section. Table S1 presents a description, the data type, quality issues, percentage of non-nulls, and an example of possible values for each variable.
4.3. Data Preparation
As it is possible to understand by Figure 2—Records General Information, presented in the previous point, the data in use is unbalanced: the discrepancy between patients who died and infected/recovered patients is significantly accentuated, showing a 1:49.4 proportion of the minority class [deaths] to the majority class [infected/recovered], which can result in an Imbalanced Classification. This type of detail needs an important evaluation, given that the minority class instances are easier to be ignored by the learning algorithm due to the high number of instances from the majority class [31]. To counter this problem, Random Oversampling and Undersampling were used.
Oversampling involves the duplication of records from the minority class to correct the imbalanced data. On the other hand, Undersampling consists of a random selection of data from the majority class that involves removing instances of this class until the majority class and the minority class present an equal number of examples for each class [32].
To obtain the best possible result for the classification algorithms, using the Oversampling method, small changes were made to the data. The number of patients infected/recovered is 724,630 (which represents 98% of the selected data) and, on the other hand, the number of patients who died is 14,667 (which represents around 2% of the selected data). Probability sampling techniques were used in order to make sure that all elements of the population have an equal chance of being selected, having been used more specifically Simple Random Sampling [33]. For such, a data sample was created by selecting only the records of patients who died, therefore, it contains the 14,667 records previously mentioned. This data sample was replicated 50 times, so the number of records regarding patients who are infected/recovered or died is balanced, as can be observed in Table 5—Distribution of cases using Oversampling, thus allowing better results. However, this is not the correct method when the need for replication is very high. Furthermore, the Undersampling method was also used in order to compare the results obtained by the two techniques considered. This method requires a random selection of data referring to Infected/Recovered patients so that both classes involved obtain the same number of records, as seen in Table 6—Distribution of cases using Undersampling.
4.4. Modelling
In this phase, several modeling techniques were selected and later applied to the previously treated data, optimized to obtain better results. For this, the modeling includes the following tasks: Selecting modeling techniques, generating a test environment, building the model, and evaluating it [34,35].
To proceed with the application of the algorithms to make predictions on the data, the data had to be divided into two parts: a training set and a testing set. The training set is used by the various classification algorithms so that they can train and adjust the model’s constituent parameters. The test set allows evaluating the Accuracy of the final model taken from the training. For the data referring to patients infected by the Coronavirus, the data was divided using Stratified Cross-Validation since it offers more robust and reliable results. This method estimates the Machine Learning model’s learning capacity to make predictions on unused data during the training phase, evaluating the classifier performance. Therefore, when a supervised Machine Learning process is carried out, data is separated so that one of these sets can be tested. This procedure has a single parameter denominated “k”, and this value refers to the number of sets into which the data set in use was divided. For the project in question, this variable assumed the value of ten, meaning that the data sample in question was divided into ten different groups. The purpose of cross-validation is to test the model’s ability to correctly predict new data that was not used in the training phase [36]. The Stratification process reorganizes the data to ensure that each fold has the same proportions of observations and provides a correct representation of the data as a whole [37].
In this case, the data referring to COVID-19’s patients will be subject to several classification algorithms to be able to predict the class of data in question. The SVM classification algorithm was also considered; however, it was not possible to obtain results on time due to the amount of data.
The targets under consideration, presented in JSON (JavaScript Object Notation), were the following:
- {
- “Scenarios”:{
- “S1”:”All comorbidities, symptoms, age and gender”,
- “S2”:”All comorbidities, age and gender”,
- “S3”:”Risk comorbidities, age and gender”,
- “S4”:”All comorbidities, symptoms and age”,
- “S5”:”All comorbidities and symptoms”,
- “S6”:”All comorbidities”,
- “S7”:”All comorbidities and age”,
- “S8”:”All comorbidities and gender”
- },
- “Techniques”:{
- “T1”:”Logistic Regression”,
- “T2”:”Naive Bayes”,
- “T3”:”Decision Trees”,
- “T4”:”Deep Learning”
- },
- “Sampling Methods”:{
- “SM1”:”Oversampling”,
- “SM2”:”Undersampling”
- }
- }
Therefore, 64 models were induced to obtain the published results (8 Scenarios × 1 Targets × 4 Techniques × 2 Sampling Methods).
4.5. Evaluation
In the Evaluation phase, the developed model was evaluated to ensure it allows the achievement of business objectives. In other words, this phase of the project presupposes the implementation of the following stages: Evaluate results, Review the process and Determine the next steps.
So, the previous phase models go through an evaluation process regarding performance and utility. For this, metrics are used to understand which algorithm has the best results for the problem presented.
Therefore, it was necessary to define a threshold to obtain the best possible model. Consequently, from the knowledge of the specialist in the field, the following values were stipulated for the metrics Sensitivity, Accuracy, and Specificity:
- Sensitivity ≥ 90%;
- Accuracy ≥ 80%;
- Specificity ≥ 80%.
The obtained results varied from 0 to 1, and the main objective is to predict the 1. So, to evaluate the performance of the models, the mentioned metrics are used. Metrics related to Sensitivity have priority compared to the others given because it allows for balancing the number of false positives and negatives. However, it is important that there are no unbalanced models, such as predictions with high false positives. So, both Accuracy and Specificity must have relevant values. This metric will also be important for the future implementation of ensembles.
4.6. Deployment
In the Implementation phase, the obtained knowledge has to be presented so that the client—in this case, health professionals—can use it. In other words, it involves making the acquired knowledge useful for decision-making.
The project in question is part of the clinical Intelligence Decision Support System (CIDSS). The CIDSS is an information system focused on the health area, conceptualized to provide support in health professionals’ decision-making, in this case, the ones that are on the front line to combat COVID-19. Clinical observations are linked to the domain’s knowledge in a specific area of health, and they can influence physician’s choices to improve health care services.
Regarding the coronavirus project, a web and mobile application were developed to support the results obtained. Furthermore, to allow its use, the models will be consumed by clinicians as a service. To this end, a third article associated with the project is under development, where the main outputs from both the clustering and the classification phase will be exposed, explaining more closely why it is a CIDSS project. The deployment process turns the models pervasive and makes it available as a service anywhere and anytime to any user with access privileges. The deployment process and the entire solution will be described in-depth in a further article [38].
5. Results and Discussion
At this stage of the project, the obtained results in the modeling phase are exposed. The classification algorithm’s best-obtained result and its respective scenario are shown for the target under study. In this way, it is possible to uncover which is the best model for the considered target.
The prediction models were constructed considering the target under study (Patient Outcome), eight different scenarios (S1 to S8), and applied five different DM techniques (T1 to T5). For such, the models can be identified as an ensemble of a three-dimensional matrix M composed by s = 8 scenarios × t = 5 techniques × sm = 2 sampling methods. Each element of M corresponds to a particular model and can be defined as:
where,
| s: 1 = {All comorbidities, symptoms, age and gender} 2 = {All comorbidities, age and gender} 3 = {Risk comorbidities, age and gender} 4 = {All comorbidities, symptoms and age} 5 = {All comorbidities and symptoms} 6 = {All comorbidities} 7 = {All comorbidities and age} 8 = {All comorbidities and gender} | t: 1 = Logistic Regression 2 = Naive Bayes 3 = Decision Tree 4 = Deep Learning | sm: 1 = Oversampling 2 = Undersampling |
The table below presents the best results obtained by each scenario (s = 1 to 8). For each model, the values of Accuracy, Specificity, and Sensitivity are presented. For example, for model —consisting of scenario 1, Decision Tree technique, and sampling method Oversampling—the Accuracy obtained was 90.99%, which represents the percentage of correctly labeled subjects. Specificity was 86.79%, indicating the percentage of recovered outcome correctly predicted, and Sensitivity was 95.14%, which represents the percentage of death outcome correctly identified.
For example, taking into account the model (composed by scenario 1—Decision Tree technique and sampling method Oversampling), the metrics Accuracy, Specificity, and Sensitivity were noted. The Accuracy obtained was 90.99%, representing the percentage of correctly labeled subjects; Specificity was 86.79%, which indicates the percentage of recovered outcome correctly predicted, and Sensitivity was 95.14%, representing the percentage of death outcome correctly identified.
In this way, it is possible to understand the importance of the Sensitivity metric. It is preferable to obtain a forecast that indicates if the patient is going to die, but that, in reality, ends up recovering, than to predict the opposite, since it can affect the decisions of health professionals. All the results obtained can be consulted in the Supplementary Materials—“Table S2—Classification Results”.
Therefore, the best results obtained for Patient outcome, where bold is the metrics that achieved the threshold, shown in Table 7—Metrics for Patient Outcome, were as follows:
As previously mentioned, the purpose of the project is to understand each patient’s outcome, positive or negative, based on their characteristics. Therefore, after a brief analysis of the results presented, the main outputs gathered are discussed in this section. Firstly, it is important to remember the threshold previously defined to find the best model for the project, which is defined by the following metrics (in order of importance):
- Sensitivity ≥ 90%;
- Accuracy ≥ 80%;
- Specificity ≥ 80%.
All values that managed to reach or exceed the defined threshold were marked in bold. That said, with the exception of models and , all the other models can be considered for the prediction of the outcome of a given patient. In general, the models present interesting results for Sensitivity, and the lowest values are obtained by scenario 6 (all comorbidities) and scenario 7 (all comorbidities and age). The models that obtained the best results, both in Sensitivity and in the other metrics, were and —which are associated with scenario 1 (All comorbidities, symptoms, age, and gender) and scenario 4 (All comorbidities, symptoms, and age). All models (except the two with the lowest results) were able to reach the stipulated threshold (since, for example, the Sensitivity value ranges from 91.41% to 95.20%). It is possible to notice that the more detailed the patient’s profile was, the higher the probability of the model obtaining better results. Another interesting point to draw from the results gathered is that for all models, the classification algorithm that showed the best metrics was T3—Decision Tree. Regarding the sampling methods, the method that presented the best results was Oversamplaing, being present in six of the eight models presented.
Therefore, the model is the best since it is the one that presents the best result in the Sensitivity metric (95.20%), and in the other metrics, it presents values higher than those of the defined threshold. This model uses the Decision Tree as a classification and oversampling technique for sampling technique.
6. Conclusions
This paper presents evidence that it is possible to predict the outcome of a specific patient infected with the SARS-CoV-2 virus using the characteristics indicated by the data provided, thus making it possible to assist clinicians at crucial decision-making moments. The article exposes the authors’ work from the moment of data collection and analysis to the implementation of the data in the modeling phase to extract knowledge from them.
The results were evaluated in terms of a collection of three metrics and in accordance with the thresholds established; however, priority was given to the Sensitivity metric. Six of the exposed models meet the threshold. This means that for the target under study—Patient’s outcome—health professionals will be able to predict the outcome, death, or recovery of a given patient. The model with the best results is since it presents the best result for the metric Sensitivity (95.20%) and the following metrics—Accuracy (90.67%) and Specificity (86.08%), while also showing positive values above the threshold. This model consists of scenario 4 (all comorbidities, symptoms, and age), decision tree technique, and sampling method oversampling.
These results indicate that clinicians use the predictions to understand the most likely outcome of the patients, which allows health professionals to make better decisions on how to act towards an infected patient. In terms of future work, the continuous reception and exploration of new records regarding patients infected by COVID-19 will allow the exploration of new patterns, techniques and broadcast the solution next to the medical community. Simultaneously, it will make possible the continuous improvement of the results obtained by the predictive models. Induced Models are part of the inference layer of the Clinical Decision Support System (CIDSS) developed and can be easily used by clinicians approved by the Institutions that use the platform.
The interested reader should consult the official page of the project (https://iocovid19.research.iotech.pt) for more information about future work to be developed, such as model optimization with the most recent data and the conclusion of the CIDSS deployment.
Supplementary Materials
The following are available online at https://www.mdpi.com/article/10.3390/fi13040102/s1, Table S1: Dataset analysis, Table S2: Patient’s Outcome results.
Author Contributions
Conceptualization, F.P. and J.V.; methodology, C.F.; validation, F.P., J.V. and C.F.; formal analysis, A.T.F.; investigation, A.T.F., C.F., J.V. and F.P.; resources, F.P.; data curation, A.T.F., J.V., C.F.; writing—original draft preparation, A.T.F.; writing—review and editing, F.P.; visualization, A.T.F.; supervision, F.P.; project administration, F.P.; funding acquisition, F.P. All authors have read and agreed to the published version of the manuscript.
Funding
This research was funded by Portugal 2020 program through NORTE-01-02B7-FEDER-048344.
Data Availability Statement
The data presented in this study are available on request from the corresponding author. The data are not publicly available due to being the property of the Ministry of Health.
Acknowledgments
We acknowledge the Portuguese Directorate-General of Health for providing us access to the COVID-19 Clinical Dataset.
Conflicts of Interest
The authors declare no conflict of interest. The funders had no role in the design of the study; in the collection, analyses, or interpretation of data; in the writing of the manuscript, or in the decision to publish the results.
References
- Ferreira, T.; Fernandes, C.; Vieira, J.; Portela, F. The clinical reality of COVID19 in Portugal—A clustering analysis. Unpublished.
- DGS. Perguntas Frequentes. Available online: https://covid19.min-saude.pt/category/perguntas-frequentes/ (accessed on 13 December 2020).
- DGS. Relatório de Situação. Available online: https://covid19.min-saude.pt/relatorio-de-situacao/ (accessed on 6 April 2021).
- Óbitos por Algumas Causas de Morte (%). Available online: https://www.pordata.pt/Portugal/%C3%93bitos+por+algumas+causas+de+morte+(percentagem)-758 (accessed on 29 March 2021).
- Nascimento, F. Risco de morrer por Covid-19 em Portugal está entre 0,7 e 2 por cento. Available online: https://www.tsf.pt/portugal/sociedade/risco-de-morrer-por-covid-19-em-portugal-esta-entre-07-e-2-por-cento-13489927.html (accessed on 4 April 2021).
- Han, J.; Kamber, M.; Pei, J. Data Mining: Concepts and Techniques; Morgan Kaufmann: Oxford, UK, 2012; pp. 12–18. [Google Scholar]
- Nu Phyu, T. Survey of Classification Techniques in Data Mining. IMECS 2009, 1, 1. [Google Scholar]
- Bradley, A.P. The Use of the Area under the ROC Curve in the Evaluation of Machine Learning Algorithms. Pattern Recognit. 1997, 30, 1145–1159. [Google Scholar] [CrossRef] [Green Version]
- Visa, S.; Ramsay, B.; Ralescu, A.L.; Van Der Knaap, E. Confusion Matrix-based Feature Selection. MAICS 2011, 710, 120–127. [Google Scholar]
- Agarwal, R. The 5 Classification Evaluation Metrics Every Data Scientist Must Know. Available online: https://towardsdatascience.com/the-5-classification-evaluation-metrics-you-must-know-aa97784ff226 (accessed on 4 April 2021).
- Portela, F.; Santos, M.F.; Machado, J.; Abelha, A.; Silva, Á.; Rua, F. Pervasive and Intelligent Decision Support in Intensive Medicine—The Complete Picture. In Information Technology in Bio- and Medical Informatics; Springer International Publishing: Cham, Switzerland, 2014; pp. 87–102. [Google Scholar]
- Veloso, R.; Portela, F.; Filipe Santos, M.; Silva, Á.; Rua, F.; Abelha, A.; Machado, J. Using Domain Knowledge to Improve Intelligent Decision Support in Intensive Medicine—A Study of Bacteriological Infections. In Proceedings of the International Conference on Agents and Artificial Intelligence, Lisbon, Portugal, 10–12 January 2015. [Google Scholar]
- Hu, C.; Liu, Z.; Jiang, Y.; Shi, O.; Zhang, X.; Xu, K.; Suo, C.; Wang, Q.; Song, Y.; Yu, K.; et al. Early Prediction of Mortality Risk among Patients with Severe COVID-19, Using Machine Learning. Int. J. Epidemiol. 2021, 49, 1918–1929. [Google Scholar] [CrossRef] [PubMed]
- Nogueira, P.J.; de Araújo Nobre, M.; Costa, A.; Ribeiro, R.M.; Furtado, C.; Bacelar Nicolau, L.; Camarinha, C.; Luís, M.; Abrantes, R.; Vaz Carneiro, A. The Role of Health Preconditions on COVID-19 Deaths in Portugal: Evidence from Surveillance Data of the First 20293 Infection Cases. J. Clin. Med. 2020, 9, 2368. [Google Scholar] [CrossRef] [PubMed]
- Fernandes, G. Pervasive Data Science Applied to the Services Society. Master’s Thesis, University of Minho, Guimarães, Portugal, 2019. [Google Scholar]
- Wirth, R.; Hipp, J. CRISP-DM: Towards a standard process model for data mining. In Proceedings of the 4th International Conference on the Practical Applications of Knowledge Discovery and Data Mining, Manchester, UK, 1–13 April 2000. [Google Scholar]
- McKinney, W. Python for Data Analysis: Data Wrangling with Pandas, Numpy, and Ipython, 2nd ed.; O’Reilly Media: Newton, MA, USA, 2017; pp. 3–4. [Google Scholar]
- Pedregosa, F.; Varoquaux, G.; Gramfort, A.; Michel, V.; Thirion, B.; Grisel, O.; Blondel, M.; Prettenhofer, P.; Weiss, R.; Dubourg, V.; et al. Scikit-Learn: Machine Learning in Python. Available online: https://jmlr.org/papers/volume12/pedregosa11a/pedregosa11a.pdf (accessed on 20 April 2021).
- Fandango, A. Mastering TensorFlow 1.x: Advanced Machine Learning and Deep Learning Concepts Using TensorFlow 1.x and Keras; Packt Publishing: Birmingham, UK, 2018. [Google Scholar]
- Li, S. Building A Logistic Regression in Python, Step by Step. Available online: https://towardsdatascience.com/building-a-logistic-regression-in-python-step-by-step-becd4d56c9c8 (accessed on 4 April 2021).
- Vijayarani, S.; Muthulakshmi, M. Comparative analysis of bayes and lazy classification algorithms. Int. J. Adv. Res. Comput. Commun. Eng. 2013, 2, 3118–3124. [Google Scholar]
- Yıldırım, S. Naive Bayes Classifier—Explained—Towards Data Science. Available online: https://towardsdatascience.com/naive-bayes-classifier-explained-50f9723571ed (accessed on 4 April 2021).
- Saritas, M.M. Performance Analysis of ANN and Naive Bayes Classification Algorithm for Data Classification. Int. J. Intell. Syst. Appl. Eng. 2019, 7, 88–91. [Google Scholar] [CrossRef] [Green Version]
- Decision Trees—Scikit-Learn 0.24.1 Documentation. Available online: https://scikit-learn.org/stable/modules/tree.html (accessed on 4 April 2021).
- Song, Y.-Y.; Lu, Y. Decision Tree Methods: Applications for Classification and Prediction. Shanghai Arch. Psychiatry 2015, 27, 130–135. [Google Scholar] [PubMed]
- Sklearn.Tree.DecisionTreeClassifier—Scikit-Learn 0.24.1 Documentation. Available online: https://scikit-learn.org/stable/modules/generated/sklearn.tree.DecisionTreeClassifier.html (accessed on 4 April 2021).
- Sklearn.Model_Selection. GridSearchCV—Scikit-Learn 0.24.1 Documentation. Available online: https://scikit-learn.org/stable/modules/generated/sklearn.model_selection.GridSearchCV.html (accessed on 4 April 2021).
- Chen, H.; Engkvist, O.; Wang, Y.; Olivecrona, M.; Blaschke, T. The Rise of Deep Learning in Drug Discovery. Drug Discov. Today 2018, 23, 1241–1250. [Google Scholar] [CrossRef] [PubMed]
- Goodfellow, I.; Bengio, Y.; Courville, A. Deep Learning; MIT Press: London, UK, 2016. [Google Scholar]
- Omid, M.; Mahmoudi, A.; Omid, M.H. Development of Pistachio Sorting System Using Principal Component Analysis (PCA) Assisted Artificial Neural Network (ANN) of Impact Acoustics. Expert Syst. Appl. 2010, 37, 7205–7212. [Google Scholar] [CrossRef]
- Zhu, T.; Lin, Y.; Liu, Y. Synthetic Minority Oversampling Technique for Multiclass Imbalance Problems. Pattern Recognit. 2017, 72, 327–340. [Google Scholar] [CrossRef]
- Lin, W.-C.; Tsai, C.-F.; Hu, Y.-H.; Jhang, J.-S. Clustering-Based Undersampling in Class-Imbalanced Data. Inf. Sci. 2017, 409–410, 17–26. [Google Scholar] [CrossRef]
- Singh, S. Sampling Techniques. Available online: https://towardsdatascience.com/sampling-techniques-a4e34111d808 (accessed on 5 April 2021).
- Moro, S.; Laureano, R.; Cortez, P. ESM’2011. The European Simulation and Modelling Conference; EUROSIS-ETI: Oostende, Belgium, 2011. [Google Scholar]
- Fernandes, C. Smart Cities—Otimização inteligente de parques de estacionamento. Master’s Thesis, University of Minho, Guimarães, Portugal, 2020. [Google Scholar]
- Cross-Validation: Evaluating Estimator Performance—Scikit-Learn 0.24.1 Documentation. Available online: https://scikit-learn.org/stable/modules/cross_validation.html (accessed on 4 April 2021).
- Sklearn.Model_Selection.StratifiedKFold—Scikit-Learn 0.24.1 Documentation. Available online: https://scikit-learn.org/stable/modules/generated/sklearn.model_selection.StratifiedKFold.html (accessed on 4 April 2021).
- Ferreira, T.; Fernandes, C.; Vieira, J.; Portela, F. A Pervasive Clinical Intelligent Decision Support System to predict COVID-19 patients’ outcome. 2021; Unpublished. [Google Scholar]
Figure 1.
Project Workflow.

Figure 2.
Records General Information.

Figure 3.
Comorbidities Distribution.


Table 1.
Confusion Matrix.
| Actual Values | |||
|---|---|---|---|
| True | False | ||
| Predicted Values | Positive | True Positive | False Positive |
| Negative | False Negative | True Negative | |
Table 2.
Crossover of CRISP-DM and DSR methodologies.
| Methodology | Activities | DSR Phases | |||||
|---|---|---|---|---|---|---|---|
| 1 | 2 | 3 | 4 | 5 | 6 | ||
| CRISP-DM | Business Understanding | X | X | ||||
| Data Understanding | X | X | |||||
| Data Preparation | X | ||||||
| Modeling | X | ||||||
| Evaluation | X | X | |||||
| Deployment | X | X | |||||
Table 3.
Decision Tree hyperparameters settings.
| Parameter | Assumed Value |
|---|---|
| max_depth | 20 |
Table 4.
Deep learning hyperparameters settings.
| Parameter | Assumed Value |
|---|---|
| batch_size | 64 |
| callback | EarlyStopping |
| epochs | 20 |
Table 5.
Distribution of cases using Oversampling.
| Targets | Replicated | Before | After | ||
|---|---|---|---|---|---|
| Number of Cases | Percentage of Cases | Number of Cases | Percentage of Cases | ||
| Patients who died | 50 | 14,667 | 1.98% | 733,350 | 50.3% |
| Patients infected/recovered | 0 | 724,630 | 98.02% | 724,630 | 49.7% |
Table 6.
Distribution of cases using Undersampling.
| Targets | Before | After | ||
|---|---|---|---|---|
| Number of Cases | Percentage of Cases | Number of Cases | Percentage of Cases | |
| Patients who died | 14,667 | 1.98% | 14,667 | 50.0% |
| Patients infected/recovered | 724,630 | 98.02% | 14,667 | 50.0% |
Table 7.
Metrics for Patient Outcome.
| Model | Accuracy | Specificity | Sensitivity |
|---|---|---|---|
| 90.99% | 86.79% | 95.14% | |
| 88.94% | 84.43% | 93.39% | |
| 88.91% | 84.60% | 93.16% | |
| 90.67% | 86.08% | 95.20% | |
| 87.66% | 82.19% | 93.12% | |
| 58.72% | 96.80% | 21.08% | |
| 88.13% | 84.80% | 91.41% | |
| 60.86% | 97.00% | 24.74% |
Publisher’s Note: MDPI stays neutral with regard to jurisdictional claims in published maps and institutional affiliations. |
© 2021 by the authors. Licensee MDPI, Basel, Switzerland. This article is an open access article distributed under the terms and conditions of the Creative Commons Attribution (CC BY) license (https://creativecommons.org/licenses/by/4.0/).
Share and Cite
MDPI and ACS Style
Ferreira, A.T.; Fernandes, C.; Vieira, J.; Portela, F. Pervasive Intelligent Models to Predict the Outcome of COVID-19 Patients. Future Internet 2021, 13, 102. https://doi.org/10.3390/fi13040102
AMA Style
Ferreira AT, Fernandes C, Vieira J, Portela F. Pervasive Intelligent Models to Predict the Outcome of COVID-19 Patients. Future Internet. 2021; 13(4):102. https://doi.org/10.3390/fi13040102
Chicago/Turabian StyleFerreira, Ana Teresa, Carlos Fernandes, José Vieira, and Filipe Portela. 2021. "Pervasive Intelligent Models to Predict the Outcome of COVID-19 Patients" Future Internet 13, no. 4: 102. https://doi.org/10.3390/fi13040102
Note that from the first issue of 2016, this journal uses article numbers instead of page numbers. See further details here.