
Stiffness Analysis to Predict the Spread Out of Fake Information


1
Department of Information Engineering and Computer Science and Mathematics, University of L’Aquila, 67100 L’Aquila, Italy
2
Department of Mathematics, University of Salerno, 84084 Fisciano, Italy
3
Department of Economic and Legal Studies, University “Parthenope” of Naples, 80133 Naples, Italy
*
Author to whom correspondence should be addressed.
Future Internet 2021, 13(9), 222; https://doi.org/10.3390/fi13090222
Submission received: 23 July 2021
/
Revised: 20 August 2021
/
Accepted: 27 August 2021
/
Published: 28 August 2021
(This article belongs to the Section Internet of Things)
Abstract
:This work highlights how the stiffness index, which is often used as a measure of stiffness for differential problems, can be employed to model the spread of fake news. In particular, we show that the higher the stiffness index is, the more rapid the transit of fake news in a given population. The illustration of our idea is presented through the stiffness analysis of the classical SIR model, commonly used to model the spread of epidemics in a given population. Numerical experiments, performed on real data, support the effectiveness of the approach.
1. Introduction
The birth of the Internet, and in particular of social media, has radically changed the way we transmit news. In fact, nowadays, the majority of the population considers the Internet and social media as the main channels of transmitting news. However, at the same time, social media are also believed to be the main sources of transmission of disinformation and fake news [1,2,3,4,5,6,7,8,9,10,11,12,13,14,15,16,17,18].
Fake news is created by completely ignoring the editorial rules and processes used to ensure its compliance and truthfulness [19]. Actually, it is created for different purposes; the most common is certainly the electoral one in order to discredit a political opponent by conditioning public opinion. The other purpose is the profit that is obtained online in proportion to the number of visitors to the article.
The problem of the spread of fake news has always existed, but what seems to have clearly changed, compared to the past, is the quantity of fake news present in the information and the weight they take on. Therefore, the truthfulness of the news we receive online is a problem that requires great attention [20].
In recent years, many authors have tried to create adequate mathematical models capable of predicting the spread of fake news, in order to limit in advance the effects that the spread of these are having on our society: the interested reader can refer, for instance, to [12,21,22,23,24,25,26,27,28,29] and references therein.
In this article, we use a famous model for the spread of a disease, i.e., the SIR model, as a model for fake news diffusion. SIR model, well known in the existing literature of mathematical epidemiology (see, for instance, the very first contributions on compartmental models [30,31,32,33,34], as well as the monographs [35,36,37,38,39,40,41,42] and references therein), describes the effects of the spread out of an epidemics in a population ideally divided into three subgroups (susceptible, infected and recovered people). As is visible in the literature (see, for instance, [19,23,43,44]), epidemiological models can be profitably used to describe the diffusion of fake information as an infectious disease. Most of these models are given by nonlinear differential equations, whose dynamics can be understood first looking at the eigenvalues of the Jacobian of the linearized problem. Here, we show how the spread of fake news is closely linked to the stiffness ratio (i.e., the ratio between the largest and the smallest moduli of the eigenvalues of the aforementioned Jacobian matrix) that characterizes the underlying differential problem. We highlight that, in the spirit of this manuscript, the SIR model is only the channel we use to provide our idea: the stiffness ratio can help us understand the requested time to recover the truth in a given country exposed to a certain fake news. To some extent, we aim to provide a novel element to understand the effectiveness of modeling for the diffusion of fake news, as well as to the re-establishment of the truth: the higher the stiffness ratio, the faster the re-establishment of the truth after the diffusion of fake information. This kind of argument is not advisable in the literature, to the best of our knowledge. The work is organized as follows: Section 2 will describe the stiffness analysis of the SIR model for fake news diffusion; Section 3 is dedicated to numerical tests, performed on real data, confirming our thesis; and some concluding remarks are given in Section 4.
2. Stiffness Analysis of the SIR Model for the Diffusion of Fake Information
As aforementioned, the SIR model was first introduced in 1927 by Kermack and McKendrick [31], even if seminal contributions on compartmental models are also advisable in [30,32,33,34]. It represents an extremely simple mathematical model for describing the transmission of an infectious disease. This model describes the mutual interactions of three populations of individuals: the population S of susceptible people, i.e., the healthy individuals who can contract the disease; the population I of the infected, i.e., individuals who have contracted the disease and are able to transmit it; and the population R of the recovered, that is, individuals who are healed.
In our model for the spread of fake information, above populations are described as follows:
- : potentially authoring the spreading of fake news;
- : the wide variety of authors highly active in posting fake information;
- : authors who are inactive to the spreading of fake news.
The model is based on the continuous interaction between susceptible and infected individuals along time. The corresponding system of ODEs is then given by:
where is the rate of recovery and the contact rate. Specifically, since the purpose of our method is to compare the impact of fake news in different countries, the parameters and , are related to two important indices, commonly used to describe the social, economic and cultural performance of our society. In particular,
where i is the internet penetration index of the country and h is the human development index of the same country. These values are commonly provided in the annual report of United Nations Development Programme [45] (also see the projects [46,47]). In general, the value of is smaller than that of because it is easier to spread a lie than reaffirming the truth. Table 1 shows, for instance, the values of and for selected countries, i.e., Australia, Brazil, France, India, Italy, Mexico, Mozambique and the USA, referring to the year 2019.
Remark 1.
It is crucial to highlight the different power of the denial of a fake news and that of the fake news itself [48]. Fake information circulates online much faster than true one and is more prone to be shared by users who encounter it; on the other hand, the re-assessment of the truth is nowhere viral and reaches far fewer people than those who have read or spread fake information. Due to this intrinsic characteristic of true news compared to false news, the former require a much greater commitment on the part of individual users than that related to the spread of fake news. Above all, the spread out of fake information does not necessarily require a particularly strong human presence: often fake news are circulated by bots created specifically by someone or shared by fake accounts, so they do not correspond to real people. Real people, on the other hand, are necessary and represent the only option to restore the truth. This motivates the choice of the recovery rate α linked to human development index per country and the contact rate β to the spread of the internet in the same country.
In our analysis, it is relevant to consider a linearization around the initial value vector
leading to
Correspondingly, let us compute the Jacobian matrix of the linear part of the vector field in (2), i.e.,
whose spectrum consists in one eigenvalue equal to 0 and two real eigenvalues and , with . Correspondingly, the ratio
meaningful in the analysis of stiff problems [49], provides the so-called stiffness ratio of (1). Table 2 reports the stiffness ratio for each country, related to the initial value
i.e., assuming that 70% of the initial population is susceptible, 10% are infected and there are no recovered people. The results reveal that, the higher the internet penetration index i, the bigger the stiffness ratio. As a consequence, the corresponding model (1) is more stiff and the spread of fake news should be more damped in time. In other terms, the more (1) is stiff, the more the corresponding country exhibits a faster transit of fake news. Countries with a lower internet penetration index i are characterized by a less stiff model and, as a consequence, the transit of fake information is slower and circulates for much more time.
3. Numerical Experiments and Conclusions
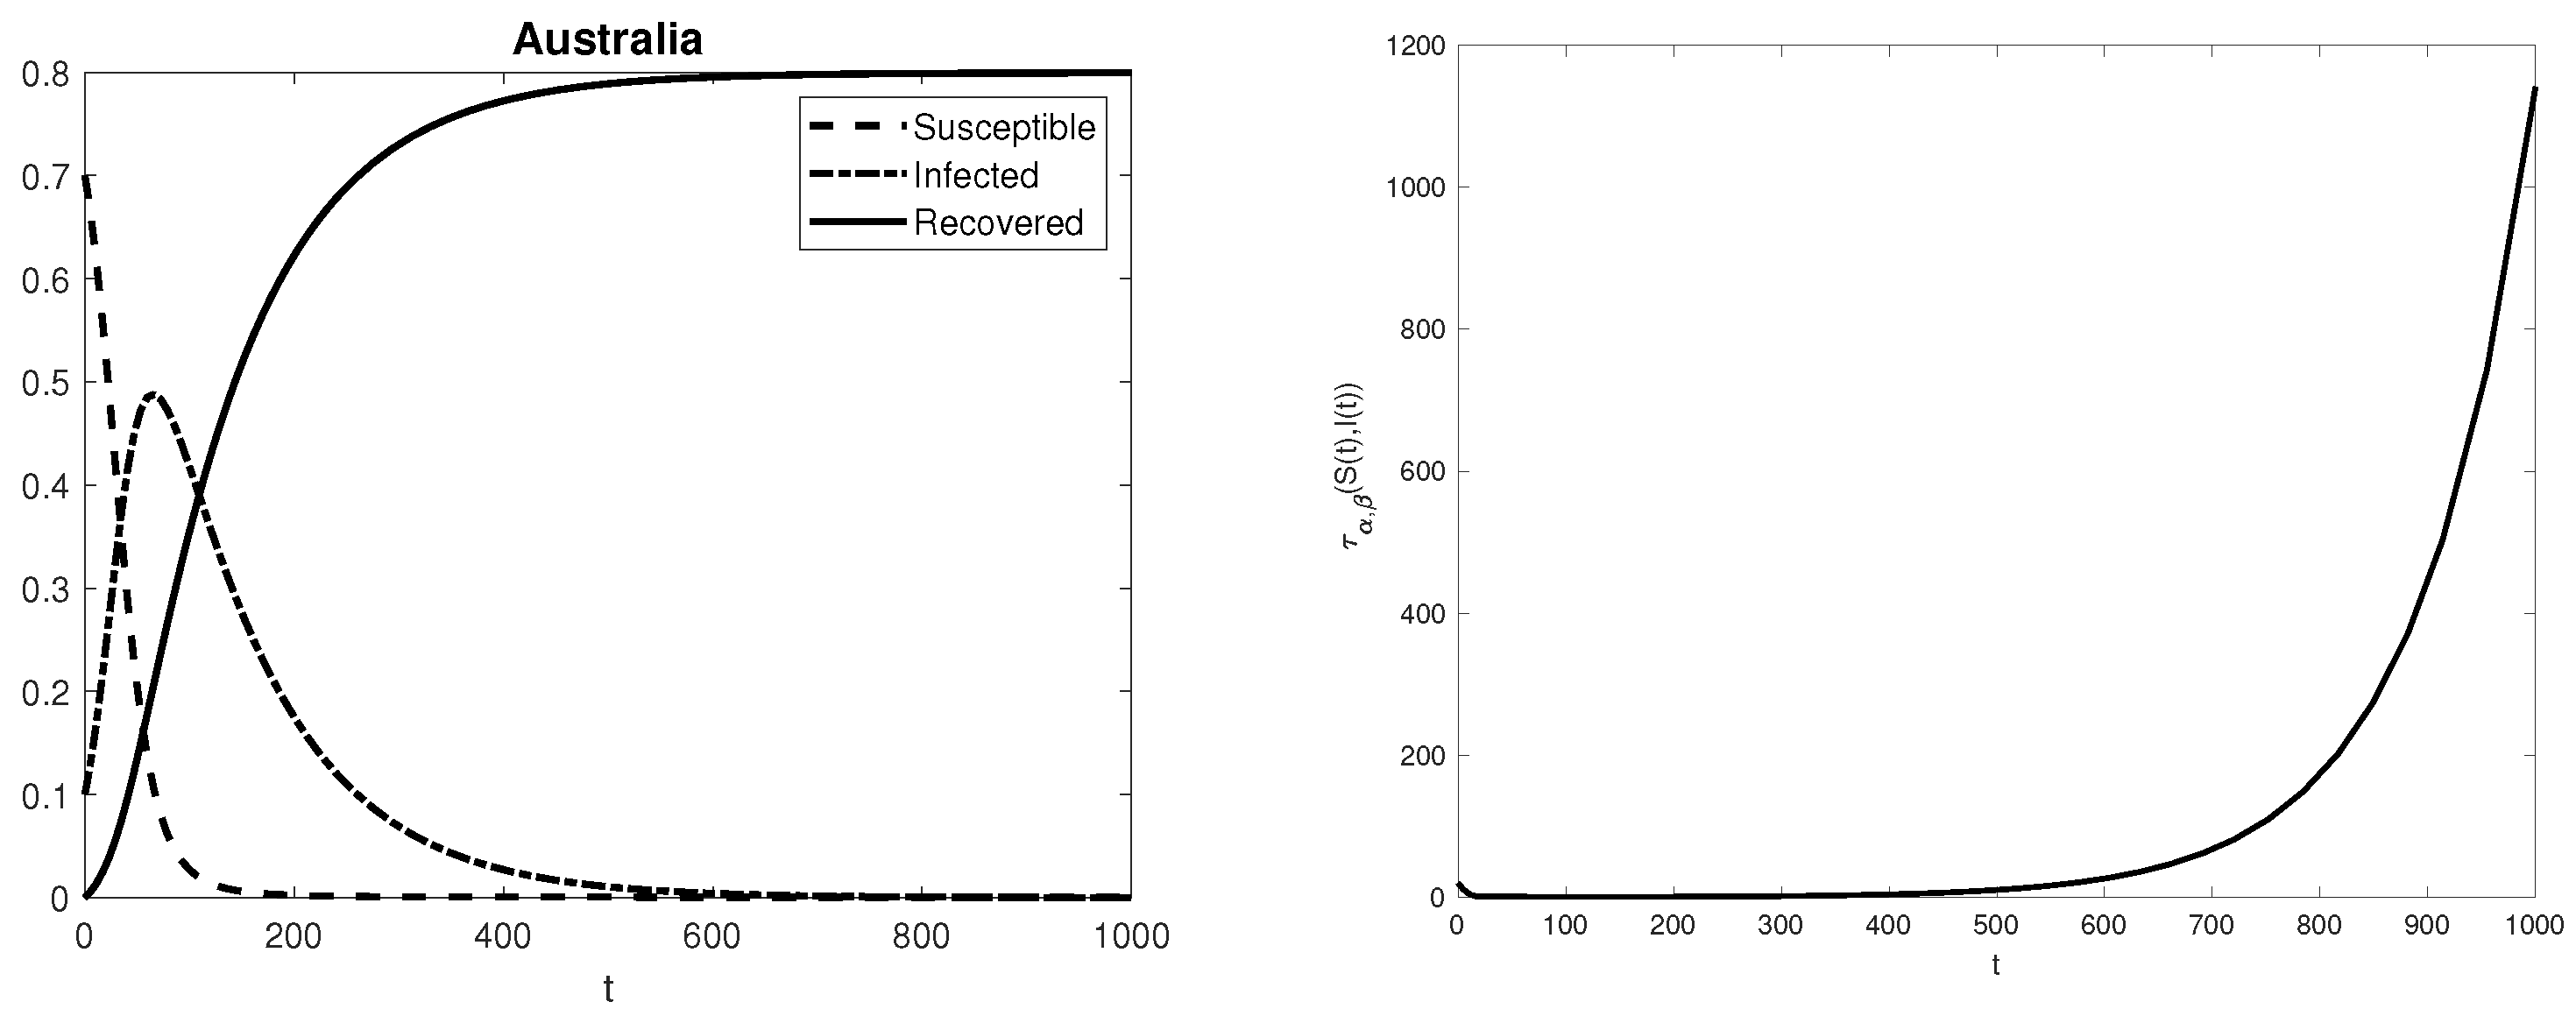
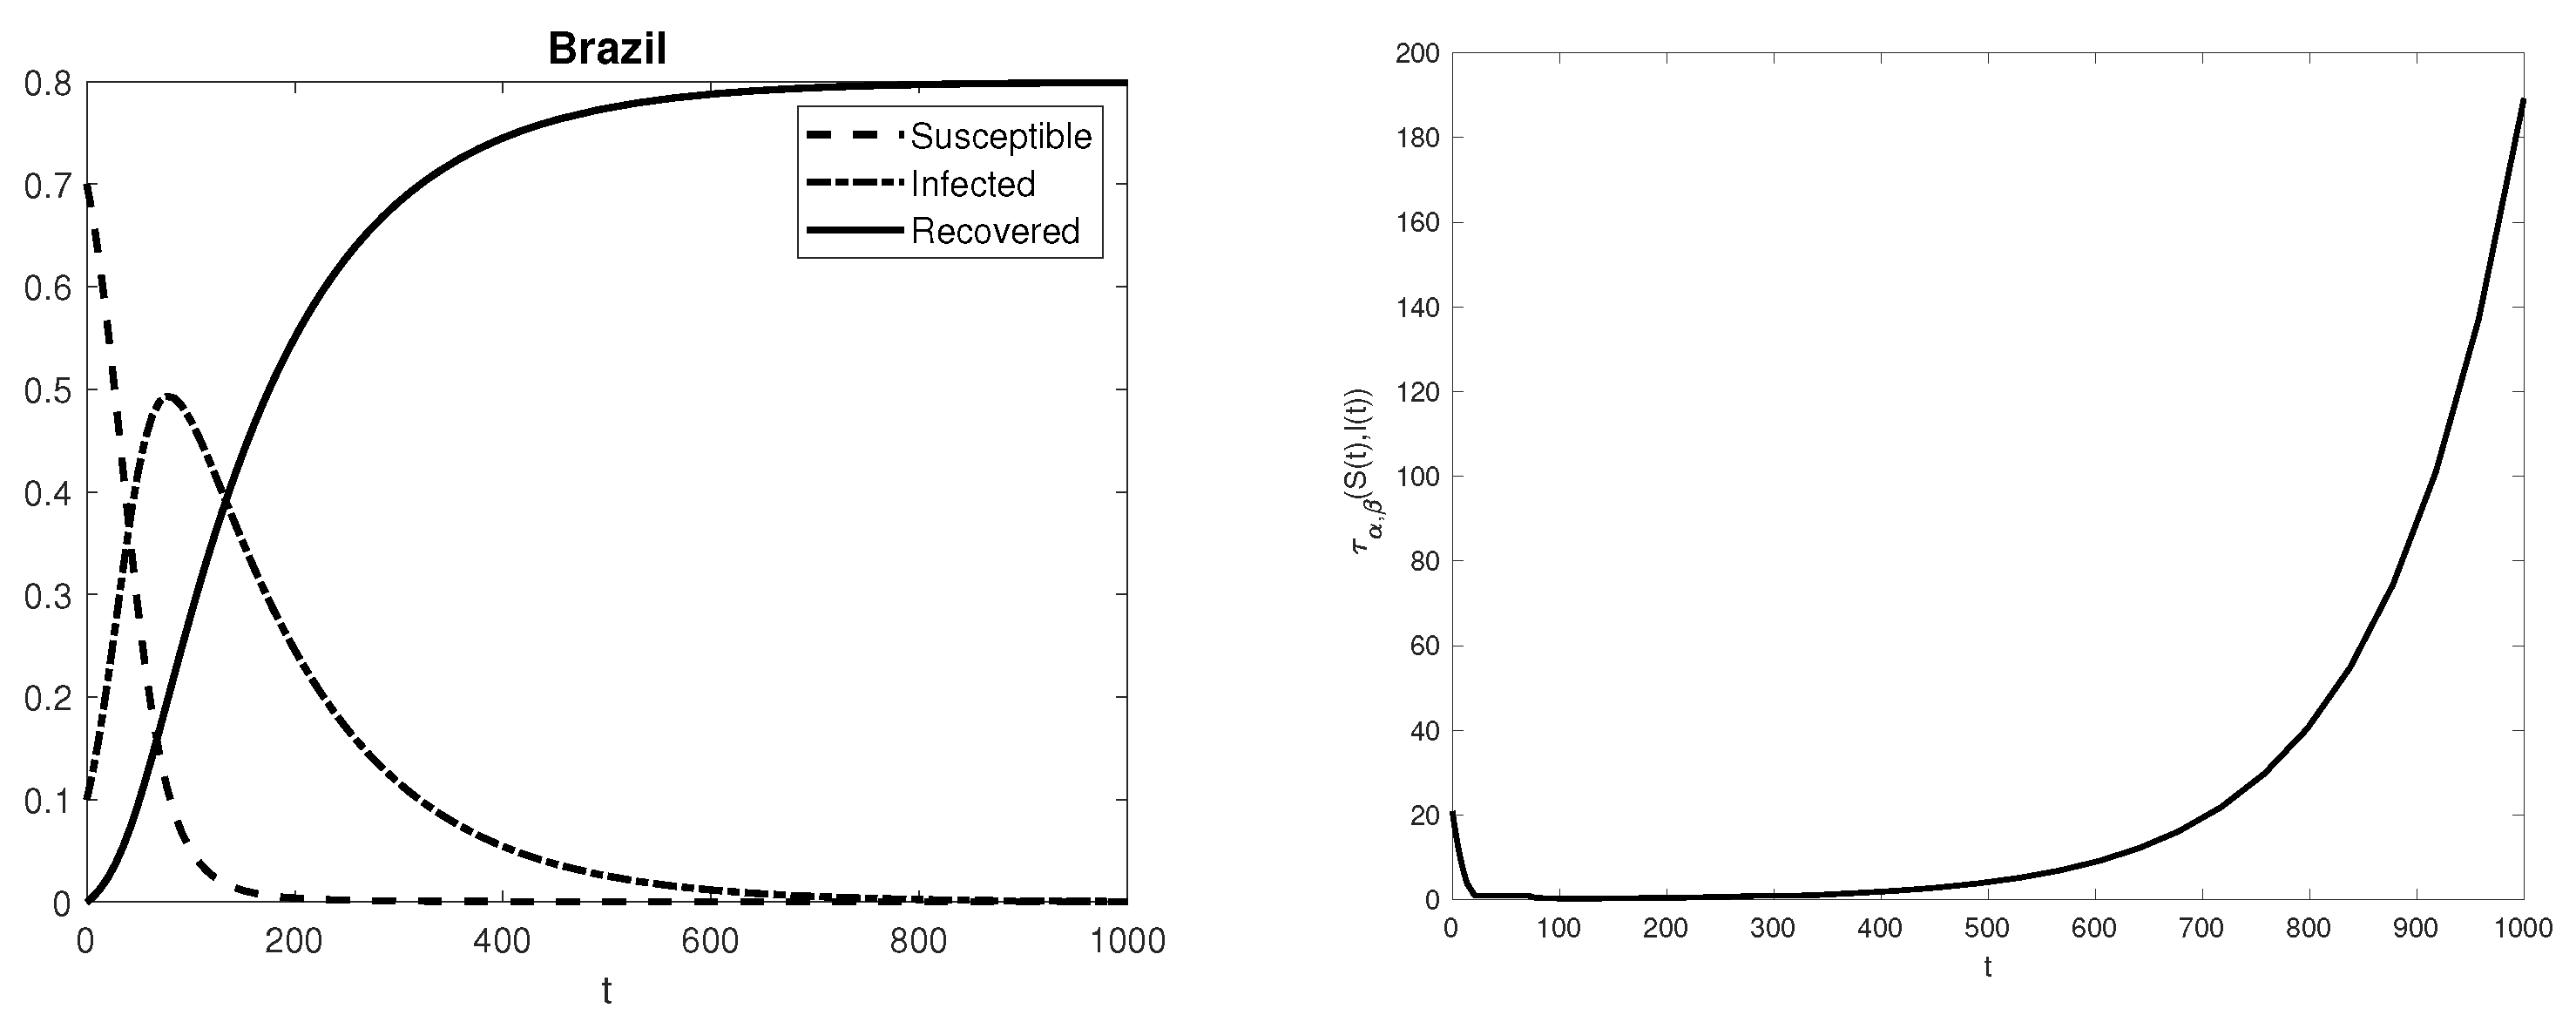
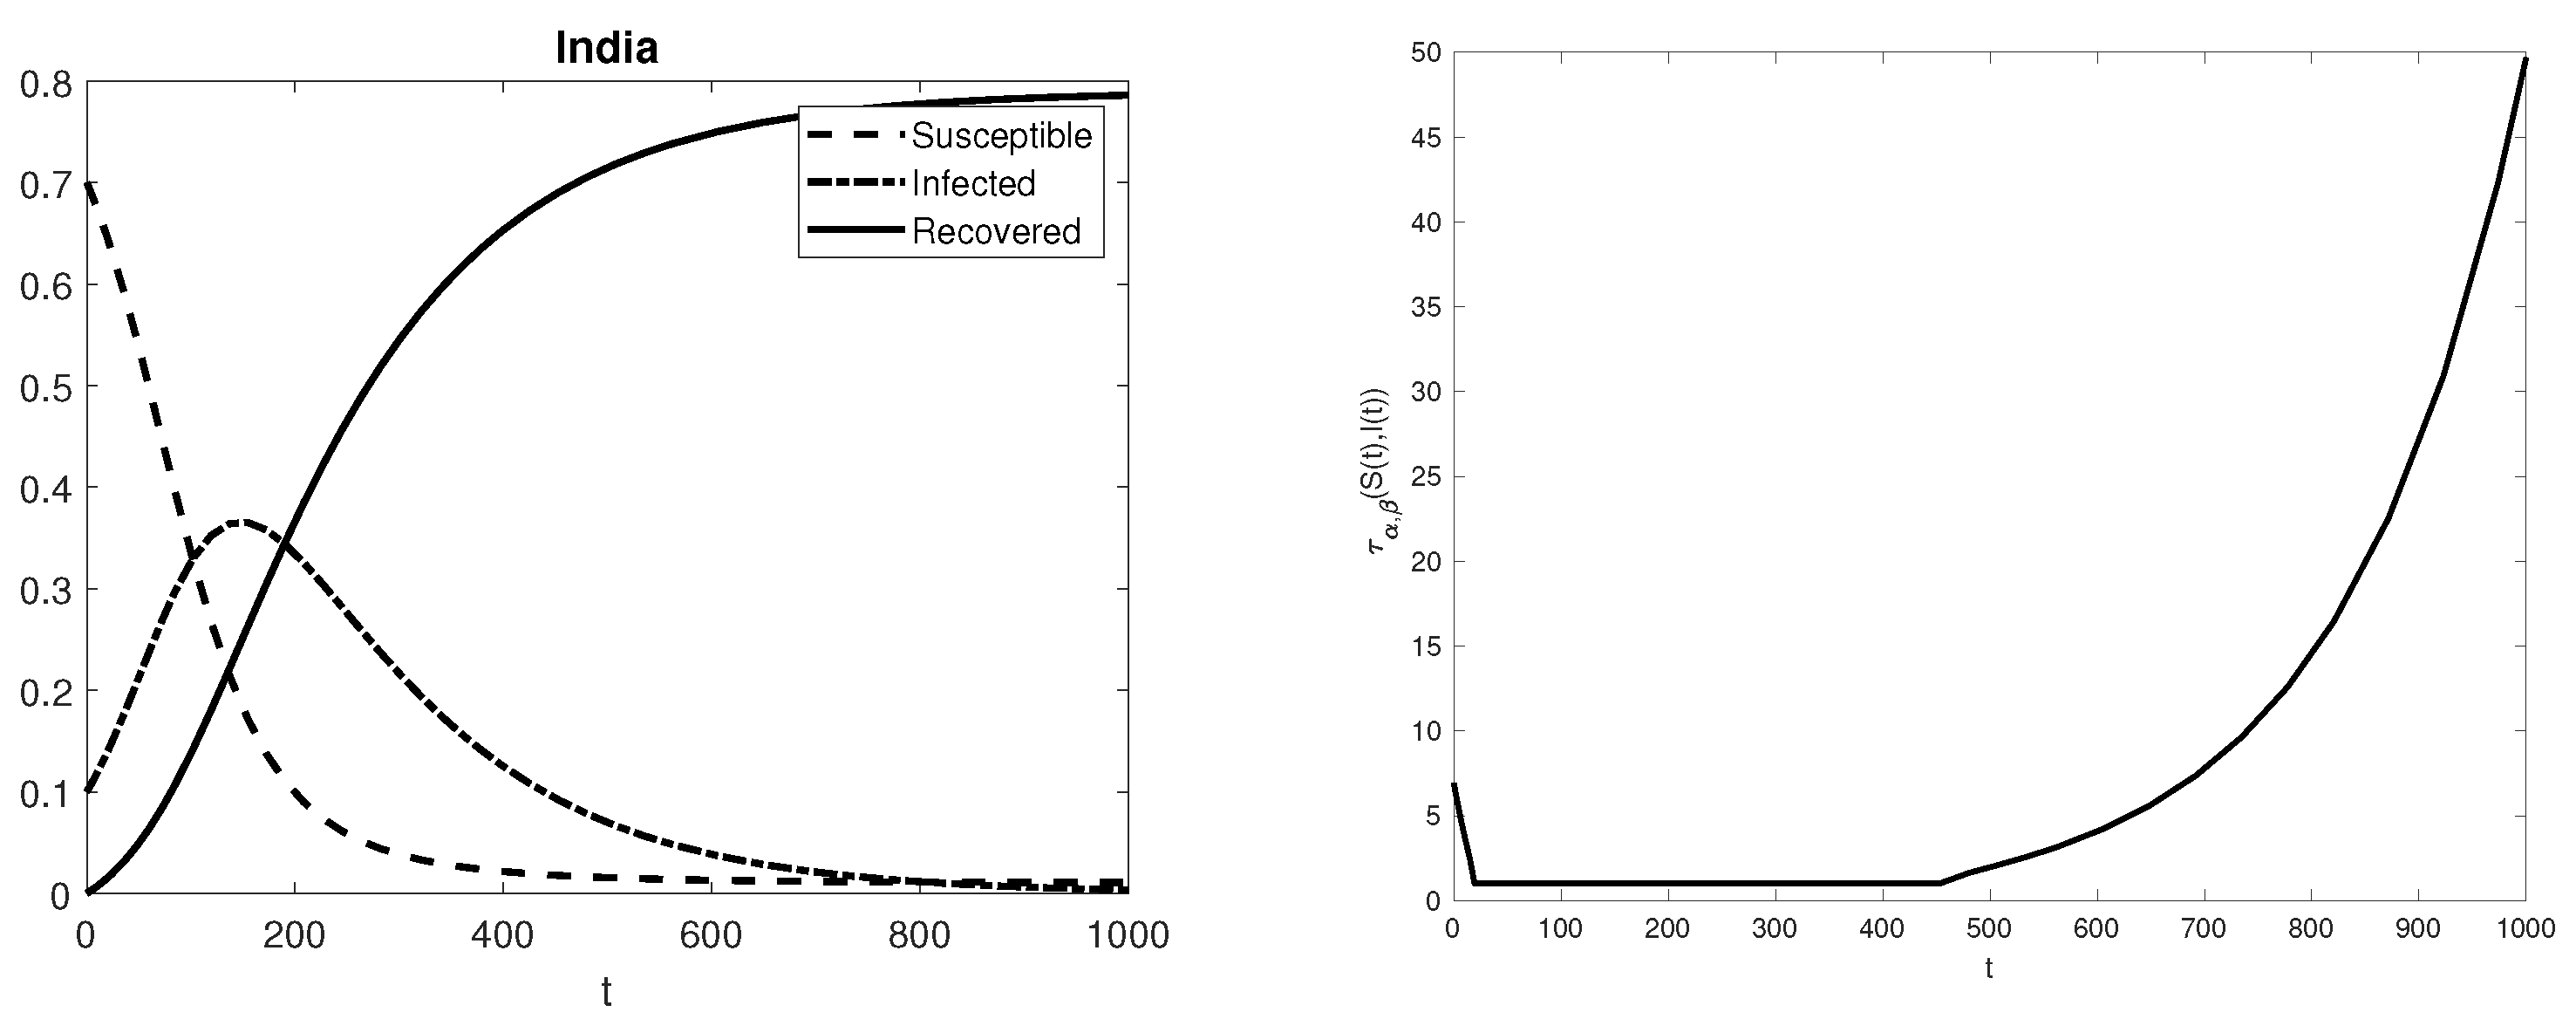
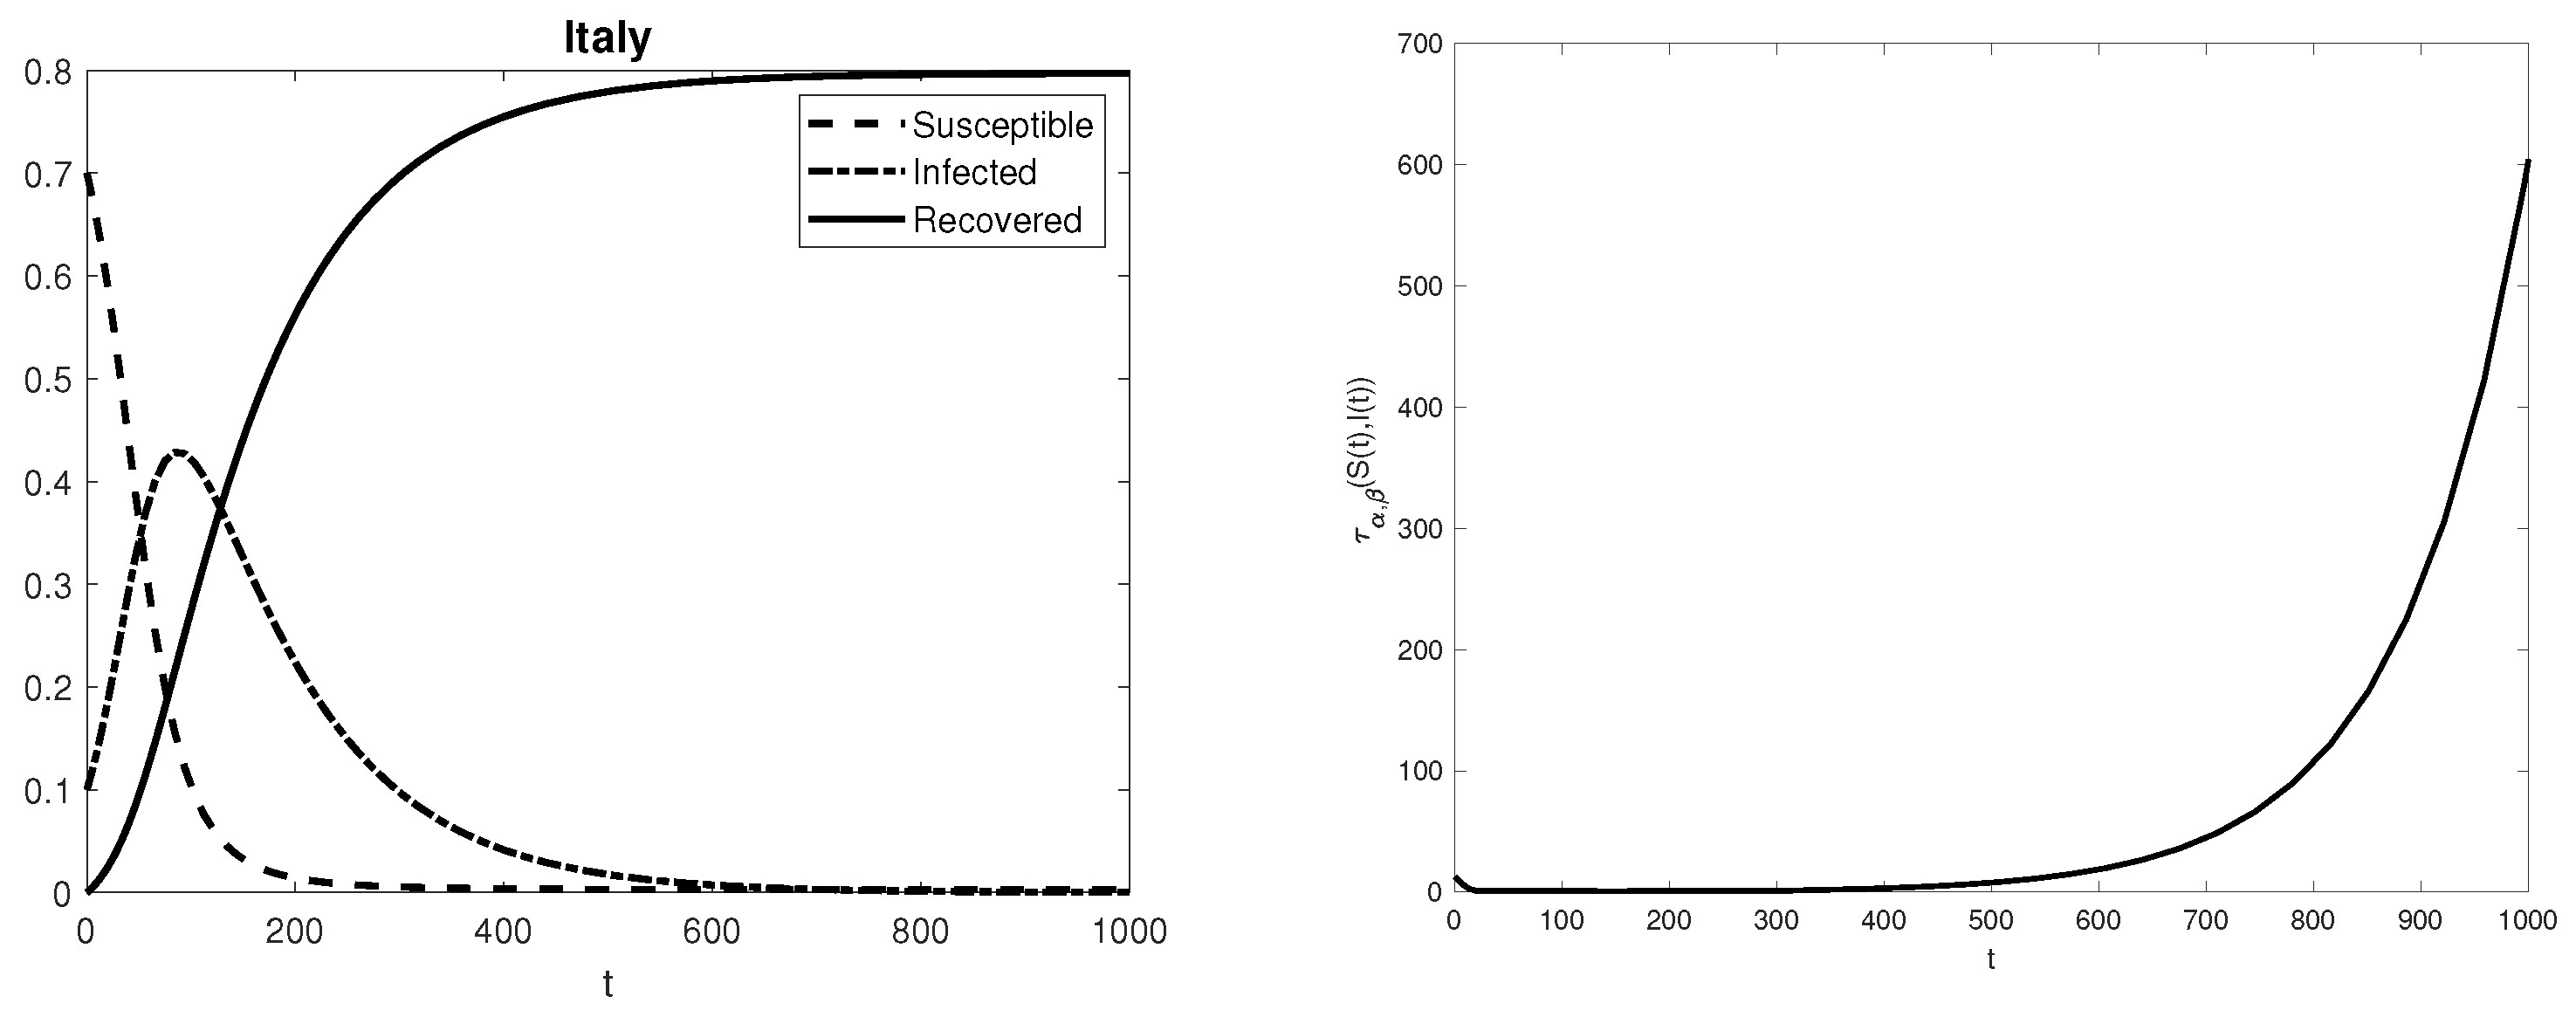
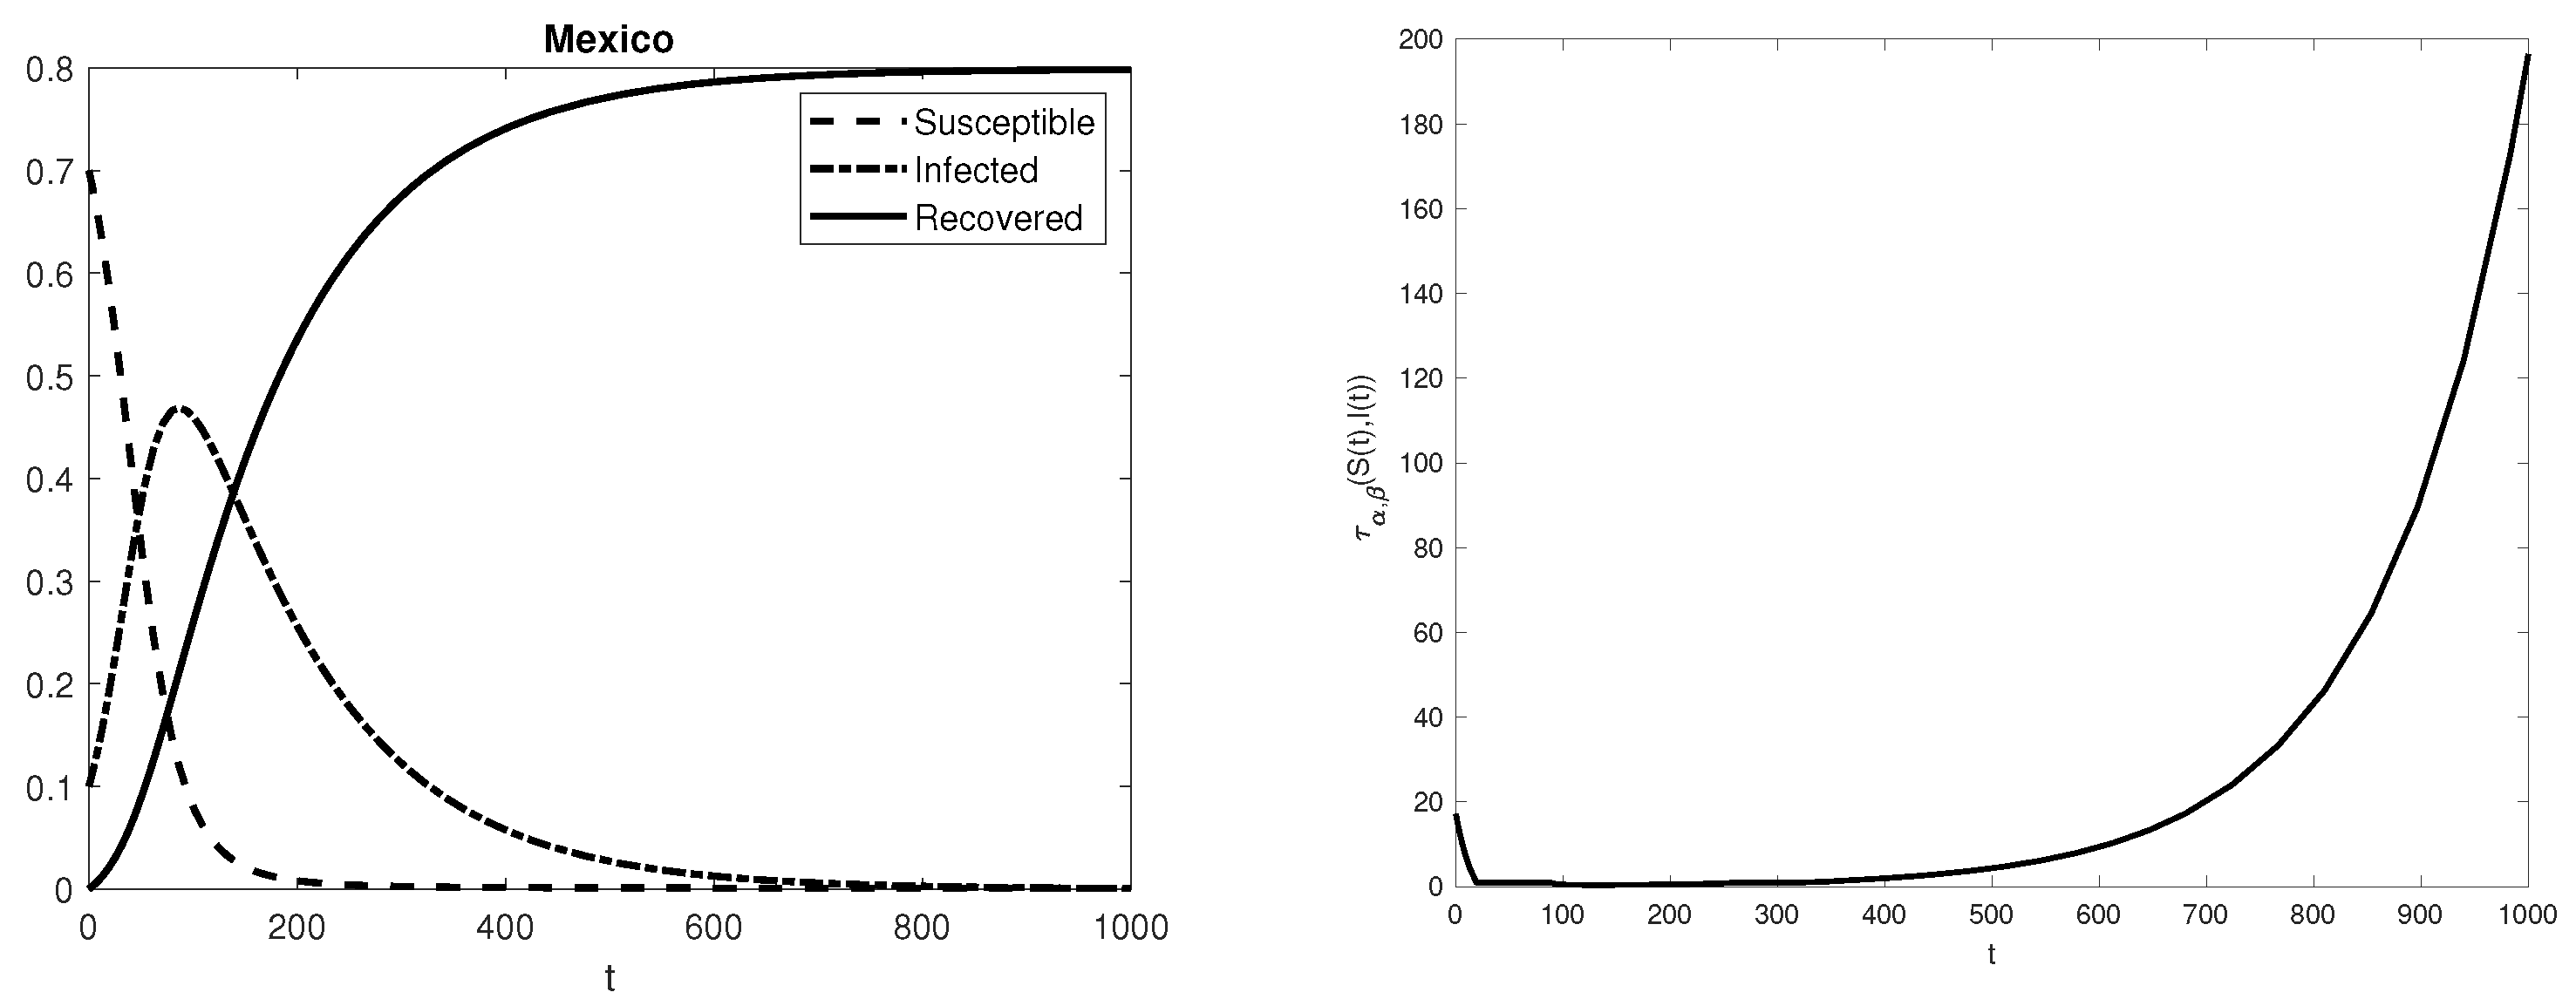
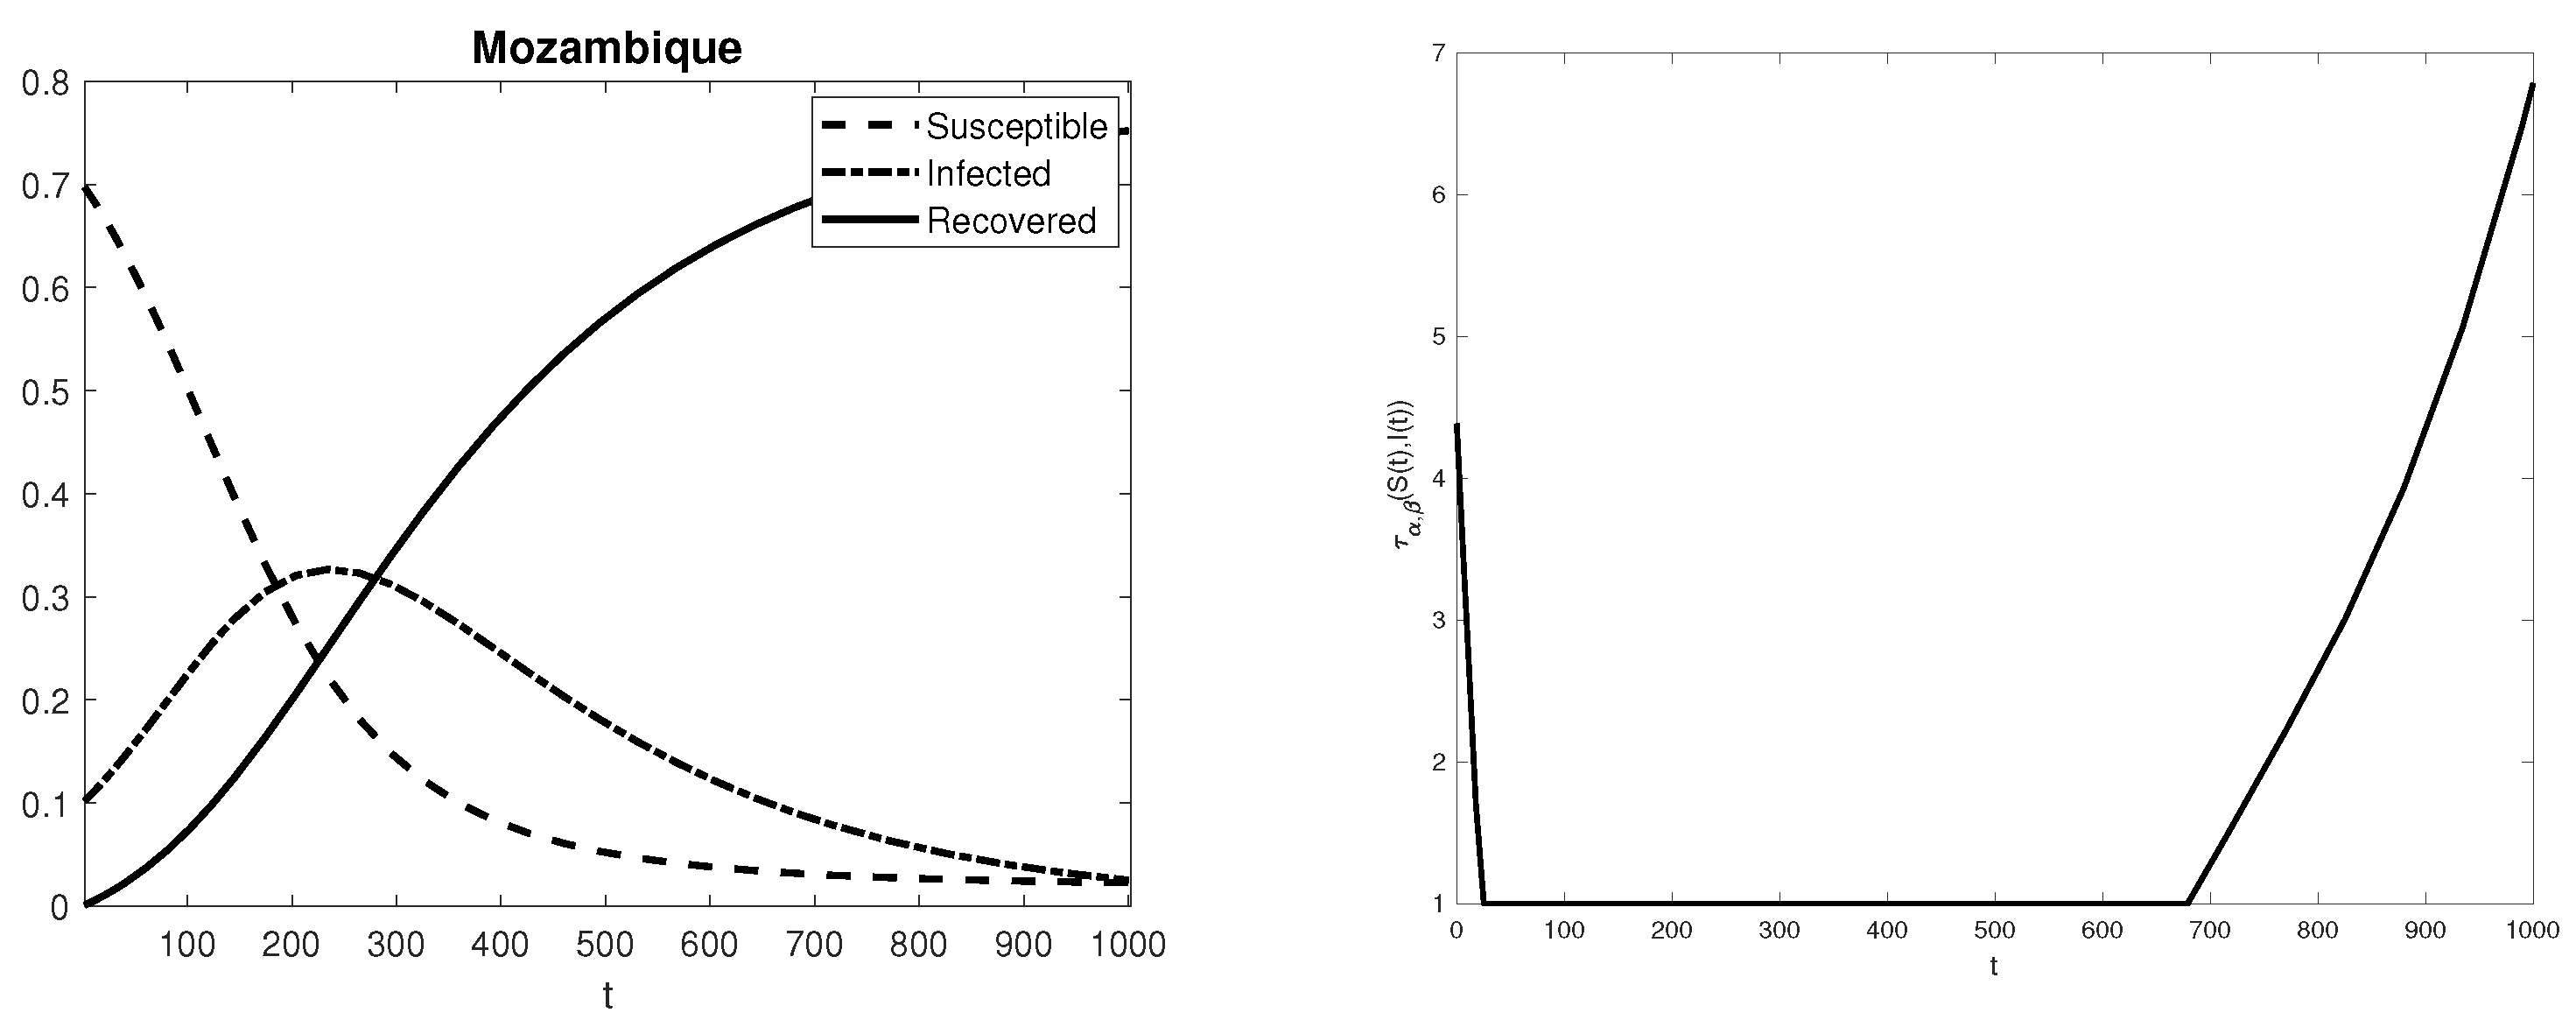
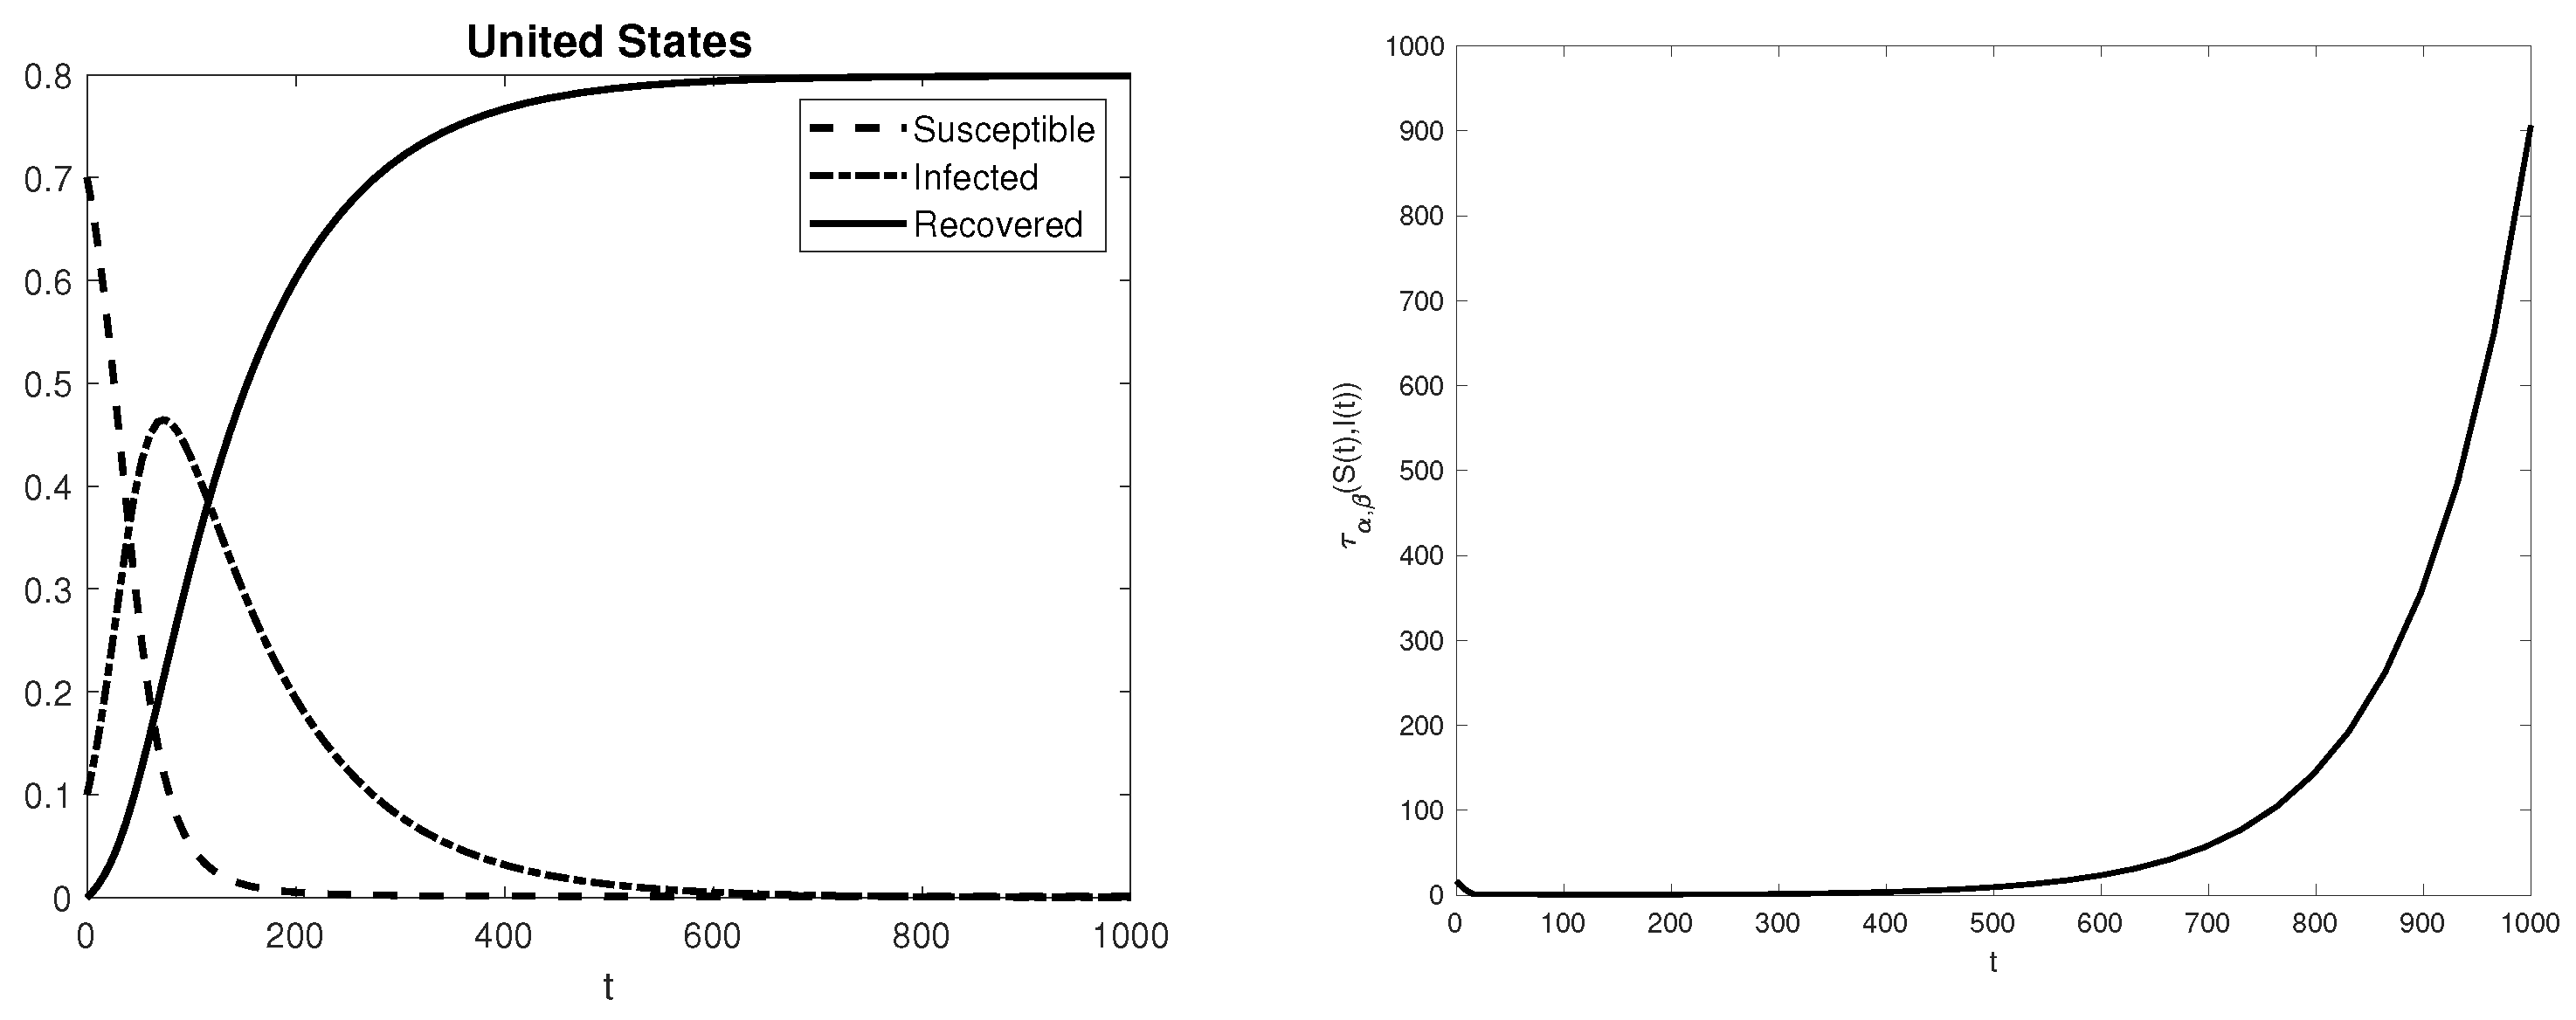
In this section, we aim to give numerical evidence of the arguments contained in the previous section, i.e., the spread of fake news is closely linked to the stiffness ratio of Equation (1). For each listed country, Figure 1, Figure 2, Figure 3, Figure 4, Figure 5, Figure 6, Figure 7 and Figure 8 show the solution of problem (1) in the interval [0,1000], computed by the standard Matlab built-in function ode15s, and the pattern of the ratio between the maximum and minimum moduli of the non-zero eigenvalues of the matrix
that corresponds to the Jacobian of the problem (1), frozen at time t. To some extent, we aim to check the evolution in time of the stiffness ratio .
Each figure confirms that the higher the stiffness ratio, as listed in Table 2, the faster the transit of fake news will be. In some countries, such as India or Mozambique, where the internet penetration index is small, the function grows much than in the other cases (corresponding to countries with higher internet penetration indices). As a consequence, smaller values of the stiffness ratio correspond to a slower achievement of the maximum number of infected people and, consequently, to a slower dispersion of fake news. The observed number of time units needed to achieve the maximum number of infected is listed in Table 3: one can observe that the number of time units is coherent with the stiffness ratio, so the smallest value is for France, while the largest is for Mozambique.
4. Conclusions
The analysis carried out in this paper is useful to give a measure, suggested by the stiffness ratio, of the speed of re-affirmation of the truth after the spread out of a fake news. In particular, the analysis suggests to use SIR models with high stiffness ratio to describe the diffusion of fake information when the country is exposed to a slower transit of fake news. Less stiff models are particularly suitable when the transit of fake news is slower and its survival time in the exposed population is higher. The employed model is the standard SIR system of differential Equation (1), but certainly more complex deterministic and stochastic models may be used in order to describe the diffusion of fake news as an epidemic phenomenon as, for instance, in [50,51,52,53,54,55,56,57,58]. Moreover, it would be worth investigating how to detect fake news through sentiment analysis of tweets as suggested by [59,60].
Author Contributions
Formal analysis, S.M.; Methodology, R.D., G.G. and B.P. All authors have read and agreed to the published version of the manuscript.
Funding
The authors D’Ambrosio, Giordano and Paternoster are members of GNCS-INDAM group. This work was supported by GNCS-INDAM project and by PRIN2017-MIUR project 2017JYCLSF “Structure preserving approximation of evolutionary problems”.
Data Availability Statement
Acknowledgments
The authors are thankful to the referees for their precious comments.
Conflicts of Interest
The authors declare no conflict of interest.
References
- Allen, J.; Howland, B.; Mobius, M.; Rothschild, D.; Watts, D.J. Evaluating the fake news problem at the scale of the information ecosystem. Sci. Adv. 2020, 6, eaay3539. [Google Scholar] [CrossRef] [PubMed] [Green Version]
- Berduygina, O.N.; Vladimirova, T.N.; Chernyaeva, E.V. Trends in the spread of fake news in mass media. Media Watch 2019, 10, 122–132. [Google Scholar] [CrossRef]
- Dentith, M.R.X. The Problem of Fake News. Public Reason. 2016, 8, 65–79. [Google Scholar]
- Gelfert, A. Fake News: A Definition. Inform. Log. 2018, 38, 84–117. [Google Scholar] [CrossRef]
- Guo, B.; Ding, Y.; Sun, Y.; Ma, S.; Li, K.; Yu, Z. The mass, fake news, and cognition security. Front. Comput. Sci. 2021, 15, 153806. [Google Scholar] [CrossRef]
- Guo, B.; Ding, Y.; Yao, L.; Liang, Y.; Yu, Z. The Future of False Information Detection on Social Media: New Perspectives and Trends. Acm Comput. Surv. 2020, 53, 3393880. [Google Scholar] [CrossRef]
- Kapantai, E.; Christopoulou, A.; Berberidis, C.; Peristeras, V. A systematic literature review on disinformation: Toward a unified taxonomical framework. New Media Soc. 2021, 23, 1301–1326. [Google Scholar] [CrossRef]
- Kelly, D. Evaluating the News: (Mis)Perceptions of Objectivity and Credibility. Political Behav. 2019, 41, 445–471. [Google Scholar] [CrossRef]
- O’Connor, C.; Weatherall, J.O. The Misinformation Age: How False Beliefs Spread; Yale University Press: New Haven, CT, USA, 2019. [Google Scholar]
- Peters, M.A.; Rider, S.; Hyvönen, M.; Besley, T. Post-Truth, Fake News: Viral Modernity Higher Education; Springer: Berlin/Heidelberg, Germany, 2018. [Google Scholar]
- Reyes-Menendez, A.; Saura, J.R.; Filipe, F. Figure 1: Evolution of searches about fake news and fake reviews. PeerJ Comput. Sci. 2019, 5. [Google Scholar] [CrossRef]
- Reyes-Menendez, A.; Saura, J.R.; Filipe, F. The importance of behavioral data to identify online fake reviews for tourism businesses: A systematic review. PeerJ Comput. Sci. 2019, 5, e219. [Google Scholar] [CrossRef] [Green Version]
- Shin, J.; Jian, L.; Driscoll, K.; Bar, F. The diffusion of misinformation on social media: Temporal pattern, message, and source. Comput. Hum. Behav. 2018, 83, 278–287. [Google Scholar] [CrossRef]
- Tandoc, E.C.; Lim, D.; Ling, R. Diffusion of disinformation: How social media users respond to fake news and why. Journalism 2020, 21, 381–398. [Google Scholar] [CrossRef]
- Tandoc, E.C. The facts of fake news: A research review. Sociol. Compass 2019, 13, e12724. [Google Scholar] [CrossRef]
- Zannettou, S.; Sirivianos, M.; Blackburn, J.; Kourtellis, N. The web of false information: Rumors, fake news, hoaxes, clickbait, and various other shenanigans. J. Data Inf. Qual. 2019, 11, 10. [Google Scholar] [CrossRef] [Green Version]
- Zhang, X.; Ghorbani, A.A. An overview of online fake news: Characterization, detection, and discussion. Inf. Process. Manag. 2020, 57, 102025. [Google Scholar] [CrossRef]
- Zhou, X.; Zafarani, R. A Survey of Fake News: Fundamental Theories, Detection Methods, and Opportunities. ACM Comput. Surv. 2020, 1, 3395046. [Google Scholar]
- Giordano, G.; Mottola, S.; Paternoster, B. A short review of some mathematical methods to detect fake news. Int. Circ. Syst. Signal Process 2020, 14, 255–265. [Google Scholar]
- Mottola, S. Las Fake News Como fenóMeno Social. Análisis lingüíStico y Poder Persuasivo de Bulos en Italiano y Español. Discurso Soc. 2021, 14, 683–706. [Google Scholar]
- Fan, D.; Jiang, G.P.; Song, Y.R.; Li, Y.W. Novel fake news spreading model with similarity on PSO-based networks. Phys. A 2020, 549, 124319. [Google Scholar] [CrossRef]
- Khurana, P.; Kumar, D. Sir Model for Fake News Spreading Through Whatsapp. In Proceedings of the 3rd International Conference on Internet of Things and Connected Technologies, Jaipur, India, 26–27 March 2018. [Google Scholar] [CrossRef]
- Lotito, Q.F.; Zanella, D.; Casari, P. Realistic Aspects of Simulation Models for Fake News Epidemics over Social Networks. Future Internet 2021, 13, 76. [Google Scholar] [CrossRef]
- Mahmoud, H. A model for the spreading of fake news. J. Appl. Prob. 2020, 57, 332–342. [Google Scholar] [CrossRef]
- Murayama, T.; Wakamiya, S.; Aramaki, E.; Kobayashi, R. Modeling the spread of fake news on Twitter. PLoS ONE 2021, 16, E0250419. [Google Scholar] [CrossRef] [PubMed]
- Reyes-Menendez, A.; Saura, J.R.; Martinez-Navalon, J.G. The impact of e-WOM on hotels management reputation: Exploring tripadvisor review credibility with the ELM model. IEEE Access 2019, 7, 68868–68877. [Google Scholar] [CrossRef]
- Zhao, Z.; Zhao, J.; Sano, Y.; Levy, O.; Takayasu, H.; Takayasu, M.; Li, D.; Wu, J.; Havlin, S. Fake news propagates differently from real news even at early stages of spreading. EPJ Data Sci. 2020, 9, 7. [Google Scholar] [CrossRef]
- Brody, D.C.; Meier, D.M. How to model fake news. arXiv 2018, arXiv:1809.00964. [Google Scholar]
- Brainard, J.; Hunter, P.R.; Hall, I.R. An agent-based model about the effects of fake news on a norovirus outbreak. Rev Epidemiol. Sante Publique 2020, 68, 99–107. [Google Scholar] [CrossRef] [Green Version]
- Kendall, D.G. Deterministic and stochastic epidemics in closed populations. In Proceedings of the Third Berkeley Symposium on Mathematical Statistics and Probability: Contributions to Biology and Problems of Health; University of California: Berkeley, CA, USA, 1956; Volume 4, pp. 149–165. [Google Scholar]
- Kermack, W.O.; McKendrick, A.G. A Contribution to the Mathematical Theory of Epidemics. R. Soc. 1927, 115, 700–721. [Google Scholar]
- Ross, R. Ronald, An application of the theory of probabilities to the study of a priori pathometry-Part I. R. Soc. 1916, 92, 204–230. [Google Scholar] [CrossRef] [Green Version]
- Ross, R.; Hudson, H. An application of the theory of probabilities to the study of a priori pathometry-Part II. R. Soc. 1917, 93, 212–225. [Google Scholar]
- Ross, R.; Hudson, H. An application of the theory of probabilities to the study of a priori pathometry-Part III. R. Soc. 1917, 89, 225–240. [Google Scholar]
- Diekmann, O.; Heesterbeek, H.; Britton, T. Mathematical Tools for Understanding Infectious Disease Dynamics; Princeton University Press: Princeton, NJ, USA, 2012. [Google Scholar]
- Elston, R.C.; Johnson, W.D. Basic Biostatistics for Geneticists and Epidemiologists: A Practical Approach; Wiley: Hoboken, NJ, USA, 2008. [Google Scholar]
- Epstein, J.M. Nonlinear Dynamics, Mathematical Biology, and Social Science; CRC Press: Boca Raton, FL, USA, 2018. [Google Scholar]
- Ma, Z.; Li, J. Dynamical Modeling and Analysis of Epidemics; World Scientific: Singapore, 2009. [Google Scholar]
- Malchow, H.; Petrovskii, S.V.; Venturino, E. Spatiotemporal Patterns in Ecology and Epidemiology: Theory, Models, and Simulation; CRC Press: Boca Raton, FL, USA, 2007. [Google Scholar]
- Brauer, F.; Kribs, C. Dynamical Systems for Biological Modeling: An Introduction; CRC Press: Boca Raton, FL, USA, 2015. [Google Scholar]
- Chowell, G.; Hyman, J.M. Mathematical and Statistical Modeling for Emerging and Re-Emerging Infectious Diseases; Springer: Berlin/Heidelberg, Germany, 2016. [Google Scholar]
- Chowell, G.; Hyman, J.M.; Bettencourt, L.M.A.; Castillo-Chavez, C. Mathematical and Statistical Estimation Approaches in Epidemiology; Springer: Berlin/Heidelberg, Germany, 2009. [Google Scholar]
- Deters, J.; Aguiar, I.P.; Feuerborn, J. The Mathematics of Gossip. Codee J. 2019, 12, 7. [Google Scholar] [CrossRef]
- Shrivastava, G.; Kumar, P.; Ojha, R.P.; Srivastava, P.K.; Mohan, S.; Srivastava, G. Defensive Modeling of Fake News Through Online Social Networks. IEEE Trans. Comput. Soc. Syst. 2020, 7, 1159–1167. [Google Scholar] [CrossRef]
- United Nations Development Programme, Human Development Data Center. Available online: http://hdr.undp.org/en/data (accessed on 28 August 2021).
- The Ji Village News, Mathematical Modeling of Fake News. Available online: https://www.haidongji.com/2018/07/23/mathematical-modeling-of-fake-news/ (accessed on 28 August 2021).
- Wikipedia, List of Countries by Number of Internet Users. Available online: https://en.wikipedia.org/wiki/List_of_countries_by_number_of_Internet_users (accessed on 28 August 2021).
- Soroush, V.; Deb, R.; Sinan, A. The spread of true and false news online. Science 2018, 359, 1146–1151. [Google Scholar]
- Lambert, J.D. Numerical Methods for Ordinary Differential Systems; Wiley: New York, NY, USA, 1992. [Google Scholar]
- Hutzenthaler, M.; Jentzen, A. Numerical approximations of stochastic differential equations with non-globally Lipschitz continuous coefficients. Mem. Am. Math. Soc. 2015, 236. [Google Scholar] [CrossRef]
- Aslam, N.; Alotaibi, I.U.K.F.S.; Aldaej, L.M.; Aldubaikil, A.K. Fake Detect: A Deep Learning Ensemble Model for Fake News Detection. Complexity 2021, 2021, 5557784. [Google Scholar] [CrossRef]
- Brugnano, L.; Iavernaro, F.; Zanzottera, P. A multiregional extension of the SIR model, with application to the COVID-19 spread in Italy. Math. Meth. Appl. Sci. 2021, 44, 4414–4427. [Google Scholar] [CrossRef] [PubMed]
- Burrage, K.; Cardone, A.; D’Ambrosio, R.; Paternoster, B. Numerical solution of time fractional diffusion systems. Appl. Numer. Math. 2017, 116, 82–94. [Google Scholar] [CrossRef] [Green Version]
- Conte, D.; D’Ambrosio, R.; Paternoster, B. Improved theta-methods for stochastic Volterra integral equations. Commun. Nonlinear Sci. Numer. Simul. 2021, 93, 105528. [Google Scholar] [CrossRef]
- D’Ambrosio, R.; Moccaldi, M.; Paternoster, B. Adapted numerical methods for advection-reaction-diffusion problems generating periodic wavefronts. Comput. Math. Appl. 2017, 74, 1029–1042. [Google Scholar] [CrossRef]
- D’Ambrosio, R.; Moccaldi, M.; Paternoster, B. Numerical preservation of long-term dynamics by stochastic two-step methods. Discr. Cont. Dyn. Syst. B 2018, 23, 2763–2773. [Google Scholar] [CrossRef] [Green Version]
- D’Ambrosio, R.; Scalone, C. On the numerical structure preservation of nonlinear damped stochastic oscillators. Numer. Algorithms 2021, 86, 933–952. [Google Scholar] [CrossRef]
- D’Ambrosio, R.; Scalone, C. Filon quadrature for stochastic oscillators driven by time-varying forces. Appl. Numer. Math. 2021, 169, 21–31. [Google Scholar] [CrossRef]
- Reyes-Menendez, A.; Saura, J.R.; Filipe, F. Marketing challenges in the MeToo era: Gaining business insights using an exploratory sentiment analysis. Heliyon 2020, 6, e03626. [Google Scholar] [CrossRef] [PubMed]
- Reyes-Menendez, A.; Saura, J.R.; Alvarez-Alonso, C. Understanding World Environment-Day user opinions in Twitter: A topic-based sentiment analysis approach. Int. J. Environ. Res. Public Health 2018, 15, 2537. [Google Scholar] [CrossRef] [Green Version]
Figure 1.
Solution to the SIR model (1), with initial value given by the vector (4), for Australia (left) and corresponding pattern of (right).

Figure 2.
Solution to the SIR model (1), with initial value given by the vector (4), for Brazil (left) and corresponding pattern of (right).

Figure 3.
Solution to the SIR model (1), with initial value given by the vector (4), for France (left) aand corresponding pattern of (right).

Figure 4.
Solution to the SIR model (1), with initial value given by the vector (4), for India (left) and corresponding pattern of (right).

Figure 5.
Solution to the SIR model (1), with initial value given by the vector (4), for Italy (left) and corresponding pattern of (right).

Figure 6.
Solution to the SIR model (1), with initial value given by the vector (4), for Mexico (left) and corresponding pattern of (right).

Figure 7.
Solution to the SIR model (1), with initial value given by the vector (4), for Mozambique (left) and corresponding pattern of (right).

Figure 8.
Solution to the SIR model (1), with initial value given by the vector (4), for United States (left) and corresponding pattern of (right).


Table 1.
Values of the constants , , for France, India, Italy, Mexico and the United States, referring to 2019.
Table 1.
Values of the constants , , for France, India, Italy, Mexico and the United States, referring to 2019.
| Australia | 0.009 | 0.087 |
| Brazil | 0.008 | 0.072 |
| France | 0.009 | 0.089 |
| India | 0.006 | 0.035 |
| Italy | 0.009 | 0.061 |
| Mexico | 0.008 | 0.064 |
| Mozambique | 0.005 | 0.021 |
| United States | 0.009 | 0.075 |
Table 2.
Values of the stiffness ratios (3) in France, India, Italy, Mexico and the United States, referring to 2019, assuming the vector (4) as initial point.
| Australia | 20.03 |
| Brazil | 20.85 |
| France | 23.07 |
| India | 8.38 |
| Italy | 12.35 |
| Mexico | 17.13 |
| Mozambique | 4.39 |
| United States | 17.00 |
Table 3.
Number of time units required to reach the maximum of infected in France, India, Italy, Mexico and the United States, referring to 2019.
Table 3.
Number of time units required to reach the maximum of infected in France, India, Italy, Mexico and the United States, referring to 2019.
| Number of Time Units | |
|---|---|
| Australia | 66.15 |
| Brazil | 77.00 |
| France | 61.16 |
| India | 145.75 |
| Italy | 88.90 |
| Mexico | 87.02 |
| Mozambique | 234.40 |
| United States | 74.05 |
Publisher’s Note: MDPI stays neutral with regard to jurisdictional claims in published maps and institutional affiliations. |
© 2021 by the authors. Licensee MDPI, Basel, Switzerland. This article is an open access article distributed under the terms and conditions of the Creative Commons Attribution (CC BY) license (https://creativecommons.org/licenses/by/4.0/).
Share and Cite
MDPI and ACS Style
D’Ambrosio, R.; Giordano, G.; Mottola, S.; Paternoster, B. Stiffness Analysis to Predict the Spread Out of Fake Information. Future Internet 2021, 13, 222. https://doi.org/10.3390/fi13090222
AMA Style
D’Ambrosio R, Giordano G, Mottola S, Paternoster B. Stiffness Analysis to Predict the Spread Out of Fake Information. Future Internet. 2021; 13(9):222. https://doi.org/10.3390/fi13090222
Chicago/Turabian StyleD’Ambrosio, Raffaele, Giuseppe Giordano, Serena Mottola, and Beatrice Paternoster. 2021. "Stiffness Analysis to Predict the Spread Out of Fake Information" Future Internet 13, no. 9: 222. https://doi.org/10.3390/fi13090222
Note that from the first issue of 2016, this journal uses article numbers instead of page numbers. See further details here.